antibiotics from aquatic-derived actinomycete bacteria
TRANSCRIPT

Antibiotics from Aquatic-Derived Actinomycete Bacteria that Inhibit M. tuberculosis.
BY
MICHAEL W. MULLOWNEY
B.F.A., Arizona State University, 2002
Post-Baccalaureate, DePaul University, 2009-2012
DISSERTATION
Submitted as fulfillment of the requirements
for the degree of Doctor of Philosophy in Pharmacognosy
in the Graduate College of the
University of Illinois at Chicago, 2016
Chicago, Illinois
Defense Committee:
Brian T. Murphy, Medicinal Chemistry and Pharmacognosy, Chair and Advisor
Scott G. Franzblau, Medicinal Chemistry and Pharmacognosy and the Institute for
Tuberculosis Research, Co-advisor
Alexander Mankin, Center for Biomolecular Sciences
Jimmy Orjala, Medicinal Chemistry and Pharmacognosy, Director of Graduate Studies
Duncan Wardrop, Chemistry

ii
DEDICATION
This is dedicated to my kids. Always ask questions and push
yourself to do difficult, intimidating things.
This is also dedicated to my amazing wife Annie, my parents, my
grandparents, and the rest of my family. I was able to accomplish
this because you have believed that I could accomplish anything.
Thank you.
Lastly, this is dedicated to future generations that this work is
intended to serve. May you be in good health and always recognize
the rarity and irreplaceable value of our environment that justifies
its preservation.
iii
ACKNOWLEDGMENTS
Foremost, I would like to show appreciation to my advisor, Brian T. Murphy, for accepting
me into his lab, setting me up for success, and providing for an incredibly exciting, educational,
and overall the most enriching experience of my life. I would also like to thank the other members
of my dissertation committee, Scott G. Franzblau, Alexander Mankin, Jimmy Orjala, and Duncan
Wardrop, for their support and insight. Thanks to Russell L. Cuhel of the R/V Neeskay from the
School of Freshwater Sciences at the University of Wisconsin–Milwaukee for collections in Lake
Michigan that were the foundation for the discovery of diazaquinomycins H and J in Chaper 2.
Thanks to Van Pham Cuong and the staff at VAST for assistance and collaboration in collecting
samples from the East Sea of Vietnam that resulted in the identification of compounds in Appendix
A1.2 and discovery of the diterpene in Chapter 4. I would also like to express gratitude to Sesselja
Ómarsdóttir of Háskóli Íslands for the collaborative field collections that resulted in the
experiments described in Appendix A1.3. Thanks also to Ben Ramirez and David Lankin for
assistance in acquiring and analyzing NMR spectra and Gerd Prehna for support and assistance in
acquiring circular dichroism spectra.
In the summers of 2014 and 2015, I was fortunate enough to venture out into remote areas
of the Icelandic aquatic environment for field collections by SCUBA and aboard the Icelandic
Coast Guard vessels Thor and Ægir. For the opportunity, I would like to thank my mentor Brian
Murphy, Sesselja Ómarsdóttir, the Icelandic Coast Guard, and funding from the National Center
for Complementary and Integrative Health (NCCIH) and the American Foundation for
Pharmaceutical Education (AFPE). In addition, I would like to thank Eydís Einarsdóttir, Erlendur
Bogasson, Sævör Dagný Erlendsdóttir, Gunnar Egill Sævarsson, Maria Sofia Costa, and Ana
Margarida Costa for their companionship on those trips.

iv
Others who were supportive during my graduate studies were within the Department of
Medicinal Chemistry and Pharmacognosy in the College of Pharmacy at UIC, including Andrew
Newsome, Dejan Nikolic, Caleb Neinow, and Monika Lysakowska of the van Breemen and RRC
mass spectrometry labs; James Paul Marks, Kolya Aleksashin, Teresa Szal of the Mankin lab for
collaborations and research guidance; Larry Klein and Michael Tufano in the ITR for
diazaquinomycin A synthesis and medicinal chemistry guidance; Jeff Anderson and Sura
Mulugeta in the ITR for mycobacterial molecular biology guidance and collaboration; Chang Hwa
Hwang, Baojie Wan, Yuehong Wang, Edyta Grzelak, and Sang Hyun Cho in the ITR for TB
bioassay screening; Eoghainín O hainmhire and Wei-Lun Chen of the Burdette lab for cytotoxicity
screening; Laura Sanchez for guidance; the Center of Biomolecular Sciences, especially members
of the Federle, Burdette, Sodhi, Lee, Orjala, Mankin, Eustaquio, and Johnson Labs for being good
neighbors; and Murphy Lab members Urszula Tanouye, Skylar Carlson, Vanessa Nepomuceno,
Chase Clark, Hiyoung Kim, Collin McCafferty, Brian Kim, Antonio Hernandez, Xiomei Wei,
Jeong Ho Lee, Maryam Elfeki, Sofia Maria Costa, Jhewelle Fitz-Henley, Anam Shaikh, and Mark
Sadek.
This work is supported by the Office of the Director, National Institutes of Health (OD)
and National Center for Complementary and Integrative Health (NCCIH) (5T32AT007533)
through a T32 pre-doctoral training fellowship, a pre-doctoral fellowship from the American
Foundation for Pharmaceutical Education (AFPE), a PhD scholarship from the International
Association for Great Lakes Research (IAGLR), and a W. E. van Doren scholarship from the
Department of Medicinal Chemistry and Pharmacognosy in the College of Pharamcy at UIC.
MWM

v
CONTRIBUTIONS OF AUTHORS
Chapter 1 is an original work by Michael Mullowney with editing provided by Dr. Brian
T. Murphy. Chapter 2, sections 2.1 through 2.2.6, 2.3.1 through 2.3.10 and 2.4 are from a
manuscript published in ACS Infectious Diseases in 2015 with some minor additions. Thomas
Speltz assisted with the large-scale fermentation of strain B026. Andrew Newsome of the van
Breemen lab provided guidance and critical insight on the structure elucidation of the novel
diazaquinomycin analogs. Xiaomei Wei initially identified the presence of what were eventually
identified as novel diazaquinomycin analogs in marine and freshwater actinomycete strains in the
Murphy lab. Chang Hwa Hwang, Baojie Wan, Edyta Grzelak, and Sang Hyun Cho performed anti-
tuberculosis bioassays, including the thymidine supplementation assay at the Institute for
Tuberculosis Research at UIC directed by Scott G. Franzblau with the consultation and manuscript
proofing of both Scott G. Franzblau and Sang Hyun Cho. Nanthida Joy Barranis screened DAQA
against the Bacillus strains in the lab of Hyunwoo Lee at the University of Illinois at Chicago,
Skylar Carlson performed the bioassay of DAQA against Streptococcus strains in the Murphy lab,
and Siyun Liao screened against the remaining microbial strains in the lab of Larry Danziger. Wei-
Lun Chen and Eoghainín Ó hAinmhire performed the cancer cell line panel bioassays in the lab of
Joanna Burdette. Kalyanaraman Krishnamoorthy and John White performed the thymidylate
synthase enzyme inhibition assay in the lab of Pradipsinh K. Rathod at the University of
Washington, Rachel Kokoczka screened DAQA against the M. tuberculosis OE mutants in the lab
of Tanya Parish at the Infectious Disease Research Institute (IDRI). Principal investigator Brian
T. Murphy advised throughout, edited drafts, and was the corresponding author on the publication.
Sections added following publication include synthesis, biocatalysis, mechanism of action, and in
vivo studies. Larry Klein and Mike Tufano performed total synthesis of diazaquinomycins and also
provided guidance in diazaquinomycin analog generation. Christian Willrodt of the Andreas
vi
Schmid lab at The Helmholtz-Centre for Environmental Research GmbH – UFZ in Leipzig,
Germany provided plasmids and guidance for whole-cell biocatalysis while Kolya Aleksashin and
Teresa Szal of the Aleksander Mankin lab assisted in generating the E. coli transformants for that
experiment. Anthony Goering assisted in LCMS analysis of biocatalysis extracts in the Neil
Kelleher lab at Northwestern University. Sang Hyun Cho performed the thymidine and thymine
supplementation assays and additional M. tuberculosis mutant screenings. Edyta Grzelak
performed screening against M. tuberculosis mc27000. Helena Boshoff in the Clifton Barry lab at
the NIH performed M. tuberculosis mutant screenings, transcription profiling, and the ATP assay
as well as provided invaluable insight into the analysis of mechanism of action data. Vinayak Singh
of the Valerie Mizrahi lab at The University of Cape Town performed mutant screenings and the
uracil supplementation and synergy assays. The analysis of spectral data, the characterization of
novel diazaquinomycin analogs, semi-synthesis, whole-cell biocatalysis, screening of
environmental actinomycetes, and mechanism of action data analysis was completed by Michael
Mullowney. Chapter 3 is a manuscript published in Marine Drugs in 2014 with minor
modifications. The bioassays and follow-up mechanism of action studies are the work of
Eoghainín Ó hAinmhire in the laboratory of Dr. Joanna Burdette. Anam Shaikh provided technical
assistance in the prep-scale chromatographic separation of the reported compounds, Xiaomei Wei
initially identified the presence of novel diazaquinomycin analogs in strain F001, Urszula Tanouye
provided technical assistance in the isolation of the active Streptomyces strain from the
environmental sample. Dr. Bernard Santarsiero preformed X-ray experiments and analysis on the
co-crystallized DAQF and DAQG. Brian Murphy advised throughout, edited drafts, and was the
corresponding author on the publication. The analysis of spectral data and the characterization of
novel diazaquinomycin analogs was completed by Michael Mullowney. Chapter 4 is a manuscript
published in Marine Drugs in 2015. Van Coung Pham was the lead in the expedition that resulted
vii
in the environmental sample from which strain G039 was isolated and he proofed the final version
of the manuscript. The MABA and LORA assays were performed by Baojie Wan and Sang Hyun
Cho at the Institute for Tuberculosis Research at UIC directed by Scott G. Franzblau while
cytotoxicity bioassays are the work of Eoghainín Ó hAinmhire in the laboratory of Dr. Joanna
Burdette. Urszula Tanouye provided technical assistance in the isolation of the producing
Micromonospora strain from the environmental sample. Brian Murphy advised throughout, edited
drafts, and was the corresponding author on the publication. Analysis of spectral data and
characterization of the novel diterpene and the angucyclines was completed by Michael
Mullowney. Chapter 5 is an original work by Michael Mullowney discussing the future direction
of the natural products field. Appendix I is a summary of selected projects by Michael Mullowney
involving dereplication of known compounds in the laboratory of Brian T. Murphy in collaboration
with the Institute for Tuberculosis Research (ITR) and the lab of Joanna Burdette. All
chromatography, NMR spectroscopy, mass spectrometry, and structure elucidation experiments
were executed by Michael Mullowney.

viii
TABLE OF CONTENTS
CHAPTER PAGE
ACKNOWLEDGMENTS ............................................................................................................. iii
CONTRIBUTIONS OF AUTHORS ...............................................................................................v
LIST OF TABLES ....................................................................................................................... xiii
LIST OF FIGURES ..................................................................................................................... xiv
LIST OF ABBREVIATIONS .................................................................................................... xviii
SUMMARY ............................................................................................................................... xxiv
1. INTRODUCTION .......................................................................................................................1
1.1 The ongoing arms race to combat Mycobacterium tuberculosis infection ..........................1
1.1.1 History of the deadliest bacterial human pathogen ......................................................1
1.1.2 Early treatments for M. tuberculosis infection .............................................................1
1.1.3 First and second line anti-tuberculosis drugs and leads currently in clinical trials. .....2
1.1.4 Modes of action for M. tuberculosis inhibition ............................................................5
1.1.5 The current global burden of M. tuberculosis ..............................................................5
1.1.6 Future outlook ..............................................................................................................6
1.2 Natural products as drug therapies .......................................................................................7
1.2.1 The origins of natural products drug discovery ............................................................7
1.2.2 Terrestrial actinomycete bacteria as prolific providers of drug leads ..........................9
1.2.3 Drug-lead discovery from the marine environment .....................................................9
1.2.4 Freshwater-derived actinomycetes as a source of novel drug leads ...........................10
1.3 Hypothesis..........................................................................................................................11
2. DIAZA-ANTHRACENE ANTIBIOTICS FROM A FRESHWATER-DERIVED
ACTINOMYCETE WITH SELECTIVE ANTIBACTERIAL ACTIVITY TOWARD
M. TUBERCULOSIS .................................................................................................................13
2.1 Introduction ........................................................................................................................13
2.2 Results and discussion .......................................................................................................13
2.2.1 Isolation and identification of diazaquinomycins H (1) and J (2) ..............................13
2.2.2 Structure elucidation of diazaquinomycins H (1) and J (2) ........................................14

ix
2.2.3 In vitro evaluation of diazaquinomycins H (1), J (2), and A (1) in TB whole-cell
assays ..........................................................................................................................17
2.2.4 Cytotoxicity evaluation of diazaquinomycins H (1), J (2), and A (1). .......................19
2.2.5 Antibiotic specificity of diazaquinomycin A (3) toward M. tuberculosis ..................19
2.2.6 Caco-2 permeability and liver microsome stability of diazaquinomycin A (3) .........22
2.2.7 In vivo evaluation of diazaquinomycin A (3) .............................................................22
2.2.8 Optimization of diazaquinomycin A (3) for increased solubility and potency against
M. tuberculosis ...........................................................................................................23
2.2.9 Studies toward elucidation of the diazaquinomycin mechanism of action ................26
2.2.9.1 diazaquinomycin A (3) activity against a library of M. tuberculosis
overexpression mutants .......................................................................................29
2.2.9.2 M. tuberculosis transcription profile following diazaquinomycin A (3)
treatment .............................................................................................................31
2.2.9.3 Institute for Tuberculosis Research (ITR) clofazimine-resistant mutants are
cross-resistant to diazaquinomycin A (3) ...........................................................32
2.2.9.4 Diazaquinomycin A (3) activity against M. tuberculosis strains with efflux
regulator, pyrimidine biosynthesis, and F420 biosynthesis gene mutations .........34
2.3 Methods..............................................................................................................................37
2.3.1 General experimental procedures for the isolation and characterization of
diazaquinomycins H (1) and J (2) ..............................................................................37
2.3.2 Collection and identification of actinomycete strain B026 ........................................38
2.3.3 Fermentation and extraction .......................................................................................38
2.3.4 Isolation and characterization of diazaquinomycin H (1) and diazaquinomycin J (2)
from strain B026 fermentation broth ..........................................................................38
2.3.5 M. tuberculosis fermentation for determination of minimum inhibitory concentration
(MIC). .........................................................................................................................40
2.3.6 Low oxygen recovery assay (LORA) .........................................................................41
2.3.7 Determination of cytotoxicity ....................................................................................41
2.3.8 Minimum inhibitory concentration (MIC) determination against drug-resistant M.
tuberculosis isolates ...................................................................................................42
2.3.9 Minimum inhibitory concentration (MIC) determination against non-tuberculous
mycobacteria (NTM) ..................................................................................................43

x
2.3.10 Minimum inhibitory concentration (MIC) determination against Gram-positive and
Gram-negative bacteria ..............................................................................................44
2.3.11 Characterization of diazaquinomycin A (3) in vivo ...................................................45
2.3.12 Synthesis of diazaquinomycin derivatives .................................................................48
2.3.13 Attempt at whole-cell biocatalysis of hydroxy-diazaquinomycin A analogs .............49
2.3.14 Cell-free ThyA and ThyX enzyme inhibition assay ...................................................50
2.3.15 In vitro screening of diazaquinomycin A (3) against M. tuberculosis overexpression
(OE) mutants. .............................................................................................................52
2.3.16 Transcription profile of M. tuberculosis following in vitro treatment with
diazaquinomycin A (3) ...............................................................................................53
2.3.17 Minimum inhibitory concentration (MIC) determination against M. tuberculosis
strains grown in varying media conditions .................................................................53
2.4 Conclusions ........................................................................................................................54
2.5 Future directions ................................................................................................................56
3. DIAZAQUINOMYCINs E–G, NOVEL DIAZA-ANTHRACENE ANALOGS FROM A
MARINE-DERIVED STREPTOMYCES SP. ............................................................................59
3.1 Introduction ........................................................................................................................59
3.2 Results and discussion. ......................................................................................................59
3.2.1 Structure elucidation of diazaquinomycins E (12), F (13), and G (14) ...................59
3.2.2 Diazaquinomycin A (3) induces DNA damage, cell cycle arrest, and apoptosis
through cleaved-PARP........................................................................................65
3.3 Methods..............................................................................................................................69
3.3.1 General experimental procedures ...............................................................................69
3.3.2 Selection of actinomycete strain F001 for further investigation ................................70
3.3.3 Fermentation and extraction .......................................................................................70
3.3.4 Isolation and characterization of diazaquinomycins E (12), F (13), and G (14). .......71
3.3.5 OVCAR5 cytotoxicity assay ......................................................................................72
3.3.6 Western blot analysis ..................................................................................................73
3.3.7 Immunofluorescence ..................................................................................................73
3.4 Conclusions ........................................................................................................................74

xi
4. A PIMARANE DITERPENE AND CYTOTOXIC ANGUCYCLINES FROM A MARINE-
DERIVED MICROMONOSPORA SP. IN VIETNAM’S EAST SEA ......................................76
4.1. Introduction ........................................................................................................................76
4.2. Results and discussion .......................................................................................................78
4.2.1 Structure elucidation of isopimara-2-one-3-ol-8,15-diene (15) and
lagumycin B (16) ........................................................................................................78
4.2.2 Antibiotic activity evaluation of isopimara-2-one-3-ol-8,15-diene (15), lagumycin B
(16), dehydrorabelomycin (17), phenanthroviridone (18), and WS 5995 A (19)
against M. tuberculosis in the MABA. .......................................................................84
4.2.3 Cytotoxicity evaluation of isopimara-2-one-3-ol-8,15-diene (15), lagumycin B (16),
dehydrorabelomycin (17), phenanthroviridone (18), and WS 5995 A (19). ..............85
4.3 Methods..............................................................................................................................87
4.3.1 General experimental procedures ...............................................................................87
4.3.2 Collection and identification of actinomycete strain G039 ........................................88
4.3.3 Fermentation and extraction .......................................................................................88
4.3.4 Isolation and characterization of isopimara-2-one-3-ol-8,15-diene (15),
lagumycin B (16) ........................................................................................................89
4.3.5 OVCAR4, Kuramochi, MOSE, MOE, and Vero cytotoxicity assays ........................90
4.4 Conclusions ........................................................................................................................90
5. CONCLUSIONS .......................................................................................................................92
CITED LITERATURE ..................................................................................................................96
APPENDIX ..................................................................................................................................109
A1. Dereplication of known compounds from aquatic actinomycete strains .............................109
A1.1 Introduction ......................................................................................................................109
A1.2 Antibiotics from Vietnam strain G016 that inhibit TB ....................................................109
A1.3 Identification of tirandamycins from Icelandic sediment-derived strain K123 ...............115
A1.4 CITED LITERATURE ....................................................................................................125
A2. SUPPLEMENTAL INFORMATION ..................................................................................126
A2.1. Supplemental information for: DIAZA-ANTHRACENE ANTIBIOTICS FROM A
FRESHWATER-DERIVED ACTINOMYCETE WITH SELECTIVE
ANTIBACTERIAL ACTIVITY TOWARD M. TUBERCULOSIS ................................126

xii
A.2.1.1 DARTS assay for identification of the molecular target of diazaquinomycin A in
M. tuberculosis cell lysate. .......................................................................................126
A2.1.2 Investigation of the ability of diazaquinomycin A (3) to inhibit cellular
respiration .................................................................................................................126
A2.1.3 Antibiotic activity of diazaquinomycin A (3) against a panel of environmental
actinomycete bacteria ...............................................................................................128
A2.1.4 CITED LITERATURE .............................................................................................131
A2.1.5 Reference spectra and figures ...................................................................................132
A2.2 Reference spectra and figures for: DIAZAQUINOMYCINS E–G, NOVEL DIAZA-
ANTHRACENE ANALOGS FROM A MARINE-DERIVED STREPTOMYCES SP. ..160
A2.3 Reference spectra and figures for: A PIMARANE DITERPENE AND CYTOTOXIC
ANGUCYCLINES FROM A MARINE-DERIVED MICROMONOSPORA SP. IN
VIETNAM’S EAST SEA ................................................................................................178
A2.4 CITED LITERATURE ....................................................................................................205
VITAE………………………………………………………………………………………......208

xiii
LIST OF TABLES
TABLE PAGE
Table 1. The most recent TB drugs in clinical trials ..................................................................5
Table 2. 1H and 13C NMR chemical shift data (CDCl3–1% CF3CO2D) of 1 and 2 ..................16
Table 3. In vitro activity of 3 against a drug-resistant M. tuberculosis panel ..........................20
Table 4. Antimicrobial spectrum of 3 .......................................................................................21
Table 5. In vitro anti-TB activity of 4-11 .................................................................................25
Table 6. Resistance of Rv0953c, Rv2486, and Rv3500c M. tuberculosis OE mutants to 3 ....30
Table 7. Effect of iron concentration and nutrient composition on anti-TB activity of 3 ........33
Table 8. Genes and their descriptions from DAQA-resistant strains rCLF1 and rCLF4 .........34
Table 9. Susceptibility of M. tuberculosis mutant strains to 3 .................................................35
Table 10. 1H and 13C NMR data (CDCl3/1% CF3CO2D) of 12 ..................................................62
Table 11. 1H and 13C NMR data (CDCl3) of 15 .........................................................................78
Table 12. 1H and 13C NMR data (CDCl3) of 16 .........................................................................82
Table 13. In vitro anti-TB activity of 15-19 ...............................................................................84
Table 14. In vitro cytotoxicity of 15-19 .....................................................................................85
Table A1. Antibiotic and cytotoxic activities of 20-22 .............................................................112
Table A2. Anti-TB activities of K123-F3/4 and subfractions ...................................................119
Table A3. In vitro anti-TB activity and cytotoxicity of K123 fractions ....................................122
Table A4. Evaluation of the activity of 3 against environmental actinomycete bacteria ..........129
Table A5. 1H and partial 13C NMR data of 13 and 14 in CDCl3 - 1% CF3CO2D .....................169
Table A6. 1H NMR data (600 MHz) of 15 in CDCl3 and C6D6 ................................................183

xiv
LIST OF FIGURES
FIGURE PAGE
Figure 1. Current first and second line anti-TB drugs .................................................................3
Figure 2. Origins of all approved drugs by percent from 1981−2014 .........................................8
Figure 3. Structures of diazaquinomycins H (1), J (2), and A (3) .............................................17
Figure 4. Key 2D NMR Correlations of 1 and 2 .......................................................................17
Figure 5. Structures of tetramethyl-diazaquinomycin (4) and
bis-normethyl-diazaquinomycin A (5) .......................................................................23
Figure 6. Synthesis of α-substituted and O-methylated diazaquinomycin analogs ...................24
Figure 7. Synthesis of 7 and 8 ....................................................................................................25
Figure 8. Summary of experiments performed to determine DAQA mechanisms of action ....28
Figure 9. Transcription profile of M. tuberculosis following treatment with 3 .........................31
Figure 10. Structures of diazaquinomycins E (12), F (13), G (14), and A (3) ............................60
Figure 11. Key 2D NMR correlations of 12 ................................................................................61
Figure 12. 1D-TOCSY correlations of 12 ...................................................................................63
Figure 13. Co-crystal structure of 13 and 14 ...............................................................................64
Figure 14. Dose response analysis of 12 and 3 in OVCAR5 cells ..............................................66
Figure 15. Compound 3 induces cell cycle arrest followed by apoptosis ....................................67
Figure 16. Compound 3 induces DNA damage in OVCAR5 cells .............................................68
Figure 17. Structures of compounds 15-19 ..................................................................................79
Figure 18. Key 2D NMR correlations of 15 and 16 ....................................................................80
Figure A1. G016 source sediment location near He Long Bay, Cát Bà, Vietnam .....................110
Figure A2. HPLC-UV chromatogram of G016-F1 with UV profiles of 20-22 ..........................111
Figure A3. 1H NMR spectrum (600 MHz) of 20 in CDCl3 ........................................................113
Figure A4. 1H NMR spectrum (600 MHz) of 21 in CDCl3 ........................................................114
Figure A5. 1H NMR spectrum (600 MHz) of 22 in CDCl3 ........................................................115
Figure A6. Representative tirandamycin UV profile ..................................................................116
Figure A7. Structures of 23, 24, and streptolydigin ...................................................................117
Figure A8. 1H NMR spectrum (600 MHz) of 23 in CDCl3 ........................................................118

xv
Figure A9. 1H NMR spectrum (600 MHz) of 24 in CDCl3 ........................................................119
Figure A10. K123-F3/4 UV and MS chromatograms with ACN organic mobile phase .............120
Figure A11. K123-F3/4 UV and MS chromatograms with MeOH organic mobile phase ..........121
Figure A12. Selected ion chromatogram of K123-F3/4 MeOH W1 ...........................................122
Figure A13. Representative ion pattern for K123-F3/4 MeOH W1 selected ion peaks ..............123
Figure A14. 1H NMR spectrum (600 MHz) of K123-F3/4 MeOH W1 in CDCl3 .......................123
Figure A15. M. tuberculosis ATP levels are unaffected following treatment with 3 ..................127
Figure A16. Fraction library generation scheme .........................................................................132
Figure A17. Activity of MtThyA, MtThyX, and HsThyA Enzymes in the Presence of
9 µM 3 and 9 µM 1843U89 (Positive Control) .......................................................................133
Figure A18. Purity of MtThyA, MtThyX, and HsThyA Enzymes ..............................................134
Figure A19. Concentration-response curves of 3 against M. tuberculosis
anhydrotetracycline-inducible thyA and thyX overexpression mutants ...................................135
Figure A20. 1H NMR spectrum (900 MHz) of 1 in CDCl3–1% CF3CO2D .................................136
Figure A21. 13C DEPTQ spectrum (226.2 MHz) of 1 in CDCl3–1% CF3CO2D .........................137
Figure A22. COSY spectrum (600 MHz) of 1 in CDCl3–1% CF3CO2D ....................................138
Figure A23. HMBC spectrum (600 MHz) of 1 in CDCl3–1% CF3CO2D ...................................139
Figure A24. 1D-TOCSY spectra (600 MHz) of 1 in CDCl3–1% CF3CO2D ...............................140
Figure A25. Expanded HR-ESI-IT-TOF mass spectra of 1 .........................................................141
Figure A26. UV spectrum of 1 in methanol ................................................................................142
Figure A27. 1H NMR spectrum (900 MHz) of 2 in CDCl3–1% CF3CO2D .................................143
Figure A28. 13C DEPTQ spectrum (226.2 MHz) of 2 in CDCl3–1% CF3CO2D .........................144
Figure A29. COSY spectrum (600 MHz) of 2 in CDCl3–1% CF3CO2D ....................................145
Figure A30. HMBC spectrum (600 MHz) of 2 CDCl3–1% CF3CO2D........................................146
Figure A31. 1D-TOCSY spectra (600 MHz) of 2 in CDCl3–1% CF3CO2D ...............................147
Figure A32. Expanded HR-ESI-IT-TOF mass spectra of 2 .........................................................148
Figure A33. UV spectrum of 2 in methanol ................................................................................149
Figure A34. Optimized diazaquinomycin total synthesis .............................................................150
Figure A35. Expansion of 1H NMR spectrum (600 MHz) of 6 in CDCl3 ....................................151
Figure A36. Expansion of 1H NMR spectrum (600 MHz) of 9 in CDCl3 ....................................152

xvi
Figure A37. Expansion of 1H NMR spectrum (600 MHz) of 10 in CDCl3 ..................................153
Figure A38. Expansion of 1H NMR spectrum (600 MHz) of 11 in CDCl3 ..................................154
Figure A39. Expansion of 1H NMR spectrum (600 MHz) of 7 in CDCl3 ....................................155
Figure A40. Expansion of 1H NMR spectrum (600 MHz) of 8 in CDCl3 ....................................156
Figure A41. Plasmid maps for pCom8-PFR1500, pCom8-PFR1500L, and pBTL10 ..................157
Figure A42. pCOM8 PFR1500 transformant extract ion chromatograms ...................................158
Figure A43. Unreacted synthetic DAQA negative control ion chromatograms ...........................159
Figure A44. 1H NMR spectrum (900 MHz) of 12 in CDCl3 - 1% CF3CO2D ..............................160
Figure A45. 13C DEPTQ spectrum (226.2 MHz) of 12 in CDCl3 - 1% CF3CO2D ......................161
Figure A46. COSY spectrum (600 MHz) of 12 in CDCl3 - 1% CF3CO2D ..................................162
Figure A47. HMBC spectrum (600 MHz) of 12 in CDCl3 - 1% CF3CO2D ................................163
Figure A48. Selective 1D-TOCSY spectrum (600 MHz) of H2-18 in 12 in CDCl3 - 1%
CF3CO2D .................................................................................................................................164
Figure A49. Selective 1D-TOCSY spectrum (600 MHz) of H2-13 and H2-14 in 12 in
CDCl3 - 1% CF3CO2D .............................................................................................................165
Figure A50. Selective 1D-TOCSY spectrum (600 MHz) of H2-20 in 12 in CDCl3 - 1%
CF3CO2D .................................................................................................................................166
Figure A51. Expanded HR-ESI-IT-TOF mass spectra of 12 .......................................................167
Figure A52. UV spectrum of 12 in ACN .....................................................................................168
Figure A53. 1H NMR spectrum (600 MHz) of 13 and 14 in CDCl3 - 1% CF3CO2D ..................170
Figure A54. COSY spectrum (600 MHz) of 13 and 14 in CDCl3 - 1% CF3CO2D .....................171
Figure A55. HSQC spectrum (600 MHz) of 13 and 14 in CDCl3 - 1% CF3CO2D .....................172
Figure A56. HMBC spectrum (600 MHz) of 13 and 14 in CDCl3 - 1% CF3CO2D ....................173
Figure A57. Expanded HR-ESI-IT-TOF mass spectra of 13 and 14 ...........................................174
Figure A58. UV spectrum of 13 and 14 mixture in ACN ............................................................175
Figure A59. Co-crystal structure of 13 and 14 ............................................................................176
Figure A60. Deconvolution of co-crystal structure of 13 and 14 ................................................177
Figure A61. 1H NMR spectrum (600 MHz) of 15 in CDCl3 .......................................................178
Figure A62. 13C DEPTQ spectrum (226.2 MHz) of 15 in CDCl3 ...............................................179
Figure A63. COSY spectrum (600 MHz) of 15 in CDCl3 ...........................................................180
xvii
Figure A64. HSQC spectrum (600 MHz) of 15 in CDCl3 ...........................................................181
Figure A65. HMBC spectrum (600 MHz) of 15 in CDCl3 ..........................................................182
Figure A66. 1H NMR spectrum (600 MHz) of 15 in C6D6 ..........................................................184
Figure A67. COSY spectrum (600 MHz) of 15 in C6D6 .............................................................185
Figure A68. HSQC spectrum (600 MHz) of 15 in C6D6 .............................................................186
Figure A69. HMBC spectrum (600 MHz) of 15 in C6D6 ............................................................187
Figure A70. 1D-TOCSY spectra (600 MHz) of 15 in C6D6 ........................................................188
Figure A71. Expanded HR-ESI-Q-TOF mass spectrum of 15 ....................................................189
Figure A72. UV spectrum of 15 in methanol ..............................................................................190
Figure A73. CD spectrum of 15 in methanol ...............................................................................191
Figure A74. 1H NMR spectrum (600 MHz) of 16 in CDCl3 .......................................................192
Figure A75. 13C DEPTQ spectrum (226.2 MHz) of 16 in CDCl3 ...............................................193
Figure A76. COSY spectrum (600 MHz) of 16 in CDCl3 ...........................................................194
Figure A77. HSQC spectrum (600 MHz) of 16 in CDCl3 ...........................................................195
Figure A78. HMBC spectrum (600 MHz) of 16 in CDCl3 ..........................................................196
Figure A79. Expanded HR-ESI-Q-TOF mass spectrum of 16 ....................................................197
Figure A80. UV spectrum of 16 in methanol ..............................................................................198
Figure A81. 1H NMR spectrum (600 MHz) of dehydrorabelomycin
(6-hydroxytetrangulol, 17) in CDCl3…. ..................................................................................199
Figure A82. Expanded HR-ESI-Q-TOF mass spectrum of 17 .....................................................200
Figure A83. 1H NMR spectrum (600 MHz) of phenanthroviridone (phenanthroviridin
aglycone, 18) in CDCl3. ...........................................................................................................201
Figure A84. Expanded HR-ESI-Q-TOF mass spectrum of 18 .....................................................202
Figure A85. 1H NMR spectrum (600 MHz) of WS-5995 A (19) in CDCl3 .................................203
Figure A86. Expanded HR-ESI-Q-TOF mass spectrum of 19 .....................................................204

xviii
LIST OF ABBREVIATIONS
5-FU 5-fluorouracil
ABC ATP-binding cassette
ACN acetonitrile
AcOH acetic acid
ADC albumin-dextrose-catalase
ADP adenosine diphosphate
ALA aminolevulinic acid hydrochloride
ATc anhydrotetracycline
ATCC American Type Culture Collection
ATP adenosine triphosphate
AU absorbance units
BCG bacillus Calmette–Guérin vaccine
BDQ bedaquiline
BPO benzoyl peroxide
CACO-2 human colon epithelial cancer cell line
calcd. calculated
CCCP carbonyl cyanide chlorophenylhydrazone
CCDC The Cambridge Crystallographic Data Centre
CD circular dichroism
CFU colony forming units
CIMminer clustered image maps miner
CLF clofazimine
COSY homonuclear correlation spectroscopy
CS cycloserine
Cy3/Cy5 cyanines
DAQ diazaquinomycin
DAQA diazaquinomycin A
DAQC diazaquinomycin C
DAQE diazaquinomycin E
xix
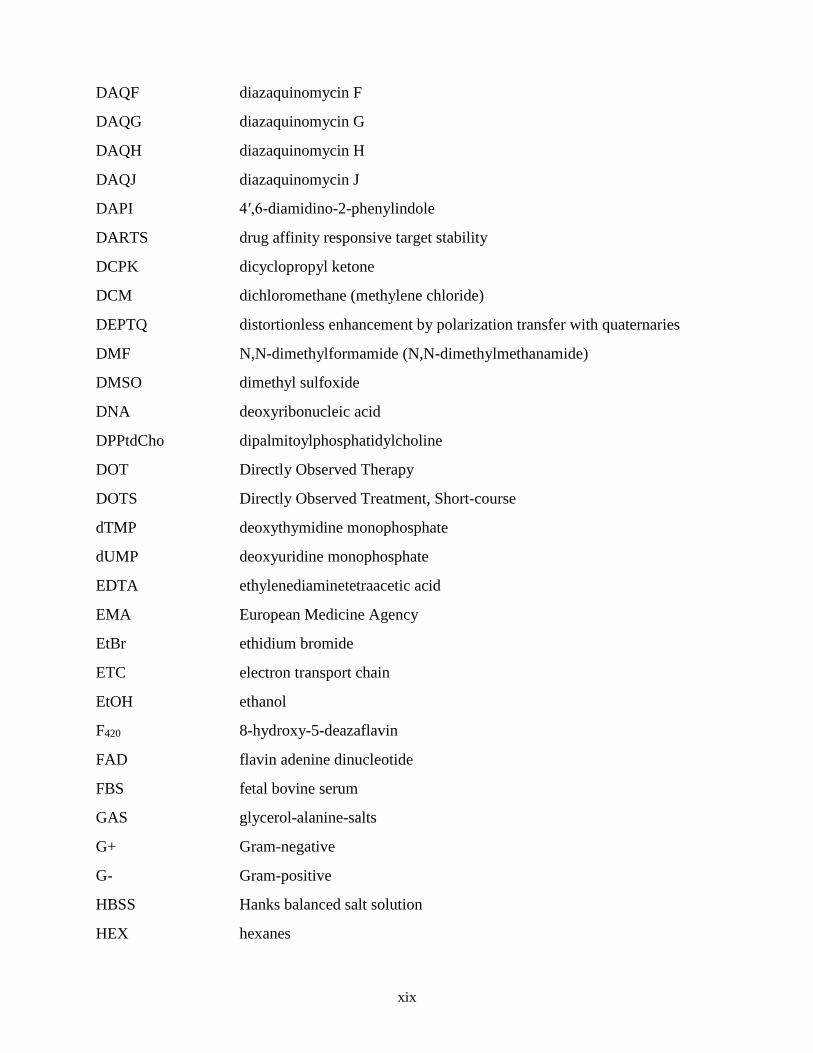
DAQF diazaquinomycin F
DAQG diazaquinomycin G
DAQH diazaquinomycin H
DAQJ diazaquinomycin J
DAPI 4′,6-diamidino-2-phenylindole
DARTS drug affinity responsive target stability
DCPK dicyclopropyl ketone
DCM dichloromethane (methylene chloride)
DEPTQ distortionless enhancement by polarization transfer with quaternaries
DMF N,N-dimethylformamide (N,N-dimethylmethanamide)
DMSO dimethyl sulfoxide
DNA deoxyribonucleic acid
DPPtdCho dipalmitoylphosphatidylcholine
DOT Directly Observed Therapy
DOTS Directly Observed Treatment, Short-course
dTMP deoxythymidine monophosphate
dUMP deoxyuridine monophosphate
EDTA ethylenediaminetetraacetic acid
EMA European Medicine Agency
EtBr ethidium bromide
ETC electron transport chain
EtOH ethanol
F420 8-hydroxy-5-deazaflavin
FAD flavin adenine dinucleotide
FBS fetal bovine serum
GAS glycerol-alanine-salts
G+ Gram-negative
G- Gram-positive
HBSS Hanks balanced salt solution
HEX hexanes

xx
HGSOC high grade serous ovarian cancer
HMBC heteronuclear multiple-bond correlation spectroscopy
HPLC high performance liquid chromatography
HR-ESI-IT-TOF high-resolution-electrospray-ionization-ion-trap-time-of-flight
Hsp60 heatshock protein 60
HSQC heteronuclear single quantum coherence spectroscopy
HsThyA human thymidylate synthase
HT-29 human colorectal adenocarcinoma cell line
IBC Institutional Biosafety Committee
IC50 half maximal inhibitory concentration
IDRI Infectious Disease Research Institute
INH isoniazid
IP intraperitoneal injection
IPTG isopropyl β-D-1-thiogalactopyranoside
ITR Institute of Tuberculosis Research
IT-TOF ion-trap-time-of-flight
Ki inhibitor equilibrium dissociation constant
KM kanamycin
LC50 half maximal lethal concentration
LCMS liquid chromatography mass spectrometry
LOQ limit of quantitation
LORA low oxygen recovery assay
LuxABCDE bioluminescence lux operon reporter
M9* modified M9 nutrient media
MABA microplate alamar blue assay
MBC minimum bactericidal concentration
MDA-MB-231 human breast adenocarcinoma cell line
MDA-MB-435 human melanoma cell line
MDR TB multidrug-resistant Mycobacterium tuberculosis
MeOH methanol

xxi
MIC minimum inhibitory concentration
MmpL mycobacterial membrane protein, large
MOA mechanism of action
MOE murine oviductal epithelial
MOSE murine ovarian surface epithelium
MRSA methicillin-resistant Staphylococcus aureus
MSSA methicillin-sensitive Staphylococcus aureus
MTS-PMS 3-(4,5-dimethylthiazol-2-yl)-5-(3-carboxymethoxyphenyl)-2-(4-
sulfophenyl)-2H-tetrazolium - phenazine methosulfate
MtThy Mycobacterium tuberculosis thymidylate synthase
m/z mass to charge ratio
NAME nonanoic acid methyl ester (methyl nonanoate)
NBS N-bromosuccinimide
NCCIH National Center for Complementary and Integrative Health
NCCLS National Committee on Clinical Laboratory Standards
NCI National Cancer Institute
NIH National Institutes of Health
NMR nuclear magnetic resonance spectroscopy
NOESY nuclear Overhauser spectroscopy
NP-Si normal phase silica gel
NTM nontuberculosis mycobacteria
OACIB Office of Animal Care and Institutional Biosafety
OADC oleic acid-albumin-dextrose-catalase
OD optical density
OE overexpression
OPC67683 delamanid
OVCAR ovarian carcinoma cell line
PA824 pretomanid
PARP poly(adenosine diphosphate-ribose) polymerase
PAS p-aminosalicylic acid

xxii
PBS phosphate buffered saline
PEG polyethylene glycol
PK pharmacokinetic
PLC preparative layer chromatography
PO per os (oral gavage)
PONAR sediment sampling device
ppm parts per million
QQQ triple-quadrupole
Q-TOF quadrupole-time-of-flight
RCF relative centrifugal force
RIF rifampin
RLU relative luminescence units
RNA ribonucleic acid
ROS reactive oxygen species
RP-C18 reversed phase octadecyl carbon chain-bonded silica
SAR structure-activity relationships
SDS-PAGE sodium dodecyl sulfate polyacrylamide gel electrophoresis
SM streptomycin
SPE solid phase extraction
TAM tirandamycin
TB tuberculosis; Mycobacterium tuberculosis
TCEP tris(2-carboxyethyl)phosphine
Tet tetracycline
Thy thymidylate synthase
TES 2-[tris(hydroxymethyl)-methylamino]-ethanesulfonic acid buffer
TFA trifluoroacetic acid
TIC total ion chromatogram
TMC207 bedaquiline
1D-TOCSY one-dimensional total correlation spectroscopy
TraSH transposon site hybridization

xxiii
Tw Tween™ 80
UIC University of Illinois at Chicago
USFDA United States Food and Drug Administration
UV ultraviolet
vol volume
VRE vancomycin-resistant enterococci
WHO World Health Organization
WT wild type
wt weight
XDR TB extensively drug-resistant Mycobacterium tuberculosis

xxiv
SUMMARY
Chapter 1 provides a history of the impact of M. tuberculosis on society and efforts towards
treatment of infection with the pathogen. In addition, natural products are presented as a prolific
source of anti-infective treatments and antibiotics from actinomycete bacteria, specifically those
from aquatic environment, are proposed as a promising source for new drug-leads to combat
M. tuberculosis. Both Chapter 2 and 3 detail the isolation, structure elucidation, derivatization,
bioactivity profiling, and efforts toward understanding the mechanism of action and in vivo
potential of the diazaquinomycin class of antibiotics. The former describes among the first
actinomycete-derived antibiotics sourced from fresh water and investigates the anti-tuberculosis
activity of the diazaquinomycins, while the latter presents the elucidation of novel
diazaquinomycin analogs from a marine-derived actinomycete with characterization of
cytotoxicity. Results presented in these chapters suggest the potential for this class of compound
to reveal new modes of tuberculosis treatment. Chapter 4 explains the rare discovery of a diterpene
from an actinomycete whose initially observed anti-tuberculosis activity was attributed to a set of
co-isolated cytotoxic angucycline compounds. The appendix describes known natural products
identified and deprioritized in the process of investigating TB-active actinomycete extract fractions
and contains supplemental data and figures for the preceding chapters. Chapter 5 concludes with
remarks on the current state and future outlook of the global tuberculosis crisis while covering
current innovations in natural products drug discovery and proposing new directions for the field
that might contribute to an eradication of the disease.

1
1. INTRODUCTION
1.1 The ongoing arms race to combat Mycobacterium tuberculosis infection.
1.1.1 History of the deadliest bacterial human pathogen.
M. tuberculosis (TB) is an ancient pathogen.1 Coalescent whole genome analyses have
revealed that the disease-causing microbe emerged about 70,000 years ago, migrating, expanding,
and evolving with the human population as it spread from Africa and grew in density during the
dawn of agriculture in the Neolithic period.2 Written records from 1600 to 1800 describing the
effect of TB on whole populations indicate that it killed twenty percent of adults in the Western
world during those years.3 For centuries, this disease once termed phthisis (Greek for “wasting
away”), consumption, scrofula, Pott's disease, and the White Plague, has been recognized as a
completely hopeless, incurable burden.4
1.1.2 Early treatments for M. tuberculosis infection.
Tuberculosis treatment preceding the advent of modern antimicrobial agents mostly treated
symptoms and consisted of herbal remedies, misguided and often harmful use of stimulant and
sedative chemicals, risky practices such as bloodletting and purging, fresh air (aerotherapy),
sunshine (heliotherapy), and dietary interventions.4 Addressing the failures of such approaches,
renowned British doctor James Clark wrote “…we must admit the humiliating truth, that there is
no reason to believe the physicians of the present day are more successful than their predecessors
were ten, nay twenty centuries ago.”5 In 1921, an attenuated form of the bovine pathogen
Mycobacterium bovis known as “bacille Calmette Guérin” (BCG) was developed for use as a
vaccine. Though still in use today, for unknown reasons it has not been shown to reliably protect
against adult pulmonary TB infection.6

2
1.1.3 First and second line anti-tuberculosis drugs and leads currently in clinical
trials.
Fortunately, the birth of the golden era of antibiotics in the in mid-twentieth century
resulted in the discovery of the aminoglycoside antibiotic streptomycin, which was shown to
effectively reduce TB-caused mortality by inhibiting protein synthesis in M. tuberculosis.7-9 This
discovery caused the rapid abandonment of previous, ineffective treatments. However,
streptomycin monotherapy became associated with relapses, and resistance to the drug arose just
five years after it was made widely available.10 Following a series of important clinical studies, it
was established in 1964 that streptomycin resistance was circumvented and treatment was more
effective when the drug was used in combination with p-aminosalicylic acid (PAS) and isoniazid
(INH) for a 24-month period of therapy.8, 11-16 Combination therapy was established as critical to
successful tuberculosis treatment – taking any mono-therapy resulted in resistance to that drug.17
Therapy duration was repeatedly reduced into the late 1970s with successive introductions of new
drugs. The previous three-drug regimen was eventually made obsolete with the introduction of
rifampin (RIF),18 the replacement of PAS with the better tolerated ethambutol,19 and the addition
of pyrazinamide.20 Thus, the “first line” drugs streptomycin, isoniazid, ethambutol, rifampin, and
pyrazinamide were established as the foundation for effective combination tuberculosis
chemotherapy – a two month “intensive” treatment phase with a subsequent four month
“continuation” phase – that is still in use today (Figure 1).21, 22 Currently, various strategies using
these and “second line” drugs - those of lesser efficacy or with additional side-effects - are
employed when pathogen populations exhibit resistance or are not eradicated in the “intensive”
and “continuation” phases.23 The most extreme cases make use of “third line” drugs, or those
which are not as efficient, have even less established efficacy, or have limited availability in
developing countries.24

3
Figure 1. Current first and second line anti-TB drugs.

4
In the early 1970s, the search for novel TB treatments was all but suspended after the
discovery and addition of RIF to this regimen of drugs.18 The first line drug therapies were able to
mitigate the threat of TB for a time and are still in use today with few modifications despite
increasing incidence of resistant strains. A major contributing factor to the development of
resistance had been a lack of patient compliance to the lengthy regimen and frequent abandonment
of treatment altogether.25 This prompted the establishment of ‘Directly Observed Therapy’ (DOT)
and ‘Directly Observed Treatment, Short-course’ (DOTS) in the 1980s and 90s in lieu of
unsuccessful self-administration.25, 26 The program was first promoted and propagated globally by
the WHO in the early 2000s but its impact has been debated.27-29 Unfortunately, during this same
time a lack of economic interest in developing new anti-TB drug-leads due to the scarcity of the
disease in more advanced countries caused a gap in discovery. Despite this and other setbacks,
recent decades have seen an increased interest in anti-TB drug discovery and development with
initiatives managed by non-profits like the TB Alliance and collaborative efforts like The Stop TB
Partnership.30, 31
Drugs with clinical trials currently listed as active or recruiting on clinicaltrials.gov were
well reviewed in 2015 by Schito, et al. and are shown in Table 1.32 Of these, bedaquiline (TMC207)
and delamanid (OPC67683) have been selected for conditional or accelerated approval by the
United States Food and Drug Administration (USFDA) and the European Medicine Agency
(EMA) based on their inhibition of resistant strains.33, 34 Though these drugs represent a major step
in alleviating the current burden of drug resistance, they do not simplify the first line drug regimen
or reduce treatment duration, both of which are desperately needed for the eradication of TB.

5
Table 1. The most recent TB drugs in clinical trials.a
Drug name Class Licensor/Sponsor Mechanism of action Phase
Delamanid
(OPC67683) nitroimidazole Otsuka
M. tuberculosis-activated prodrug –
mycolic acid synthesis inhibitor III
Moxifloxacin fluoroquinolone Bayer/Global TB Alliance DNA topoisomerase II inhibitor III
Gatifloxacin fluoroquinolone EU/TDR DNA topoisomerase II inhibitor III
Pretomanid
(PA824) nitroimidazole Global TB Alliance
M. tuberculosis-activated prodrug –
lipid and protein synthesis inhibitor II
Bedaquiline
(TMC207) diarylquinoline Tibotec/Johnson & Johnson ATP synthase subunit C inhibitor II
SQ109 ethylene diamine Sequella inhibition of efflux, cellular respiration, and
menaquinone and ATP synthesis35 II
Sutezolid
(PNU100480) oxazolidinone Sequella
inhibition of protein synthesis by binding
23S RNA and 50S ribosomal subunits II
Sudoterb
(LL3858) pyrrole Lupin N/A I
a adapted from Beena, Rawat, updated with data from ClinicalTrials.gov24, 36
1.1.4 Modes of action for M. tuberculosis inhibition.
Of the 4,000 total genes that comprise the M. tuberculosis H37Rv genome, between 200
and 800 have been deemed essential using various mutagenesis techniques.37, 38 These genes code
for biomolecules which hypothetically may be exploited as targets for bactericidal inhibition. Of
the hundreds of potential targets, only approximately twenty known gene products are exploited
by drugs on the market. The aminoglycosides streptomycin and kanamycin inhibit protein
synthesis; isoniazid, ethambutol, ethionamide, cycloserine, pyrazinamide, and delamanid target
the cell wall or membrane; the quinolones target DNA gyrase; bedaquiline targets ATP synthase;
while targets of others are less understood (PAS, clofazimine, etc.).39 M. tuberculosis has a
profound intrinsic tolerance to antibiotics, accumulating resistance plasmids or transposons for
multidrug efflux pumps establishing the current need for combination therapy.40
1.1.5 The current global burden of M. tuberculosis.
In 1993, with the increasing incidence of drug-resistant TB and coinfections with HIV, the
WHO declared TB a global health emergency.41 In its most recent report, the WHO estimated that

6
1.5 million deaths were attributed to TB infection in 2014 with 9.6 million new cases of the disease
reported. In addition, one-third of the world’s population was infected with the latent form of
tuberculosis.42 The most significant immediate threat is multidrug- and extensively drug-resistant
strains of M. tuberculosis (MDR- and XDR-TB), which are resistant to first and second line drug
regimens and resulted in 190,000 fatalities in 2014 (of the 480,000 total estimated MDR- and
XDR-TB infections).42-44 Additionally, reports of patients with TB infections that are resistant to
all available drug treatments (totally drug-resistant tuberculosis; TDR-TB) have begun surfacing
in the past decade.45 In extreme cases, partial surgical lung resection coupled with an MDR-TB
drug regimen is the only promising intervention remaining.22 A major deficiency of current TB
treatment is its long duration, which is necessary to eliminate a persistent subpopulation of slow-
growing or non-replicating cells (NRP-TB). This extended treatment time results in high cost and
frequent patient noncompliance. To make matters more complex, one third of the world’s
population is infected with latent TB, showing no symptoms but serving as a reservoir for active
infections that could prohibit eradication of the disease for decades.42 Importantly, the
predominance of tuberculosis in underprivileged populations in the developing world, together
with its frequent acquisition of drug-resistance and its ease of transmission between humans has
solidified it as a pathogen of global concern.46 These deterrents serve to support a continual
evolution of MDR- and XDR-TB that has been forging ahead faster than the development of new
antibiotic scaffolds, thus, there is a crucial need for new sources of potent, faster-acting drugs that
inhibit M. tuberculosis infection.
1.1.6 Future outlook.
In 2014 the WHO established the “End TB Strategy,” which aims to reduce the global
incidence of tuberculosis infection from >1,000 per million people in 2015 to <100 per million
people by 2035.47 If this goal is to be achieved, it will be through efforts on various fronts,

7
including drug discovery. Current clinical studies focus primarily on repurposing old drugs or
finding new, more efficacious combination therapies, but the search for new drugs is also critical.36
Along with new drugs, identification of new targets that might facilitate monotherapeutic
inhibition of M. tuberculosis would be revolutionary. TB is the deadliest infectious agent humanity
has ever known, and though the best treatment regimen available is inefficient and lengthy, it is
indeed a cure. Unfortunately, populations most burdened by TB also lack the resources to fully
treat and cure, or even detect and report the disease.42 This creates an environment that fosters a
drug resistance reservoir. Poorly treated M. tuberculosis infection could gain and spread pan-
resistance to other pathogens, contributing greatly to a return to a pre-antibiotic era, when
pathogens gain resistance to the last lines of defense.48 This becomes a critical global health
emergency. It is in the interest of all of society to put forth the funds and human capital toward
research efforts aimed at TB eradication.
1.2 Natural products as drug therapies.
1.2.1 The origins of natural products drug discovery.
Fossil records indicate the use of well-known medicinal plants by early humans since at
least as early as 60,000 years ago in the Middle Paleolithic age.49, 50 Specific use of natural products
by ancient civilizations for their antibiotic properties began with use of herbs, honey, and even
animal feces, with records of topical application of moldy bread being evidenced in ancient
societies in China, Egypt, and Rome.51 Amazingly, traces of tetracyclines have been detected in
the bones of Nubians from almost 2,000 year ago, the evidence strongly suggesting that the source
was a regularly ingested fermented beer intentionally inoculated with a tetracycline-producing
actinomycete strain.51, 52 Since the 1940s, natural products have proven essential as components of
drug discovery; they serve as both a direct source of small molecule therapies and as an inspiration
for biologically active synthetic derivatives.53 These compounds account for greater than 50% of

8
marketed small molecule therapies (Figure 2).53, 54 Additionally, nearly half of the first and second
line tuberculosis drugs are natural products or their derivatives and all of these are of microbial
origin.22, 23 Extracts, fractions, and compounds that inhibit TB both in vitro and in vivo have been
discovered and reported from plants, animals, and microbes from all environments.55
Figure 2. Origins of all approved drugs by percent from 1981−2014.a
a n = 1562; adapted from Newman, Cragg, 2016.53
In the 1990s, a wave of new technologies including combinatorial chemistry, high-
throughput screening, and computer-assisted design of small-molecules emerged that was widely
considered to be an improvement over traditional drug discovery.54 Though these methods have
advanced a handful of TB inhibitors into clinical trials, it has been claimed that they often lack a
rationality suitable for the continued efficient development of TB treatments.40, 54 Conversely,
natural products are privileged structures, having been honed for the targeting of biological targets
over millennia of evolution.56 This advantage is made clear by the fact that the first four rules of
Lipinski’s “Rule of Five” do not apply to natural products when considering “druggable chemical
entities.”53, 57 Recognition of this inherent potential and a realization that biological diversity had
0% 5% 10% 15% 20% 25% 30%
Botanical drug
Unaltered natural product
Synthetic drug (NP pharmacophore)
Vaccine
Synthetic drug (NP pharmacophore) / Natural product…
Synthetic / Natural product mimic
Biological macromolecule
Natural product derivative
Synthetic drug

9
not been sufficiently explored led to a reemergence of efforts focused on natural products drug
discovery in the past two decades.54
1.2.2 Terrestrial actinomycete bacteria as prolific providers of drug leads.
Actinomycete bacteria in particular have been an abundant source of bioactive secondary
metabolites for more than 50 years, providing greater than half of current antibiotics used
clinically.53, 54 Following the discovery of penicillin in the 1930s and the anti-TB antibiotic
streptomycin in the 1940’s, and propelled by the steady emergence of bacterial resistance, a
research focus on terrestrial actinomycete bacteria yielded more than 120 drugs for the treatment
of various human diseases.53, 58-60 Unfortunately, the earliest antibiotic screenings exhausted the
repertoire of taxonomically unique terrestrial actinomycetes and the novel bioactive small
molecules that could be accessed using the technology of the time, resulting in the continuous re-
isolation of known antibiotic scaffolds.
1.2.3 Drug-lead discovery from the marine environment.
As a result, researchers shifted their focus, prospecting new sources for drug lead discovery
such as the ocean. Libraries of macroorganisms, microorganisms, and their resulting secondary
metabolites were created that had not been incorporated in the biological screening efforts of
previous decades.54, 59 61-63 For many years, this immense resource had been overlooked due to
the prohibitive expense of additional technology and skill sets needed for ocean sampling. As a
result, the majority of marine microbiota remain unexplored. The recent development of more
sophisticated sampling technologies and moderate investments in marine exploration and
microbiology have allowed considerable progress, affording the development of several drugs
from marine sources (Prialt, Yondelis, Halaven).61, 62, 64 Interestingly, environmental pressures and
nutrient composition completely distinct from the terrestrial environment have been shown to

10
support microorganisms with structurally unique secondary metabolite capabilities. Importantly,
molecules isolated from microbes hold promise for TB inhibition.40, 65
1.2.4 Freshwater-derived actinomycetes as a source of novel drug leads.
Despite easily adaptable technology and expertise from exploration of the marine
environment, freshwater environments remain virtually unexplored for bioactive secondary
metabolites from actinomycete bacteria. Currently, only a handful of drug discovery research
groups have begun research using fresh waters as a source of microbes, none of them exploring
actinomycetes.66, 67 The Murphy and the Institute for Tuberculosis Research (ITR) labs are
uniquely positioned in the Great Lakes region to study freshwater systems, which are a virtually
unexplored source for pharmacologically active secondary metabolites. A primary focus of our
program is the exploration of the capacity of freshwater-derived actinomycete bacteria to produce
bioactive secondary metabolites. The occurrence of actinomycete bacteria in freshwater systems
has been known for over fifty years. Cross and Goodfellow summarize the earliest cultivation
studies of Micromonospora, Rhodococcus, Actinoplanes, Streptomyces and strains of several other
genera collected from a diversity of fresh water lake and stream sediments.68, 69 Early cultivation-
based studies described that representatives of common terrestrial genera, Streptomyces and
Thermoactinomyces, were isolated from shallow water sites, but that Micromonospora spp. were
found to be more prevalent in sediment at greater depths, likely due to their ability to survive in
microaerophilic environments and efficiently degrade benthic nutrients such as chitin and
cellulose.70-73 The abundance of Micromonospora in deeper sediment led some to postulate that
they were indigenous inhabitants of these freshwater systems. More recent molecular-based
screening techniques support these findings, revealing freshwater-derived actinomycetes that were
taxonomically distinct from those of terrestrial and marine origin, likely due to distinct
environmental selection pressures and growth conditions.74 Further support for claims of
11
freshwater endemic actinomycetes are found in reports of clades from bacterioplankton
communities around the world that are exclusive to freshwater environments.75-80 Culture
independent studies of freshwater bacterial communities around the world have indicated the
presence of actinomycete clades that are exclusive to freshwater environments, the most abundant
of which appear to fall within the acI lineage.75-80 Few cultured representatives of these clades
exist.76, 77 Importantly, the majority of these studies focused on bacterioplankton rather than
sediment actinomycetes. These promising new freshwater sources can easily be exploited using
the techniques that have allowed for the discovery of bioactive secondary metabolites from marine
sediment-derived actinomycete bacteria. The search for novel actinomycete taxa in freshwater
environments is significant as it applies a similar paradigm that afforded marine researchers a
wealth of chemical diversity and successes in drug-lead discovery.64, 81-84 Extraordinarily little is
known about the diversity of secondary metabolites produced by actinomycete bacteria derived
from freshwater systems. The next logical step is to expand the marine paradigm to freshwater
environments, which harbor distinct environmental selection pressures and growth conditions, and
to date are virtually unexplored for their capacity to afford unique actinomycete bacteria.
Furthermore, despite several cultivation independent studies aimed at characterizing lake
actinomycete populations,74 to the best of our knowledge few efforts (including one study from
our lab) have identified secondary metabolites from freshwater-derived actinomycetes. Included
in this gap is a notable absence of studies aimed specifically at generating anti-TB drug-
leads.40, 85, 86
1.3 Hypothesis.
We hypothesize that actinomycetes isolated from aquatic (both marine and freshwater)
environments serve as important and underexplored resources for antibiotics that inhibit
M. tuberculosis. This hypothesis is founded on the knowledge that a) the aquatic environment is

12
largely unexplored for its chemical diversity and b) observations of the cohabitation of pathogenic
mycobacteria with actinomycetes in the aquatic environment87 may act as a selection pressure,
eliciting the generation of actinomycete secondary metabolic pathways tailored to the production
of antimycobacterial antibiotics.87, 88 We propose that interactions between the genera have
established long standing selection pressures, causing the generation of actinomycete secondary
metabolic pathways tailored to the production of antimycobacterial antibiotics. Culture-
independent analyses of sediment samples collected from Massachusetts, Vietnam, and Lake
Michigan have confirmed the phenomenon of mycobacterial diversity co-habiting with
actinomycetes (data not shown). Furthermore, these environmental mycobacteria are found useful
as infection models for TB due to their morphological and genetic similarities, thus a conjecture
that anti-mycobacterial antibiotics from actinomycetes in the environment might have activity
against TB is valid.

13
2. DIAZA-ANTHRACENE ANTIBIOTICS FROM A FRESHWATER-DERIVED
ACTINOMYCETE WITH SELECTIVE ANTIBACTERIAL ACTIVITY TOWARD
M. TUBERCULOSIS.†
2.1 Introduction.
Included in the scarcity of freshwater-derived microbe research is a notable absence of
studies aimed specifically at generating drug-leads.40, 85, 86 Thus, a major focus of our antibiotic
discovery program is to study Actinobacteria derived from the Great Lakes and other freshwater
bodies. We have created an extensive library of these bacteria and their resulting secondary
metabolite fractions (Figure A16). A preliminary in vitro growth inhibition screening of this
fraction library against M. tuberculosis H37Rv led to the identification of a Micromonospora sp.
isolated from Lake Michigan sediment, whose fraction exhibited submicromolar inhibitory
activity. From this strain we isolated and characterized two novel secondary metabolites,
diazaquinomycins H and J (DAQH and DAQJ), which to our knowledge are among the only
freshwater-derived actinomycete metabolites described to date.85, 86 Further in vitro profiling
suggested that this group of diaza-anthracene antibiotics selectively targets M. tuberculosis over
other bacteria, and is active against several forms of drug-resistant TB. Herein we present the
identification and in vitro biological characterization of this unique antibiotic class with
explorations of their elusive mechanism of action and their testing in vivo.
2.2 Results and discussion.
2.2.1 Isolation and identification of diazaquinomycins H (1) and J (2).
Screening of our actinomycete secondary metabolite library against M. tuberculosis in the
microplate alamar blue assay (MABA) and low-oxygen-recovery assay (LORA) led to the
†Portions of this chapter are reproduced with permission from Mullowney, M. W.; Hwang, C. H.; Newsome, A. G.;
Wei, X.; Tanouye, U.; Wan, B.; Carlson, S.; Barranis, N. J.; Ó hAinmhire, E.; Chen, W.-L.; Krishnamoorthy, K.;
White, J.; Blair, R.; Lee, H.; Burdette, J. E.; Rathod, P. K.; Parish, T.; Cho, S.; Franzblau, S. G.; Murphy, B. T. Diaza-
anthracene antibiotics from a freshwater-derived actinomycete with selective antibacterial activity toward
Mycobacterium tuberculosis. ACS Infect. Dis. 2015, 1, 168-174. Copyright 2015 American Chemical Society.
Society."

14
selection of Lake Michigan-derived strain B026 for further chemical investigation. A 28 L
fermentation of B026 was performed, and following extraction of secondary metabolites from the
fermentation broth and several chromatographic steps using bioassay-guided fractionation, 0.3 mg
each of 1 and 2 were purified using RP-C18 semi-preparative HPLC (2.4 mL • min−1, gradient of
50% aqueous ACN to 100% ACN for 25 min, followed by an isocratic flow of 100% ACN for 15
min; tR 18.6 min, 22.0 min, respectively).
2.2.2 Structure elucidation of diazaquinomycins H (1) and J (2).
Following a series of chromatographic steps, 1 was obtained as red powder. Combined
NMR and high resolution IT-TOF MS experiments of 1 established the molecular formula as
C22H26N2O4, which was indicative of eleven degrees of unsaturation. The UV absorption profile
of 1 displayed characteristics of the diazaquinomycins as previously reported.89 Analysis revealed
that 1 lacked the symmetry of the previously reported DAQA (3) or DAQC (see Chapter 3).90-92 A
resonance at δH 7.00 (2H, H-3, H-6) observed in the 1H NMR spectrum, determined by integration
to represent two hydrogens, indicated a less substituted anthraquinone compound when compared
to known DAQs. A triplet signal at δH 3.13 (2H, H-12) indicated one β-substituted methylene
group and a singlet at δH 2.77 (3H, H-11) revealed one aromate-bound, β-substituted methyl group.
A doublet with an integration of six at δH 0.87 (6H, H-19, H-20) and a methine multiplet resonance
at δH 1.53 (1H, H-18) provided evidence of the isononyl group. Multiplet signals at δH 1.60 (2H,
H-13), δH 1.47 (2H, H-14), δH 1.35 (2H, H-15), δH 1.31 (2H, H-16) and δH 1.19 (2H, H-17) were
indicative of the methylene groups that constituted the remainder of the aliphatic side chain.
Analysis of 13C NMR data suggested the presence of two quinone carbonyls (δC 180.1,
C-10; 172.9, C-9), two near overlapping lactam carbonyls (δC 163.2 and 163.0; C-2 and C-7), two
methine alkene carbons (δC 127.6, C-6; 128.6, C-3 ), six quaternary carbons, two of which were
interchangeable (δC 160.1, C-5; 155.6, C-4; 136.3 and 136.8, C-8a and C-9a; 118.0, C-4a; 117.5,
15
C-10a), six methylene carbons, three of which were overlapping (δC 39.1, C-17; 35.0, C-12; 29.7,
C-15; 29.7, C-14; 29.7, C-13; 27.4, C-16), and three methyl carbons (δC 23.1, C-11; 22.8, C-19
and C-20) (Table 2). Given that the molecular formula afforded 11 degrees of unsaturation and the
molecule contained 4 carbonyls, 6 quaternary alkene carbons, and 2 methine alkene carbons, the
remaining degrees were satisfied by the fused ring system. Key HMBC, COSY, and 1D-TOCSY
correlations are given in Figure 4. Interpretation of COSY and 1D-TOCSY data defined one
distinct aliphatic spin system (H2-12 to H3-20). Connectivity of the aliphatic side chain and the
methyl group to opposing β-substituted positions of the core ring system was established using
HMBC correlations (Figures 4 and A23).
HMBC correlations between H3-11 and C-3, C-4 and C-4a, as well as correlations between
the H2-12 and C-5, C-6, C-10a gave evidence for the connectivity of the alkyl groups to opposing
sides of the anthracene core skeleton of 1. Two lactam carbonyl resonances, C-2 and C-7, were
observed in the 13C DEPTQ spectrum; due to overlap it was not possible to distinguish between
them in an HMBC experiment (Table 2). Similarly, two quaternary carbon resonances, C-8a and
C-9a, were observed in the 13C DEPTQ spectrum but were indistinguishable by an HMBC
experiment. This NMR data, coupled with MS data, confirmed the presence of methyl and isononyl
β-substituents on either lactam ring confirming the structure of 1 is as shown (Figures 3 and 4).
Following a series of chromatographic steps, 2 was obtained as red powder. Combined
NMR and high resolution IT-TOF MS experiments of 2 established the molecular formula as
C23H28N2O4, which was indicative of eleven degrees of unsaturation. Analysis of the UV
absorption profile and 1H NMR data of 2 indicated that it was also an asymmetric diazaquinomycin
analog similar to 1.89 Additional structure elucidation of 2 was executed in the same fashion as 1,
using a similar series of MS and one- and two-dimensional NMR experiments, including

16
1D-TOCSY, to identify the 14 Da increase in molecular weight as an additional methylene in the
aliphatic side chain (Figures A27-33).
Table 2. 1H and 13C NMR chemical shift data (CDCl3–1% CF3CO2D) of 1 and 2.
Position 1 2
13C a 1H mult. (J, Hz) b 13C a 1H mult. (J, Hz) b
1 8.05 s 8.03 s
2 163.2 d 161.0
3 128.6 7.00 s 128.9 c 6.93 s
4 155.6 154.6
4a 118.0 118.3
5 160.1 160.2 c
6 127.6 7.00 s 128.0 c 6.93 s
7 163.0 d 160.9 c
8 8.05 s 8.03 s
8a 136.3 e 136.2
9 172.9 173.0
9a 136.8 e 136.8
10 180.1 180.0
10a 117.5 117.8
11 23.1 2.77 s 23.0 2.74 s
12 35.0 3.13 t (7.7) 35.0 3.10 t (7.0)
13 29.7 f 1.60 p (7.5) 29.9 1.59 m
14 29.7 f 1.47 p (7.4) 29.8 1.45 m
15 29.7 f 1.35 m 29.7 1.35 m
16 27.4 1.31 m 29.6 1.31 m
17 39.1 1.19 q (6.9) 27.5 1.28 m
18 28.1 1.53 m 39.1 1.17 m
19 22.8 0.87 d (6.6) 28.1 1.52 m
20 22.8 0.87 d (6.6) 22.8 0.86 d (6.6)
21 22.8 0.86 d (6.6) a 226.2 MHz; b 900 MHz; c shifts obtained through HMBC and/or HSQC NMR experiments; d, e, f shifts
indistinguishable by HMBC and HSQC NMR experiments. s = singlet; t = triplet; q = quartet; p = pentet;
m = multiplet.

17
Figure 3. Structures of diazaquinomycins H (1), J (2), and A (3).
Figure 4. Key 2D NMR Correlations of 1 and 2.
2.2.3 In vitro evaluation of diazaquinomycins H (1), J (2), and A (1) in TB whole-cell
assays.
Once compounds 1 and 2 were identified, Chang Hwa Hwang in the ITR tested their ability
to inhibit replicating M. tuberculosis in vitro using the MABA. The MABA is a phenotypic whole
cell-based microplate dilution assay that employs a fluorometric readout, relying on the correlation
of resazurin dye reduction to bacterial proliferation.93, 94 Compounds 1 and 2 exhibited minimum
inhibitory concentrations (MICs; defined as the lowest concentration resulting in ≥90% growth

18
inhibition of H37Rv, and averaged from triplicates) of 0.10 μM and 0.18 μM, respectively. A
luminescence reporter gene assay (LuxABCDE driven by Phsp60) was used to confirm that activity
of 1 and 2 was not readout dependent. Further biological characterization of 1 and 2 was difficult,
since a 28 L fermentation afforded only 0.3 mg of each. Fortunately, in a separate study discussed
in Chapter 3, we isolated and identified four analogs of the diazaquinomycin antibiotic class from
a marine-derived Streptomyces sp.89 DAQs F and G were a co-eluting isomeric mixture but DAQA
(3) and DAQE were purified and screened in the MABA, exhibiting MICs of 0.28 μM and 0.10
μM, respectively. From this strain, compound 3 was produced in relatively large amounts, thus all
further biological experiments were carried out using this molecule. Moving forward, the solubility
of 3 was an important consideration in all biological testing. DAQA exhibited a maximum room
temperature concentration of 0.42 µM in water in a previous study and 1.7 mM in DMSO in the
current study.95
Compound 3 was also tested for its ability to inhibit non-replicating M. tuberculosis in the
LORA.96 Low-oxygen adapted M. tuberculosis carrying the luxABCDE plasmid was exposed for
10 days to serially diluted 3 in 96-well microplates in a low oxygen environment created with an
Anoxomat commercial system. After 28 hours normoxic “recovery,” activity was assessed using
the ability to block recovery of the production of a luminescent signal. The MIC value of 3 was
2.03 μM.
As a confirmatory approach for its anti-TB activity, the minimum bactericidal
concentration (MBC99; defined as the lowest concentration that reduces CFU by 99% relative to
the zero-time inoculum) was determined for 3 by subculture onto 7H11 agar just prior to addition
of the Alamar Blue and Tween™ 80 for MABA MBC99, and reading of luminescence on Day 10
from a lux reporter strain for LORA MBC99. Compound 3 exhibited an MBC99 of 1.04 μM under
normoxic conditions, but did not exhibit a significant MBC99 under hypoxic conditions.

19
2.2.4 Cytotoxicity evaluation of diazaquinomycins H (1), J (2), and A (1).
To assess the cytotoxicity of the DAQ class, compounds 1-3 were tested in vitro against
Vero cells (ATCC CRL-1586) in the ITR by Baojie Wan. They did not exhibit cytotoxicity at 10
μg/mL, the highest testing concentration. Insufficient yields of 1 and 2 prevented further
cytotoxicity screening of these compounds, however compound 3 exhibited a range of LC50 values
when screened against a panel of human cancerous [MDA-MB-435 (0.09 μM), MDA-MB-231
(3.6 μM), HT-29 (5.7 μM), OVCAR3 (0.48 μM), OVCAR4 (4.3 μM), Kuramochi (9.4 μM)], and
non-cancerous cell lines [MOSE (7.8 μM), MOE (>28 μM)] in the Joanna Burdette lab by Wei-Lun
Chen. Compound 3 was also tested in a previous study against ovarian cancer cell line OVCAR5
and exhibited an LC50 value of 8.8 μM.89 After further investigation, we determined that the
moderate cytotoxicity in this cell line was due to DNA damage followed by the induction of
apoptosis.89 A previous report indicated that compound 3 and DAQC exhibited no significant
inhibition when screened for anti-fungal activity against Mucor miehei and Candida albicans.90
We also assessed the ability of 3 to inhibit the growth of Candida albicans (ATCC 90028) in the
ITR, but no significant activity was exhibited when tested at the highest concentration of
28.24 μM.
2.2.5 Antibiotic specificity of diazaquinomycin A (3) toward M. tuberculosis.
In order to assess the ability of DAQA to overcome antibiotic resistance in TB and to gain
potential insight into the mechanism of action (MOA) for this compound class, we screened 3
against a panel of mono-drug-resistant strains using the MABA (Table 3). Compound 3 maintained
potency across the panel, which suggested the absence of cross-resistance with current anti-TB
agents.
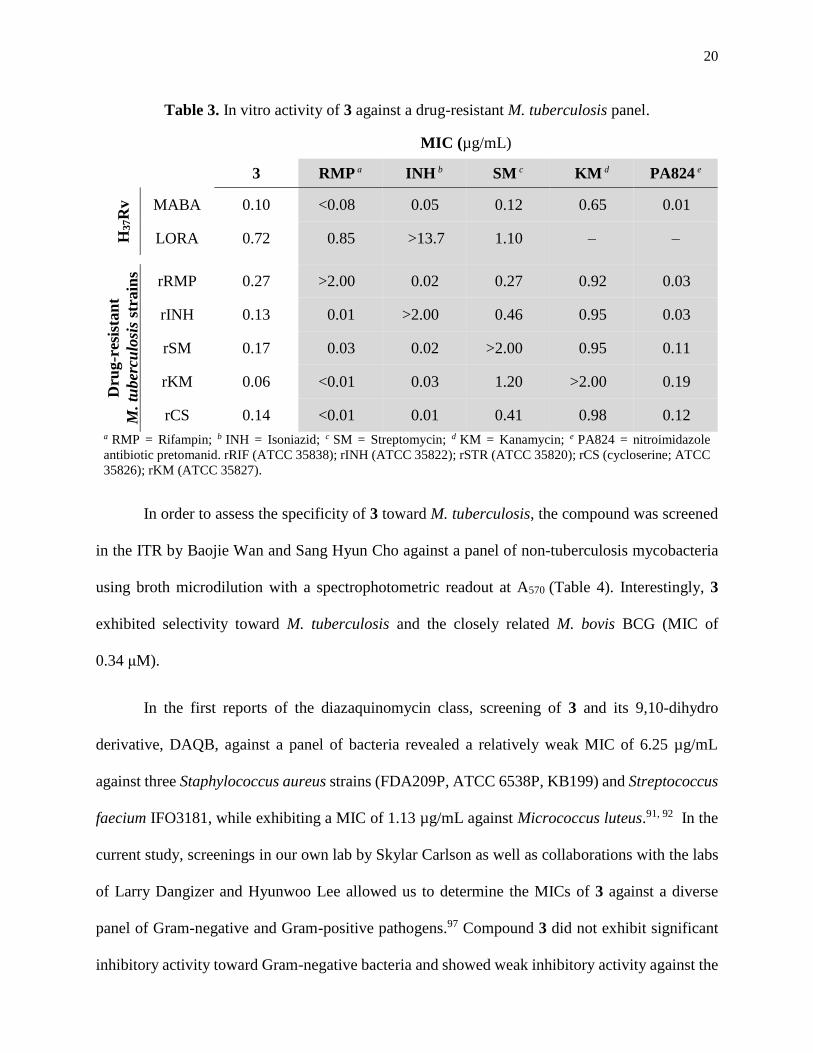
20
Table 3. In vitro activity of 3 against a drug-resistant M. tuberculosis panel.
MIC (µg/mL)
3 RMP a INH b SM c KM d PA824 e
H37R
v
MABA 0.10 <0.08 0.05 0.12 0.65 0.01
LORA 0.72 0.85 >13.7 1.10 – –
Dru
g-r
esis
tan
t
M. tu
ber
culo
sis
stra
ins
rRMP 0.27 >2.00 0.02 0.27 0.92 0.03
rINH 0.13 0.01 >2.00 0.46 0.95 0.03
rSM 0.17 0.03 0.02 >2.00 0.95 0.11
rKM 0.06 <0.01 0.03 1.20 >2.00 0.19
rCS 0.14 <0.01 0.01 0.41 0.98 0.12
a RMP = Rifampin; b INH = Isoniazid; c SM = Streptomycin; d KM = Kanamycin; e PA824 = nitroimidazole
antibiotic pretomanid. rRIF (ATCC 35838); rINH (ATCC 35822); rSTR (ATCC 35820); rCS (cycloserine; ATCC
35826); rKM (ATCC 35827).
In order to assess the specificity of 3 toward M. tuberculosis, the compound was screened
in the ITR by Baojie Wan and Sang Hyun Cho against a panel of non-tuberculosis mycobacteria
using broth microdilution with a spectrophotometric readout at A570 (Table 4). Interestingly, 3
exhibited selectivity toward M. tuberculosis and the closely related M. bovis BCG (MIC of
0.34 μM).
In the first reports of the diazaquinomycin class, screening of 3 and its 9,10-dihydro
derivative, DAQB, against a panel of bacteria revealed a relatively weak MIC of 6.25 µg/mL
against three Staphylococcus aureus strains (FDA209P, ATCC 6538P, KB199) and Streptococcus
faecium IFO3181, while exhibiting a MIC of 1.13 µg/mL against Micrococcus luteus.91, 92 In the
current study, screenings in our own lab by Skylar Carlson as well as collaborations with the labs
of Larry Dangizer and Hyunwoo Lee allowed us to determine the MICs of 3 against a diverse
panel of Gram-negative and Gram-positive pathogens.97 Compound 3 did not exhibit significant
inhibitory activity toward Gram-negative bacteria and showed weak inhibitory activity against the

21
Gram-positive bacteria tested. The results of this study and of previous reports indicate that 3
possesses a narrow spectrum of activity, and shows greatest inhibition toward the pathogen
M. tuberculosis.
Table 4. Antimicrobial spectrum of 3.a
MIC
(µg/mL)
3 M
yco
bact
eria
M. abscessus > 7.5
M. chelonae > 7.5
M. marinum > 7.5
M. kansasii > 7.5
M. avium 3.85
M. smegmatis 4.56
M. bovis 0.12
MSSAb 4
MRSAc 16
G+ e
E. faecalis 8
E. faecium 8
VREd 32
S. pyogenes > 25
S. pneumoniae > 10
B. thuringiensis 25
B. cereus 14579 25
B. cereus 10987 12.5
B. anthracis 6.25
B. subtilis 100
A. baumannii 128
G- f
E. coli 128
E. cloacae 64
K. pneumoniae 128
P. aeruginosa 128
P. mirabilis 64
a ATCC designations are listed in the
Supporting Information; b methicillin-sensitive
S. aureus; c methicillin-resistant S. aureus; d vancomycin-resistant E. faecium; e Gram-
positive bacteria; f Gram-negative bacteria.
22
2.2.6 Caco-2 permeability and liver microsome stability of diazaquinomycin A (3).
Compound 3 was incubated at 1 μM for 30 min with 0.5 mg/mL of human and mouse liver
microsomes and resulted in 96% and 98% of the parent compound remaining, respectively. In
addition, to predict absorption via oral administration, Caco-2 bi-directional permeability was
performed by incubating 5 μM of 3 (with vinblastine and propranolol controls) and measuring
apical and basolateral concentrations using tandem LCMS. Compared to control compounds, 3
exhibited moderate absorption showing a permeability of 44 nm/s with 82% recovery (from apical
to basolateral), and 9 nm/s with 98% recovery (from basolateral to apical), and no efflux substrate
potential (0.2 efflux ratio).
2.2.7 In vivo evaluation of diazaquinomycin A (3).
Yuehong Wang of the ITR collaborated with the Toxicology Research Laboratory (TRL)
at UIC to perform a tolerance assessment of 3 as our first in vivo study. It was previously published
that 3 deposited solid residues and exhibited acute toxicity when dosed at 100 mg/kg
intraperitoneally (IP),91, 95 though in our study the compound exhibited no qualitatively detectable
ill effect and was well tolerated when dosed daily by oral gavage at 100 mg/kg for five days in
uninfected mice. While it is possible this difference was due to limited oral bioavailability, our
Caco-2 data predicted otherwise.
A subsequent study also in collaboration with the TRL aimed to assess pharmacokinetics
(PK) of 3 in mouse lungs and plasma. Dosing twenty-four seven- to ten-week old male Balb/c
mice with 3 followed by analysis at half-, one-, two-, and four-hour time points resulted in
observation of DAQA in lungs and plasma by LC-MS. The greatest concentrations were seen at
two hours, though none of the time points resulted in concentrations that could be observed above
the LC-MS limit of quantitation (LOQ). Interestingly, the internal standard, tetramethyl-
diazaquinomycin (4), was also frequently below the LOQ when extracted from matrices but not

23
when injected in clean ACN indicating that DAQ solubility was likely a cause. In addition to
dosing of 100 mg/kg in 10 µL/kg vehicle by oral gavage, half of the mice were dosed at 50 mg/kg
in 5 µL/kg vehicle intraperitoneally. Similar to the toxicity study, mice dosed by oral gavage
remained healthy throughout all PK time points, while acute toxicity evidenced by hunched
posture, closed eyes, decreased activity, and a rough coat followed dosing by IP, which was in
accord with the earlier mentioned reports.91, 95
Despite the lack of conclusive data in the PK study, we progressed to in vivo studies of 3
to examine efficacy in TB-infected mice in collaboration with Carolyn Shoen in the lab of Michael
Cynamon. Unfortunately, the vehicle was found to be toxic when two control mice died after four
days, so the experiment failed to produce conclusive results.
2.2.8 Optimization of diazaquinomycin A (3) for increased solubility and potency
against M. tuberculosis.
Stocks of 3 purified from strain F001 had been greatly depleted in the course of our
extensive biological screening campaign, justifying synthesis of the compound. Dr. Larry Klein of
the ITR at UIC optimized the published diazaquinomycin A total synthesis to increase the supply
of compound for future biological studies and synthetic derivative generation (Figure A34).98
Along with production of 3, two novel analogs with α- and β-modifications were generated,
resulting in tetramethyl-diazaquinomycin (4) and bis-normethyl-diazaquinomycin A (5; Figure 5).
Figure 5. Structures of tetramethyl-diazaquinomycin (4) and
bis-normethyl-diazaquinomycin A (5).

24
From the renewed DAQA stock, a series of analogs were generated based on published
syntheses with the aim of exploring structure-activity relationships (SAR) and investigating
positions for ‘clickable’ and photo-reactive moieties for target capture and pull-down. These
studies also had the goal of improving the solubility and anti-tuberculosis activity of 3 (Figures 6
and 7).92, 95 Bismorpholino DAQA (6) was the synthetic target for the generation of a DAQ analog
modified to add bulk to the α-position (NMR spectrum Figure A39). In a separate reaction,
N,N’-bismethyl DAQA (7) was synthesized along with its side product N,O-bismethyl DAQA (8)
in a 2:1 ratio in order to explore the role of the N-H groups in bioactivity (NMR spectra Figures
A40 - A41). Compound 6, its three synthetic precursors bismethoxy DAQA, 9; bisbromo-
bismethoxy DAQA, 10; and bismethoxy-bismorpholino DAQA 11; NMR spectra Figures
A35 – A40), and the two methylated analogs all exhibited qualitatively greater organic solubility
Figure 6. Synthesis of α-substituted and O-methylated diazaquinomycin analogs.

25
but were orders of magnitude less active than DAQA against M. tuberculosis in the MABA. Both
compounds 4 and 5 retained the activity exhibited by the isolated DAQ natural products (Table 5).
Figure 7. Synthesis of 7 and 8.
Table 5. In vitro anti-TB activity of 4-11.
Compound H37Rv MIC (µg/mL)
MABA
4 0.06
5 0.07
6 2.69
7 >50
8 6.0
9 22.8
10 >10
11 8.63
Although modifications at the α-position were detrimental to DAQ activity, 4, 5, and the
five actinomycete-derived DAQs provided evidence that the presence or absence of α-methyl
groups and the number and length of carbons at the β-substituted side chains do not effect change
in anti-TB activity. With this in mind, we set out to modify the β-substituted positions with groups
other than variations in carbon bulk. Several failed attempts made it apparent that both the

26
published and Klein-optimized syntheses of 3 precluded the possibility of introducing reactive
species to the β-substituted side chains due to a highly oxidative, high heat, H2SO4 penultimate
synthetic step. Klein, in collaboration with Mr. Michael Tufano also of the ITR at UIC, attempted
to circumvent this problematic step by developing an entirely new DAQA total synthesis that
would facilitate modification of the DAQ core at the β-substituted positions, but was unsuccessful.
An alternative approach was attempted when observation that some hydroxylase enzymes,
specifically those from Pseudomonas putida GPo1 and Mycobacterium sp. HXN-1500, had the
ability to catalyze hydroxylation of terminal alkanes and might have potential for producing novel
β-hydroxylated DAQA products.99-101 To explore the possibility of a whole-cell biocatalysis
method, plasmids containing hydroxylase genes from the aforementioned strains were acquired
from Christian Willrodt of the Andreas Schmid lab and E. coli transformants were generated.
Unfortunately, lack of evidence for biocatalysis products in the MS total ion chromatograms of
the E. coli clone extracts and failed bioconversion of the positive control substrates indicated that
the experiment was unsuccessful.
2.2.9 Studies toward elucidation of the diazaquinomycin mechanism of action.
Given its mild reported antibiotic activity in E. faecium, observation of potency against
M. tuberculosis provided sufficient motivation for us to further explore the DAQA biological
MOA. It was reported that the antibacterial activity of 3 was reversed when folate, dihydrofolate,
leucovorin, and thymidine were added to the growth medium, suggesting that the target was within
the folate pathway.102 Shortly after its discovery, previous studies claimed that 3 inhibited
thymidylate synthase competitively with its coenzyme 5,10-methylenetetrahydrofolate in both
E. faecium and Ehrlich ascites carcinoma, with Ki’s of 36 μM and 14 μM, respectively.102
Thymidylate synthase is an attractive target as it plays a crucial role in DNA replication and repair
by synthesizing de novo deoxythymidine monophosphate (dTMP) from deoxyuridine

27
monophosphate (dUMP). M. tuberculosis encodes for two structurally and mechanistically
unrelated thymidylate synthase enzymes, ThyA and ThyX. ThyA occurs across kingdoms, while
ThyX has been found to occur only in bacteria and has been associated with survival of
Corynebacteriaceae during the stationary growth phase.103, 104 Thus, we attempted to determine
which of these enzymes, is any, was the antibiotic target.
Through a collaboration with the Rathod lab at the University of Washington, we found
that 3 did not significantly inhibit the activity of purified human ThyA (HsThyA), M. tuberculosis
ThyA (MtThyA), or MtThyX when compared to the positive control – folate analog and known
ThyA inhibitor 1843U89 – when tested in a cell-free enzyme assay (Figures A17-A18).105 To rule
out the possibility of 3 being metabolized to a biologically active species within the cell, we
collaborated with the Tanya Parish lab at the Infectious Disease Research Institute (IDRI) to
perform in vitro testing against M. tuberculosis thyA and thyX overexpression (OE) mutants. We
did not observe a significant differential in the MIC when 3 was screened against M. tuberculosis
thyA and thyX OE mutants under induced (+anhydrotetracycline) and uninduced
(-anhydrotetracycline) conditions, compared to the H37Rv wild-type strain (Figure A19).
Additionally, we observed no reversal of the antibiotic properties of 3 when the culture media was
supplemented with thymine or thymidine, indicating that there was likely no disruption in the
thymidylate synthase related enzymatic processes of the folate pathway.

28
Figure 8. Summary of experiments performed to determine DAQA mechanisms of action.
Having eliminated the possibility that DAQA targets thymidylate synthase as it had been
reported for other organisms, we set out to establish the mechanism of inhibition in
M. tuberculosis. Initially, we attempted to directly capture a molecular target of 3 using the
DARTS method, but that proved unfruitful (Appendix A2.1.1).106, 107 Later, approaches using
overexpression mutant screening, transcription profiling, and a screening against clofazimine-
resistant mutant strains (rCLF1 and rCLF4) revealed potential mechanisms of action involving
oxidative stress, F420 biosynthesis, pyrimidine biosynthesis, and MmpL5 efflux. We set out to
confirm each of these with additional targeted experiments. Aside from gaining a minimal

29
understanding of a potential inhibition by oxidative stress, we were unable to confidently identify
a singular molecular target using the experiments as detailed herein (Figure 8).
2.2.9.1 diazaquinomycin A (3) activity against a library of M. tuberculosis
overexpression mutants.
Following elimination of a Thy mechanism, we decided to use the broad approach of
screening against the remainder of the M. tuberculosis OE mutant library at the IDRI. The
M. tuberculosis OE mutant library screen is designed to identify the targets of novel compounds
or the mechanism of resistance to compounds in M. tuberculosis. This approach is based on the
concept that if the target of a compound is over-expressed, the bacteria will be more resistant to
that compound. By screening a library of clones that over-express individual proteins, it is possible
to identify the target or the mode of resistance of that compound. DAQA was screened against a
library of approximately 1700 recombinant M. tuberculosis clones that each over-express an
individual protein under the control of an anhydrotetracycline (ATc) responsive promoter. The
mutant library included predicted essential proteins [the majority predicted by transposon site
hybridization (TraSH)], as well as efflux pumps, regulatory proteins, and other proteins of interest.
The entire library was treated with DAQ-A at 2.75 µM, five times the MIC of 0.55 µM
determined at the IDRI against M. tuberculosis H37Rv wild-type (London Pride strain) in the
presence and absence of ATc.108 Growth was estimated by measuring the OD590 at day five with
compound and DMSO vehicle only and calculating the ratio. Clones that exhibited increased
growth over the mean and sufficient growth with DMSO were considered to express potential
targets and were selected for further study. Resistant clones were defined as those with a growth
ratio of ≥ 3 standard deviations above the mean or ≥ 0.41. Following treatment with DAQA, three
clones were selected for investigation. MICs were determined under both uninduced and induced
conditions (±150 ng/mL ATc).

30
Table 6. Resistance of Rv0953c, Rv2486, and Rv3500c M. tuberculosis OE mutants to 3.
Strain Rifampin MIC (µM) DAQ-A MIC (µM) Fold change from WTa
Uninduced Induced Uninduced Induced Uninduced Induced
Wild-type 0.0026 0.00 0.24 0.20 1.0 1.0
TOE Rv0953c 0.0044 0.01 0.91 1.3 3.8 6.5
TOE Rv2486 0.0017 0.00 0.40 0.42 1.7 2.1
TOE Rv3500c 0.0016 nd 1.4 nd 5.8 nd a fold change as compared to wild-type is given as a measure of resistance. nd – not determined; the growth of the
Rv3500c OE strain was insufficient to determine MIC in the presence of ATc.
Following screening, the Rv0953c OE mutant exhibited a shift toward resistance to DAQA,
which was more pronounced after induction of expression. A second clone overexpressing
Rv3500c showed resistance in uninduced conditions but induction of expression was detrimental
to growth. The third clone selected for follow-up, a Rv2486 OE mutant, only showed a two-fold
shift in MIC. This was deemed insignificant and the mutant deprioritized (Table 6).
Rv3500c (yrbE4B) encodes a putative ABC transporter predicted to be involved in lipid
catabolism. It is in the kstR regulon, which contains some 74 genes involved in the utilization of
diverse lipids for energy.109 YrbE4B is predicted to be required for growth on cholesterol.110
Rv0953c is predicted to be an F420-dependent oxidoreductase and is also in the kstR regulon.109
While Rv0953c is not yet characterized, F420-bearing enzymes of this class are absent in humans,
not well represented in prokaryotes, but present extensively in mycobacteria, including the reduced
genome of M. leprae, providing an attractive, although non-essential, target.111

31
2.2.9.2 M. tuberculosis transcription profile following diazaquinomycin A (3)
treatment.
With the aim of uncovering the DAQA MOA, we collaborated with the Clifton Barry lab
of the National Institute of Allergy and Infectious Diseases at the NIH to generate a transcription
profile of M. tuberculosis following treatment with the compound. This profile was generated
concurrently with those of well-studied TB inhibitors with the purpose of gaining insight into the
DAQA MOA by comparison. The transcription pattern revealed for DAQA was consistent at the
two tested concentrations, but without a close match from the known anti-TB compounds
(Figure 9). Thus, no definitive conclusions about a mechanism could be inferred from these results,
but some general characteristics of the DAQA mechanism could be inferred. Twenty-seven of the
Figure 9. Transcription profile of M. tuberculosis following treatment with 3.

32
thirty-two most down-regulated genes were transposases, while the most highly up-regulated
genes were those coding for the peroxidase katG (Rv1908c), iron-sulfur cluster restoration, and
the biosynthesis of two siderophores, mycobactin and exochelin. This combination of upregulated
genes is indicative of oxidative stress while the implications of downregulated transposases are
unknown.112 In general, there was a massive oxidative stress response implicated by DAQA that
was similar to that observed for known TB drugs CLF and BDQ (TMC207).113, 114 Despite these
similarities, DAQA did not have a similar effect on electron transport as CLF when tested in a
separate experiment (Appendix 2.1.2).
2.2.9.3 Institute for Tuberculosis Research (ITR) clofazimine-resistant mutants are
cross-resistant to diazaquinomycin A (3).
Following observation of an oxidative stress response in the microarray study, we tested
whether the mechanism was iron-dependent by screening strains of M. tuberculosis with DAQA
first on iron-depleted GAS media, then on GAS media supplemented with a range of iron
concentrations from 0 to 800 μg/L. Two clofazimine resistant mutants and a bedaquiline-resistant
mutant were selected for testing along with wild type in order to further assess commonality
between the DAQA mechanism and that of clofazimine or bedaquiline (Table 7). While no
connection between iron concentration and activity was observed, two additional observations
were made.
We first observed that M. tuberculosis strains were more susceptible to DAQA when they
were grown on GAS media at any iron concentration than when grown on 7H12 media. This
phenomenon had one exception in the bedaquiline-resistant strain rTMC207 (BK12), which has a
atpE subunit c mutation. Why DAQA activity remains consistent between media types only in this
mutant is as of yet unexplained. We subsequently investigated this difference in activities between

33
media types for the other strains by substituting the glycerol carbon source in GAS media with the
palmitic acid carbon source from 7H12 media, but were unable to identify a significant trend.
Table 7. Effect of iron concentration and nutrient composition on anti-TB activity of 3.
Media (ferric ammonium citrate conc., μg/L)
Compound Mtb strain 7H12 (40) GAS (0) GAS (50) GAS (200) GAS (800)
DAQA
H37Rv 0.30 < 0.10 < 0.10 < 0.10 < 0.10
rCLF1 3.00 0.50 0.33 0.38 0.37
rCLF4 2.26 0.48 0.45 0.42 0.36
rTMC207(BK12) 0.16 0.16 0.17 0.18 0.16
RMP
H37Rv 0.03 0.04 0.05 0.06 0.03
rCLF1 0.08 0.10 0.05 0.03 0.01
rCLF4 0.03 0.03 0.03 0.01 0.01
rTMC207(BK12) 0.01 0.03 0.01 0.01 0.02
INH
H37Rv 0.19 0.15 0.15 0.15 0.14
rCLF1 0.15 0.15 0.12 0.18 0.14
rCLF4 0.29 0.12 0.52 0.29 0.20
rTMC207(BK12) 0.15 0.08 0.13 0.14 0.13
PA-824
H37Rv 0.10 0.22 0.54 0.72 0.39
rCLF1 > 26 > 26 > 26 > 26 > 26
rCLF4 > 26 > 26 > 26 > 26 > 26
rTMC207(BK12) 0.10 0.14 0.38 0.42 0.29
TMC207
H37Rv 0.73 0.86 0.83 0.85 0.65
rCLF1 1.86 1.24 1.25 1.67 1.58
rCLF4 1.59 1.81 1.58 1.70 1.64
rTMC207(BK12) 5.97 3.29 3.28 3.21 3.09
CLF
H37Rv 0.26 0.28 0.08 0.14 0.11
rCLF1 2.00 1.95 1.19 1.97 1.81
rCLF4 1.37 2.10 1.74 1.86 1.54
rTMC207(BK12) 0.14 0.29 0.15 0.15 0.14
The second observation was that mutant strains rCLF1 and rCLF4, products of an
unpublished spontaneous clofazimine-resistant mutant generation study in the ITR, exhibited a
cross-resistance to DAQA with a nine-fold increase in MIC on all media types. This was a
welcome discovery as we have yet to achieve generation of spontaneous M. tuberculosis H37Rv
mutants resistant to DAQA for genome sequencing. Thus far, each attempt results in an abundance
of phenotypically resistant colonies rather than a few truly resistant strains. These rCLF mutant
strains also exhibit marked cross-resistance to PA-824 and other nitroimidazoles due to mutations

34
in F420 cofactor biosynthesis genes, which are involved in the pro-drug activation mechanism of
these compounds, as well as cross-resistance to bedaquiline (TMC207) due to mutations in the
MmpL5 efflux suppressor gene. 115, 116
2.2.9.4 Diazaquinomycin A (3) activity against M. tuberculosis strains with efflux
regulator, pyrimidine biosynthesis, and F420 biosynthesis gene mutations.
Upon discovery of the DAQA cross-resistant mutants rCLF1 and rCLF4, we compared the
genomes of each strain with the aim of identifying a common mutation responsible for resistance.
Of the eight total mutations between them, those shared were present in the MmpL5 efflux pump
transcriptional repressor gene (Rv0678) and the orotate phosphoribotransferase gene (Rv0382c;
pyrE) from the pyrimidine biosynthesis pathway, while two others were mutations in separate
genes (Rv1173; fbiC and Rv3261; fbiA) within the F420 biosynthetic pathway (Table 8). The
mutation in the Rv0678 transcription repressor allows for efflux of clofazimine and bedaquiline
by the MmpL5 pump, orotate phosphoribosyltransferase (PyrE) is involved in catalyzing the
synthesis of pyrimidine biosynthesis intermediate orotidine 5'-monophosphate (OMP), and F420 is
Table 8. Genes and their descriptions from DAQA-resistant strains rCLF1 and rCLF4.
Gene Name
Enzyme function rCLF1 rCLF4
Rv0382c Rv0382c orotate phosphoribosyltransferase (PyrE); pyrimidine biosynthesis
Rv0678 Rv0678 MmpL5 efflux pump transcriptional repressor
Rv3261 a probable F420 biosynthesis protein (FbiA)
Rv1173 a probable FO synthase (FbiC)
Rv2932 phenolpthiocerol synthesis type-I polyketide synthase (PpsB)
Rv0552 hypothetical amidohydrolase
Rv0050 involved in peptidoglycan biosynthesis (PonA1)
Rv1392 probable S-adenosylmethionine synthetase (MetK)
a Rv3261 and Rv1173 are separate genes but code for enzymes in the same pathway. Gray rows indicate
mutations shared between ITR strains rCLF1 and rCLF4.
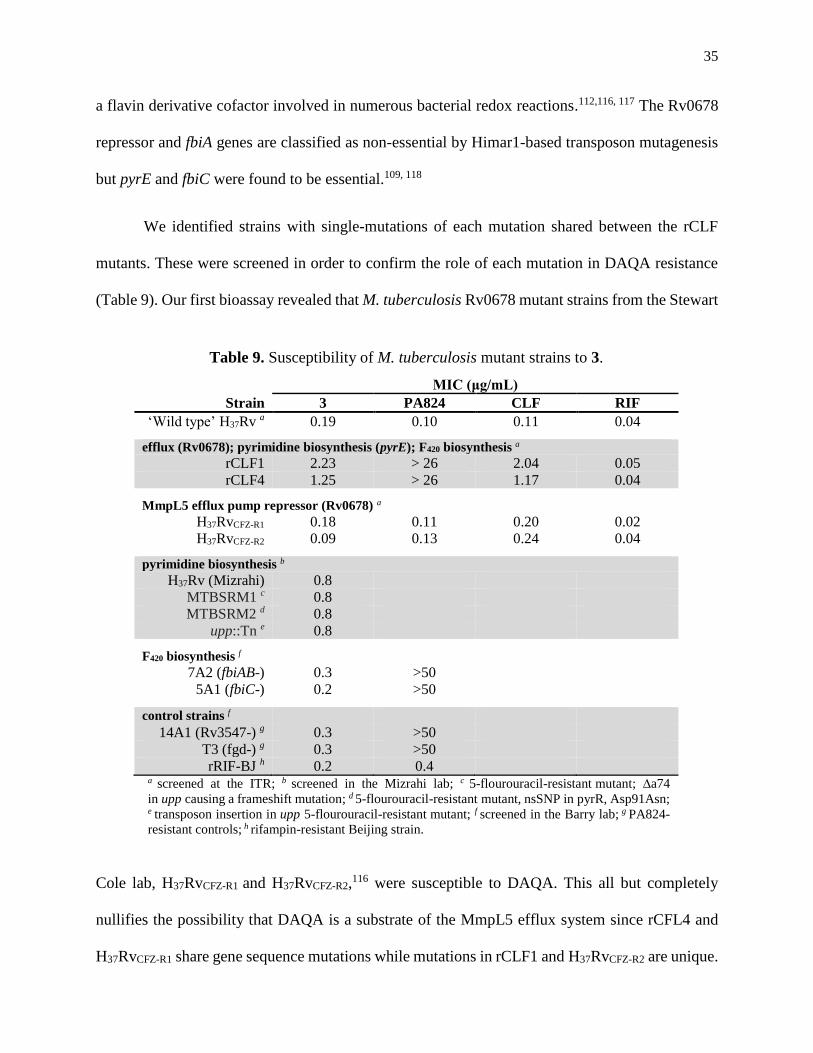
35
a flavin derivative cofactor involved in numerous bacterial redox reactions.112,116, 117 The Rv0678
repressor and fbiA genes are classified as non-essential by Himar1-based transposon mutagenesis
but pyrE and fbiC were found to be essential.109, 118
We identified strains with single-mutations of each mutation shared between the rCLF
mutants. These were screened in order to confirm the role of each mutation in DAQA resistance
(Table 9). Our first bioassay revealed that M. tuberculosis Rv0678 mutant strains from the Stewart
Cole lab, H37RvCFZ-R1 and H37RvCFZ-R2,116 were susceptible to DAQA. This all but completely
nullifies the possibility that DAQA is a substrate of the MmpL5 efflux system since rCFL4 and
H37RvCFZ-R1 share gene sequence mutations while mutations in rCLF1 and H37RvCFZ-R2 are unique.
Table 9. Susceptibility of M. tuberculosis mutant strains to 3.
MIC (μg/mL)
Strain 3 PA824 CLF RIF
‘Wild type’ H37Rv a 0.19 0.10 0.11 0.04
efflux (Rv0678); pyrimidine biosynthesis (pyrE); F420 biosynthesis a
rCLF1 2.23 > 26 2.04 0.05
rCLF4 1.25 > 26 1.17 0.04
MmpL5 efflux pump repressor (Rv0678) a
H37RvCFZ-R1 0.18 0.11 0.20 0.02
H37RvCFZ-R2 0.09 0.13 0.24 0.04
pyrimidine biosynthesis b
H37Rv (Mizrahi) 0.8
MTBSRM1 c 0.8
MTBSRM2 d 0.8
upp::Tn e 0.8
F420 biosynthesis f
7A2 (fbiAB-) 0.3 >50
5A1 (fbiC-) 0.2 >50
control strains f
14A1 (Rv3547-) g 0.3 >50
T3 (fgd-) g 0.3 >50
rRIF-BJ h 0.2 0.4 a screened at the ITR; b screened in the Mizrahi lab; c 5-flourouracil-resistant mutant; ∆a74
in upp causing a frameshift mutation; d 5-flourouracil-resistant mutant, nsSNP in pyrR, Asp91Asn; e transposon insertion in upp 5-flourouracil-resistant mutant; f screened in the Barry lab; g PA824-
resistant controls; h rifampin-resistant Beijing strain.
36
We also screened for inhibition of the pyrimidine biosynthesis pathway in collaboration
with the Mizrahi lab at The University of Cape Town. An M. tuberculosis strain with
anhydrotetracycline-inducible expression (pyrE Tet-ON) was developed according to published
methods to facilitate exploration of this enzyme and it’s potential as a target for anti-tuberculosis
treatment.119 Interestingly, no sensitivity was observed in the pyrE Tet-ON mutant when it was
treated with DAQA in the absence of anhydrotetracycline. Importantly, this strain is unstable and
so far, not validated for PyrE conditional expression level. These negative results were supported
when 0.39 to 100 µM concentrations of uracil, a downstream product of the PyrE enzyme, were
unable to rescue H37Rv treated with DAQA. In a previous report, the Mizrahi lab described the
anti-tuberculosis activity of 5-flourouracil (5-FU) and its MOA within the pyrimidine biosynthesis
salvage pathway.119 With this in mind, we screened DAQA and 5-FU in combination against TB
with the aim of identifying synergy that would suggest pyrimidine biosynthesis inhibition, but no
synergy was observed between the tested 5-FU concentrations of 0.39 to 100 µM. Pyrimidine
salvage pathway mutant strains, MTBSRM1 and MTBSRM2, were also screened and both were
susceptible. The observed MICs in all Mizrahi lab screenings were slightly greater than the
reported MIC (0.1 µg/ml) possibly due to the strain difference and/or precipitation of the
compound, which was observed in test wells containing the highest concentrations of 6.4 and 3.2
µg/ml. Together, these studies eliminate the possibility that the DAQA mechanism involves
disruption of pyrimidine biosynthesis despite the pyrE gene mutation presence in both of the ITR
rCLF mutant strains. This left one remaining possibility.
Having nearly eliminated the shared mutations between rCLF1 and rCLF4 in Rv0678 and
pyrE as target candidates, we then decided to explore whether mutations shared in F420 biosynthesis
were indicative of inhibition of that pathway by 3. Possible additional support for F420 involvement
was found when the gene for the putative F420-dependent Rv0953c protein was a target candidate

37
revealed in the aforementioned OE panel screening at the IDRI. Surprisingly, these final mutations
were also eliminated as possible target candidates when DAQA was able to inhibit M. tuberculosis
strains 7A2 (fbiAB-) and 5A1 (fbiC-) with the same potency as the wild type when tested through
a collaboration with the Clifton Barry lab at the NIH. Additional screenings against environmental
actinomycetes based on the recognition that these microbes also utilize biochemical pathways
dependent on F420 show some promise of assisting with MOA studies but were incomplete and
inconclusive regarding the role of F420 (Appendix A2.1.3).
2.3 Methods.
2.3.1 General experimental procedures for the isolation and characterization of
diazaquinomycins H (1) and J (2).
UV spectra were measured on a Shimadzu Pharma Spec UV-1700 spectrophotometer.
NMR spectra were obtained on a Bruker 600 MHz DRX NMR spectrometer equipped with an
inverse 5 mm TXI cryogenic probe with z-axis pfg and XWINNMR version 3.5 operating
software, and a 900 (226.2) MHz Bruker AVANCE NMR spectrometer equipped with an inverse
5 mm TCI cryogenic probe with z-axis pfg and TopSpin version 1.3 operating software at the
University of Illinois at Chicago Center for Structural Biology. Chemical shifts (δ) are given in
ppm and coupling constants (J) are reported in Hz. 1H and 13C NMR resonances of 1 and 2 are
reported in Table 2. 1H and 13C NMR chemical shifts were referenced to the CDCl3 with vapor
TFA solvent signals (δH 7.26 ppm and δC 77.0 ppm, respectively). High resolution mass spectra
(HRMS) were obtained on a Shimadzu IT-TOF LC-MS spectrometer at the University of Illinois
at Chicago Research Resources Center. High-performance liquid chromatography (HPLC-UV)
data were obtained using a Hewlett-Packard series 1100 system controller and pumps with a Model
G1315A diode array detector (DAD) equipped with a reversed-phase C18 column (Phenomenex
Luna, 100 × 4.6 mm, 5 μm) at a flow rate of 0.5 mL • min−1. Semi-preparative scale HPLC
separations were performed using a Hewlett Packard Series 1050 system with a Phenomenex Luna

38
semi-preparative C18 column (250 × 10 mm, 5 μm) at a flow rate of 2.4 mL • min−1. Preparative
scale HPLC separations were performed using a Waters LC4000 System equipped with a
Phenomenex Luna preparative C18 column (250 × 21.2 mm, 5 μm) at a flow rate of 16 mL • min−1.
Silica gel column chromatography was conducted using Bonna-Angela Technologies Cleanert®
silica gel with an average particle size of 40-60 μm and an average pore size of 60 Å.
2.3.2 Collection and identification of actinomycete strain B026.
Strain B026 was isolated from a sediment sample collected by PONAR at a depth of 56 m, from
ca. 16.5 miles off the coast north of Milwaukee, WI in Lake Michigan (431327 N,
873412 W) on August 23, 2010. Strain B026 (GenBank accession number KP009553) shared
100% 16S rRNA gene sequence identity with the type strain Micromonospora maritima strain
D10-9-5 (GenBank accession number NR109311).120
2.3.3 Fermentation and extraction.
Strain B026 was grown in 28 × 1 L portions in Fernbach flasks containing high nutrient
A1 medium (0.5 L of filtered Lake Michigan water, 0.5 L DI water, 10 g starch, 4 g yeast extract,
2 g peptone, 1 g calcium carbonate, 100 mg potassium bromide, and 40 mg iron sulfate) for 5 days
at 21 °C while shaking at 220 rpm. Sterilized Amberlite XAD-16 resin (15 g·L−1) was added to
each flask to absorb the extracellular secondary metabolites. The culture medium and resin were
shaken for 8 h and filtered using cheesecloth to remove the resin. The resin, cell mass, and
cheesecloth were extracted with acetone overnight, concentrated under vacuum, and partitioned
between water and ethyl acetate. The organic layer was dried under vacuum to afford 1.1 g of
extract.
2.3.4 Isolation and characterization of diazaquinomycin H (1) and
diazaquinomycin J (2) from strain B026 fermentation broth.
Strain B026 was grown in 28 L for 5 days at 21 °C while shaking at 220 rpm. The
extracellular secondary metabolites were absorbed from the fermentation broth using Amberlite

39
XAD-16 resin, followed by extraction with acetone, and partitioning between water and ethyl
acetate. The organic layer was dried under vacuum to afford 1.1 g of extract.
The organic layer from the liquid-liquid partition was fractionated using silica gel flash
column chromatography (100 g of silica) eluting with an isocratic 95% chloroform (CHCl3):5%
methanol (MeOH) solvent system to afford 15 fractions. Using bioassay-guided fractionation, it
was determined that fraction 2 contained the bioactive constituents, thus it was separated using
RP-C18 preparative HPLC (16 mL • min−1, gradient of 50% aqueous acetonitrile (ACN) to 100%
ACN for 20 min, followed by an isocratic flow of 100% ACN for 10 min) to afford five fractions.
Compounds 1 and 2 were observed in fractions 3 and 4, respectively.
To further isolate 1, fraction 3 was separated using RP-C18 semi-preparative HPLC (2.4
mL • min−1, gradient of 50% aqueous ACN to 100% ACN for 25 min, followed by an isocratic
flow of 100% ACN for 15 min) to afford 4 fractions. Fraction 4 was determined to contain 1 and
was further purified using RP-C18 semi-preparative HPLC (2.4 mL • min−1, gradient of 50%
aqueous ACN to 100% ACN for 25 min, followed by an isocratic flow of 100% ACN for 15 min)
to afford diazaquinomycin H (1, tR 18.6 min, 0.3 mg, 0.00026% yield).
To further isolate 2, fraction 4 was separated further using RP-C18 semi-preparative HPLC
(2.4 mL • min−1, gradient of 50% aqueous ACN to 100% ACN for 25 min, followed by an isocratic
flow of 100% ACN for 15 min) to afford 5 fractions. Fraction 3 was separated further using RP-C18
semi-preparative HPLC (2.4 mL • min−1, gradient of 50% aqueous ACN to 100% ACN for 25 min,
followed by an isocratic flow of 100% ACN for 15 min) to afford 5 fractions. Fraction 4 was
determined to contain 2 and was further purified using RP-C18 semi-preparative HPLC (2.4 mL •
min−1, gradient of 50% aqueous ACN to 100% ACN for 25 min, followed by an isocratic flow of
100% ACN for 15 min) to afford diazaquinomycin J (2, tR 22.0 min, 0.3 mg, 0.00026% yield).
40
Diazaquinomycin H (1): Red solid (0.3 mg). UV (MeOH) λmax (log ε) = 278 (3.83), 301
(3.72), 357 (3.26) and a broad absorption with maximum at 472 (2.59) nm. 1H NMR (900 MHz,
CDCl3 - 1% CF3CO2D) and 13C NMR (226.2 MHz, CDCl3 - 1% CF3CO2D), see Table 2. HR-ESI-
IT-TOF MS m/z 383.1993 [M + H]+ (calcd. for C22H27N2O4: 383.1971), m/z 381.1771 [M - H]-
(calcd. for C22H25N2O4: 381.1820), m/z 765.3778 [2M + H]+ (calcd. for C44H53N4O8: 765.3863)
and m/z 763.3639 [2M - H]- (calcd. for C44H51N4O8: 763.3712).
Diazaquinomycin J (2): Red solid (0.3 mg). UV (MeOH) λmax (log ε) = 278 (3.37), 300
(3.26), 356 (2.90) and a broad absorption with maximum at 472 (2.44) nm. 1H NMR (900 MHz,
CDCl3 - 1% CF3CO2D) and 13C NMR (226.2 MHz, CDCl3 - 1% CF3CO2D), see Table 2. HR-ESI-
IT-TOF MS m/z 397.2162 [M + H]+ (calcd. for C23H29N2O4: 397.2127), m/z 395.1924 [M - H]-
(calcd. for C23H27N2O4: 395.1976), m/z 793.4129 [2M + H]+ (calcd. for C46H57N4O8: 793.4176)
and m/z 791.3825 [2M - H]- (calcd. for C46H55N4O8: 791.4025).
2.3.5 M. tuberculosis fermentation for determination of minimum inhibitory
concentration (MIC).
M. tuberculosis H37Rv (ATCC 27294) was purchased from American Type Culture
Collection (ATCC) while the derivative M. tuberculosis strain mc27000 (H37Rv ΔRD1 ΔpanCD)
was acquired from the laboratory of Dr. William R. Jacobs Jr. at the Howard Hughes Medical
Institute, Department of Microbiology and Immunology, Albert Einstein College of Medicine,
Bronx, NY.121 These strains were cultured to late log phase in the 7H12 media, Middlebrook 7H9
broth supplemented with 0.2% (vol/vol) glycerol, 0.05% Tween™ 80, and 10% (vol/vol) oleic
acid-albumin-dextrose-catalase (OADC). The culture was harvested and resuspended in
phosphate-buffered saline. Suspensions were then filtered through 8 μm filter membranes and
frozen at 80 °C. Prior to use of bacterial stocks for the anti-TB assay, CFUs were determined by
plating on 7H11 agar media. The MIC is defined here as the lowest concentration resulting in

41
≥90% growth inhibition of the bacteria relative to untreated controls. MIC against replicating M.
tuberculosis was measured by the Microplate Alamar Blue Assay (MABA).93, 94
2.3.6 Low oxygen recovery assay (LORA).
The luciferase reporter gene luxABCDE-recombinant M. tuberculosis was prepared as
previously reported.96 The bacteria were adapted to low oxygen conditions during culture in a
BioStatQ fermenter. The low oxygen-adapted culture was exposed to test samples in a 96-well
microplate for 10 days at 37 °C in a hypoxic environment created with an Anoxomat (WS-8080,
MART Microbiology). The cultures were then transferred to a normoxic environment at 37 °C for
28 hours. Viability was assessed by the measurement of luciferase-mediated luminescence. The
LORA MIC was defined as the lowest concentration effecting a reduction of luminescence of
≥90% relative to untreated cultures.
2.3.7 Determination of cytotoxicity.
Vero (ATCC CRL-1586) cells were cultivated in 10% fetal bovine serum (FBS) in Eagle
minimum essential medium.122, 123 The culture was incubated at 37 °C under 5% CO2 in air and
then diluted with phosphate-buffered saline to 106 cells/mL. Two-fold serial dilutions of testing
samples with a final volume of 200 μL cell culture suspension were prepared in a transparent 96-
well plate (Falcon Microtest 96). After 72 h incubation at 37 °C, the medium was removed and
monolayers were washed twice with 100 μL of warm Hanks balanced salt solution (HBSS). 100 μL
of medium and 20 μL of MTS-PMS (Promega) were added to each well. Plates were then incubated
for 3 hours and cytotoxicity was determined by the measurement of absorbance at 490 nm.
Human melanoma MDA-MB-435 cancer cells, human breast MDA-MB-231 cancer cells,
human ovarian OVCAR3 cancer cells and human colon HT-29 cancer cells were purchased from
the ATCC (Manassas, VA). The cell line was propagated at 37 °C in 5% CO2 in RPMI 1640
medium, supplemented with fetal bovine serum (10%), penicillin (100 units/ml), and streptomycin

42
(100 µg/ml). Cells in log phase growth were harvested by trypsinization followed by two washings
to remove all traces of enzyme. A total of 5,000 cells were seeded per well of a 96-well clear, flat-
bottom plate (Microtest 96®, Falcon) and incubated overnight (37 °C in 5% CO2). Samples
dissolved in DMSO were then diluted and added to the appropriate wells (concentrations:
20 µg/mL, 4 µg/mL, 0.8 µg/mL, 0.16 µg/mL, 0.032 µg/mL; total volume: 100 µL; DMSO: 0.5%).
The cells were incubated in the presence of test substance for 72 h at 37 °C and evaluated for
viability with a commercial absorbance assay (CellTiter 96® AQueous One Solution Cell
Proliferation Assay, Promega Corp, Madison, WI) that measured viable cells. LC50 values are
expressed in µg/mL relative to the solvent (DMSO) control.
Human ovarian OVCAR4 and Kuramochi cancer cells were maintained in RPMI 1640
(11875-093, Life-technologies) supplemented with 10% FBS (16000-044, Life-technologies) and
1% penicillin/streptomycin. Non-cancerous murine ovarian surface epithelium (MOSE) and
murine oviductal epithelium (MOE) cells were maintained as previously reported.124
Concentration-response experiments were performed as previously described for 72 hours.89
2.3.8 Minimum inhibitory concentration (MIC) determination against drug-resistant
M. tuberculosis isolates.
M. tuberculosis strains individually resistant to rifampin (RMP, ATCC 35838), isoniazid
(INH, ATCC 35822), streptomycin (SM, ATCC 35820), cycloserine (CS, ATCC 35826) and
kanamycin (KM, ATCC 35827) were obtained from the American Type Culture Collection
(ATCC). M. tuberculosis strains resistant to clofazimine (H37RvCFZ-R1 and H37RvCFZ-R2) were
obtained from the lab of Stewart Cole at the École Polytechnique Fédérale de Lausanne in
Switzerland. Bedaquiline-resistant M. tuberculosis strain rTMC207 (BK12) was obtained from the
Belgian Coordinated Collections of Microorganisms (BCCM). Cultures were prepared and MICs

43
against drug-resistant M. tuberculosis isolates were determined by the MABA as described above
for M. tuberculosis H37Rv.
M. tuberculosis mutant strains 7A2 (fbiAB-), 5A1 (fbiC-), 14A1 (Rv3547-), and T3 (fgd-)
were generated in a previous study,125 while rRIF-BJ was a rifampin-resistant strain with a
Ser531Leu rpoB mutation (confirmed by PCR of rpoB) generated in the Barry lab from strain
K04b00DS.126 Screening against these strains took place in the Barry lab. DMSO stocks of 3 and
PA824 were diluted in 7H9/ADC/Tw as a two-fold serial dilution series in duplicate at 50 µL per
well in clear round-bottom 96-well plates (Thermo Scientific #163320) leaving a drug-free
medium control in column 12. M. tuberculosis H37Rv (ATCC 27294) and the aforementioned
strains were cultured in 7H9/ADC/Tw to an OD650 of 0.2 and diluted 1:1000 in the same medium
followed by addition of 50 µL of the diluted cell suspension to each well. The plates were
incubated at 37 °C in sealed bags for one week after which growth was recorded using an inverted
enlarging mirror. The MIC was taken as the concentration that completely inhibited all visible
growth.
M. tuberculosis mutant strains MTBSRM1d, MTBSRM2e, and upp::Tnf were generated
by the Mizrahi lab in a previous study,119 while H37Rv (ATCC 27294) was acquired from the
ATCC, and pyrE Tet-ON is as yet unpublished. Screening of 3 against these strains, along with
the uracil supplementation experiment, and the 5-FU synergy experiment were performed in the
Mizrahi lab following previously published methods.119
2.3.9 Minimum inhibitory concentration (MIC) determination against non-
tuberculous mycobacteria (NTM).
Mycobacterium smegmatis (mc2155), Mycobacterium abscessus (ATCC 19977),
Mycobacterium chelonae (ATCC 35752), Mycobacterium avium (ATCC 15769), Mycobacterium
marinum (ATCC 927), Mycobacterium kansasii (ATCC 12478), and Mycobacterium bovis BCG
44
(ATCC 35734) were obtained from the American Type Culture Collection (ATCC). Cultures were
prepared and MICs against these mycobacteria were determined by the MABA as described above
for M. tuberculosis H37Rv. M. abscessus was incubated with 7H12 medium at 37 °C for 3 days
and for an additional 4 hours after adding 12 μL of 20% Tween™ 80 and 20 μL of Alamar blue
dye. M. bovis was incubated with 7H12 medium at 37 °C for 7 days, and an additional 1 day of
incubation after adding 12 μL of 20% Tween™ 80 and 20 μL of Alamar blue dye. M. chelonae
was incubated with 7H9 medium at 30 °C for 3 days, plus an additional 6 days of incubation after
adding 12 μL of 20% Tween™ 80 and 20 μL of Alamar blue dye. M. marinum was incubated with
7H9 medium at 30 °C for 5 days, and an additional 1 day of incubation after adding 12 μL of 20%
Tween™ 80 and 20 μL of Alamar blue dye. M. avium and M. kansasii were incubated with 7H9
media at 37 °C for 6 days, plus an additional day of incubation after adding 12 μL of 20%
Tween™ 80 and 20 μL of Alamar blue dye. Viability was assessed by measuring fluorescence at
530 nm excitation/590 nm emission with a Victor3 multilabel reader (PerkinElmer).
2.3.10 Minimum inhibitory concentration (MIC) determination against Gram-positive
and Gram-negative bacteria.
The following Gram-positive and Gram-negative reference organisms were obtained from
the ATCC: Methicillin-sensitive Staphylococcus aureus (ATCC 29213), methicillin-resistant
Staphylococcus aureus (ATCC 33591), Enterococcus faecalis (ATCC 29212), Enterococcus
faecium (ATCC 19434), vancomycin-resistant Enterococcus faecium (ATCC 51559),
Streptococcus pneumoniae (ATCC49619), Streptococcus pyogenes Rosenbach
(ATCC BAA-1633), Bacillus cereus (ATCC 14579), Bacillus cereus (ATCC 10987), Bacillus
thuringiensis serovar konkukian str. 97-27, Acinetobacter baumannii (ATCC 19606), Escherichia
coli (ATCC 25922), Enterobacter cloacae (ATCC 13047), Klebsiella pneumoniae
(ATCC 13883), Pseudomonas aeruginosa (ATCC 27853), and Proteus mirabilis (ATCC 29906).
Bacillus subtilis subsp. subtilis 168 is a laboratory strain and Bacillus anthracis Sterne was

45
obtained from Philip C. Hanna at the University of Michigan, Ann Arbor. Positive controls
piperacillin, ampicillin, vancomycin and gentamicin were obtained from Sigma-Aldrich, while
daptomycin was obtained from Fisher Scientific; each was used to prepare a stock solution of at
least 1280 µg/mL on the same day of each experiment. Inocula for MSSA, MRSA, E. faecalis, E.
faecium, VRE, A. baumannii, E. coli, E. cloacae, K. pneumoniae, P. aeruginosa, and P. mirabilis
consisted of 5 x 10⁵ CFU/mL of each bacterial species with determination of MICs by broth
microdilution in duplicate according to Clinical Laboratory Standards Institute (CLSI) guidelines
with growth scored by visual observation of turbidity.97 The MIC against S. pneumoniae
(ATCC 49619) was determined by broth microdilution method using a 4 x 10⁵ CFU/mL inoculum
as described in the National Committee on Clinical Laboratory Standards (NCCLS)127, 128 with
viability assessed by spectrophotometric readout at 490 nm using a Victor3 multilabel reader
(PerkinElmer). Inocula for S. pyogenes consisted of approximately 5 x 10⁶ CFU/mL with
determination of MICs by broth microdilution with growth scored by optical density (OD) at 625
nm using a Biotek Synergy 2 Microplate Reader. Each Bacillus inoculum consisted of 1 x 10⁵ to
2 x 10⁵ CFU/mL, with determination of MICs by broth microdilution and growth scored by visual
observation of turbidity.
2.3.11 Characterization of diazaquinomycin A (3) in vivo.
Approval for animal studies was provided by the Office of Animal Care and Institutional
Biosafety (OACIB) Institutional Biosafety Committee (IBC), case no. 12-183. Compound 3 was
prepared in a dosing vehicle of 10% polyethylene glycol 400 (PEG 400), 10% polyoxyl 35 castor
oil (Kolliphor® EL, BASF), and 80% oleic acid for all in vivo studies. To test tolerance of the
compound, the formulation was administered by oral gavage at 100 mg/kg of 3 to a pair of female
BALB/c mice once daily for five days followed by observation for qualitative indicators of toxicity
(e.g. weight loss, ragged fur, huddling).

46
For PK assessment of 3, Twenty-four 7 - 10 week old male Balb/c mice were separated
into two groups; one group of twelve for dosing 100 mg/kg in 10 µL/kg by oral gavage and the
other group of twelve for dosing 50 mg/kg in 5 µL/kg by intraperitoneal injection. Body weight
was measured on the first day of dosing. Regular rodent chow and autoclaved tap water was
provided to all animals ad libitum. From three animals at each of four time points of 0.5, 1, 2, and
4 hours, blood samples (>500 µL) were collected post dosing through terminal orbital bleeds using
CO2/O2 and collected in K2EDTA microtainers before being placed on wet ice. The microtainers
were centrifuged at 3000 rpm for 15 min at 4 °C after which plasma samples were aliquoted and
stored frozen at -80 °C until further analysis. Following blood collection, all animals were
euthanized first by carbon dioxide asphyxiation then cervical dislocation. Both lobes of the lung
were removed, washed clean with saline, flash frozen in liquid nitrogen, transferred on dry ice,
and stored at -80 °C until transport on dry ice for further analysis.
Plasma aliquots of 100 µL were mixed with 5 µL 100 µM 4 internal standard stock solution,
then mixed with 395 µL acetonitrile at 27 °C (0.5% formic acid, 1% DMSO). The mixtures were
centrifuged at 10K g for 30 min at 22 °C. 100 µL supernatants were frozen at -80 °C overnight
and analyzed by LC-MS2 on the Agilent triple-quad 6410 (QQQ) the following day.
Lung samples were washed in phosphate-buffered saline (PBS), dried with paper towel,
and weighed. To each sample, 3 mL PBS per gram of tissue was added and sample was
homogenized by probe sonication. The homogenates were centrifuged at 10K g (9800 RPM on
Eppendorf 5417R) for 30 min at 4 °C. Resulting supernatant aliquots of 100 µL of were mixed
with 5 µL 100 µM 4 internal standard stock solution, then mixed with 395 µL of acetonitrile at 27
°C (0.5% formic acid, 1% DMSO), The mixtures were then centrifuged at 10K g for 30 min at 22
°C. 100 µL supernatants were frozen at -80 °C overnight and analyzed by LC-MS2 on the QQQ
the following day.

47
All samples were analyzed using RP-C18 analytical HPLC (10 µL injection, 0.3 mL • min−1,
isocratic 50% aqueous acetonitrile (ACN) for 1 min followed by a gradient of 50% aqueous ACN
to 100% ACN over two min, and an isocratic 95% aqueous ACN wash for three min) followed by
selected ion monitoring on an Agilent triple-quad 6410 (QQQ). DAQA (tR = 1.5 min) was
observed at the quantitative ion transition of 355.3 m/z 297.2 m/z and the qualitative ion
transitions of 355.3 m/z 323.1 m/z and 355.3 m/z 270.1 m/z. Compound 4 (tR = 1.0 min) was
the internal standard and was monitored at the quantitative ion transition of 299.2 m/z 271.1 m/z
and the qualitative transitions of 299.2 m/z 253.0 m/z and 299.2 m/z 228.1 m/z.
In vivo efficacy studies were performed in the lab of Michael Cynamon at the VA Medical
Center in Syracuse, NY. Mice were contained in microisolator cages (Lab Products inc. Maywood,
NJ) and provided water and Prolab RMH 3000 rodent chow (Purina, St. Louis, MO).
M. tuberculosis str. Erdman (ATCC 35801) was obtained from the ATCC (Manassas, VA). Mice
were anesthetized by intramuscular injection with a telazol (45 mg/kg)/xylazine (7.5mg/kg)
cocktail (Lederle Parenterals, Carolina, Puerto Rico and Bayer Corp., Shawnee Mission, Kansas,
respectively) to facilitate the infection procedure. Treatment of six 6-week-old female Balb/c mice
(Charles River Laboratories, Wilmington, DE) was initiated 21 days after intranasal infection with
~3.12 × 10² CFU of M. tuberculosis str. Erdman per mouse. A volume of 0.2 ml of the
aforementioned formulation of 3 was delivered by oral gavage for five days per week for two
weeks. In addition, there were six early control mice that were euthanized at the commencement
of DAQA treatment to determine baseline infection CFUs and four late control mice that were
treated with 0.2 ml of the formulation vehicle only by oral gavage in parallel with the experimental
group to determine final infection CFUs and confirm virulence. As a positive control, eight
additional mice were administered 10 mg/kg RIF dissolved in 20% DMSO and 80% ddH2O orally
by gavage using the same schedule as DAQA. The mice were all euthanized by CO2 asphyxiation.

48
Right lungs were removed aseptically and frozen at -70 °C until processing. Lungs were thawed
and homogenized in saline with Tween™ 80 using a sealed tissue homogenizer (IdeaWorks!
Laboratory Devices, Syracuse, NY), then diluted further in sterile water with Tween™ 80. The
homogenate was plated on 7H10 agar (BD Diagnostic Systems, Sparks, MD) with 10% OADC
(BBL Microbiology Systems, Cockeysville, MD) and 0.2% glycerol followed by incubation for
four weeks at 37 °C in ambient air before counting.
2.3.12 Synthesis of diazaquinomycin derivatives.
Chemical reagents benzoyl peroxide, methyl iodide, silver(I) oxide, carbon tetrachloride,
chloroform, dichloromethane, N,N-dimethylformamide, morpholine, N-bromosuccinimide,
sodium carbonate, and sulfuric acid were all purchased from Sigma-Aldrich (St. Louis, MO), while
ethanol and methanol were purchased from Fisher Scientific. All reagents were used without
additional purification. Preparative thin layer chromatography was performed following reactions
using EMD Millipore PLC silica gel 60 F254 20 cm × 20 cm × 0.5 mm glass plates and
Phenomenex Strata SI-1 silica (55µm, 7Å) 1000mg/6mL SPE cartridges unless noted otherwise.
1H NMR spectra were acquired on a Bruker 600 MHz DRX NMR spectrometer equipped with an
inverse 5 mm TXI cryogenic probe with z-axis pfg and XWINNMR version 3.5 operating
software. 1H NMR chemical shifts were referenced to CDCl3 solvent signals (δH 7.26 ppm and
δC 77.0 ppm, respectively). Synthesis of bis(morpholino)diazaquinomycin A and its three
intermediates was achieved using methods described by Tsuzuki, et al. with modifications to the
chromatography steps to accommodate use of preparative thin layer chromatography.95
Purification of the bis(methoxy)diazaquinomycin A intermediate was achieved by silica gel
column chromatography eluting with a 1:6 ratio of ethyl acetate : hexanes to result in 68.5 mg
(42.3% yield). Purification of the bis(bromo)bis(methoxy)diazaquinomycin A intermediate was
achieved by silica gel SPE eluting with 100 % methylene chloride to result in 60.8 mg (63% yield).

49
Purification of the bis(methoxy)bis(morpholino)diazaquinomycin A intermediate was achieved by
preparative thin layer chromatography using 3.5% methanol in 100 mL methylene chloride to
result in 14.7 mg (23.6% yield). Finally, purification of the bis(morpholino)diazaquinomycin A
product was achieved using silica gel column chromatography as previously reported to result in
6.3 mg (45.1% yield).95 Synthesis of 7 and 8 was achieved using methods described by Omura,
et al.92 Purification of 7 and 8 was achieved by RP-C18 preparative HPLC (16 mL·min−1, gradient
of 50% aqueous acetonitrile (ACN) to 100% ACN for 20 min, followed by an isocratic flow of
100% ACN for 10 min) to afford 5.4 mg and 2.2 mg (46.0% and 18.7% yield) of each product,
respectively.
2.3.13 Attempt at whole-cell biocatalysis of hydroxy-diazaquinomycin A analogs.
Dicyclopropyl ketone (DCPK; > 95% purity) was purchased from TCI Chemicals
(Portland, OR), while aminolevulinic acid hydrochloride (ALA; ≥ 98%), (S)-(–)-limonene (96%
purity), and nonanoic acid methyl ester (NAME; ≥ 99.8% purity), were purchased from Sigma-
Aldrich (St. Louis, MO). The plasmids used in this study were the previously published
pCom8-PFR1500, pCom8-PFR1500L, and pBTL10 and were provided by the Andreas Schmid
lab at The Helmholtz-Centre for Environmental Research GmbH – UFZ in Leipzig, Germany.99-
101 Chemically competent cells generated from E. coli W3110 were transformed with
pCom8-PFR-1500, pCom8-PFR-1500L, and pBTL10 plasmids by heat shock.129 Transformants
were selected on LB medium containing the appropriate antibiotics and were then cultured with
appropriate antibiotics (10 µg/mL gentamicin for pCom8-PFR-1500 and pCom8-PFR-1500L and
50 µg/mL kanamycin for pBTL10).130
To determine the susceptibility of each transformant to 3, a DMSO stock of the compound
was diluted in LB media as a two-fold serial dilution series in triplicate at 100 µL per well in a
clear polystyrene 96-well assay microplate (Corning™ 3370) in parallel with kanamycin and

50
tetracycline controls, leaving a drug-free media control in column 12. All three W3110
transformants and an untransformed W3110 control were fermented in LB media overnight
followed by addition of 100 µL of the culture to each well. The plates were sealed and incubated
at 22 °C for 24 hours after which growth was scored and MICs determined by visual observation
of turbidity.
A 10 µL inoculum of each E. coli W3110 transformant was grown in 3 mL LB media with
the necessary antibiotic (50 μg/mL kanamycin; 10 µg/mL gentamicin) at 37 °C and ~200 rpm for
16 hours. A 1 mL aliquot of this culture was used to inoculate 100 mL modified M9 media (M9*)
supplemented with 1 mL/L USFe trace element solution containing 0.5% (wt/vol) glucose and
appropriate antibiotic in a 500 mL Erlenmeyer flask.131, 132 Cultures were grown to an OD450 of
0.3. Induction of enzymes was performed by incubation at ~200 RPM for an additional 4 hours
following addition of 0.025% (v/v) DCPK to all transformant cultures with the addition of 1 mM
ALA (5-aminolevulinic acid) to the pCom8-PFR1500 and pCom8-PFR1500L transformants only.
Cells were harvested by centrifugation for 20 min at 4,600 × g at 4 °C. The supernatant was
discarded and the cells were resuspended in 100 mM potassium phosphate buffer (pH 7.4)
containing 1% (w/v) glucose to an OD450 of 6.0. Resting cells were aliquoted to 1 mL total volume
in sealed tubes and shaken at 37 °C and ~200 RPM for approximately 5 min. The resting cell assay
was then initiated with the addition of 3 in DMSO to a final concentration of 110 µM, and NAME
and (S)-(–)-limonene in ethanol to final concentrations of 133 µM and 2 mM, respectively. The
reaction was terminated after eight hours by the addition of 1 mL DCM containing the 4 internal
standard at 0.2 mM for test cultures.
2.3.14 Cell-free ThyA and ThyX enzyme inhibition assay.
Over-expression and purification of M. tuberculosis ThyA and ThyX were performed as
detailed in Hunter, et al.105 Human thymidylate synthase A gene (commonly referred to as TYMS)

51
in pET17xb was transformed into BL21(DE3)pLysS. The enzyme was over-expressed in LB
media supplemented with 40 µg/mL chloramphenicol and 100 µg/mL ampicillin at 37 °C until
OD600 0.6, when the culture was inoculated with 1 mM IPTG and incubated further at 18 °C for
18 h. Cultures were spun down and the cell-pellet from a 1.5 L culture was lysed in 30 mL of 20
mM potassium phosphate, 500 mM NaCl, 10 mM MgCl2, 0.1 mM EDTA, and 1 mM 2-
mercaptoethanol at pH 7.9 on ice by sonication (5 cycles, 1 min, 90 W). The crude extract was
spun down at 4 °C and 30,597 RCF. 27.5 mL clarified lysate was obtained. 5.4 g ammonium
sulfate (around 35% saturation) was added in three parts and allowed to dissolve at 4 °C. The
precipitate obtained was spun-down at 4 °C and 11,952 RCF. 30 mL supernatant was obtained, to
which 10.75 g of ammonium sulfate (approximately 80% saturation) was added slowly at 4 °C and
allowed to dissolve. The precipitate obtained was again spun-down at 4 °C and 11,952 RCF. It
was re-dissolved in 15 mL of 20 mM Tris, 100 mM NaCl, 2 mM 2-mercaptoethanol, and 10%
glycerol at pH 7.8, concentrated to 7 mL, and buffer exchanged into 20 mM Tris, 100 mM NaCl,
2 mM 2-mercaptoethanol, and 10% glycerol at pH 7.8. The sample was purified on a 5 mL HiTrap
Q column (Low-salt buffer: 20 mM Tris, 100 mM NaCl, 2 mM 2-mercaptoethanol, and 10%
glycerol at pH 7.8, High-salt buffer: 20 mM Tris, 1 M NaCl, 2 mM 2-mercaptoethanol, and 10%
glycerol at pH 7.8). The protein eluted out before 40% high-salt buffer. Further purification was
carried out using Hiload 16/200 superdex 200 pg size-exclusion column using 20 mM Tris, 100
mM NaCl, 2 mM 2-mercaptoethanol, and 10% glycerol at pH 7.8. HsThyA containing fractions
were pooled and buffer exchanged into 50 mM Tris, 150 mM NaCl, 2 mM TCEP, and 30%
glycerol at pH 7.8 and stored at -80 °C until further use.
MtThyA (562.8 ng), MtThyX (8.4 µg), and HsThyA (638.4 ng) were pre-incubated with
inhibitors (13 µM) for 15 min at room-temperature in 125 mM TES, 60 mM MgCl2, 2.5 mM
EDTA, and 2 mM 2-mercaptoethanol at pH 7.9. The control contained DMSO without inhibitors.

52
FAD (10.5 µM) was included in the pre-incubation in the case of MtThyX. The total reaction
volume was 151 µL for MtThyA and HsThyA, and 160 µL for MtThyX.
Radiolabeled dUMP solution was made by mixing 20 µL 5’-3H-dUMP and 5 µL of 10 mM
dUMP in 475 µL of water. After 15 min, mTHF (67 µM for MtThyA, 5.1 µM for MtThyX, and
5.5 µM for HsThyA) and radiolabeled dUMP (5 µL) were added to 18 µL of the enzyme/inhibitor
samples. NADPH at 145 µM was also added to the MtThyX samples. All samples were incubated
at room-temperature for 30 min. Total reaction volume in all cases was 26 µL. Reaction was
stopped after 30 min by addition of 20 µL stop solution (1.5 N TCA, 1.1 mM non-radioactive
dUMP). A volume of 200 µL 10% charcoal (w/v) was added and samples were incubated on ice
for 15 min before being spun-down at 4 °C and 14,100 RCF for 15 min. A 100 µL aliquot of the
supernatant was assayed by liquid scintillation counting to determine the amount of tritium-
containing water produced by the reaction.
2.3.15 In vitro screening of diazaquinomycin A (3) against M. tuberculosis
overexpression (OE) mutants.
Recombinant strains were constructed in which each gene (thyA or thyX) was under the control
of a tetracycline inducible promoter.133 Plasmids were transformed into M. tuberculosis by
electroporation.134 Recombinant and wild-type strains were grown to late log phase in roller bottles
with the presence of inducer (150 ng/mL anhydrotetracycline). The MIC of compound 3 was
determined by measuring bacterial growth after 5 days in the presence of the test compound and
inducer.135 Compounds were prepared as a 10-point two-fold serial dilution in DMSO and diluted
into 7H9-Tw-OADC medium in 96-well plates with a final DMSO concentration of 2%. Each
plate included assay controls for background (medium/DMSO only, no bacterial cells), zero
growth (2% 100 µM rifampin), and maximum growth (DMSO only), as well as a rifampin dose
response curve. Cultures were filtered through a 5 µm filter and inoculated to a starting OD590

53
0.02. Plates were incubated for 5 days and growth was measured by OD590. The percent growth
was calculated and fitted to the Gompertz model.136 MIC was defined as the minimum
concentration at which growth was completely inhibited and was calculated from the inflection
point of the fitted curve to the lower asymptote (zero growth).
2.3.16 Transcription profile of M. tuberculosis following in vitro treatment with
diazaquinomycin A (3).
Treatment of M. tuberculosis H37Rv (ATCC 27294), RNA extraction, and RNA labeling
methods described by Boshoff, et al. were followed toward the generation of transcriptional
profiles for 3 and known TB inhibitors.137 Custom-designed oligonucleotide microarray chips were
synthesized by Agilent. RNA (2 µg) extracted from vehicle control (DMSO) treated cells were
labeled with cyanine dye Cy5 and used as the reference, while RNA (2 µg) from inhibitor-treated
cells screened in parallel were labeled with cyanine dye Cy3. The ratios of Cy5/Cy3 (DMSO/test
compound) were extracted as 𝑙𝑜𝑔2 𝑛. For visualization of transcription profiles, genes from the
data that were unidentified, uncharacterized, or were deferentially expressed at a < ± 0.2 ratio after
exposure to 3 were eliminated to reduce the number for display to the 1,000 most relevant. A heat
map was then constructed from the trimmed data using the CIMminer (Clustered Image Maps)
online application available from The Genomic and Bioinformatics Group in the Developmental
Therapeutics Branch of the NCI at the NIH (http://discover.nci.nih.gov/cimminer).138
2.3.17 Minimum inhibitory concentration (MIC) determination against M. tuberculosis
strains grown in varying media conditions.
Cultures were prepared in standard glycerol-alanine-salts (GAS) media; four separate GAS
media, each supplemented with either 0, 50, 200, or 800 μg/mL ferric ammonium citrate; GAS
media supplemented with 5 mg/mL albumen; and GAS media supplemented with 5 mg/mL
albumen, and 5.6 μg/mL palmitic acid, but without glycerol. MICs were determined by the MABA
as described previously for M. tuberculosis H37Rv.

54
2.4 Conclusions.
Despite decades of research into actinomycete small molecules from terrestrial and marine
environments, to the best of our knowledge identification of secondary metabolites from
freshwater Actinobacteria has been virtually absent from the peer-reviewed literature. The unique
structures and activity of the diazaquinomycins provide first evidence that the Great Lakes, and
more broadly freshwater environments, are a relatively unexplored resource for novel biologically
active molecules.
From a Micromonospora sp. in Lake Michigan sediment, we isolated novel antibiotic
molecules of the diazaquinomycin class. An analog, compound 3, displayed an in vitro activity
profile similar or superior to clinically used TB agents and maintained potent inhibitory activity
against a panel of drug-resistant TB strains. This compound displayed a selectivity profile targeted
toward M. tuberculosis, even within the genus Mycobacterium. Since the 1980’s, other research
groups reported that members of the diazaquinomycin class exhibited weak antibacterial activity
by targeting thymidylate synthase, though no reports of their anti-TB activity existed and our
studies have suggested an alternate MOA in TB. Preliminary in vitro analysis of 3 predicts that it
will exhibit high metabolic stability, and therefore a long predicted serum half-life in vivo. Though
3 was well tolerated in a dedicated five-day in vivo tolerance test, subsequent pharmacokinetics
and efficacy experiments revealed toxicity that was suspected to be caused by the highly viscous
vehicle. Additionally, 3 was not observed above the LOQ in the PK study. This might indicate that
compound exhibits poor bioavailability but the presence of the 4 internal standard below the LOQ
suggests an incompatibility of the PK methods with the poorly soluble DAQs.
Exhaustive attempts at a new DAQ total synthesis and whole cell biocatalysis methods
were both aimed at facilitating the modification of the DAQ structure at the β-substituted position,
but neither were successful. Reasons for the failed synthesis are uncertain. The biocatalysis

55
experiment likely failed because of the limited solubility of 3 in aqueous media added to potential
difficulty of its penetration through the lipopolysaccharide outer membrane of E. coli.
In the M. tuberculosis OE mutant screen, both Rv0953c oxidoreductase and Rv3500c
transporter OE mutants exhibited a six-fold MIC increase and are predicted to be involved with
lipid metabolism as part of the kstR regulon.110 The fact that both mutants were resistant and
contained mutations within the same regulon lends support to the potential of this pathway as a
mechanism of resistance to 3. Importantly, the basal levels of the Rv0953c and Rv3500c genes’
expression exhibited four-and two-fold increases in MIC, respectively, in the uninduced mutants.
Continually overexpressed genes could lead to global metabolic pathway changes that might
hinder interpretation of results such as identification of the exact site targeted in the pathway. But
since these enzymes have been identified as non-essential, they are likely not targets of 3.109, 118, 139
Instead, they may be involved in resistance by redox inactivation (Rv0953c) and efflux (Rv3500c)
of the compound from the cell. Additionally, the oxidoreductase may protect against general ROS
or DAQ-related active derivatives involved in the oxidative stress evidenced in the microarray
results. Interestingly, Rv0953c and Rv3500c were not up- or down-regulated significantly in
the transcription profiling study, suggesting that though some protective effect can be gained by
engineering strains that upregulate these genes, M. tuberculosis H37Rv does not innately respond
to oxidative stress or DAQ treatment by this mechanism.
Though differing overall patterns in the transcription profiles suggest separate mechanisms
between 3 and other TB inhibitors, the oxidative stress response observed for the compound was
similar to that from dipyridyl, menadione, and CLF.140 Interestingly, we were able to disprove the
possibility that inhibition of respiration similar to that of CLF was a part of the DAQA MOA (See
Appendix 2.1.2). Because of the potential role of iron chelation in oxidative stress and a small
level of resistance observed when culturing in 7H12, 141-144 we tested the effects of iron and a

56
palmitic acid carbon source on the activity of 3. We found no correlation between iron
concentration in media and DAQA inhibition of M. tuberculosis and were unable to identify a
protective effect using the alternate carbon source.
Though we found potential MOA leads when two clofazimine-resistant strains exhibited
cross-resistance to 3, we were unable to identify a singular target following screening of additional
mutants. These experiments suggested that 3 was not a substrate of the MmpL5 efflux system and
that it did not have an effect on pyrimidine or F420 cofactor biosynthesis.
Also, attempts at isolating a protein target for 3 using the DARTS assay were unsuccessful.
This may be because the DAQs have a many faceted mechanism that may not include direct
interaction with a singular protein target (See Appendix 2.1.3).
In general, the major challenges of developing 3 as an anti-tuberculosis drug lead have
been tied to the compound’s limited solubility. Harsh conditions in the total synthesis have been
prohibitive to derivatization aimed at improving solubility, exploring SAR, and embarking on
additional MOA studies. The culmination of the aforementioned experiments saw the elimination
of specific targets and pathways within a set of potential mechanisms established either through
previous reports or by OE library screen and transcription profiling. More global approaches to
target identification will be required in future studies to generate additional potential target leads.
2.5 Future directions.
If the DAQs are without a future as a tuberculosis therapy, additional studies into the
remarkably selective mechanism still hold potential of revealing a novel target for future TB
treatments. Thus, there is a continued focus on the characterization and eventual elucidation of the
MOA in our laboratories. The most immediate goal is to generate mutant strains resistant to 3 for
full genome sequencing using the avirulent M. tuberculosis strain mc27000.121 Mutations

57
identified to confer resistance will be prioritized as genes for potential molecular targets worthy of
further investigation. The mc27000 strain has mutations allowing for its safe use in the convenience
of BSL-2 containment and is a sufficient replacement for H37Rv with its similar susceptibility to 3
at an MIC of 0.14 μM in the MABA.121
Additionally, many of the findings described in the previous chapter could be explored in
greater depth. To test the specificity of the MOA of 3 in M. tuberculosis, synthetic DAQ
derivatives inactive in the MABA could be tested against DAQA-susceptible cancer cell lines. A
similar loss of activity would suggest that the pharmacophore and possibly the MOA is shared
between M. tuberculosis and mammalian cells, while retention of activity would suggest the
opposite. Additionally, the substructure of the 3 central quinone coupled with results from the
microarray profile suggest that extensive redox chemistry might be responsible for cell damage in
M. tuberculosis. The selectivity of the compound opposes the assumption of such a typically
promiscuous mechanism, but testing the generation of ROS by 3 using appropriate ROS-sensitive
dyes would confirm whether this suspected activity is valid.145 Target candidates revealed from
the OE mutant panel could be further investigated as well, though this would likely involve more
resource-intensive molecular genetics experiments. For example, screenings of 3 against a double
Rv0953c/Rv3500c OE mutant resulting in increased resistance and tests in Rv0953c and Rv3500c
transposon mutants resulting in increased susceptibility would greatly support that this lipid
catabolism pathway is part of a mechanism of resistance. In a more bioinformatic approach,
discovery of the DAQ biosynthetic gene cluster may reveal closely associated resistance genes
that could guide studies toward a mechanism in M. tuberculosis.146
Biocatalytic derivatization of the DAQ core to hydroxylate the β-position might be
facilitated if one of the more soluble synthetic DAQ analogs was used as the substrate. Since these
previously described α, O-, and N- modified derivatives tend to lack significant activity, the core
58
of the hydroxylated product could be converted back into the more active DAQA-like structure.
Once a hydroxy-DAQA was achieved, further derivatizations could be made at the reactive
hydroxyl group to include photo-reactive probe moieties for target capture and pull-down.
In the absence of better-informed approaches to understanding the DAQ MOA, a
systematic approach to eliminating the possibility of the canonical antibiotic mechanisms of action
would be a logical step. As Walsh has eloquently described in his book Antibiotics: Actions,
Origins, Resistance, nearly without exception, antibiotics act by one of four general modes of
action: 1) inhibition of peptidoglycan synthesis in the membrane, 2) protein synthesis inhibition,
3) inhibition of DNA or RNA synthesis, or 4) inhibition of DNA/RNA precursor synthesis.147
Studies of DAQA in these areas could identify a target or serve to further support that this class
acts by a novel mechanism.
Unfortunately, attempts at determining the efficacy of 3 in mice were unsuccessful due to
deaths related to the highly viscous vehicle necessitated by the poor solubility of the compound.
In the absence of a more soluble analog with retained potency, the continuation of in vivo
evaluation for this antibiotic class is dependent on the determination of a better tolerated
formulation. Use of the recently described intrapulmonary aerosol delivery method may be the
ideal administration route for such an insoluble compound.148 Following optimization of an
administration method, 3 should be tested against an acute infection model in addition to retesting
in the chronic infection model. This would allow the assessment of DAQA as a companion to
bactericidal drugs in vivo if it is bacteriostatic. Importantly, a second attempt at quantitative
pharmacokinetic data acquisition would greatly inform efficacy and additional in vivo
experiments. These studies aim to identify a possible novel molecular target of the
diazaquinomycins in TB and test the in vivo potential of this class as a part of further assessing
their potential as anti-TB drug leads.

59
3. DIAZAQUINOMYCINs E–G, NOVEL DIAZA-ANTHRACENE ANALOGS FROM A
MARINE-DERIVED STREPTOMYCES SP.‡
3.1 Introduction
Interestingly, in a separate study using bioassay-guided fractionation of strain F001 extract
against the ovarian cancer cell line OVCAR5, we serendipitously isolated additional molecules of
the diazaquinomycin class. The observed activity led to the selection of this strain for further
chemical investigation. Of these, diazaquinomycin E (DAQE; 12) and the isomeric mixture of
diazaquinomycins F and G (DAQF, 13; DAQG, 14) were new, while the known analog
diazaquinomycin A (DAQA; 3) was also isolated in the process. The three new compounds are
mono-normethyl analogs of the diazaquinomycin structural class. DAQE and DAQA inhibited the
growth of OVCAR5 cells with moderate potency (LC50 = 9.0 and 8.8 μM, respectively). Further
biological evaluation was performed on the most abundant analog, DAQA, while we were unable
to evaluate the biological activity of the isomeric mixture of DAQF and DAQG due to their low
mass yield. Details of the elucidation and anti-cancer biological activities are described herein.
3.2 Results and discussion.
3.2.1 Structure elucidation of diazaquinomycins E (12), F (13), and G (14).
Following a series of chromatographic steps, diazaquinomycin E (Figure 10) was obtained
as red powder. The molecular formula was assigned as C23H28N2O4 on the basis of combined NMR
and high-resolution MS experiments. This formula demanded 11 degrees of unsaturation. The
unique chromophore of a fused diaza-anthracene ring system consistent with the diazaquinomycin
structural class was observed in the UV spectrum of 12. Analysis of the 1H NMR spectrum of 12
suggested the presence of an isolated aromatic hydrogen (δH 6.94, s, H-6). Integration of the H-6,
‡Reproduced with permission from Mullowney, M. W.; Ó hAinmhire , E.; Shaikh, A.; Wei, X.; Tanouye, U.;
Santarsiero, B. D.; Burdette, J. E.; Murphy, B. T. Diazaquinomycins E-G, novel diaza-anthracene analogs from a
marine-derived Streptomyces sp. Mar. Drugs 2014, 12, 3574-3586. Utilized under the Creative Commons license.
More information available via the Internet at: creativecommons.org/licenses/by/4.0/
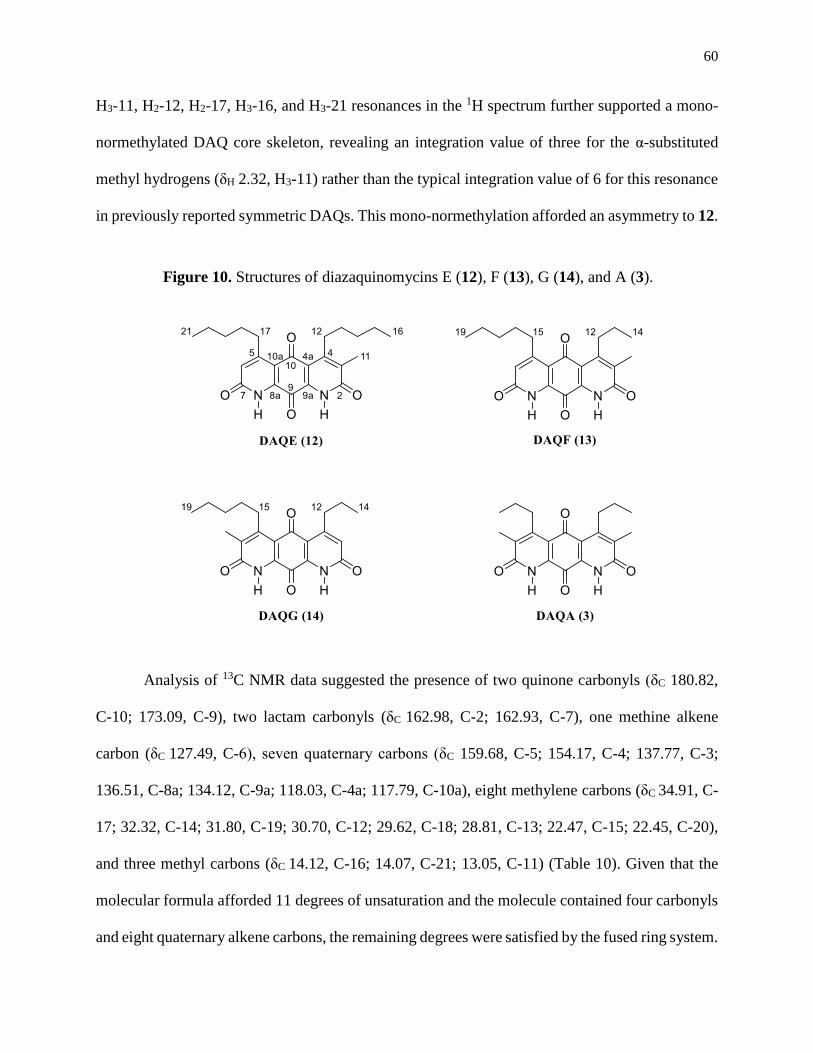
60
H3-11, H2-12, H2-17, H3-16, and H3-21 resonances in the 1H spectrum further supported a mono-
normethylated DAQ core skeleton, revealing an integration value of three for the α-substituted
methyl hydrogens (δH 2.32, H3-11) rather than the typical integration value of 6 for this resonance
in previously reported symmetric DAQs. This mono-normethylation afforded an asymmetry to 12.
Analysis of 13C NMR data suggested the presence of two quinone carbonyls (δC 180.82,
C-10; 173.09, C-9), two lactam carbonyls (δC 162.98, C-2; 162.93, C-7), one methine alkene
carbon (δC 127.49, C-6), seven quaternary carbons (δC 159.68, C-5; 154.17, C-4; 137.77, C-3;
136.51, C-8a; 134.12, C-9a; 118.03, C-4a; 117.79, C-10a), eight methylene carbons (δC 34.91, C-
17; 32.32, C-14; 31.80, C-19; 30.70, C-12; 29.62, C-18; 28.81, C-13; 22.47, C-15; 22.45, C-20),
and three methyl carbons (δC 14.12, C-16; 14.07, C-21; 13.05, C-11) (Table 10). Given that the
molecular formula afforded 11 degrees of unsaturation and the molecule contained four carbonyls
and eight quaternary alkene carbons, the remaining degrees were satisfied by the fused ring system.
Figure 10. Structures of diazaquinomycins E (12), F (13), G (14), and A (3).

61
Key HMBC, COSY, and 1D-TOCSY correlations are given in Figure 11. Since the molecule is
asymmetric, we could employ proton-based spectroscopic experiments to distinguish between
resonances of the β-substituted alkyl groups. Interpretation of COSY and 1D-TOCSY data defined
two distinct spin systems (Figure 12), which were then connected to the core ring system using
HMBC correlations. In HMBC correlation from H2-17 to C-10a, and of H-6 to C-17 and C-10a,
positioned the spin system of C-17–C-18–C-19–C-20–C-21 on the normethyl half of the diaza-
anthracene core. Similarly, an HMBC correlation from H2-12 to C-3 positioned the spin system of
C-12–C-13–C-14–C-15–C-16 on the α-methylated ring of the diaza-anthracene core. The 13C
resonances of the lactam carbonyl carbons were distinguished from one another based on an
HMBC correlation from H3-11 to C-2, placing C-2 on the α-methylated ring. The remaining
quinone carbons C-8a, C-9, C-9a, and C-10 were assigned based on comparison with reported
values of other diazaquinomycin analogs;90, 92 our assignments were highly consistent with
reported values. Therefore, the structure of 12 was determined as shown and named
diazaquinomycin E.
Figure 11. Key 2D NMR correlations of 12.

62
Following a series of chromatographic steps, the co-eluting isomeric mixture of 13 and 14
(Figure 10) was obtained as red powder. The molecular formula for the mixture of constitutional
isomers was assigned as C21H24N2O4 on the basis of combined NMR and high-resolution MS
experiments. This formula demanded 11 degrees of unsaturation. A chromophore of a fused diaza-
anthracene ring system consistent with 12 was observed in the UV spectrum of the compound
mixture. The diaza-anthracene core of DAQF and DAQG was determined to be mono-methylated
as was previously described for 12. This was evidenced by the presence of an aromatic hydrogen
in the 1H NMR spectrum (δH 6.98, s, H-6 of 13 or 14). Evidence for a second minor isomer was
Table 10. 1H and 13C NMR data (CDCl3/1% CF3CO2D) of 12.
Position 13C a 1H mult. (J, Hz) b
2 162.98
3 137.77
4 154.17
4a 118.03
5 159.68
6 127.49 6.94 s
7 162.93
8a 136.51
9 173.09
9a 134.12
10 180.82
10a 117.79
11 13.05 2.32 s
12 30.70 3.12 bt (6.4)
13 28.81 1.52 m
14 32.32 1.51 m
15 22.47 1.42 m
16 14.12 0.96 t (7.3)
17 34.91 3.11 t (7.7)
18 29.62 1.60 p (7.6)
19 31.80 1.43 m
20 22.45 1.40 m
21 14.07 0.94 t (7.3) a 226.2 MHz; b 900 MHz.
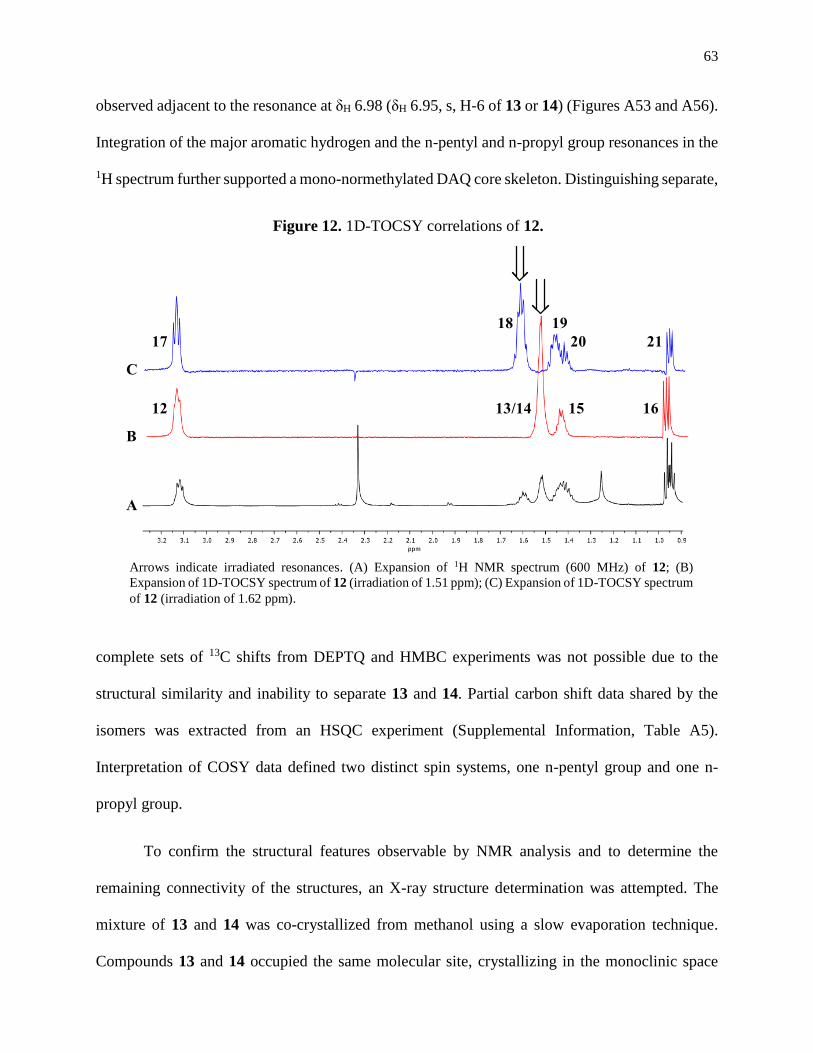
63
observed adjacent to the resonance at δH 6.98 (δH 6.95, s, H-6 of 13 or 14) (Figures A53 and A56).
Integration of the major aromatic hydrogen and the n-pentyl and n-propyl group resonances in the
1H spectrum further supported a mono-normethylated DAQ core skeleton. Distinguishing separate,
complete sets of 13C shifts from DEPTQ and HMBC experiments was not possible due to the
structural similarity and inability to separate 13 and 14. Partial carbon shift data shared by the
isomers was extracted from an HSQC experiment (Supplemental Information, Table A5).
Interpretation of COSY data defined two distinct spin systems, one n-pentyl group and one n-
propyl group.
To confirm the structural features observable by NMR analysis and to determine the
remaining connectivity of the structures, an X-ray structure determination was attempted. The
mixture of 13 and 14 was co-crystallized from methanol using a slow evaporation technique.
Compounds 13 and 14 occupied the same molecular site, crystallizing in the monoclinic space
Figure 12. 1D-TOCSY correlations of 12.
Arrows indicate irradiated resonances. (A) Expansion of 1H NMR spectrum (600 MHz) of 12; (B)
Expansion of 1D-TOCSY spectrum of 12 (irradiation of 1.51 ppm); (C) Expansion of 1D-TOCSY spectrum
of 12 (irradiation of 1.62 ppm).

64
group P21/m (No. 11), with a mirror plane bisecting the molecules through the central carbonyl
atoms C9-O9 and C10-O10. The major isomer (13), present as 52.6% of the crystal, is defined
with a methyl group carbon atom, C11, on atom C3 adjacent to the propyl-substituted C4 atom,
and a methine group carbon atom, C6, adjacent to the pentyl-substituted C5 atom. A constitutional
isomer (14), present as 47.4 % of the crystal, is modeled with the methyl group carbon atom, C11,
on atom C3 adjacent to the pentyl-substituted C4 atom, and a methine group carbon atom, C6,
adjacent to the propyl-substituted C5 atom. Partially occupied water molecules are evident from
the electron density maps, and near the methyl groups. The C3(methyl)-C6(H):C3(H)-C6(methyl)
fragment occupancy was refined to a ratio of 0.704(8):0.296(8), and the C4(n-propyl):C4(n-pentyl)
fragment occupancy ratio was 0.566(9):0.434(9). The molecules are packed in the crystal through
Figure 13. Co-crystal structure of 13 and 14.
Structure numbered to emphasize DAQF occupancy in the co-crystal.

65
hydrogen bonding with the amide hydrogen atoms and adjacent carbonyls. The intensity data was
collected at experimental station 21-ID-D, LS-CAT, at Advanced Photon Source, Argonne
National Laboratory, and processed with XDS.149 The structure was solved and refined with
SHELX.150 The final R-factor was 0.0799 for 1525 intensities greater than 2, and 0.0961 for all
2030 unique data. The X-ray analysis supports the proposed structures of 13 and 14 (Figures 13,
A59, and A60). Therefore, 13 and 14 were determined as shown and named diazaquinomycin F
and diazaquinomycin G, respectively. Crystallographic data for the structure of 13 and 14 were
deposited under accession number CCDC 996646 and can be obtained free of charge from The
Cambridge Crystallographic Data Centre. The ratio of 13 and 14 in the co-crystal does not
necessarily reflect the weight percentage in the compound mixture, as evidenced by uneven H-6
resonances in the 1H NMR spectrum (Supplemental Figure A53 and A56).
The known metabolite DAQA (3) was isolated and characterized based on comparison of
1H NMR and HRMS data with those appearing in literature.91, 92
3.2.2 Diazaquinomycin A (3) induces DNA damage, cell cycle arrest, and apoptosis
through cleaved-PARP.
Compounds 12 and 3 were tested for in vitro cytotoxicity against the ovarian cancer cell
line OVCAR5 by Eoghainín Ó hAinmhire in the lab of Joanna Burdette. Dose response analysis
of the isolated compounds revealed an LC50 of 9.0 μM for 12 and 8.8 μM for 3 after treatment of
cells for 96 hours (Figure 14). Further cell-based experiments were performed on 3 due to its high
yield. Western blot analysis of OVCAR5 cells treated with 17.6 μM (LC100) of 3 showed increased
levels of p21 (a cell cycle inhibitor) after 8 hours (Figure 15). Interestingly, levels of p21 decreased
after 24 hours when compared to solvent control. Reduction of p21 protein after 24 hours
correlated with an increase in cleaved-PARP, an indication of apoptosis. The induction of cell
cycle arrest, leading to apoptosis suggests significant DNA damage. To address this possibility,
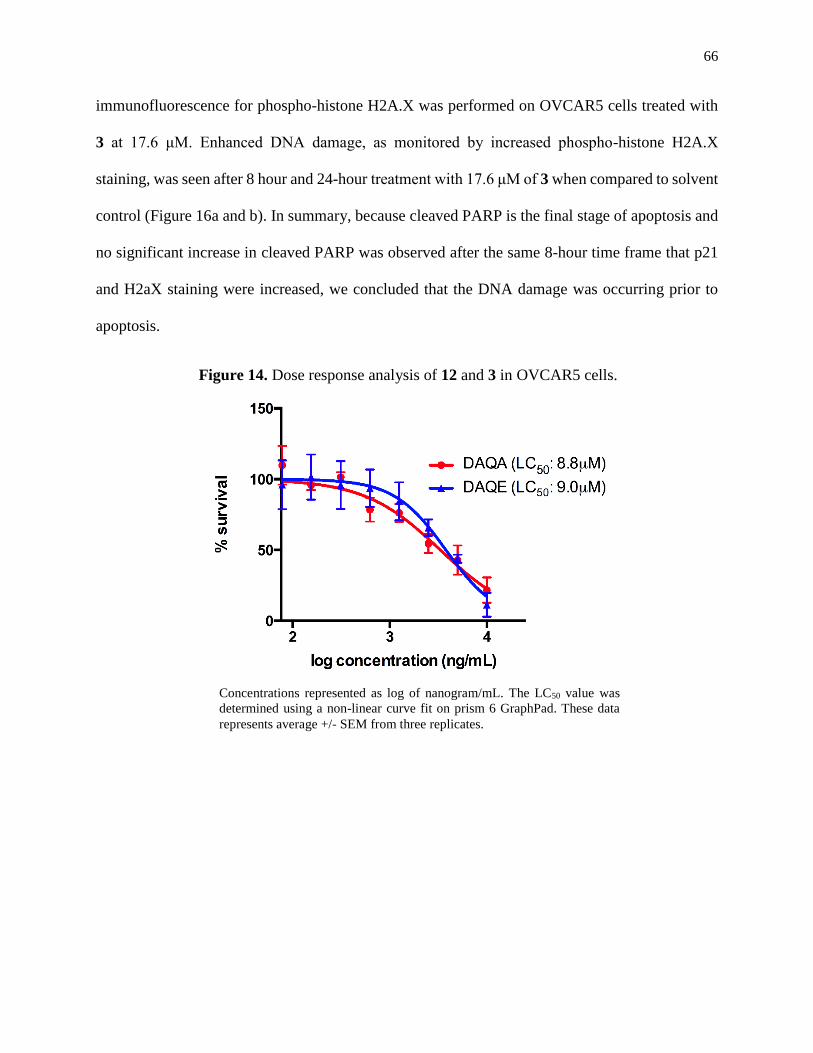
66
immunofluorescence for phospho-histone H2A.X was performed on OVCAR5 cells treated with
3 at 17.6 μM. Enhanced DNA damage, as monitored by increased phospho-histone H2A.X
staining, was seen after 8 hour and 24-hour treatment with 17.6 μM of 3 when compared to solvent
control (Figure 16a and b). In summary, because cleaved PARP is the final stage of apoptosis and
no significant increase in cleaved PARP was observed after the same 8-hour time frame that p21
and H2aX staining were increased, we concluded that the DNA damage was occurring prior to
apoptosis.
Figure 14. Dose response analysis of 12 and 3 in OVCAR5 cells.
Concentrations represented as log of nanogram/mL. The LC50 value was
determined using a non-linear curve fit on prism 6 GraphPad. These data
represents average +/- SEM from three replicates.
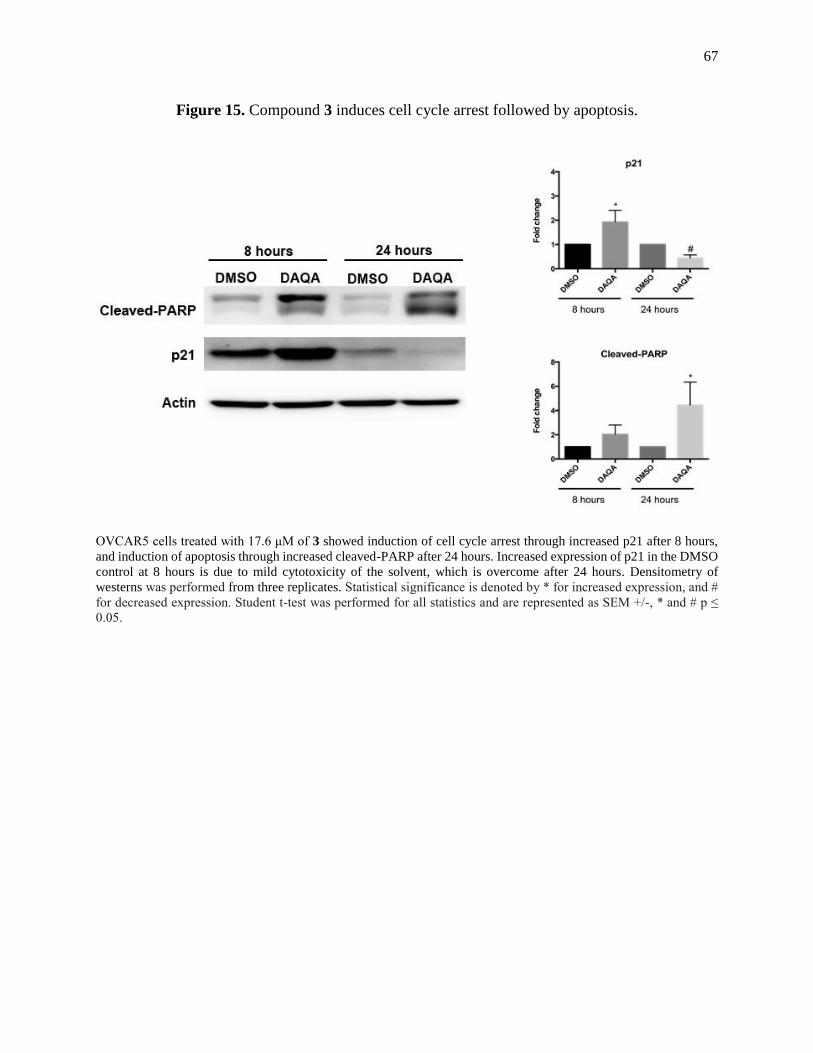
67
Figure 15. Compound 3 induces cell cycle arrest followed by apoptosis.
OVCAR5 cells treated with 17.6 μM of 3 showed induction of cell cycle arrest through increased p21 after 8 hours,
and induction of apoptosis through increased cleaved-PARP after 24 hours. Increased expression of p21 in the DMSO
control at 8 hours is due to mild cytotoxicity of the solvent, which is overcome after 24 hours. Densitometry of
westerns was performed from three replicates. Statistical significance is denoted by * for increased expression, and #
for decreased expression. Student t-test was performed for all statistics and are represented as SEM +/-, * and # p ≤
0.05.
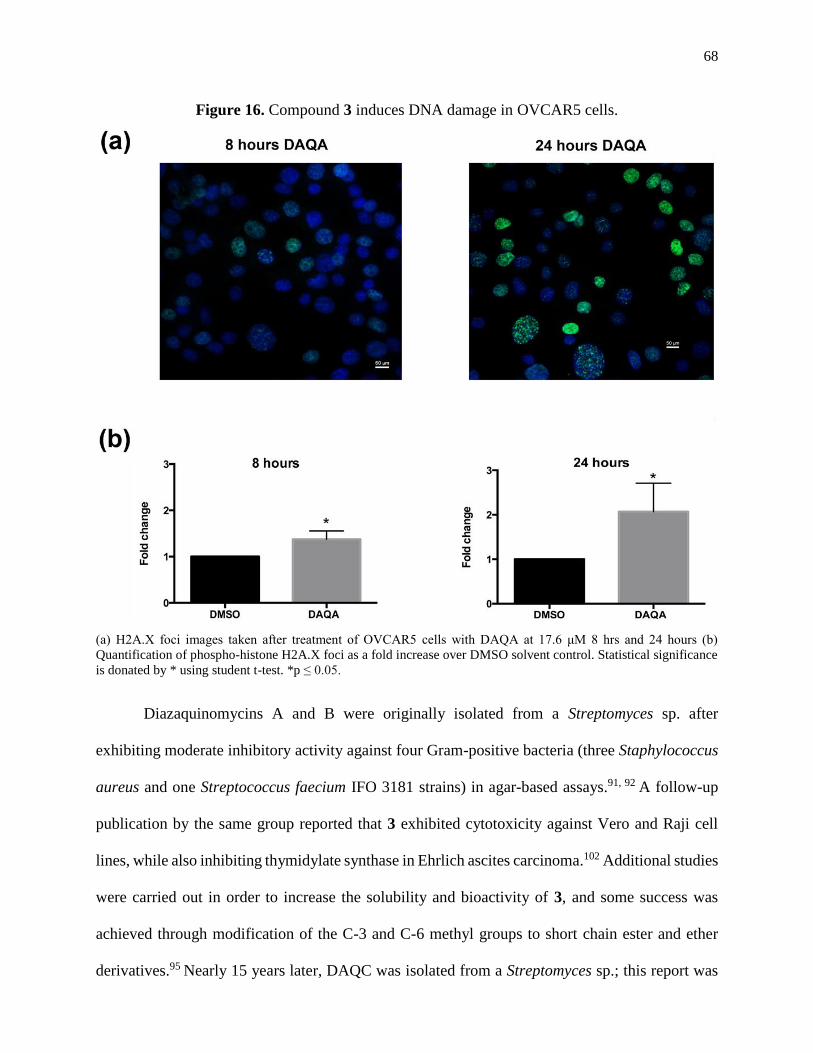
68
Figure 16. Compound 3 induces DNA damage in OVCAR5 cells.
(a) H2A.X foci images taken after treatment of OVCAR5 cells with DAQA at 17.6 μM 8 hrs and 24 hours (b)
Quantification of phospho-histone H2A.X foci as a fold increase over DMSO solvent control. Statistical significance
is donated by * using student t-test. *p ≤ 0.05.
Diazaquinomycins A and B were originally isolated from a Streptomyces sp. after
exhibiting moderate inhibitory activity against four Gram-positive bacteria (three Staphylococcus
aureus and one Streptococcus faecium IFO 3181 strains) in agar-based assays.91, 92 A follow-up
publication by the same group reported that 3 exhibited cytotoxicity against Vero and Raji cell
lines, while also inhibiting thymidylate synthase in Ehrlich ascites carcinoma.102 Additional studies
were carried out in order to increase the solubility and bioactivity of 3, and some success was
achieved through modification of the C-3 and C-6 methyl groups to short chain ester and ether
derivatives.95 Nearly 15 years later, DAQC was isolated from a Streptomyces sp.; this report was

69
also the first mention of DAQD, though the metabolite was only observed through (-)-ESI MS
experiments and was never fully characterized.90 The observation of an aromatic resonance in the
1H spectrum (H-6) of 12 is a feature unique among existing diazaquinomycin analogs; previously
reported structures of this class contain a methyl group at this position.90-92 In the current study,
though four secondary metabolites were isolated and characterized from strain F001, we observed
ten additional diazaquinomycin analogs (based on the presence of characteristic UV spectra and
MS2 fragmentation patterns) in LCMS data of our bioactive fractions. Positive ion values ranged
from m/z 355.1 [M + H]+ to 425.2 [M + H]+, and given that UV spectra remained consistent among
derivatives, structural modifications likely occurred in the α-substituted methyl and β-substituted
alkyl groups. Finally, although 12 and 3 exhibited moderate cytotoxicity toward OVCAR5 cells
by inducing apoptosis and enhancing DNA damage, these metabolites are currently under
investigation in our laboratory for their selective antibiotic activity.
3.3 Methods.
3.3.1 General experimental procedures.
UV spectra were measured on a Shimadzu Pharma Spec UV-1700 spectrophotometer.
NMR spectra were obtained on a Bruker 600 MHz DRX NMR spectrometer equipped with an
inverse 5mm TXI cryogenic probe with z-axis pfg and XWINNMR version 3.5 operating software,
and a 900 (226.2) MHz Bruker AVANCE NMR spectrometer equipped with an inverse 5 mm TCI
cryogenic probe with z-axis pfg and TopSpin version 1.3 operating software at the University of
Illinois at Chicago Center for Structural Biology. Chemical shifts (δ) are given in ppm and
coupling constants (J) are reported in Hz. 1H and 13C NMR resonances of 12 are reported in
Table 10. High resolution mass spectra were obtained on a Shimadzu IT-TOF spectrometer at the
University of Illinois at Chicago Research Resources Center. High-performance liquid
chromatography (HPLC-UV) data were obtained using a Hewlett-Packard series 1100 system

70
controller and pumps with a Model G1315A diode array detector (DAD) equipped with a reversed-
phase C18 column (Phenomenex Luna, 100 × 4.6 mm, 5 μm) at a flow rate of 0.5 mL·min−1. Semi-
preparative HPLC scale separations were performed using a Hewlett Packard Series 1050 system
with a Phenomenex Luna semi-preparative C18 column (250 × 10 mm, 5 μm) at a flow rate of 2.4
mL·min−1. Preparative HPLC scale separations were performed using a Waters LC4000 System
equipped with a Phenomenex Luna semi-preparative C18 column (250 × 21.2 mm, 5 μm) at a flow
rate of 16 mL·min−1.
3.3.2 Selection of actinomycete strain F001 for further investigation.
We screened our library of ca. 2,000 secondary metabolite fractions (from ca. 500 aquatic-
derived actinomycete strains) in an in vitro single dose screen (20 g/mL) against OVCAR5 and
identified strain F001 as a promising bioactive lead, among other strains. Strain F001 (GenBank
accession number KJ656126) shared 98% 16S rRNA gene sequence identity with the most closely
related type strains Streptomyces coacervatus (GenBank accession number AB500703),151
Streptomyces hygroscopicus subsp. jinggangensis (GenBank accession number NC_017765),152
and Streptomyces roseochromogenes subsp. oscitans (GenBank accession number
NZ_CM002285).153
3.3.3 Fermentation and extraction.
Strain F001 was cultured under two different media conditions. The culture that yielded 12
and 3 was grown in 44 × 1 L portions in Fernbach flasks containing high nutrient A1 medium
(filtered ocean water, 10 g starch, 4 g yeast, 2 g peptone, 1 g calcium carbonate, 100 mg potassium
bromide, and 40 mg iron sulfate) for 5 days at 21 °C while shaking at 220 rpm. The culture that
yielded 13 and 14 was grown in 5 × 1 L portions in Fernbach flasks containing high nutrient CGS
medium (filtered ocean water, 4 g casamino acids, 10 mL glycerol, and 5 g soy peptone) for 5 days
at 21 °C while shaking at 220 rpm. Extraction methods for each growth condition were the same.
71
Sterilized Amberlite XAD-16 resin (15 g·L−1) was added to each flask to absorb the extracellular
secondary metabolites. The culture medium and resin were shaken for 8 h and filtered using
cheesecloth to remove the resin. The resin, cell mass, and cheesecloth were extracted with acetone
overnight, concentrated under vacuum, and partitioned between water and ethyl acetate. The
organic layer of the A1 fermentation was dried under vacuum to afford 6.3 g of extract. The organic
layer of the CGS fermentation was dried under vacuum to afford 1.1 g of extract.
3.3.4 Isolation and characterization of diazaquinomycins E (12), F (13), and G (14).
DAQE was isolated from the fermentation broth (A1 media) of strain F001. The organic
layer from the liquid-liquid partition was fractionated using silica gel flash column
chromatography (100 g of silica) eluting with an isocratic 95% chloroform (CHCl3):5% methanol
(MeOH) solvent system to afford eight fractions. Using bioassay-guided fractionation, it was
determined that fractions 2 and 3 contained the bioactive constituents, thus they were combined
and separated using RP-C18 preparative HPLC (16 mL·min−1, gradient of 50% aqueous acetonitrile
(ACN) to 100% ACN for 20 min, followed by an isocratic flow of 100% ACN for 10 min) to
afford nine fractions. Fraction 8 (tR 17.2 min, 14 mg) was separated using RP-C18 semi-preparative
HPLC (2.4 mL·min−1, gradient of 50% aqueous ACN to 100% ACN for 25 min, followed by an
isocratic flow of 100% ACN for 15 min) to afford diazaquinomycin E (12, tR 22.1 min, 0.9 mg,
0.014% yield).
DAQF and DAQG were isolated from the fermentation broth (CGS media) of strain F001.
The organic layer from the liquid-liquid partition of the culture extract was fractionated using silica
gel flash column chromatography (100 g of silica) eluting with an isocratic 95% CHCl3:5% MeOH
solvent system to afford eight fractions. Using bioassay-guided fractionation, it was determined
that fraction 8 contained the bioactive constituents, thus it was separated using normal phase silica
gel (NP-Si) semi-preparative HPLC (2.0 mL·min−1, gradient of 99% CHCl3:1% MeOH to 90%

72
CHCl3:10% MeOH for 10 min, followed by an isocratic flow of 90% CHCl3:10% MeOH for 15
min) to afford 7 fractions. Fraction 4 (tR 18.1 min, 2.2 mg) was separated using NP-Si semi-
preparative HPLC (2.0 mL·min−1, gradient of 99% CHCl3:1% MeOH to 90% CHCl3:10% MeOH
for 10 min, followed by an isocratic flow of 90% CHCl3:10% MeOH for 10 min) to afford 7
fractions. Fraction 5 (tR 19.3 min, 0.4 mg) was separated using NP-Si semi-preparative HPLC (2.0
mL·min−1, gradient of 99% CHCl3:1% MeOH to 90% CHCl3:10% MeOH for 10 min, followed by
an isocratic flow of 90% CHCl3:10% MeOH for 10 min) to afford the co-eluting isomeric mixture
of 13 and 14 (tR 19.3 min, 0.28 mg, 0.025% yield).
Diazaquinomycin E (12): Red solid (0.9 mg). UV (MeOH) λmax (log ε) = 282.5 (3.90),
362.5 (3.24), and a broad peak with maximum at 486.0 (2.56) nm. 1H NMR (900 MHz, CDCl3 -
1% CF3CO2D) and 13C NMR (226.2 MHz, CDCl3 - 1% CF3CO2D), see Table 10. HR-ESI-IT-TOF
MS m/z 397.2198 [M + H]+ (calcd. for C23H29N2O4: 397.2127), m/z 395.1943 [M - H]- (calcd. for
C23H27N2O4: 395.1971), m/z 419.1997 [M + Na]+ (calcd. for C23H28N2O4Na: 419.1947), m/z
793.4211 [2M + H]+ (calcd. for C46H57N4O8: 793.4176), and m/z 815.3997 [2M + Na]+ (calcd. for
C46H56N4O8Na: 815.3996).
Diazaquinomycin F (13) and diazaquinomycin G (14): Red solid (0.28 mg). For UV, partial
NMR, and HRMS data, see Appendix (Table S1; Figures A53-A60).
3.3.5 OVCAR5 cytotoxicity assay.
OVCAR5 cells were cultured in minimum essential media (Life Technologies, 11090-081)
and supplemented with 10% fetal bovine serum (Gibco, 16000-044), 1% L-glutamine (Gibco,
25030-081), 1% nonessential amino acids (Gibco, 11140-050), 1% sodium pyruvate (Gibco,
11360-050) and 1% penicillin/streptomycin (Gibco, 15140-122). OVCAR5 cells (5000/well) were
plated in a 96-well plate one day prior to treatment. The next day, cells were treated with varying
doses of the given compound in regular culture media. The doses tested were 10 μg/mL, 5 μg/mL,
73
2.5 μg/mL, 1.25 μg/mL, 0.625 μg/mL, 0.3125 μg/mL, 0.15625 μg/mL and 0.078125 μg/mL. Doses
higher than 10 μg/mL could not be tested due to compound insolubility in DMSO. Test plates were
incubated at 37 ° C with 5% CO2 for 96 hours. After 96 hours, media was removed from the cells
and washed with cold PBS. Cells were permanently fixed to the culture plate using 5%
trichloroactetic acid (TCA). A sulforhodamine B (SRB) assay was performed as previously
reported.154 Percent survival was calculated by comparing samples treated with 12 or 3, and
samples treated with the relevant volume of DMSO solvent control. Prism 6 GraphPad was used
to graph the results and determine the LC50 in μM concentrations.
3.3.6 Western blot analysis.
Cells were plated at a density of 50,000 cells in a 6-well plate one day before treatment.
Cells were treated with 17.6 μM 3 for 8 hours and 24 hours. DMSO was used as a solvent control.
Western blot gels were run as previously described.124 30 μg cell lysate was run for each sample.
p21 (#9247) and cleaved-PARP (#9541) from Cell Signaling were used to probe protein
membranes at concentrations of 1:1000 in 5% milk/TBS-T. Actin (Sigma-Aldrich) was used as a
loading control at a concentration of 1:1000. Anti-rabbit HRP-linked antibody (cell signaling) was
used for all blots at 1:1000. Densitometry was performed using ImageJ software. All samples were
performed in triplicate.
3.3.7 Immunofluorescence.
Cells were plated at a density of 25,000 cells in a chamber slide (Millipore, PEZGS0816)
one day before treatment. After one day, cells were treated with 17.6 μM of 3 for 8 hours and 24
hours. After the treatment, cells were washed with 1X cold PBS and fixed with 4%
paraformaldehyde, and permeabilized with 0.2% Triton-X100 in PBS for 10 min. Cells were then
washed twice with 1X PBS and blocked with 10% goat serum in PBS. Phospho-histone H2A.X
(cell signal, #9178) was incubated on the cells for 1 hour at room temperature in 10% goat

74
serum/PBS at a concentration of 1/100. After two PBS washes, cells were incubated with anti-
rabbit AlexaFluor 488 for 30 min at room temperature and mounted using Vectashield Mounting
Medium with DAPI (Vector Laboratories). Images were taken on a Nikon E600 Microscope with
a DS-Ri1 Digital Camera and NIS Elements Software. ImageJ software was used to count cells.
The number of DAPI positive cells that were also positive for phosphor-histone H2A.X were
expressed as a percentage of total DAPI stained cells. Only cells with defined foci were counted
as positive. At least three random fields from three independent experiments were counted.
3.4 Conclusions.
Three new diaza-anthracene analogs were identified, diazaquinomycin E (12), F (13), and
G (14) from the culture broth of a marine-derived Streptomyces sp. DAQE and its known analog
DAQA exhibited moderate cytotoxicity toward OVCAR5 cells (LC50 of 9.0 and 8.8 μM,
respectively). At lethal concentrations of 3, evidence of DNA damage was seen with induction of
apoptosis through cleaved-PARP. Among existing diazaquinomycins, 12–14 are the first reported
members of the class to exhibit a variation in the diaza-anthracene core skeleton. Though this class
of metabolites was initially identified from this strain based on moderate cytotoxicity toward
OVCAR5 cells, additional studies in our laboratory have revealed that the DAQs exhibit promising
antibiotic activity against TB. Detailed analysis of this bioactivity and the drug-lead potential of
this class is described thoroughly in Chapter 1.
Cytotoxic evaluation is important in any rigorous characterization of a pre-clinical
antibiotic drug-lead. In the case of a promising antibiotic lead, selectivity for bacterial growth
inhibition over cytotoxicity is desirable and cancer cell line screenings are often read as a proxy
for potential general cytotoxicity. While 3 was inactive against the non-cancerous Vero cell line,
consideration of cytotoxicity towards cancer cell lines is important. While a moderate cytotoxicity
LC50 value of 8.8 μM was observed in this study, 3 exhibited a remarkably potent and selective

75
inhibition of M. tuberculosis at an MIC of 0.28 µM. This amounts to an approximate 30-fold
increase in bioactivity over OVCAR5 inhibition. Note that the LC50 value is the concentration at
which 3 kills 50% of OVCAR5 cells, while the MIC value is the concentration at which 3 inhibits
growth of 90% of mycobacteria. Considering the differences in inhibition percentage used to
generate each data value, it becomes clear – a concentration that could kill M. tuberculosis in vitro
is ever farther outside the window of relevant OVCAR5 cytotoxicity. This selectivity justified our
extensive study of this class for its potential as an anti-TB drug candidate. However, through our
later biological characterization of 3 in Chapter 1, two cancer cell lines, MDA-MB-435 (0.09 μM)
and OVCAR3 (0.48 μM) were inhibited to levels closer to DAQ antibiotic activity. The lack of
generalized cytotoxicity remains promising but these values beg for future investigation both for
continued assessment of 3 as a viable drug lead and for the potential that a cytotoxic mechanism
might inform the anti-tuberculosis mechanism.
76
4. A PIMARANE DITERPENE AND CYTOTOXIC ANGUCYCLINES FROM A
MARINE-DERIVED MICROMONOSPORA SP. IN VIETNAM’S EAST SEA.⊥
4.1. Introduction.
The terpene class is a structurally diverse group of natural products with approximately
60,000 members. A recent study unveiled that the capacity of actinomycetes to produce the
diterpene subclass has been significantly underestimated, where 25 of 100 randomly selected
strains were identified as potential diterpene producers.155 Despite this, only an estimated twenty
diterpenes of actinomycete origin have been reported to date.156 This is an exceedingly scarce
fraction of the nearly 12,000 diterpenes described in the peer-reviewed literature, which are
predominantly plant- and fungal-derived. In the current study, we report the rare isolation of a
diterpene from an actinomycete strain.
As part of our program to explore the potential of marine and fresh water-derived
actinomycete secondary metabolites to serve as antibiotic and anticancer drug leads, we have
partnered with the Vietnam Academy of Science and Technology to explore Vietnam’s East Sea
to provide such leads.89, 157 The East Sea in Vietnam covers an area of approximately three-million
km2 and traces 3000 km of coastline. This stretch is comprised of a multitude of
microenvironments covering depths from 200 m to 5000 m. The marine biodiversity within the
East Sea is considered to be some of the most extensive in the world, yet it remains poorly
understood and explored. In the current study, through a screening of our fraction library against
M. tuberculosis in the LORA which revealed a fraction with an MIC of 1.0 μg/mL, we identified
an actinomycete isolated from sediment collected off the Cát Bà peninsula in the East Sea of
⊥Reproduced with permission from Mullowney, M.; Ó hAinmhire, E.; Tanouye, U.; Burdette, J.; Pham, V.; Murphy,
B. A Pimarane Diterpene and Cytotoxic Angucyclines from a Marine-Derived Micromonospora sp. in Vietnam’s East
Sea. Marine drugs 2015, 13, 5815. Utilized under the Creative Commons license. More information available via the
Internet at: creativecommons.org/licenses/by/4.0/

77
Vietnam. From this strain we isolated and characterized the novel diterpene isopimara-2-one-3-ol-
8,15-diene (15) and lagumycin B (16), an angucycline that had yet to receive full structural
characterization in the peer-reviewed literature (Figure 17).158 In addition, we identified the
previously reported angucyclines dehydrorabelomycin (17),159, 160 phenanthroviridone (18),161, 162 and
WS-5995 A (19).163, 164 Upon purification, these compounds were found to exhibit varying levels
of cytotoxicity against a panel of ovarian cancer cell lines, indicating a toxicity not specific to the
anti-TB activity observed when screening the parent fraction. Herein we present the structure
elucidation and biological activity of these compounds.

78
4.2. Results and discussion.
4.2.1 Structure elucidation of isopimara-2-one-3-ol-8,15-diene (15) and
lagumycin B (16).
Following a series of chromatographic experiments, 15 was obtained as a colorless solid
(Figure 17). Combined HRMS and NMR experiments allowed for the assignment of the molecular
formula as C20H30O2, indicative of six degrees of unsaturation. 1H and 13C NMR data are shown
in Table 11. In the 1H NMR spectrum, we observed evidence for four sp3 quaternary carbon-bound
methyl groups, one vinyl group, an oxymethine geminal to a hydroxy group, a pair of geminal
Table 11. 1H and 13C NMR data (CDCl3) of 15.
Position 13C, Type a 1H, Mult. (J, Hz) b,c
1ax 49.8, CH2 2.25, d (12.3)
1eq 2.58, d (12.3)
2 211.8,C
3 83.0, CH 3.91, d (4.0)
3-OH 3.44, d (4.0)
4 45.3, C
5 50.3, CH 1.78, m
6 18.8, CH2 1.58, m
1.80, m
7 32.3, CH2 2.03, m
8 126.4, C
9 134.3, C
10 43.8, C
11ax 21.4, CH2 1.76, m
11eq 1.88, m
12eq 34.8, CH2 1.33, m
12ax 1.53, m
13 35.3, C
14 41.6, CH2 1.76, m
1.88, m
15 145.9, CH 5.72, dd (17.5, 10.7)
16 111.2, CH2 4.85, dd (17.5, 1.4)
4.92, dd (10.7, 1.4)
17 28.3, CH3 0.98, s
18 20.6, CH3 0.93, s
19 29.3, CH3 1.21, s
20 16.5, CH3 0.72, s
a 226.2 MHz; b 600 MHz; c s = singlet; d = doublet; dd = doublet of doublets; m = multiplet.

79
hydrogens adjacent to a carbonyl, and additional methylene and methine groups on 15 that
constituted the remainder of a pimarane diterpene core skeleton.
Analysis of 13C- DEPTQ and HSQC NMR data for 15 indicated the presence of one
carbonyl carbon (δC 211.8, C-2), two fully-substituted endocyclic alkene carbons (δC 126.4, C-8;
134.3, C-9), one vinyl methylene carbon (δC 111.2, C-16), one vinyl methine carbon (δC 145.9, C-
15), one oxymethine carbon (δC 83.0, C-3), and fourteen additional sp3 carbons. Given that the
molecular formula of 15 afforded six degrees of unsaturation and the molecule contained one
carbonyl, one vinyl, and one endocyclic alkene group, the remaining three degrees were satisfied
by the tricyclic pimarane ring system. Key HMBC, COSY, and 1D-TOCSY correlations are given
in Figure 18.
Figure 17. Structures of compounds 15-19.

80
Figure 18. Key 2D NMR correlations of 15 and 16.
The connectivity of the two distinct spin systems of C-11–C-12 and C-5–C-6–C-7 was
determined by interpretation of the COSY NMR spectrum. Confirmation of these assignments was
supported by a series of 1D-TOCSY experiments that exploited the solvent effect of C6D6 on lower
frequency chemical shifts, which served to deconvolute the signal overlap observed when 1H NMR
experiments were run in CDCl3 (Table A6 and Figures A66–A70).165 At this point in the
elucidation process, we used HMBC correlations of methyl groups in 15 to piece together the
tricyclic diterpene core. Geminal methyl groups were confirmed at C-4 based on HMBC
correlations from H3-19 and H3-20 to C-3, C-4, and C-5. Signal H3-18 exhibited correlations to C-
1, C-9, and C-10, suggesting a bond to the quaternary C-10. The connectivity of ring A was further
established by observation of HMBC correlations from H2-1 to C-3, C-5, C-9, C-10, and C-18,
81
suggesting that this methylene was between the C-2 carbonyl and C-10. Additionally, the
oxymethine signal (H-3) showed HMBC couplings to C-2, C-4, C-19, and C-20, while the hydroxy
signal (3-OH) displayed correlations to C-2 and C-3. This supported that H-3 and 3-OH were
connected to the same carbon, which was positioned between the carbonyl at C-2 and the
quaternary C-4. Couplings were also observed from H-5 to C-4 and C-10, solidifying the fusion
of rings A and B. The connectivity of the C-5–C-6–C-7 spin system from ring A to the remainder
of the core was established by observation of HMBC correlations from H2-7 to C-8 and C-9.
Correlations from H2-14 to C-7, C-8, C-9, C-12, C-15, and C-17 placed it between the alkene C-8
and quaternary C-13. Resonance H3-17 showed HMBC correlations to C-12, C-13, C-14, and C-15,
placing it at position 13. HMBC correlations between the vinyl methine hydrogen (H-15) and C-13,
C-14, and C-17 supported this, while correlations from H2-16 to C-15 and C-13 provided further
evidence for connectivity of the vinyl group to C-13. The remaining connectivity of ring C was
satisfied by HMBC correlations from H2-11 to C-8, C-9, and C-13.
A 2D-NOESY NMR experiment was employed to determine the relative stereochemistry of
15, revealing correlations between H3-20 and H3-18, H3-18 and H-11ax, H-11ax and H-12eq, and H-
12eq and H3-17; this suggested that these hydrogens projected out from the same face of the
molecule. This orientation was supported by the observation of NOESY correlations between
hydrogens H-3 and H3-19, and H3-19 and H-5, projecting from the opposite face of the molecule
(Figure 18).
To identify the absolute configuration of centers in 15, a CD spectrum was acquired and
analyzed (Figure A73). Compound 15 exhibited a positive Cotton effect at the n → π* carbonyl
transition of 290 nm, indicating that the β-axial methyl group (C-18) was in the rear upper left
octant when the octant rule was applied.166 Thus, the absolute configuration of stereocenters in 15
was elucidated as 3R, 5R, 10S, and 13S, establishing the structure of 15 as (3R,5R,10S,13S)-3-
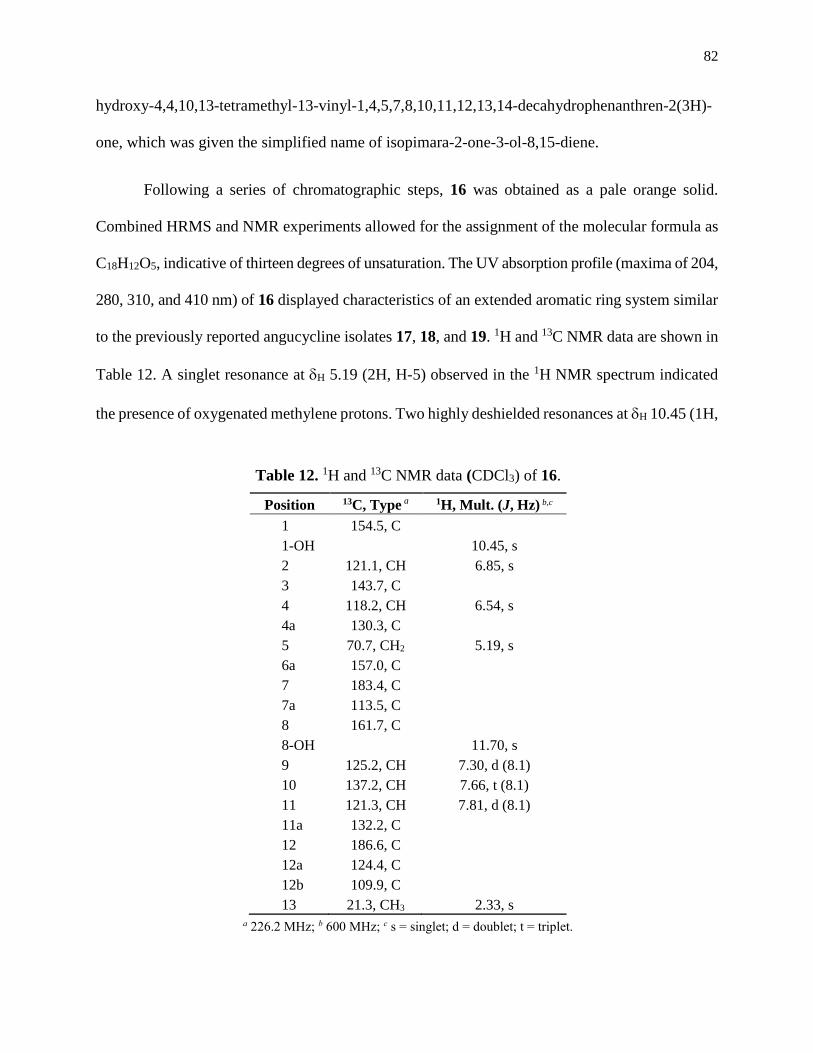
82
hydroxy-4,4,10,13-tetramethyl-13-vinyl-1,4,5,7,8,10,11,12,13,14-decahydrophenanthren-2(3H)-
one, which was given the simplified name of isopimara-2-one-3-ol-8,15-diene.
Following a series of chromatographic steps, 16 was obtained as a pale orange solid.
Combined HRMS and NMR experiments allowed for the assignment of the molecular formula as
C18H12O5, indicative of thirteen degrees of unsaturation. The UV absorption profile (maxima of 204,
280, 310, and 410 nm) of 16 displayed characteristics of an extended aromatic ring system similar
to the previously reported angucycline isolates 17, 18, and 19. 1H and 13C NMR data are shown in
Table 12. A singlet resonance at H 5.19 (2H, H-5) observed in the 1H NMR spectrum indicated
the presence of oxygenated methylene protons. Two highly deshielded resonances at H 10.45 (1H,
Table 12. 1H and 13C NMR data (CDCl3) of 16.
Position 13C, Type a 1H, Mult. (J, Hz) b,c
1 154.5, C
1-OH 10.45, s
2 121.1, CH 6.85, s
3 143.7, C
4 118.2, CH 6.54, s
4a 130.3, C
5 70.7, CH2 5.19, s
6a 157.0, C
7 183.4, C
7a 113.5, C
8 161.7, C
8-OH 11.70, s
9 125.2, CH 7.30, d (8.1)
10 137.2, CH 7.66, t (8.1)
11 121.3, CH 7.81, d (8.1)
11a 132.2, C
12 186.6, C
12a 124.4, C
12b 109.9, C
13 21.3, CH3 2.33, s a 226.2 MHz; b 600 MHz; c s = singlet; d = doublet; t = triplet.
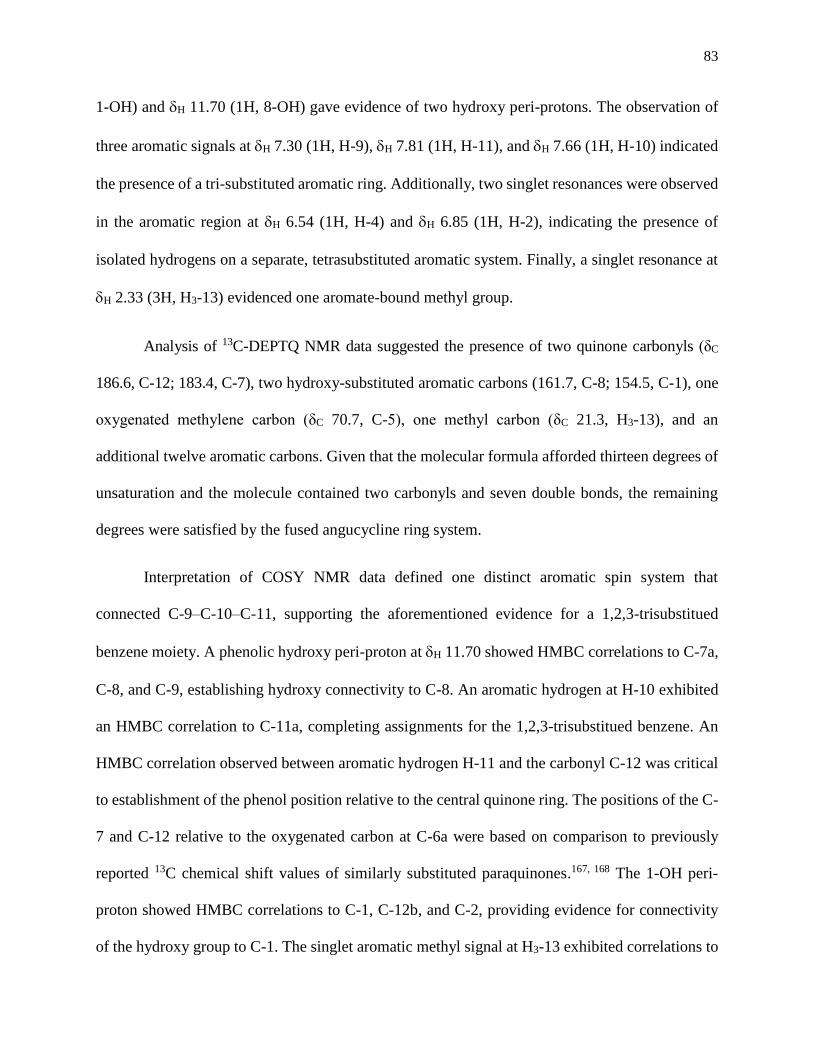
83
1-OH) and H 11.70 (1H, 8-OH) gave evidence of two hydroxy peri-protons. The observation of
three aromatic signals at H 7.30 (1H, H-9), H 7.81 (1H, H-11), and H 7.66 (1H, H-10) indicated
the presence of a tri-substituted aromatic ring. Additionally, two singlet resonances were observed
in the aromatic region at H 6.54 (1H, H-4) and H 6.85 (1H, H-2), indicating the presence of
isolated hydrogens on a separate, tetrasubstituted aromatic system. Finally, a singlet resonance at
H 2.33 (3H, H3-13) evidenced one aromate-bound methyl group.
Analysis of 13C-DEPTQ NMR data suggested the presence of two quinone carbonyls (δC
186.6, C-12; 183.4, C-7), two hydroxy-substituted aromatic carbons (161.7, C-8; 154.5, C-1), one
oxygenated methylene carbon (δC 70.7, C-5), one methyl carbon (δC 21.3, H3-13), and an
additional twelve aromatic carbons. Given that the molecular formula afforded thirteen degrees of
unsaturation and the molecule contained two carbonyls and seven double bonds, the remaining
degrees were satisfied by the fused angucycline ring system.
Interpretation of COSY NMR data defined one distinct aromatic spin system that
connected C-9–C-10–C-11, supporting the aforementioned evidence for a 1,2,3-trisubstitued
benzene moiety. A phenolic hydroxy peri-proton at H 11.70 showed HMBC correlations to C-7a,
C-8, and C-9, establishing hydroxy connectivity to C-8. An aromatic hydrogen at H-10 exhibited
an HMBC correlation to C-11a, completing assignments for the 1,2,3-trisubstitued benzene. An
HMBC correlation observed between aromatic hydrogen H-11 and the carbonyl C-12 was critical
to establishment of the phenol position relative to the central quinone ring. The positions of the C-
7 and C-12 relative to the oxygenated carbon at C-6a were based on comparison to previously
reported 13C chemical shift values of similarly substituted paraquinones.167, 168 The 1-OH peri-
proton showed HMBC correlations to C-1, C-12b, and C-2, providing evidence for connectivity
of the hydroxy group to C-1. The singlet aromatic methyl signal at H3-13 exhibited correlations to

84
C-3, C-2, and C-4 in the HMBC spectrum, placing it meta to the hydroxy group at C-1. HMBC
correlations from the oxygenated methylene at H2-5 to C-4a, C-4, C-12b, and C-6a established
connectivity of the naphthoquinone fragment to the phenol moiety. Key COSY and HMBC
correlations are given in Figure 18. Thus, the structure of 16 is as shown with the name
lagumycin B, following the structure and nomenclature established in the 1995 dissertation by
Balk-Bindseil and Laatsch.158
The characterization of known compounds 17–19 was based on comparison of 1H NMR
and HRMS data with those appearing in literature (Figures A80–A86).159-164
4.2.2 Antibiotic activity evaluation of isopimara-2-one-3-ol-8,15-diene (15),
lagumycin B (16), dehydrorabelomycin (17), phenanthroviridone (18), and
WS 5995 A (19) against M. tuberculosis in the MABA.
Following their identification, the MABA was used in the ITR by Sang Hyun Cho to test
the ability of compounds 1-5 to inhibit replicating M. tuberculosis H37Rv (ATCC 27294) in vitro
as previously described.93, 94, 157 Compounds 16–18 exhibited minimum inhibitory concentrations
of 2.01 μg/mL, 1.01 μg/mL, and 0.72 μg/mL (MICs; defined as the lowest concentration resulting
in ≥90% growth inhibition of H37Rv, and averaged from triplicates), respectively, while
compounds 15 and 19 lacked significant activity. Additionally, none of the compounds were
Table 13. In vitro anti-TB activity of 15-19.
Compound H37Rv MIC (µg/mL)
MABA LORA
15 19.4 > 50
16 2.01 25.7
17 1.01 19.6
18 0.72 17.8
19 22.7 > 50

85
significantly active when tested for their ability to inhibit non-replicating M. tuberculosis H37Rv
(ATCC 27294) in the LORA (Table 13).93, 94, 96, 157 The potent MIC first observed in the parent
fraction from our library was not reproduced by any of these compounds, indicating that either the
large-scale strain regrow did not afford production of the active component or the compound
responsible for the activity was not isolated.
4.2.3 Cytotoxicity evaluation of isopimara-2-one-3-ol-8,15-diene (15),
lagumycin B (16), dehydrorabelomycin (17), phenanthroviridone (18), and
WS 5995 A (19).
To further characterize the bioactivity profile of compounds 15–19, assessment of
cytotoxicity was performed using two high-grade ovarian cancer cell lines, OVCAR4 and
Kuramochi.169 Potential for selective cytotoxicity was evaluated using two non-cancerous mouse
cell lines representing the putative progenitor cells of ovarian cancer, murine ovarian surface
epithelial (MOSE) and murine oviductal epithelial (MOE). Screening of 15–19 against this panel
by Eoghainín Ó hAinmhire in the lab of Joanna Burdette revealed 17 and 18 to be non-specifically
cytotoxic, which was in accord with their previously reported bioactivities.159, 161, 162, 170-172
Compound 16 exhibited up to 14-fold enhanced cytotoxicity against non-cancerous murine cell
lines MOSE and MOE, with LC50 values of 9.80 µM and 10.8 µM, respectively. Generally
speaking, this para-quinone scaffold is not an attractive lead, as higher toxicity in non-tumorigenic
Table 14. In vitro cytotoxicity of 15-19.
Compound Cytotoxicity LC50 (µM) a
Kuramochi OVCAR4 MOSE MOE
15 >33.1 >33.1 >33.1 >33.1
16 >32.5 >32.5 9.80 10.8
17 6.72 11.0 3.50 28.5
18 1.11 4.82 2.85 6.20
19 18.6 127 >149 >149 a doxorubicin was used as the positive control and was lethal at the lowest concentration tested
(0.078 µM).
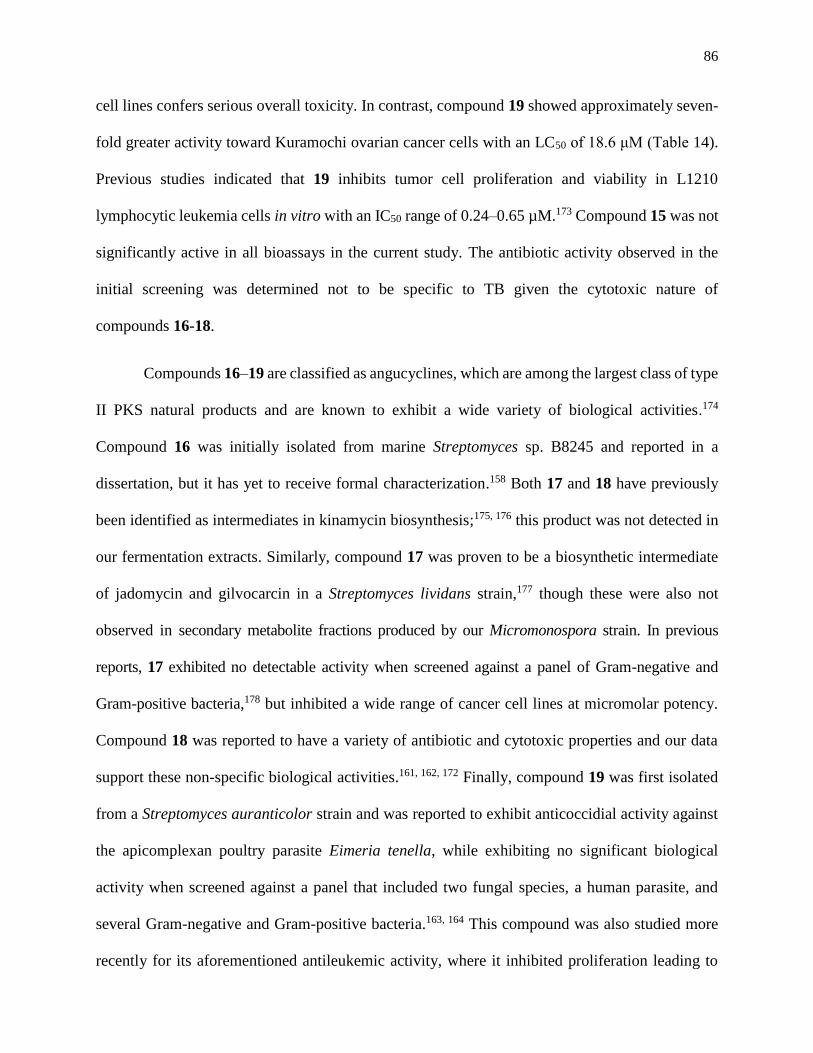
86
cell lines confers serious overall toxicity. In contrast, compound 19 showed approximately seven-
fold greater activity toward Kuramochi ovarian cancer cells with an LC50 of 18.6 μM (Table 14).
Previous studies indicated that 19 inhibits tumor cell proliferation and viability in L1210
lymphocytic leukemia cells in vitro with an IC50 range of 0.24–0.65 µM.173 Compound 15 was not
significantly active in all bioassays in the current study. The antibiotic activity observed in the
initial screening was determined not to be specific to TB given the cytotoxic nature of
compounds 16-18.
Compounds 16–19 are classified as angucyclines, which are among the largest class of type
II PKS natural products and are known to exhibit a wide variety of biological activities.174
Compound 16 was initially isolated from marine Streptomyces sp. B8245 and reported in a
dissertation, but it has yet to receive formal characterization.158 Both 17 and 18 have previously
been identified as intermediates in kinamycin biosynthesis;175, 176 this product was not detected in
our fermentation extracts. Similarly, compound 17 was proven to be a biosynthetic intermediate
of jadomycin and gilvocarcin in a Streptomyces lividans strain,177 though these were also not
observed in secondary metabolite fractions produced by our Micromonospora strain. In previous
reports, 17 exhibited no detectable activity when screened against a panel of Gram-negative and
Gram-positive bacteria,178 but inhibited a wide range of cancer cell lines at micromolar potency.
Compound 18 was reported to have a variety of antibiotic and cytotoxic properties and our data
support these non-specific biological activities.161, 162, 172 Finally, compound 19 was first isolated
from a Streptomyces auranticolor strain and was reported to exhibit anticoccidial activity against
the apicomplexan poultry parasite Eimeria tenella, while exhibiting no significant biological
activity when screened against a panel that included two fungal species, a human parasite, and
several Gram-negative and Gram-positive bacteria.163, 164 This compound was also studied more
recently for its aforementioned antileukemic activity, where it inhibited proliferation leading to

87
apoptosis through DNA cleavage, blockage of nucleoside transport and inhibition of DNA, RNA,
and protein synthesis.173 To our knowledge, this study is the first to report cytotoxicity of
compound 19 in carcinomas. In most cases, 18 is significantly more cytotoxic than 17 and 19.
Presumably, this may be due to structural differences including the pyridine function in 18 that is
absent in the others. Additionally, a contributing factor to reduced cytotoxicity may be the loss of
aromaticity in the adjacent anthraquinone ring (19), though further biological testing and structure
activity analyses are required to support this.
4.3 Methods.
4.3.1 General experimental procedures.
Optical rotation measurement was performed in MeOH using a 10.0 cm cell on a
PerkinElmer 241 polarimeter at 25 °C. The UV spectra were measured on a Shimadzu Pharma
Spec UV-1700 spectrophotometer. NMR spectra were obtained on a Bruker 600 MHz DRX NMR
spectrometer equipped with an inverse 5 mm TXI cryogenic probe with z-axis pfg and XWINNMR
version 3.5 operating software, and a 900 (226.2) MHz Bruker AVANCE NMR spectrometer
equipped with an inverse 5 mm TCI cryogenic probe with z-axis pfg and TopSpin version 1.3
operating software at the University of Illinois at Chicago Center for Structural Biology. Chemical
shifts (δ) are given in ppm and coupling constants (J) are reported in Hz. 1H and 13C NMR
resonances of 15 and 16 are reported in Tables 11 and 12, respectively. 1H and 13C NMR chemical
shifts were referenced to the CDCl3 (δH 7.26 ppm and δC 77.0 ppm, respectively) and C6D6 solvent
signals (δH 7.16 ppm and δC 128.1 ppm, respectively). High resolution mass spectra were obtained
on a Waters Synapt Q-TOF mass spectrometer at the University of Illinois at Chicago Research
Resources Center (UIC RRC). High-performance liquid chromatography (HPLC-UV) data were
obtained using a Hewlett-Packard series 1100 system controller and pumps with a Model G1315A
diode array detector (DAD) equipped with a reversed-phase C18 column (Phenomenex Luna,

88
100 mm × 4.6 mm, 5 μm; Torrance, CA, USA) at a flow rate of 0.5 mL·min−1. Semi-preparative
HPLC scale separations were performed using a Hewlett Packard Series 1050 system with a
Phenomenex Luna semi-preparative C18 column (250 mm × 10 mm, 5 μm) at a flow rate of
2.4 mL·min−1. Preparative HPLC scale separations were performed using a Waters LC4000
System equipped with a Phenomenex Luna preparative C18 column (250 mm × 21.2 mm, 5 μm) at
a flow rate of 16 mL·min−1. Silica gel column chromatography was conducted using Bonna-Angela
Technologies Cleanert® silica gel (Wilmington, DE, USA) with an average particle size of 40–
60 μm and an average pore size of 60 Å.
4.3.2 Collection and identification of actinomycete strain G039.
Strain G039 was isolated from a sediment sample collected by PONAR at a depth of 22 m,
from ca. 3.3 miles off the coast southeast of Cát Bà Peninsula in Vietnam (204130 N,
1070558 E) in July of 2011. Strain G039 (GenBank accession number KR703606) shared 99%
16S rRNA gene sequence identity with the type strain Micromonospora haikouensis (GenBank
accession number NR117442).179
4.3.3 Fermentation and extraction.
Strain G039 was grown in 38 × 1 L portions in Fernbach flasks containing high nutrient
media components in artificial seawater (10 g starch, 4 g yeast extract, 2 g peptone, 1 g calcium
carbonate, 100 mg potassium bromide, 40 mg iron sulfate, and 33.3 g Instant Ocean® per liter of
dH2O) for 7 days at 21 °C while shaking at 220 rpm. Sterilized Amberlite XAD-16 resin (15 g·L−1)
was added to each flask to absorb the extracellular secondary metabolites. The culture medium
and resin were shaken for 10 h and filtered using cheesecloth to remove the resin. The resin, cell
mass, and cheesecloth were extracted with acetone overnight, concentrated under vacuum, and
partitioned between water and ethyl acetate. The organic layer was dried under vacuum to afford
3.52 g of extract.

89
4.3.4 Isolation and characterization of isopimara-2-one-3-ol-8,15-diene (15),
lagumycin B (16).
The organic layer from the liquid-liquid partition was fractionated using silica gel flash
column chromatography (23 cm × 3.5 cm, 85 g silica) eluting with a step gradient solvent system
of 200 mL 100% hexanes (HEX), 200 mL 90% HEX:10% dichloromethane (DCM), 200 mL 70%
HEX:30% DCM, 200 mL 100% DCM, 200 mL 70% DCM:30% ethyl acetate (EtOAc), 200 mL
70% EtOAc:30% DCM, 200 mL 100% ethyl acetate, 200 mL 95% EtOAc:5% 2-propanol, 200
mL 90% EtOAc:10% methanol (MeOH), 200 mL 50% EtOAc:50% MeOH, 400 mL 95 %
MeOH:5% ammonium hydroxide (NH4OH) to afford eleven fractions. Upon re-screening, it was
determined that fraction 3 contained the bioactive constituents, thus, it was further separated using
RP-C18 preparative HPLC (16 mL·min−1, gradient of 50% aqueous MeOH to 100% MeOH over
25 min, followed by an isocratic flow of 100% MeOH for 15 min), to afford 13 fractions. Fractions
6 and 11 exhibited biological activity so they were further separated.
Fraction 6 was further purified using RP-C18 semi-preparative HPLC (2.4 mL·min−1,
gradient of 70% aqueous MeOH to 80% MeOH for 37.5 min, followed by an isocratic flow of
100% ACN for 10 min) to afford phenanthroviridone (18, tR 37.5 min, 0.66 mg, 0.019% yield),
lagumycin B (16, tR 40.2 min, 0.9 mg, 0.026% yield) and WS-5995 A (19, tR 42.0 min, 1.2 mg,
0.034% yield).
Fraction 11 was further separated using RP-C18 semi-preparative HPLC (2.4 mL·min−1,
gradient of 80% aqueous MeOH to 90% MeOH for 37.5 min, followed by an isocratic flow of 100%
ACN for 10 min) to afford 8 fractions. Fraction 2 was further purified using two iterations of RP-C18
semi-preparative HPLC (2.4 mL·min−1, gradient of 80% aqueous MeOH to 90% MeOH for 37.5
min, followed by an isocratic flow of 100% ACN for 10 min) to afford dehydrorabelomycin (17,
tR 26.7 min, 0.4 mg, 0.011% yield). Purification of compound 17 also afforded isopimara-2-one-3-ol-
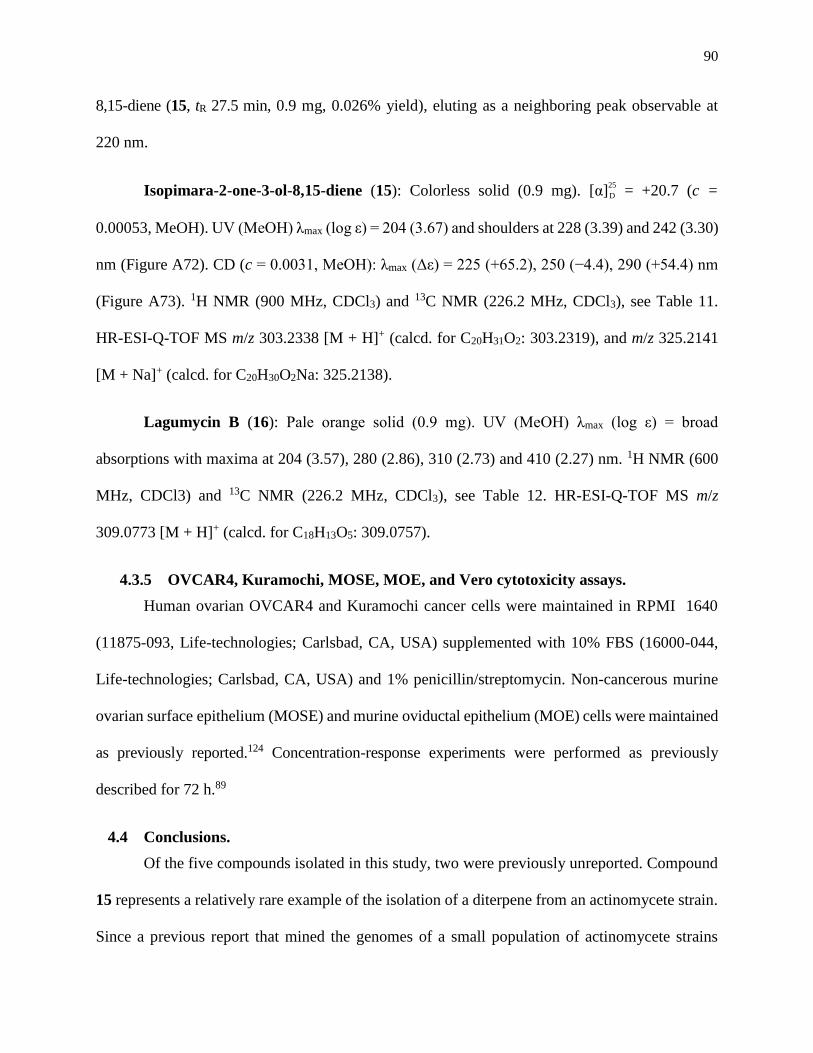
90
8,15-diene (15, tR 27.5 min, 0.9 mg, 0.026% yield), eluting as a neighboring peak observable at
220 nm.
Isopimara-2-one-3-ol-8,15-diene (15): Colorless solid (0.9 mg). [α]25
D = +20.7 (c =
0.00053, MeOH). UV (MeOH) λmax (log ε) = 204 (3.67) and shoulders at 228 (3.39) and 242 (3.30)
nm (Figure A72). CD (c = 0.0031, MeOH): λmax (Δε) = 225 (+65.2), 250 (−4.4), 290 (+54.4) nm
(Figure A73). 1H NMR (900 MHz, CDCl3) and 13C NMR (226.2 MHz, CDCl3), see Table 11.
HR-ESI-Q-TOF MS m/z 303.2338 [M + H]+ (calcd. for C20H31O2: 303.2319), and m/z 325.2141
[M + Na]+ (calcd. for C20H30O2Na: 325.2138).
Lagumycin B (16): Pale orange solid (0.9 mg). UV (MeOH) λmax (log ε) = broad
absorptions with maxima at 204 (3.57), 280 (2.86), 310 (2.73) and 410 (2.27) nm. 1H NMR (600
MHz, CDCl3) and 13C NMR (226.2 MHz, CDCl3), see Table 12. HR-ESI-Q-TOF MS m/z
309.0773 [M + H]+ (calcd. for C18H13O5: 309.0757).
4.3.5 OVCAR4, Kuramochi, MOSE, MOE, and Vero cytotoxicity assays.
Human ovarian OVCAR4 and Kuramochi cancer cells were maintained in RPMI 1640
(11875-093, Life-technologies; Carlsbad, CA, USA) supplemented with 10% FBS (16000-044,
Life-technologies; Carlsbad, CA, USA) and 1% penicillin/streptomycin. Non-cancerous murine
ovarian surface epithelium (MOSE) and murine oviductal epithelium (MOE) cells were maintained
as previously reported.124 Concentration-response experiments were performed as previously
described for 72 h.89
4.4 Conclusions.
Of the five compounds isolated in this study, two were previously unreported. Compound
15 represents a relatively rare example of the isolation of a diterpene from an actinomycete strain.
Since a previous report that mined the genomes of a small population of actinomycete strains

91
suggested that this phylum has a far greater capacity to produce diterpenes (25 of 100 strains) than
is represented in the peer reviewed literature, it is possible that this discrepancy is a product of
these pathways remaining silent under laboratory growth conditions, or of the methods used to
isolate natural products from bacteria, namely bioassay-guided fractionation.155 One possible
explanation of the latter phenomenon is that specific classes of diterpenes are conserved within
Actinobacteria, and that these classes are not biologically active in the typical barrage of assays
used to discover small molecule leads, though in the absence of extensive genome mining and
subsequent structure identification-bioactivity experiments, this will remain speculation.
The novel diterpene isopimara-2-one-3-ol-8,15-diene (15) was isolated along with the
angucycline lagumycin B (16), and three other angucyclines from a Micromonospora sp. collected
in the East Sea of Vietnam. The angucyclines exhibited varying degrees of TB inhibition in
addition to cytotoxicity against a panel of cancerous and non-cancerous cell lines, with the notable
exception of WS-5995 A (19), which showed enhanced cytotoxicity against the Kuramochi cell
line when compared to non-tumorigenic cell lines. Though not significantly active in our
bioassays, the discovery of isopimara-2-one-3-ol-8,15-diene contributes to the growing but still
relatively small number of diterpenes identified from actinomycetes. This study highlights our
collaborative efforts to discover novel biologically active molecules from the large, underexplored,
and biodiversity-rich waters of Vietnam’s East Sea.

92
5. CONCLUSIONS.
The pathogen M. tuberculosis is the deadliest of infectious agents, its annual death toll
having surpassed HIV in 2015. Fortunately, millions of years of evolution have afforded
microorganisms with the chemical arsenal necessary to target specific biological molecules in
other organisms for their inhibition. Modern analytical, chemical, and biochemical techniques
allow the application of these chemical weapons from nature to therapeutic roles for treatment of
disease. The investigations presented herein give evidence for the importance of natural products
drug discovery from aquatic derived actinomycete bacteria and include the novel approach of
utilizing freshwater environments as a source for new strains with novel chemistry. In seeking
novel molecules with anti-tuberculosis properties, several known compounds with somewhat
promiscuous activity were discovered, while a series of novel diazaquinomycin analogs were
identified that revealed a remarkable selectivity of this antibiotic class for TB inhibition.
In the first two studies, novel diazaquinomycin analog antibiotics were discovered from
actinomycete strains collected in Lake Michigan and the marine environment. Various analytical
and spectroscopic techniques were employed to elucidate the unique structures of these
compounds. The potent and selective inhibition of M. tuberculosis by 3 was described and efforts
to elucidate the anti-TB MOA were undertaken as a large, international collaborative effort.
Despite the testing of 3 in a barrage of biochemical tests and whole-cell bioassays against a variety
of M. tuberculosis mutants, a definitive mechanism of action remains to be discovered. Study of 3
in vivo has been troublesome due largely to the compound’s poor solubility, but optimization for
new studies are currently underway. The full potential of this class as an anti-TB treatment remains
to be explored.
A separate study in Chapter 4 also aimed at identifying novel anti-TB agents described the
rare discovery of a novel pimarane diterpene from an actinomycete strain collected in the East Sea
93
of Vietnam. Though neither this compound nor the angucyclines from the same strain show
promise as drug-leads, this project establishes a collaboration aimed at searching the
underexplored aquatic environments around Vietnam for novel drug-leads while also educating a
generation of new researchers from that country who are typically not as involved in drug
discovery as other Asian countries or their Western counterparts.
Despite being humanity’s most deadly bacterial pathogen, much about M. tuberculosis and
its treatment remain to be understood. Current therapies can cure patients of the disease, but the
process is inefficient, with the use of multi-drug combination therapy regimens spanning months
if not years. Additionally, the incidence of tuberculosis resistant to all forms of treatment are
increasing.43 More responsible, consistent, monitored therapy is needed so that current therapies
don’t become obsolete with rising resistance and so that new therapies have endurance in the clinic.
With a need for new treatments comes a need for more researchers involved in discovery.
Populations tend to favor funding of health initiatives that are self-beneficial. Though TB research
efforts are mostly in the developed world they are still relatively sparse. Unfortunately, resources
for study of the disease in communities afflicted by the disease are far more scarce. Thus, new
efforts need to be made to involve those affected by TB in this biomedical research. Initiatives to
grow TB discovery labs in these communities can be found within the TB alliance (Kenya, South
Africa, Zambia, China, India) and even through the small collaboration between the Murphy lab
and VAST in Vietnam which resulted in the work described in Chapter 4 and elsewhere.30, 180, 181
Novel sources for chemical diversity could also greatly enhance the pursuit for new drug
leads. In the Murphy lab, we have successfully expanded the marine drug discovery paradigm to
include freshwater-derived actinomycetes,86, 157 and even more recently to explore the drug-lead
potential of molecules produced by freshwater sponges and their associated microbial
communities.182-189 To date, the only reports of metabolites unique to freshwater sponges are
94
discoveries of novel lipids and sterols182-188 and to our knowledge, the therapeutic potential of
compounds from their associated microbes is virtually unexplored.189, 190 This is surprising since
the microbial diversity in freshwater sponges suggest a competition for resources that may elicit
the production of antibiotics.189-192 We are currently collaborating with a community of “citizen
scientist” volunteer SCUBA divers from across the Great Lakes to engage in freshwater sponge
collection. Sponge tissues are currently being extracted in our lab while sponge-associated bacteria
and fungi are being isolated and grown for determination of the drug-lead potential of these
communities.
Data rich comprehensive approaches to characterization of secondary metabolism from
these new environmental sources are needed. We are advancing at an accelerated pace toward
elucidation of all small molecules in nature and at present, we are making profound transitional
leaps toward this end. Laboratories working to elucidate novel biosynthetic gene clusters
concurrently with identification of their products aim to accelerate comprehensive characterization
of individual secondary metabolites.193, 194 Other efforts are aimed at social media-style
collaborative engagement of researchers around the world for the characterization of large swaths
of chemical space by LC-MS and molecular networking.195 In conjunction with the rush to describe
natural products chemical space comes the ultimate purpose of identifying secondary metabolite
drug lead potential. Combining the aforementioned technologies with high-throughput bioassay
would result in high-definition multidimensional plots describing structure, biosynthesis, and
activity at once.
As we aim for a comprehensive elucidation of secondary metabolite space, advancements
in synthetic biology will meet along the way. Currently, there are simplified microbial cell chassis
being developed with the eventual aim of factory-scale production of molecules by only expressing
the most essential genes,196 custom rewriting of genetic code for the facilitation of a fully-

95
programmable microbe,197 and cell-free biosynthetic systems that do away with the microbe
altogether for a focus on in vitro enzymatic molecule production.198 Though swapping, removing,
or inserting modules in gene clusters is quite challenging today, soon these aforementioned
advances may allow for coding of custom proteins to reliably produce designer molecules more
safely, faster, and in greater abundance than is possible using synthetic chemistry.
Natural products remain viable and critical to the future of medicine. Continued exploration
of new small molecule resources coupled with development of new analytical and biological
engineering technologies will allow greater access to nature’s treasure trove of defenses in the
decades ahead. With concurrent research to greater understand disease, these efforts hold promise
for success in the arms race against drug resistance.

96
CITED LITERATURE.
1. Donoghue, H. D.; Spigelman, M.; Greenblatt, C. L.; Lev-Maor, G.; Bar-Gal, G. K.;
Matheson, C.; Vernon, K.; Nerlich, A. G.; Zink, A. R. Tuberculosis: From prehistory to
Robert Koch, as revealed by ancient DNA. Lancet Infect. Dis. 2004, 4, 584-592.
2. Comas, I.; Coscolla, M.; Luo, T.; Borrell, S.; Holt, K. E.; Kato-Maeda, M.; Parkhill, J.;
Malla, B.; Berg, S.; Thwaites, G.; Yeboah-Manu, D.; Bothamley, G.; Mei, J.; Wei, L.;
Bentley, S.; Harris, S. R.; Niemann, S.; Diel, R.; Aseffa, A.; Gao, Q.; Young, D.; Gagneux,
S. Out-of-africa migration and Neolithic coexpansion of Mycobacterium tuberculosis with
modern humans. Nature Genet. 2013, 45, 1176-1182.
3. Wilson, L. G. Commentary: Medicine, population, and tuberculosis. Int. J. Epidemiol.
2005, 34, 521-524.
4. Riva, M. A. From milk to rifampicin and back again: History of failures and successes in
the treatment for tuberculosis. J. Antibiot. 2014, 67, 661-665.
5. Clark, J., The influence of climate in the prevention and cure of chronic disease, more
particularly of the chest and digestive organs. Thomas and George Underwood: London,
1829.
6. Russell, D. G.; Barry, C. E.; Flynn, J. L. Tuberculosis: what we don’t know can, and does,
hurt us. Science 2010, 328, 852-856.
7. Schatz, A.; Bugie, E.; Waksman, S. A. Streptomycin, a substance exhibiting antibiotic
activity against Gram-positive and Gram-negative bacteria. 1944. Proc. Soc. Exp. Biol.
Med. 1944, 55, 66–69.
8. Streptomycin treatment of pulmonary tuberculosis: A medical research council
investigation. Br. Med. J. 1948, 2, 769-782.
9. Musser, J. M. Antimicrobial agent resistance in mycobacteria: Molecular genetic insights.
Clin. Microbiol. Rev. 1995, 8, 496-514.
10. Fox, W.; Sutherland, I.; Daniels, M. A five-year assessment of patients in a controlled trial
of streptomycin in pulmonary tuberculosis. Report to the Tuberculosis Chemotherapy
Trials Committee of the Medical Reasearch Council 1954, 23, 347-366.
11. Treatment of pulmonary tuberculosis with streptomycin and para-amino-salicylic acid: A
medical research council investigation. Br. Med. J. 1950, 2, 1073-1085.
12. Treatment of pulmonary tuberculosis with isoniazid: A medical research council
investigation. Br. Med. J. 1952, 2, 735-746.
13. Various combinations of isoniazid with streptomycin or with P.A.S. in the treatment of
pulmonary tuberculosis; seventh report to the Medical Research Council by their
Tuberculosis Chemotherapy Trials Committee. Br. Med. J. 1955, 1, 435-445.
14. An international investigation of the efficacy of chemotherapy in previously untreated
patients with pulmonary tuberculosis; International Union again Tuberculosis: 1964; 1-191.
15. Lehmann, J. Twenty years afterward: Historical notes on the discovery of the
antituberculosis effect of para-aminosalicylic acid (PAS) and the first clinical trials. Am.
Rev. Respir. Dis. 1964, 90, 953-956.
16. Fox, W.; Sutherland, I. A. N. A five-year assessment of patients in a controlled trial of
streptomycin, para-aminosalicylic acid, and streptomycin plus para-aminosalicylic acid, in
pulmonary tuberculosis. Q. J. Med. 1956, 25, 221-244.
17. Mitchison, D.; Davies, G. The chemotherapy of tuberculosis: past, present and future. Int.
J. Tuberc. Lung Dis. 2012, 16, 724-732.
18. Maggi, N.; Pasqualucci, C. R.; Ballotta, R.; Sensi, P. Rifampicin: A new orally active
rifamycin. Chemotherapy 1966, 11, 285-292.

97
19. Doster, B.; Murray, F. J.; Newman, R.; Woolpert, S. F. Ethambutol in the initial treatment
of pulmonary tuberculosis. U. S. Public health service tuberculosis therapy trials. Am. Rev.
Respir. Dis. 1973, 107, 177-190.
20. Hong Kong Chest Service/British Medical Research Council. Controlled trial of 6-month
and 8-month regimens in the treatment of pulmonary tuberculosis: The results up to 24
months. Tubercle 1979, 60, 201-210.
21. East African/British Medical Research Councils. Controlled clinical trial of four short-
course (6-month) regimens of chemotherapy for treatment of pulmonary tuberculosis.
Lancet 1974, 304, 237-240.
22. Who treatment guidelines for drug-resistant tuberculosis – 2016 update; World Health
Organization: Geneva, 2016.
23. Treatment of tuberculosis: Guidelines for national programmes; World Health
Organization: Geneva, 2010.
24. Beena; Rawat, D. S. Antituberculosis drug research: a critical overview. Medicinal
Research Reviews 2013, 33, 693-764.
25. Bayer, R.; Wilkinson, D.; Bayer, R. Directly observed therapy for tuberculosis: history of
an idea. Lancet 1995, 345, 1545-1548.
26. What is DOTS? A guide to understanding the whorecommended TB control strategy known
as dots; World Health Organization: Geneva, 1999.
27. An expanded DOTS framework for effective tuberculosis control; World Health
Organization: Geneva, 2002.
28. Moonan, P. K.; Quitugua, T. N.; Pogoda, J. M.; Woo, G.; Drewyer, G.; Sahbazian, B.;
Dunbar, D.; Jost, K. C.; Wallace, C.; Weis, S. E. Does directly observed therapy (DOT)
reduce drug resistant tuberculosis? BMC Public Health 2011, 11, 1-8.
29. Karumbi, J.; Garner, P. Directly observed therapy for treating tuberculosis. Cochrane
Database of Systematic Reviews 2015, 5, 1-56.
30. Scientific blueprint for tuberculosis drug development.; New York, 2001.
31. The global plan to stop TB; 2001; http://www.stoptb.org/global/plan/plan0105.asp.
32. Schito, M.; Migliori, G. B.; Fletcher, H. A.; McNerney, R.; Centis, R.; D'Ambrosio, L.;
Bates, M.; Kibiki, G.; Kapata, N.; Corrah, T.; Bomanji, J.; Vilaplana, C.; Johnson, D.;
Mwaba, P.; Maeurer, M.; Zumla, A. Perspectives on advances in tuberculosis diagnostics,
drugs, and vaccines. Clin. Infect. Dis. 2015, 61, S102-S118.
33. Introduction of bedaquiline for the treatment of multidrug-resistant tuberculosis at country
level - implementation plan; World Health Organization: Geneva, 2015.
34. The use of delamanid in the treatment of multidrug-resistant tuberculosis - interim policy
guidance; World Health Organization: Geneva, 2014.
35. Li, K.; Schurig-Briccio, L. A.; Feng, X.; Upadhyay, A.; Pujari, V.; Lechartier, B.; Fontes,
F. L.; Yang, H.; Rao, G.; Zhu, W.; Gulati, A.; No, J. H.; Cintra, G.; Bogue, S.; Liu, Y.-L.;
Molohon, K.; Orlean, P.; Mitchell, D. A.; Freitas-Junior, L.; Ren, F.; Sun, H.; Jiang, T.; Li,
Y.; Guo, R.-T.; Cole, S. T.; Gennis, R. B.; Crick, D. C.; Oldfield, E. Multitarget drug
discovery for tuberculosis and other infectious diseases. J. Med. Chem. 2014, 57, 3126-
3139.
36. Clinicaltrials.gov. https://clinicaltrials.gov/ (accessed 07/08/2016).
37. Cole, S. T. Learning from the genome sequence of Mycobacterium tuberculosis H37Rv.
FEBS Lett. 1999, 452, 7-10.
38. Ghosh, S.; Baloni, P.; Mukherjee, S.; Anand, P.; Chandra, N. A multi-level multi-scale
approach to study essential genes in Mycobacterium tuberculosis. BMC Syst. Biol. 2013, 7,
1-21.

98
39. Zhang, Y. The magic bullets and tuberculosis drug targets. Annu. Rev. Pharmacol. Toxicol.
2005, 45, 529-564.
40. Ashforth, E. J.; Fu, C. Z.; Liu, X. Y.; Dai, H. Q.; Song, F. H.; Guo, H.; Zhang, L. X.
Bioprospecting for antituberculosis leads from microbial metabolites. Nat. Prod. Rep.
2010, 27, 1709-1719.
41. Tuberculosis: a global emergency. World health forum 1993, 14, 438.
42. Global tuberculosis report — 2015; World Health Organization: Geneva, 2015.
43. Dorman, S. E.; Chaisson, R. E. From magic bullets back to the magic mountain: The rise of
extensively drug-resistant tuberculosis. Nat. Med. 2007, 13, 295-298.
44. Fischbach, M. A.; Walsh, C. T. Antibiotics for emerging pathogens. Science 2009, 325,
1089-1093.
45. Parida, S. K.; Axelsson-Robertson, R.; Rao, M. V.; Singh, N.; Master, I.; Lutckii, A.;
Keshavjee, S.; Andersson, J.; Zumla, A.; Maeurer, M. Totally drug-resistant tuberculosis
and adjunct therapies. J. Intern. Med. 2015, 277, 388-405.
46. Glaziou, P.; Falzon, D.; Floyd, K.; Raviglione, M. Global epidemiology of tuberculosis.
Semin. Respir. Crit. Care Med. 2013, 34, 3-16.
47. The end TB strategy - global strategy and targets for tuberculosis prevention, care and
control after 2015; World Health Organization: Geneva, 2014.
48. McGann, P.; Snesrud, E.; Maybank, R.; Corey, B.; Ong, A. C.; Clifford, R.; Hinkle, M.;
Whitman, T.; Lesho, E.; Schaecher, K. E. Escherichia coli harboring mcr-1 and blaCTX-M
on a novel IncF plasmid: first report of mcr-1 in the United States. Antimicrob. Agents
Chemother. 2016, 60, 4420-4421.
49. Cragg, G. M.; Newman, D. J., Biodiversity: A continuing source of novel drug leads. In
Pure Appl. Chem., 2005; Vol. 77, pp 7-24.
50. Fabricant, D. S.; Farnsworth, N. R. The value of plants used in traditional medicine for
drug discovery. Environ. Health Perspect. 2001, 109, 69-75.
51. Gould, K. Antibiotics: From prehistory to the present day. J. Antimicrob. Chemother. 2016,
71, 572-575.
52. Nelson, M. L.; Dinardo, A.; Hochberg, J.; Armelagos, G. J. Brief communication: Mass
spectroscopic characterization of tetracycline in the skeletal remains of an ancient
population from Sudanese Nubia 350–550 ce. Am. J. Phys. Anthropol. 2010, 143, 151-154.
53. Newman, D. J.; Cragg, G. M. Natural products as sources of new drugs from 1981 to 2014.
J. Nat. Prod. 2016, 79, 629-661.
54. Fenical, W.; Jensen, P. R. Developing a new resource for drug discovery: marine
actinomycete bacteria. Nat. Chem. Biol. 2006, 2, 666-673.
55. Copp, B. R.; Pearce, A. N. Natural product growth inhibitors of Mycobacterium
tuberculosis. Nat. Prod. Rep. 2007, 24, 278-297.
56. Evans, B. E.; Rittle, K. E.; Bock, M. G.; DiPardo, R. M.; Freidinger, R. M.; Whitter, W. L.;
Lundell, G. F.; Veber, D. F.; Anderson, P. S. Methods for drug discovery: Development of
potent, selective, orally effective cholecystokinin antagonists. J. Med. Chem. 1988, 31,
2235-2246.
57. Lipinski, C. A.; Lombardo, F.; Dominy, B. W.; Feeney, P. J. Experimental and
computational approaches to estimate solubility and permeability in drug discovery and
development settings. Adv. Drug Del. Rev. 2001, 46, 3-26.
58. Pauli, G. F.; Case, R. J.; Inui, T.; Wang, Y.; Cho, S.; Fischer, N. H.; Franzblau, S. G. New
perspectives on natural products in TB drug research. Life Sci. 2005, 78, 485-494.
59. Murphy, B. T.; Maloney, K.; Fenical, W., “Marine microorganisms”. In Phytochemistry
and Pharmacognosy, Eolss Publishers: Oxford, UK, 2011.
99
60. Waksman, S. A. Successes and failures in the search for antibiotics. Adv. Appl. Microbiol.
1969, 11, 1-16.
61. Olivera, B. M.; Cruz, L. J.; de Santos, V.; LeCheminant, G. W.; Griffin, D.; Zeikus, R.;
McIntosh, J. M.; Galyean, R.; Varga, J.; Gray, W. R.; Rivier, J. Neuronal calcium channel
antagonists. Discrimination between calcium channel subtypes using ω-conotoxin from
Conus magus venom. Biochemistry 1987, 26, 2086-2090.
62. Rinehart, K. L.; Holt, T. G.; Fregeau, N. L.; Stroh, J. G.; Keifer, P. A.; Sun, F.; Li, L. H.;
Martin, D. G. Ecteinascidins 729, 743, 745, 759a, 759b, and 770: Potent antitumor agents
from the caribbean tunicate Ecteinascidia turbinata. J. Org. Chem. 1990, 55, 4512-4515.
63. Pettit, G. R.; Herald, C. L.; Boyd, M. R.; Leet, J. E.; Dufresne, C.; Doubek, D. L.; Schmidt,
J. M.; Cerny, R. L.; Hooper, J. N.; Rützler, K. C. Isolation and structure of the cell growth
inhibitory constituents from the western Pacific marine sponge Axinella sp. J. Med. Chem.
1991, 34, 3339-3340.
64. Pettit, G. R.; Herald, C. L.; Boyd, M. R.; Leet, J. E.; Dufresne, C.; Doubek, D. L.; Schmidt,
J. M.; Cerny, R. L.; Hooper, J. N.; Rutzler, K. C. Isolation and structure of the cell growth
inhibitory constituents from the western Pacific marine sponge Axinella sp. J. Med. Chem.
1991, 34, 3339-3340.
65. El Sayed, K. A.; Bartyzel, P.; Shen, X. Y.; Perry, T. L.; Kjawiony, J. K.; Hamann, M. T.
Marine natural products as antituberculosis agents. Tetrahedron 2000, 56, 949-953.
66. Chlipala, G., E.; Mo, S.; Orjala, J. Chemodiversity in freshwater and terrestrial
cyanobacteria – a source for drug discovery. Curr. Drug Targets 2011, 12, 1654-1673.
67. Du, L.; Risinger, A. L.; King, J. B.; Powell, D. R.; Cichewicz, R. H. A potent HDAC
inhibitor, 1-alaninechlamydocin, from a Tolypocladium sp. induces G2/M cell cycle arrest
and apoptosis in MIA PaCa-2 cells. J. Nat. Prod. 2014, 77, 1753-1757.
68. Cross, T. Aquatic actinomycetes: A critical survey of the occurrence, growth and role of
actinomycetes in aquatic habitats. J. Appl. Bacteriol. 1981, 50, 397-423.
69. Goodfellow, M.; Williams, S. T. Ecology of actinomycetes. Annu. Rev. Microbiol. 1983,
37, 189-216.
70. de Menezes, A. B.; Lockhart, R. J.; Cox, M. J.; Allison, H. E.; McCarthy, A. J. Cellulose
degradation by micromonosporas recovered from freshwater lakes and classification of
these actinomycetes by DNA gyrase B gene sequencing. Appl. Environ. Microbiol. 2008,
74, 7080-7084.
71. de Menezes, A. B.; McDonald, J. E.; Allison, H. E.; McCarthy, A. J. Importance of
Micromonospora spp. as colonizers of cellulose in freshwater lakes as demonstrated by
quantitative reverse transcriptase PCR of 16S rRNA. Appl. Environ. Microbiol. 2012, 78,
3495-3499.
72. Erikson, D. Studies on some lake-mud strains of Micromonospora. J. Bacteriol. 1941, 41,
277-300.
73. Kollner, K. E.; Carstens, D.; Keller, E.; Vazquez, F.; Schubert, C. J.; Zeyer, J.; Burgmann,
H. Bacterial chitin hydrolysis in two lakes with contrasting trophic statuses. Appl. Environ.
Microbiol. 2012, 78, 695-704.
74. Newton, R. J.; Jones, S. E.; Eiler, A.; McMahon, K. D.; Bertilsson, S. A guide to the
natural history of freshwater lake bacteria. Microbiol. Mol. Biol. Rev. 2011, 75, 14-49.
75. Glockner, F. O.; Zaichikov, E.; Belkova, N.; Denissova, L.; Pernthaler, J.; Pernthaler, A.;
Amann, R. Comparative 16S rRNA analysis of lake bacterioplankton reveals globally
distributed phylogenetic clusters including an abundant group of Actinobacteria. Appl.
Environ. Microbiol. 2000, 66, 5053-5065.

100
76. Hahn, M. W. Description of seven candidate species affiliated with the phylum
Actinobacteria, representing planktonic freshwater bacteria. Int. J. Syst. Evol. Microbiol.
2009, 59, 112-117.
77. Hahn, M. W.; Lünsdorf, H.; Wu, Q.; Schauer, M.; Höfle, M. G.; Boenigk, J.; Stadler, P.
Isolation of novel ultramicrobacteria classified as Actinobacteria from five freshwater
habitats in Europe and Asia. Appl. Environ. Microbiol. 2003, 69, 1442-1451.
78. Newton, R. J.; Jones, S. E.; Helmus, M. R.; McMahon, K. D. Phylogenetic ecology of the
freshwater Actinobacteria acI lineage. Appl. Environ. Microbiol. 2007, 73, 7169-7176.
79. Warnecke, F.; Amann, R.; Pernthaler, J. Actinobacterial 16S rRNA genes from freshwater
habitats cluster in four distinct lineages. Environ. Microbiol. 2004, 6, 242-253.
80. Zwart, G.; Crump, B. C.; Kamst-van Agterveld, M. P.; Hagen, F.; Han, S.-K. Typical
freshwater bacteria: An analysis of available 16S rRNA gene sequences from plankton of
lakes and rivers. Aquat. Microb. Ecol. 2002, 28, 141-155.
81. Fenical, W.; Jensen, P. R.; Palladino, M. A.; Lam, K. S.; Lloyd, G. K.; Potts, B. C.
Discovery and development of the anticancer agent salinosporamide A (NPI-0052). Bioorg.
Med. Chem. 2009, 17, 2175-2180.
82. Hirata, Y.; Uemura, D. Halichondrins – antitumor polyethers macrolides from a marine
sponge. Pure Appl. Chem. 1986, 58, 701-710.
83. Riedlinger, J.; Reicke, A.; Zahner, H.; Krismer, B.; Bull, A. T.; Maldonado, L. A.; Ward,
A. C.; Goodfellow, M.; Bister, B.; Bischoff, D.; Sussmuth, R. D.; Fiedler, H. P.
Abyssomicins, inhibitors of the para-aminobenzoic acid pathway produced by the marine
Verrucosispora strain AB-18-032. J. Antibiot. (Tokyo) 2004, 57, 271-279.
84. Uemura, D.; Takahashi, K.; Yamamoto, T.; Katayama, C.; Tanaka, J.; Okumura, Y.;
Hirata, Y. Norhalichondrin A: an antitumor polyether macrolide from a marine sponge. J.
Am. Chem. Soc. 1985, 107, 4796-4798.
85. Carballeira, N. M.; Pagan, M.; Shalabi, F.; Nechev, J. T.; Lahtchev, K.; Ivanova, A.;
Stefanov, K. Two novel iso-branched octadecenoic acids from a Micrococcus species. J.
Nat. Prod. 2000, 63, 1573-1575.
86. Carlson, S.; Tanouye, U.; Ómarsdóttir, S.; Murphy, B. T. Phylum-specific regulation of
resistomycin production in a Streptomyces sp. via microbial coculture. J. Nat. Prod. 2015,
78, 381-387.
87. Parker, B. C.; Ford, M. A.; Gruft, H.; Falkinham III, J. O. Epidemiology of infection by
nontuberculous mycobacteria. Iv. Preferential aerosolization of Mycobacterium
intracellulare from natural waters. Am. Rev. Respir. Dis. 1983, 128, 652-656.
88. Falkinham III, J. O. Surrounded by mycobacteria: Nontuberculous mycobacteria in the
human environment. Journal of Applied Microbiology 2009, 107, 356-367.
89. Mullowney, M. W.; Ó hAinmhire , E.; Shaikh, A.; Wei, X.; Tanouye, U.; Santarsiero, B.
D.; Burdette, J. E.; Murphy, B. T. Diazaquinomycins E-G, novel diaza-anthracene analogs
from a marine-derived Streptomyces sp. Mar. Drugs 2014, 12, 3574-3586.
90. Maskey, R. P.; Grun-Wollny, I.; Laatsch, H. Isolation and structure elucidation of
diazaquinomycin C from a terrestrial Streptomyces sp. and confirmation of the akashin
structure. Nat. Prod. Res. 2005, 19, 137-142.
91. Omura, S.; Iwai, Y.; Hinotozawa, K.; Tanaka, H.; Takahashi, Y.; Nakagawa, A. OM-704
A, a new antibiotic active against Gram-positive bacteria produced by Streptomyces sp. J.
Antibiot. 1982, 35, 1425-1429.
92. Omura, S.; Nakagawa, A.; Aoyama, H.; Hinotozawa, K.; Sano, H. The structures of
diazaquinomycins A and B, new antibiotic metabolites. Tetrahedron Lett. 1983, 24, 3643-
3646.
101
93. Collins, L.; Franzblau, S. G. Microplate alamar blue assay versus BACTEC 460 system for
high-throughput screening of compounds against Mycobacterium tuberculosis and
Mycobacterium avium. Antimicrob. Agents Chemother. 1997, 41, 1004-1009.
94. Franzblau, S. G.; Witzig, R. S.; McLaughlin, J. C.; Torres, P.; Madico, G.; Hernandez, A.;
Degnan, M. T.; Cook, M. B.; Quenzer, V. K.; Ferguson, R. M.; Gilman, R. H. Rapid, low-
technology MIC determination with clinical Mycobacterium tuberculosis isolates by using
the microplate alamar blue assay. J. Clin. Microbiol. 1998, 36, 362-366.
95. Tsuzuki, K.; Yokozuka, T.; Murata, M.; Tanaka, H.; Omura, S. Synthesis and biological
activity of analogues of diazaquinomycin A, a new thymidylate synthase inhibitor. J.
Antibiot. 1989, 42, 727-737.
96. Cho, S. H.; Warit, S.; Wan, B.; Hwang, C. H.; Pauli, G. F.; Franzblau, S. G. Low-oxygen-
recovery assay for high-throughput screening of compounds against nonreplicating
Mycobacterium tuberculosis. Antimicrob. Agents Chemother. 2007, 51, 1380-1385.
97. Performance standards for antimicrobial susceptibility testing; 24th informational
supplement. CLSI document M100-S24. In Clinical and Laboratory Standards Institute
(CLSI), (CLSI), C. a. L. S. I., Ed. CLSI: Wayne, PA, 2014.
98. Kelly, T. R.; Field, J. A.; Li, Q. Synthesis of diazaquinomycin A and B: The first double
Knorr cyclization. Tetrahedron Lett. 1988, 29, 3545-3546.
99. van Beilen, J. B.; Holtackers, R.; Lüscher, D.; Bauer, U.; Witholt, B.; Duetz, W. A.
Biocatalytic production of perillyl alcohol from limonene by using a novel Mycobacterium
sp. cytochrome P450 alkane hydroxylase expressed in Pseudomonas putida. Appl. Environ.
Microbiol. 2005, 71, 1737-1744.
100. Cornelissen, S.; Julsing, M. K.; Volmer, J.; Riechert, O.; Schmid, A.; Buhler, B. Whole-
cell-based CYP153A6-catalyzed (S)-limonene hydroxylation efficiency depends on host
background and profits from monoterpene uptake via AlkL. Biotechnol. Bioeng. 2013, 110,
1282-1292.
101. Julsing, M. K.; Schrewe, M.; Cornelissen, S.; Hermann, I.; Schmid, A.; Buhler, B. Outer
membrane protein AlkL boosts biocatalytic oxyfunctionalization of hydrophobic substrates
in Escherichia coli. Appl. Environ. Microbiol. 2012, 78, 5724-5733.
102. Murata, M.; Miyasaka, T.; Tanaka, H.; Omura, S. Diazaquinomycin A, a new antifolate
antibiotic, inhibits thymidylate synthase. J. Antibiot. 1985, 38, 1025-1033.
103. Myllykallio, H.; Lipowski, G.; Leduc, D.; Filee, J.; Forterre, P.; Liebl, U. An alternative
flavin-dependent mechanism for thymidylate synthesis. Science 2002, 297, 105-107.
104. Chernyshev, A.; T., F.; Kohen, A. Thymidyl biosynthesis enzymes as antibiotic targets.
Appl. Microbiol. Biotechnol. 2007, 74, 282-289.
105. Hunter, J. H.; Gujjar, R.; Pang, C. K.; Rathod, P. K. Kinetics and ligand-binding
preferences of Mycobacterium tuberculosis thymidylate synthases, ThyA and ThyX. PloS
one 2008, 3, e2237.
106. Lomenick, B.; Hao, R.; Jonai, N.; Chin, R. M.; Aghajan, M.; Warburton, S.; Wang, J.; Wu,
R. P.; Gomez, F.; Loo, J. A.; Wohlschlegel, J. A.; Vondriska, T. M.; Pelletier, J.;
Herschman, H. R.; Clardy, J.; Clarke, C. F.; Huang, J. Target identification using drug
affinity responsive target stability (DARTS). Proc. Natl. Acad. Sci. U. S. A. 2009, 106,
21984-21989.
107. Pai, M. Y.; Lomenick, B.; Hwang, H.; Schiestl, R.; McBride, W.; Loo, J. A.; Huang, J.
Drug affinity responsive target stability (DARTS) for small molecule target identification.
Methods Mol. Biol. 2015, 1263, 287-298.
108. Ioerger, T. R.; Feng, Y.; Ganesula, K.; Chen, X.; Dobos, K. M.; Fortune, S.; Jacobs, W. R.;
Mizrahi, V.; Parish, T.; Rubin, E.; Sassetti, C.; Sacchettini, J. C. Variation among genome

102
sequences of H37Rv strains of Mycobacterium tuberculosis from multiple laboratories. J.
Bacteriol. 2010, 192, 3645-3653.
109. Griffin, J. E.; Gawronski, J. D.; DeJesus, M. A.; Ioerger, T. R.; Akerley, B. J.; Sassetti, C.
M. High-resolution phenotypic profiling defines genes essential for mycobacterial growth
and cholesterol catabolism. PLoS Pathog. 2011, 7, e1002251.
110. Kendall, S. L.; Withers, M.; Soffair, C. N.; Moreland, N. J.; Gurcha, S.; Sidders, B.; Frita,
R.; Ten Bokum, A.; Besra, G. S.; Lott, J. S.; Stoker, N. G. A highly conserved
transcriptional repressor controls a large regulon involved in lipid degradation in
Mycobacterium smegmatis and Mycobacterium tuberculosis. Mol. Microbiol. 2007, 65,
684-699.
111. Selengut, J. D.; Haft, D. H. Unexpected abundance of coenzyme F420-dependent enzymes
in Mycobacterium tuberculosis and other Actinobacteria. J. Bacteriol. 2010, 192, 5788-
5798.
112. Voskuil, M.; Bartek, I.; Visconti, K.; Schoolnik, G. The response of Mycobacterium
tuberculosis to reactive oxygen and nitrogen species. Frontiers in Microbiology 2011, 2,
105.
113. Hards, K.; Robson, J. R.; Berney, M.; Shaw, L.; Bald, D.; Koul, A.; Andries, K.; Cook, G.
M. Bactericidal mode of action of bedaquiline. J. Antimicrob. Chemother. 2015, 70, 2028-
2037.
114. Yano, T.; Kassovska-Bratinova, S.; Teh, J. S.; Winkler, J.; Sullivan, K.; Isaacs, A.;
Schechter, N. M.; Rubin, H. Reduction of clofazimine by mycobacterial type 2
NADH:quinone oxidoreductase: a pathway for the generation of bactericidal levels of
reactive oxygen species. J. Biol. Chem. 2011, 286, 10276-10287.
115. Singh, R.; Manjunatha, U.; Boshoff, H. I. M.; Ha, Y. H.; Niyomrattanakit, P.; Ledwidge,
R.; Dowd, C. S.; Lee, I. Y.; Kim, P.; Zhang, L.; Kang, S.; Keller, T. H.; Jiricek, J.; Barry,
C. E. PA-824 kills nonreplicating Mycobacterium tuberculosis by intracellular NO release.
Science 2008, 322, 1392-1395.
116. Hartkoorn, R. C.; Uplekar, S.; Cole, S. T. Cross-resistance between clofazimine and
bedaquiline through upregulation of MmpL5 in Mycobacterium tuberculosis. Antimicrob.
Agents Chemother. 2014, 58, 2979-2981.
117. Zhang, S.; Chen, J.; Cui, P.; Shi, W.; Zhang, W.; Zhang, Y. Identification of novel
mutations associated with clofazimine resistance in Mycobacterium tuberculosis. J.
Antimicrob. Chemother. 2015, 70, 2507-2510.
118. Sassetti, C. M.; Boyd, D. H.; Rubin, E. J. Genes required for mycobacterial growth defined
by high density mutagenesis. Mol. Microbiol. 2003, 48, 77-84.
119. Singh, V.; Brecik, M.; Mukherjee, R.; Evans, J. C.; Svetlikova, Z.; Blasko, J.; Surade, S.;
Blackburn, J.; Warner, D. F.; Mikusova, K.; Mizrahi, V. The complex mechanism of
antimycobacterial action of 5-fluorouracil. Chem. Biol. 2015, 22, 63-75.
120. Songsumanus, A.; Tanasupawat, S.; Igarashi, Y.; Kudo, T. Micromonospora maritima sp.
nov., isolated from mangrove soil. Int. J. Syst. Evol. Microbiol. 2013, 63, 554-559.
121. Ojha, A. K.; Baughn, A. D.; Sambandan, D.; Hsu, T.; Trivelli, X.; Guerardel, Y.; Alahari,
A.; Kremer, L.; Jacobs, W. R.; Hatfull, G. F. Growth of Mycobacterium tuberculosis
biofilms containing free mycolic acids and harbouring drug-tolerant bacteria. Mol.
Microbiol. 2008, 69, 164-174.
122. Falzari, K.; Zhu, Z.; Pan, D.; Liu, H.; Hongmanee, P.; Franzblau, S. G. In vitro and in vivo
activities of macrolide derivatives against Mycobacterium tuberculosis. Antimicrob. Agents
Chemother. 2005, 49, 1447-1454.
103
123. Cantrell, C. L.; Lu, T.; Fronczek, F. R.; Fischer, N. H.; Adams, L. B.; Franzblau, S. G.
Antimycobacterial cycloartanes from Borrichia frutescens. J. Nat. Prod. 1996, 59, 1131-
1136.
124. Ó hAinmhire, E.; Quartuccio, S. M.; Cheng, W.; Ahmed, R. A.; King, S. M.; Burdette, J. E.
Mutation or loss of p53 differentially modifies TGFβ action in ovarian cancer. PloS one
2014, 9, e89553.
125. Manjunatha, U. H.; Boshoff, H.; Dowd, C. S.; Zhang, L.; Albert, T. J.; Norton, J. E.;
Daniels, L.; Dick, T.; Pang, S. S.; Barry, C. E. Identification of a nitroimidazo-oxazine-
specific protein involved in PA-824 resistance in Mycobacterium tuberculosis. Proc. Natl.
Acad. Sci. U. S. A. 2006, 103, 431-436.
126. Song, T.; Park, Y.; Shamputa, I. C.; Seo, S.; Lee, S. Y.; Jeon, H.-S.; Choi, H.; Lee, M.;
Glynne, R. J.; Barnes, S. W.; Walker, J. R.; Batalov, S.; Yusim, K.; Feng, S.; Tung, C.-S.;
Theiler, J.; Via, L. E.; Boshoff, H. I. M.; Murakami, K. S.; Korber, B.; Barry, C. E.; Cho, S.
N. Fitness costs of rifampicin resistance in Mycobacterium tuberculosis are amplified
under conditions of nutrient starvation and compensated by mutation in the β' subunit of
RNA polymerase. Mol. Microbiol. 2014, 91, 1106-1119.
127. Methods for dilution antimicrobial susceptibility tests for bacteria that grow aerobically—
second edition: Approved standard M7-A2. In National Committee for Clinical Laboratory
Standards (NCCLS), NCCLS: Villanova, PA, 1990.
128. Performance standards for antimicrobial susceptibility testing; third informational
supplement M100-S3. In National Committee for Clinical Laboratory Standards (NCCLS),
NCCLS: Villanova, PA, 1991.
129. Hayashi, K.; Morooka, N.; Yamamoto, Y.; Fujita, K.; Isono, K.; Choi, S.; Ohtsubo, E.;
Baba, T.; Wanner, B. L.; Mori, H.; Horiuchi, T. Highly accurate genome sequences of
Escherichia coli K-12 strains MG1655 and W3110. Molecular Systems Biology 2006, 2,
2006.0007.
130. Sambrook, J.; Fritsch, E. F.; Maniatis, T., Molecular cloning: A laboratory manual. 4th ed.
ed.; Cold Spring Harbor Laboratory Press: Cold Spring Harbor, N.Y., 2012.
131. Panke, S.; Meyer, A.; Huber, C. M.; Witholt, B.; Wubbolts, M. G. An alkane-responsive
expression system for the production of fine chemicals. Appl. Environ. Microbiol. 1999,
65, 2324-2332.
132. Bühler, B.; Bollhalder, I.; Hauer, B.; Witholt, B.; Schmid, A. Use of the two-liquid phase
concept to exploit kinetically controlled multistep biocatalysis. Biotechnol. Bioeng. 2003,
81, 683-694.
133. Galagan, J. E.; Minch, K.; Peterson, M.; Lyubetskaya, A.; Azizi, E.; Sweet, L.; Gomes, A.;
Rustad, T.; Dolganov, G.; Glotova, I.; Abeel, T.; Mahwinney, C.; Kennedy, A. D.; Allard,
R.; Brabant, W.; Krueger, A.; Jaini, S.; Honda, B.; Yu, W. H.; Hickey, M. J.; Zucker, J.;
Garay, C.; Weiner, B.; Sisk, P.; Stolte, C.; Winkler, J. K.; Van de Peer, Y.; Iazzetti, P.;
Camacho, D.; Dreyfuss, J.; Liu, Y.; Dorhoi, A.; Mollenkopf, H. J.; Drogaris, P.;
Lamontagne, J.; Zhou, Y.; Piquenot, J.; Park, S. T.; Raman, S.; Kaufmann, S. H.; Mohney,
R. P.; Chelsky, D.; Moody, D. B.; Sherman, D. R.; Schoolnik, G. K. The Mycobacterium
tuberculosis regulatory network and hypoxia. Nature 2013, 499, 178-183.
134. Goude, R.; Parish, T., Electroporation of mycobacteria. Humana Press: Totowa, NJ, 1998.
135. Ollinger, J.; Bailey, M. A.; Moraski, G. C.; Casey, A.; Florio, S.; Alling, T.; Miller, M. J.;
Parish, T. A dual read-out assay to evaluate the potency of compounds active against
Mycobacterium tuberculosis. PloS one 2013, 8, e60531.
136. Sirgel, F. A.; Wiid, I. J.; van Helden, P. D. Measuring minimum inhibitory concentrations
in mycobacteria. Methods Mol. Biol. 2009, 465, 173-186.

104
137. Boshoff, H. I. M.; Myers, T. G.; Copp, B. R.; McNeil, M. R.; Wilson, M. A.; Barry, C. E.
The transcriptional responses of Mycobacterium tuberculosis to inhibitors of metabolism:
novel insights into drug mechanisms of action. J. Biol. Chem. 2004, 279, 40174-40184.
138. Weinstein, J. N.; Myers, T. G.; O'Connor, P. M.; Friend, S. H.; Fornace, A. J.; Kohn, K.
W.; Fojo, T.; Bates, S. E.; Rubinstein, L. V.; Anderson, N. L.; Buolamwini, J. K.; van
Osdol, W. W.; Monks, A. P.; Scudiero, D. A.; Sausville, E. A.; Zaharevitz, D. W.; Bunow,
B.; Viswanadhan, V. N.; Johnson, G. S.; Wittes, R. E.; Paull, K. D. An information-
intensive approach to the molecular pharmacology of cancer. Science 1997, 275, 343-349.
139. Lamichhane, G.; Zignol, M.; Blades, N. J.; Geiman, D. E.; Dougherty, A.; Grosset, J.;
Broman, K. W.; Bishai, W. R. A postgenomic method for predicting essential genes at
subsaturation levels of mutagenesis: application to Mycobacterium tuberculosis. Proc.
Natl. Acad. Sci. U. S. A. 2003, 100, 7213-7218.
140. Barry, V. C.; Belton, J. G.; Conalty, M. L.; Denneny, J. M.; Edward, D. W.; O'Sullivan, J.
F.; Twomey, D.; Winder, F. A new series of phenazines (rimino-compounds) with high
antituberculosis activity. Nature 1957, 179, 1013-1015.
141. Niwa, Y.; Sakane, T.; Miyachi, Y.; Ozaki, M. Oxygen metabolism in phagocytes of
leprotic patients: Enhanced endogenous superoxide dismutase activity and hydroxyl radical
generation by clofazimine. J. Clin. Microbiol. 1984, 20, 837-842.
142. Smith, F.; Richter, F. P. Substituted 1,10-phenanthroline ferrous complex oxidation-
reduction indicators potential determinations as a function of acid concentration. Ind. Eng.
Chem., Anal. Ed. 1944, 16, 580-581.
143. Kohanski, M. A.; Dwyer, D. J.; Hayete, B.; Lawrence, C. A.; Collins, J. J. A common
mechanism of cellular death induced by bactericidal antibiotics. Cell 2007, 130, 797-810.
144. Wang, X.; Zhao, X. Contribution of oxidative damage to antimicrobial lethality.
Antimicrob. Agents Chemother. 2009, 53, 1395-1402.
145. Dwyer, D. J.; Belenky, P. A.; Yang, J. H.; MacDonald, I. C.; Martell, J. D.; Takahashi, N.;
Chan, C. T. Y.; Lobritz, M. A.; Braff, D.; Schwarz, E. G.; Ye, J. D.; Pati, M.; Vercruysse,
M.; Ralifo, P. S.; Allison, K. R.; Khalil, A. S.; Ting, A. Y.; Walker, G. C.; Collins, J. J.
Antibiotics induce redox-related physiological alterations as part of their lethality. Proc.
Natl. Acad. Sci. U. S. A. 2014, 111, E2100-E2109.
146. Johnston, C. W.; Skinnider, M. A.; Dejong, C. A.; Rees, P. N.; Chen, G. M.; Walker, C. G.;
French, S.; Brown, E. D.; Berdy, J.; Liu, D. Y.; Magarvey, N. A. Assembly and clustering
of natural antibiotics guides target identification. Nat. Chem. Biol. 2016, 12, 233-239.
147. Walsh, C., Antibiotics: Actions, origins, resistance. ASM Press: Washington, DC, 2003; p
345.
148. Gonzalez-Juarrero, M.; Woolhiser, L. K.; Brooks, E.; DeGroote, M. A.; Lenaerts, A. J.
Mouse model for efficacy testing of antituberculosis agents via intrapulmonary delivery.
Antimicrob. Agents Chemother. 2012, 56, 3957-3959.
149. Kabsch, W. XDS. Acta Crystallogr. Sect. D 2010, 66, 125-132.
150. Sheldrick, G. M. A short history of SHELX. Acta Crystallogr. Sect. A 2008, 64, 112-122.
151. Shibazaki, A.; Omoto, Y.; Kudo, T.; Yaguchi, T.; Saito, A.; Ando, A.; Mikami, Y.; Gonoi,
T. Streptomyces coacervatus sp. nov., isolated from the intestinal tract of Armadillidium
vulgare. Int. J. Syst. Evol. Microbiol. 2011, 61, 1073-1077.
152. Wu, H.; Qu, S.; Lu, C.; Zheng, H.; Zhou, X.; Bai, L.; Deng, Z. Genomic and transcriptomic
insights into the thermo-regulated biosynthesis of validamycin in Streptomyces
hygroscopicus 5008. BMC Genomics 2012, 13, 337.

105
153. Ruckert, C.; J., K.; Heide, L.; Apel, A. K. Draft genome sequence of Streptomyces
roseochromogenes subsp. oscitans DS 12.976, producer of the aminocoumarin antibiotic
clorobiocin. Genome Announc. 2014, 2, e01147-13.
154. Vichai, V.; Kirtikara, K. Sulforhodamine B colorimetric assay for cytotoxicity screening.
Nat. Protoc. 2006, 1, 1112-1116.
155. Xie, P.; Ma, M.; Rateb, M. E.; Shaaban, K. A.; Yu, Z.; Huang, S.-X.; Zhao, L. X.; Zhu, X.;
Yan, Y.; Peterson, R. M.; Lohman, J. R.; Yang, D.; Yin, M.; Rudolf, J. D.; Jiang, Y.; Duan,
Y.; Shen, B. Biosynthetic potential-based strain prioritization for natural product discovery:
A showcase for diterpenoid-producing actinomycetes. J. Nat. Prod. 2014, 77, 377-387.
156. Smanski, M. J.; Peterson, R. M.; Huang, S. X.; Shen, B. Bacterial diterpene synthases: New
opportunities for mechanistic enzymology and engineered biosynthesis. Curr. Opin. Chem.
Biol. 2012, 16, 132-141.
157. Mullowney, M. W.; Hwang, C. H.; Newsome, A. G.; Wei, X.; Tanouye, U.; Wan, B.;
Carlson, S.; Barranis, N. J.; Ó hAinmhire, E.; Chen, W.-L.; Krishnamoorthy, K.; White, J.;
Blair, R.; Lee, H.; Burdette, J. E.; Rathod, P. K.; Parish, T.; Cho, S.; Franzblau, S. G.;
Murphy, B. T. Diaza-anthracene antibiotics from a freshwater-derived actinomycete with
selective antibacterial activity toward Mycobacterium tuberculosis. ACS Infectious
Diseases 2015, 1, 168-174.
158. Balk-Bindseil, W.; Laatsch, H. Neue naturstoffe aus dem screening mariner actinomyceten
- isolierung und strukturaufklärung der lagumycine und des oceamycins. PhD thesis,
University of Göttingen, Germany, 1995.
159. Yamashita, N. Manufacture of dehydrorabelomycin with Streptomyces species and use of
the antibiotic agent as antitumor agent. JP 10201494 A, Aug 4, 1998.
160. Liu, W. C.; Parker, L.; Slusarchyk, S.; Greenwood, G. L.; Grahm, S. F.; Meyers, E.
Isolation, characterization, and structure of rabelomycin, a new antibiotic. J. Antibiot. 1970,
23, 437-441.
161. Fendrich, G.; Zimmermann, W.; Gruner, J.; Auden, J. A. L. Phenanthridine derivatives,
process for the preparation thereof, and compositions containing them. 1990.
162. Gore, M. P.; Gould, S. J.; Weller, D. D. Synthesis of putative intermediates in the
biosynthesis of the kinamycin antibiotics: Total synthesis of phenanthroviridin aglycon and
related compounds. J. Org. Chem. 1992, 57, 2774-2783.
163. Ikushima, H.; Iguchi, E.; Kohsaka, M.; Aoki, H.; Imanaka, H. Streptomyces auranticolor
sp. nov., a new anticoccidial antibiotics producer. J. Antibiot. 1980, 33, 1103-1106.
164. Ikushima, H.; Okamoto, M.; Tanaka, H.; Ohe, O.; Kohsaka, M.; Aoki, H.; Imanaka, H.
New anticoccidial antibiotics, WS-5995 A and B: I. Isolation and characterization. J.
Antibiot. 1980, 33, 1107-1113.
165. Crews, P.; Rodríguez, J.; Jaspars, M., Organic structure analysis. 2nd ed.; Oxford
University Press: New York, 2010; p 656.
166. Moffitt, W.; Woodward, R. B.; Moscowitz, A.; Klyne, W.; Djerassi, C. Structure and the
optical rotatory dispersion of saturated ketones. J. Am. Chem. Soc. 1961, 83, 4013-4018.
167. Dawson, B. A.; Girard, M.; Kindack, D.; Fillion, J.; Awang, D. V. C. 13C NMR of lapachol
and some related naphthoquinones. Magn. Reson. Chem. 1989, 27, 1176-1177.
168. Yamashita, M.; Kaneko, M.; Tokuda, H.; Nishimura, K.; Kumeda, Y.; Iida, A. Synthesis
and evaluation of bioactive naphthoquinones from the brazilian medicinal plant, Tabebuia
avellanedae. Bioorg. Med. Chem. 2009, 17, 6286-6291.
169. Domcke, S.; Sinha, R.; Levine, D. A.; Sander, C.; Schultz, N. Evaluating cell lines as
tumour models by comparison of genomic profiles. Nat. Commun. 2013, 4, 1-10.

106
170. Lombó, F.; Abdelfattah, M. S.; Braña, A. F.; Salas, J. A.; Rohr, J.; Méndez, C. Elucidation
of oxygenation steps during oviedomycin biosynthesis and generation of derivatives with
increased antitumor activity. ChemBioChem 2009, 10, 296-303.
171. Yamashita, N.; Takashi, H.; Kazuo, S.; Haruo, S. 6-hydroxytetrangulol, a new CPP32
protease inducer produced by Streptomyces sp. J. Antibiot. 1998, 1, 79-81.
172. Zhang, W.; Liu, Z.; Li, S.; Lu, Y.; Chen, Y.; Zhang, H.; Zhang, G.; Zhu, Y.; Zhang, G.;
Zhang, W.; Liu, J.; Zhang, C. Fluostatins I–K from the South China Sea-derived
Micromonospora rosaria SCSIO N160. J. Nat. Prod. 2012, 75, 1937-1943.
173. Perchellet, E. M.; Sperfslage, B. J.; Qabaja, G.; Jones, G. B.; Perchellet, J. P. Quinone
isomers of the WS-5995 antibiotics: synthetic antitumor agents that inhibit macromolecule
synthesis, block nucleoside transport, induce DNA fragmentation, and decrease the growth
and viability of L1210 leukemic cells more effectively than ellagic acid and genistein in
vitro. Anticancer drugs 2001, 12, 401-417.
174. Kharel, M. K.; Pahari, P.; Shepherd, M. D.; Tibrewal, N.; Nybo, S. E.; Shaaban, K. A.;
Rohr, J. Angucyclines: biosynthesis, mode-of-action, new natural products, and synthesis.
Nat. Prod. Rep. 2012, 29, 264-325.
175. Seaton, P. J.; Gould, S. J. Kinamycin biosynthesis. Derivation by excision of an acetate unit
from a single-chain decaketide intermediate. J. Am. Chem. Soc. 1987, 109, 5282-5284.
176. Cone, M. C.; Hassan, A. M.; Gore, M. P.; Gould, S. J.; Borders, D. B.; Alluri, M. R.
Detection of phenanthroviridin aglycon in a UV mutant of Streptomyces murayamaensis. J.
Org. Chem. 1994, 59, 1923-1924.
177. Tibrewal, N.; Pahari, P.; Wang, G.; Kharel, M. K.; Morris, C.; Downey, T.; Hou, Y.;
Bugni, T. S.; Rohr, J. Baeyer-Villiger C-C bond cleavage reaction in gilvocarcin and
jadomycin biosynthesis. J. Am. Chem. Soc. 2012, 134, 18181-18184.
178. Cone, M. C.; Seaton, P. J.; Halley, K. A.; Gould, S. J. New products related to kinamycin
from Streptomyces murayamaensis I. Taxonomy, production, isolation, and biological
properties. J. Antibiot. 1989, 42, 179-188.
179. Xie, Q. Y.; Qu, Z.; Lin, H. P.; Li, L.; Hong, K. Micromonospora haikouensis sp. nov.,
isolated from mangrove soil. Antonie Leeuwenhoek 2012, 101, 649-655.
180. Thi, Q. V.; Tran, V. H.; Maia, H. D.; Le, C. V.; Hong Mle, T.; Murphy, B. T.; V.M., C.;
Pham, V. C. Antimicrobial metabolites from a marine-derived actinomycete in Vietnam's
East Sea. Nat. Prod. Commun. 2016, 11, 49-51.
181. Thi, Q. V.; Tran, V. H.; Maia, H. D.; Le, C. V.; Hong Mle, T.; Murphy, B. T.; V.M., C.;
Pham, V. C. Secondary metabolites from an actinomycete from Vietnam's East Sea. Nat.
Prod. Commun. 2016, 11, 401-404.
182. Dembitsky, V. M.; Rezanka, T.; Srebnik, M. Lipid compounds of freshwater sponges:
family Spongillidae, class Demospongiae. Chem. Phys. Lipids. 2003, 123, 117-155.
183. Imbs, A. B.; Vereshchagin, A. L. Isolation and characteristic of super long-chain
unsaturated aldehydes from the freshwater sponge Lubomirskia baicalensis. Russ. J.
Bioorg. Chem. 2005, 31, 651-656.
184. Imbs, A. B.; Rodkina, S. A. Trans and positional ethylenic bonds in two dominant isomers
of eicosapentaenoic acid from the freshwater sponge Baicalospongia bacillifera. Lipids
2005, 40, 963-968.
185. Řezanka, T.; Sigler, K.; Dembitsky, V. M. Syriacin, a novel unusual sulfated ceramide
glycoside from the freshwater sponge Ephydatia syriaca (Porifera, Demospongiae,
Spongillidae). Tetrahedron 2006, 62, 5937-5943.
186. Hu, J.; Zhao, Y.; Chen, J.; Miao, Z.; Zhou, J. A new spongilipid from the freshwater
sponge Spongilla lacustris. Bull. Korean Chem. Soc. 2009, 30, 1170-1172.

107
187. Mazur, A. A new sponge sterol. J. Am. Chem. Soc. 1941, 63, 883-884.
188. Makarieva, T. N.; Bondarenko, I. A.; Dmitrenok, A. S.; Boguslavsky, V. M.; Stonik, V. A.;
Chernih, V. I.; Efremova, S. M. Natural products from Lake Baikal organisms, I.
Baikalosterol, a novel steroid with an unusual side chain, and other metabolites from the
sponge Baicalospongia bacilifera. J. Nat. Prod. 1991, 54, 953-958.
189. Keller-Costa, T.; Jousset, A.; van Overbeek, L.; van Elsas, J. D.; Costa, R. The freshwater
sponge Ephydatia fluviatilis harbours diverse Pseudomonas species
(Gammaproteobacteria, Pseudomonadales) with broad-spectrum antimicrobial activity.
PloS one 2014, 9, e88429.
190. Kaluzhnaya, O.; Krivich, A.; Itskovich, V. Diversity of 16S rRNA genes in metagenomic
community of the freshwater sponge Lubomirskia baicalensis. Russ. J. Genet. 2012, 48,
855-858.
191. Taylor, M. W.; Radax, R.; Steger, D.; Wagner, M. Sponge-associated microorganisms:
Evolution, ecology, and biotechnological potential. Microbiol. Mol. Biol. Rev. 2007, 71,
295-347.
192. Reiswig, H. M.; Frost, T. M.; Ricciardi, A., Ecology and classification of North American
freshwater invertebrates. Third Ed. ed.; Thorp, J. H.; Alan, P. C., Eds. Academic Press:
London, 2010; pp 91-124.
193. Goering, A. W.; McClure, R. A.; Doroghazi, J. R.; Albright, J. C.; Haverland, N. A.;
Zhang, Y.; Ju, K.-S.; Thomson, R. J.; Metcalf, W. W.; Kelleher, N. L. Metabologenomics:
Correlation of microbial gene clusters with metabolites drives discovery of a nonribosomal
peptide with an unusual amino acid monomer. ACS Cent. Sci. 2016, 2, 99-108.
194. Duncan, K. R.; Crüsemann, M.; Lechner, A.; Sarkar, A.; Li, J.; Ziemert, N.; Wang, M.;
Bandeira, N.; Moore, B. S.; Dorrestein, P. C.; Jensen, P. R. Molecular networking and
pattern-based genome mining improves discovery of biosynthetic gene clusters and their
products from Salinispora species. Chem. Biol. 2015, 22, 460-471.
195. Wang, M.; Carver, J. J.; Phelan, V. V.; Sanchez, L. M.; Garg, N.; Peng, Y.; Nguyen, D. D.;
Watrous, J.; Kapono, C. A.; Luzzatto-Knaan, T.; Porto, C.; Bouslimani, A.; Melnik, A. V.;
Meehan, M. J.; Liu, W.-T.; Crusemann, M.; Boudreau, P. D.; Esquenazi, E.; Sandoval-
Calderon, M.; Kersten, R. D.; Pace, L. A.; Quinn, R. A.; Duncan, K. R.; Hsu, C.-C.; Floros,
D. J.; Gavilan, R. G.; Kleigrewe, K.; Northen, T.; Dutton, R. J.; Parrot, D.; Carlson, E. E.;
Aigle, B.; Michelsen, C. F.; Jelsbak, L.; Sohlenkamp, C.; Pevzner, P.; Edlund, A.; McLean,
J.; Piel, J.; Murphy, B. T.; Gerwick, L.; Liaw, C.-C.; Yang, Y.-L.; Humpf, H.-U.;
Maansson, M.; Keyzers, R. A.; Sims, A. C.; Johnson, A. R.; Sidebottom, A. M.; Sedio, B.
E.; Klitgaard, A.; Larson, C. B.; Boya P, C. A.; Torres-Mendoza, D.; Gonzalez, D. J.;
Silva, D. B.; Marques, L. M.; Demarque, D. P.; Pociute, E.; O'Neill, E. C.; Briand, E.;
Helfrich, E. J. N.; Granatosky, E. A.; Glukhov, E.; Ryffel, F.; Houson, H.; Mohimani, H.;
Kharbush, J. J.; Zeng, Y.; Vorholt, J. A.; Kurita, K. L.; Charusanti, P.; McPhail, K. L.;
Nielsen, K. F.; Vuong, L.; Elfeki, M.; Traxler, M. F.; Engene, N.; Koyama, N.; Vining, O.
B.; Baric, R.; Silva, R. R.; Mascuch, S. J.; Tomasi, S.; Jenkins, S.; Macherla, V.; Hoffman,
T.; Agarwal, V.; Williams, P. G.; Dai, J.; Neupane, R.; Gurr, J.; Rodriguez, A. M. C.;
Lamsa, A.; Zhang, C.; Dorrestein, K.; Duggan, B. M.; Almaliti, J.; Allard, P.-M.; Phapale,
P.; Nothias, L.-F.; Alexandrov, T.; Litaudon, M.; Wolfender, J.-L.; Kyle, J. E.; Metz, T. O.;
Peryea, T.; Nguyen, D. T.; VanLeer, D.; Shinn, P.; Jadhav, A.; Muller, R.; Waters, K. M.;
Shi, W.; Liu, X.; Zhang, L.; Knight, R.; Jensen, P. R.; Palsson, B. O.; Pogliano, K.;
Linington, R. G.; Gutierrez, M.; Lopes, N. P.; Gerwick, W. H.; Moore, B. S.; Dorrestein, P.
C.; Bandeira, N. Sharing and community curation of mass spectrometry data with global
natural products social molecular networking. Nat. Biotech. 2016, 34, 828-837.

108
196. Hutchison, C. A.; Chuang, R.-Y.; Noskov, V. N.; Assad-Garcia, N.; Deerinck, T. J.;
Ellisman, M. H.; Gill, J.; Kannan, K.; Karas, B. J.; Ma, L.; Pelletier, J. F.; Qi, Z. Q.;
Richter, R. A.; Strychalski, E. A.; Sun, L.; Suzuki, Y.; Tsvetanova, B.; Wise, K. S.; Smith,
H. O.; Glass, J. I.; Merryman, C.; Gibson, D. G.; Venter, J. C. Design and synthesis of a
minimal bacterial genome. Science 2016, 351, 1414.
197. Ostrov, N.; Landon, M.; Guell, M.; Kuznetsov, G.; Teramoto, J.; Cervantes, N.; Zhou, M.;
Singh, K.; Napolitano, M. G.; Moosburner, M.; Shrock, E.; Pruitt, B. W.; Conway, N.;
Goodman, D. B.; Gardner, C. L.; Tyree, G.; Gonzales, A.; Wanner, B. L.; Norville, J. E.;
Lajoie, M. J.; Church, G. M. Design, synthesis, and testing toward a 57-codon genome.
Science 2016, 353, 819-822.
198. Hodgman, C. E.; Jewett, M. C. Cell-free synthetic biology: thinking outside the cell.
Metab. Eng. 2012, 14, 261-269.

APPENDIX.
A1. Dereplication of known compounds from aquatic actinomycete strains.
A1.1 Introduction.
A prime objective in natural products drug discovery is identifying whether the compounds
responsible for observed preliminary bioactivity of a fraction or extract represent novelty. Novelty
worth investigating may include unique chemical structure, new therapeutic application, and/or
novel MOA. Ideally, compounds without novelty or drug-lead potential are identified early and
the corresponding project deprioritized or abandoned for the sake of efficiency and conservation
of resources. The process aimed at quickly identifying known compounds without interesting
bioactivity is termed “dereplication.” In the course of investigating microbial library fractions that
exhibited anti-tuberculosis activity, a number of producing strains were deprioritized based on
these criteria. These compounds are described in this chapter.
A1.2 Antibiotics from Vietnam strain G016 that inhibit TB.
As a part of our ongoing collaboration with the ITR, the Murphy lab fraction library was
screened for inhibitors of non-replicating M. tuberculosis in the low oxygen recovery assay
(LORA). Fraction 1 from strain G016, a putative actinomycete, exhibited an MIC of 4.0 μg/mL in
this assay, justifying further analysis. The strain was isolated from a sediment sample collected by
PONAR in Hạ Long Bay at a depth of 22 m, from ca. 2.7 miles off the coast southeast of the Cát
Bà Peninsula in Vietnam (204153 N, 1070534 E) in July of 2011 (Figure A1). This was a
part of a larger collection effort in collaboration with the Vietnamese Academy of Science and
Technology (VAST) that resulted in a series of samples collected across an ~ 8.5 km transect with
depths ranging from 5 m to 23 m, including the sample that was the foundation for Chapter 4.

110
Figure A1. G016 source sediment location near He Long Bay, Cát Bà, Vietnam.
The star pin indicates the location of sediment (204153 N, 1070534 E, 22 m) from which strain
G016 was isolated.
Upon identification of its anti-TB bioactivity, fraction G016-F1 was analyzed by HPLC-
UV, which led to the observation of three prominent chromatographic peaks for isolation
(Figure A2). The 8.1 mg of G016-F1 was further were separated using RP-C18 preparative HPLC
(5.0 mL·min−1, gradient of 87% aqueous MeOH to 100% MeOH for 30 min, followed by an
isocratic flow of 100% MeOH for 30 min) to afford seven fractions, among them the known
compounds mansoquinone (20, G016-F1-2, tR 16.8 min, 0.70 mg, 1.0% yield), hibarimicin
HMP-M2 (21, G016-F1-3, tR 19.5 min, 0.41 mg, 0.61% yield) and 1-methoxy-9-propyltetracene-
6,11-dione (22, G016-F1-5, tR 24.7 min, 0.36 mg, 0.56% yield).

111
Figure A2. HPLC-UV chromatogram of G016-F1 with UV profiles of 20-22.
RP-HPLC-UV with a 100 x 4.6 mm 5 Å Luna C18 column. Method: 87% aqueous MeOH gradient to 100% MeOH
over 15 min, then 100% MeOH wash for 15 min. amansoquinone; bhibarimicin HMP-M2; c1-methoxy-9-
propyltetracene-6,11-dione.
These seven fractions were rescreened at the ITR against replicating M. tuberculosis H37Rv
in the MABA and the non-replicating form of the bacteria in the LORA to determine which were
responsible for the activity observed in the parent fraction. Compounds 20 and 21 had moderate
MIC values of 11.1 and 10.1, respectively, against replicating M. tuberculosis, while 22 was not
active at the highest testing concentration of 50 μg/mL. None of the fractions significantly
inhibited non-replicating M. tuberculosis in the LORA. The compounds were also screened by
Eoghainín O hainmhire of the Burdette Lab at UIC in the OVCAR5 bioassay, which indicated that
only 21 exhibited cytotoxicity at an LC50 of 22.4 μg/mL, while the others were inactive (Table A1).

112
Table A1. Antibiotic and cytotoxic activities of 20-22.
Fraction /
Compound
H37Rv MIC (µg/mL) % inhib. at 50 μg/mL LC50 (μg/mL)
MABA LORA Vero OVCAR5
G016-F1-1 >50 (12%) >50 (20%)
G016-F1-2 (20) 11.1 > 50 32.0 >100
G016-F1-3 (21) 10.1 45.7 19.8 22.4
G016-F1-4 >50 >50
G016-F1-5 (22) >50 >50 0.0 >100
G016-F1-6 12.28 >50
G016-F1-7 48.03 46.9
The 1H NMR spectrum of G016-F1-2, putatively identified as containing mansoquinone
(20) is shown with the chemical structure in Figure A3. This anthraquinone was previously
reported to moderately inhibit the growth of E. coli, B. subtilis, and S. aureus.1

113
Figure A3. 1H NMR spectrum (600 MHz) of 20 in CDCl3.
The 1H NMR spectrum of G016-F1-3, putatively identified as containing hibarimicin
HMP-M2 (21) is shown with its chemical structure in Figure A4. This anthraquinone was
structurally very similar to mansoquinone except for its enol subgroup and ethane extension on the
side chain. Compound 21 was isolated in 2002 from a chemically-mutagenized strain of
Microbispora rosea subsp. hibaria TP-A0121 and was identified as a shunt metabolite arising
from a biosynthetic precursor of hibarimicin B.2 The hibarimicins were discovered in a screening
for tyrosine kinase inhibitors, though in a follow-up study compound 21 did not exhibit significant
influence on tyrosine kinase inhibition or HL-60 cell differentiation.3, 4 To our knowledge, this
report represents the first discovery of compound 21 from a non-mutagenized environmental
actinomycete strain and the first screening of this compound for antibiotic activity.

114
Figure A4. 1H NMR spectrum (600 MHz) of 21 in CDCl3.
The 1H NMR spectrum of fraction G016-F1-5 was putatively identified as containing
1-methoxy-9-propyltetracene-6,11-dione (22) and is shown with the chemical structure in
Figure A5. This tetracene compound was reported in 2012 from a Micromonospora sp. extract that
contained metabolites active against the HCT-8 human colon adenocarcinoma cell line.5
Compound 22 was inactive against this cell line, which agrees with the absence of activity
observed in our study (Table A1). These molecules were not prioritized for further exploration due
their previous characterization and lack of significant activity in our bioassays.

115
Figure A5. 1H NMR spectrum (600 MHz) of 22 in CDCl3.
A1.3 Identification of tirandamycins from Icelandic sediment-derived strain K123.
We set out to identify the source of anti-TB activity observed in strain K123 fractions to
further our limited knowledge of the chemical diversity and pharmacological potential of
secondary metabolites from Icelandic marine-derived actinomycetes. To our knowledge, the
bioactivity of molecules from these sources is completely unknown. Furthermore, the collection
site of strain K123 is at a high latitude along the Icelandic coast and adjacent to geothermal features
that may foster interesting microbial communities. This environment may provide selection
pressures for interesting adaptations which could include novel biosynthetic pathways. The
pharmacological activity of secondary metabolites from actinomycetes living in the unusual
conditions of the island is also unexplored.6
Strain K123 was isolated from a sediment sample collected at a depth of 1 m near the
shoreline of Reykjanestá, the southwestern-most tip of Iceland (63° 48' 40.33" N,

116
22° 42' 58.42" W) in March of 2013. Fraction K123-F4 inhibited M. tuberculosis with an MIC of
0.30 μg/mL in the MABA and 0.26 μg/mL in the LORA. Based on their molecular ions and UV
profiles (Figure A6), compounds of MW 433.46 and 417.45 were quickly identified as
tirandamycins A (23) and B (24), which were initially implicated in the activity for the fraction
due to their prominence in the chromatogram. Fraction K123-F3 also contained these compounds,
so it was combined with K123-F4 with the goal of increasing the yield of tirandamycins following
subsequent chromatographic separation.
Figure A6. Representative tirandamycin UV profile.
The tirandamyicins (TAMs) are tetramic acids and were first isolated and characterized in
the early 1970s.7-9 Interestingly, there is no report describing the screening of the tirandamycin
class against TB. To date, this class has been reported to kill B. malayi parasites;10 the protozoa E.
histolytica;11 pathogenic anaerobes B. fragilis, B. vulgatus, B. thetaomicron, C. perfringens, P.
anaerobius, and C. difficile; and have been shown to exhibit moderate activity against the aerobe
S. pyogenes,12 and VRE;13 without exhibiting cytotoxicity.10 The class was reported to target RNA
polymerase in bacteria but not eukaryotes in a cell-free assay.14, 15 The mode of action of the
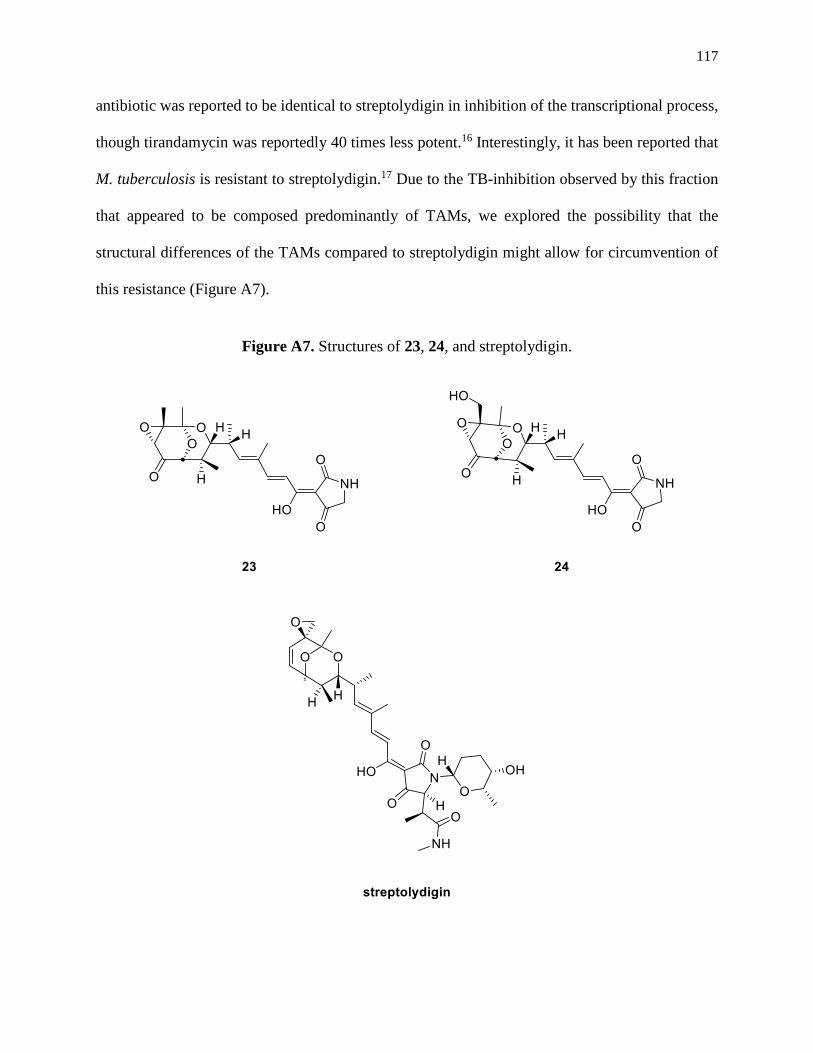
117
antibiotic was reported to be identical to streptolydigin in inhibition of the transcriptional process,
though tirandamycin was reportedly 40 times less potent.16 Interestingly, it has been reported that
M. tuberculosis is resistant to streptolydigin.17 Due to the TB-inhibition observed by this fraction
that appeared to be composed predominantly of TAMs, we explored the possibility that the
structural differences of the TAMs compared to streptolydigin might allow for circumvention of
this resistance (Figure A7).
Figure A7. Structures of 23, 24, and streptolydigin.

118
A 26.1 mg portion of the total 51.4 mg K123-F3/4 was separated using RP-C18 preparative
HPLC (16.0 mL·min−1, gradient of 30% to 82% ACN for 26 min, followed by an isocratic flow of
100% ACN for 10 min) to afford seven fractions, including the known compounds tirandamycin
B (24, K123-F3/4-2, tR 19.7 min, 4.58 mg, 17.55% yield), and tirandamycin A (23, K123-F3/4-6,
tR 25.3 min, 2.42 mg, 9.27% yield). Structures were confirmed by 1H NMR comparison (Figures
A8 and A9).8
Figure A8. 1H NMR spectrum (600 MHz) of 23 in CDCl3.

119
Figure A9. 1H NMR spectrum (600 MHz) of 24 in CDCl3.
Table A2. Anti-TB activities of K123-F3/4 and subfractions.
Fraction
H37Rv MIC (µg/mL)
MABA
K123-F3/4 6.0
K123-F3/4-1 > 50
K123-F3/4-2 (24) > 50
K123-F3/4-3 > 50
K123-F3/4-4 > 50
K123-F3/4-5 24.6
K123-F3/4-6 (23) > 50
K123-F3/4-7 > 50
Following submission to the ITR for screening in the MABA, the K123-F3/4 subfractions,
including the tirandamycins, were found to lack the activity of the parent fraction (Table A2). This

120
was unexpected, so possible explanations for loss of material were explored. Interestingly, a group
of non-UV absorbing analytes that were observable by MS in the methanol wash of an HPLC-MS
run were absent when using an acetonitrile mobile phase for analysis of the same sample (Figures
A10 and A11). This series of peaks had molecular weights in the high 700’s and low 800’s and
are evidence to the fact that though MeOH is often a weaker eluent than ACN at lower
concentrations, it can act as a stronger eluent than ACN at 100%.
Figure A10. K123-F3/4 UV and MS chromatograms with ACN organic mobile phase.
Luna C18 100 x 4.6 mm 5 µm 100 Å; 30% ACN 5 min, 30-100% ACN 10 min, 100% ACN 10 min. No MS peaks
observed between 19 and 21 minutes.

121
Figure A11. K123-F3/4 UV and MS chromatograms with MeOH organic mobile phase.
Luna C18 100 x 4.6 mm 5 µm 100 Å; 30% MeOH 5 min, 30-100% MeOH 10 min, 100% MeOH 10 min. At least five
overlapping MS peaks observed between 19 and 21 minutes. Dotted line highlights peaks unique to MeOH wash.
These non-polar MeOH wash molecules are worth exploring further for their anti-TB
activity. Unfortunately, a MeOH wash from the earlier separation was not collected and the
material was not retrievable from the column. To explore the bioactive potential of the MeOH
wash identified from MS, a 4.54 mg portion of remaining K123 F3/4 was eluted through 0.5 cm
loose C18 in a 6” Pasteur pipette using acetonitrile. Following elution with 4 mL acetonitrile, the
C18 resin retained a yellow hue, evidence for additional material remaining on the column. In
accord with observations from the MS data, a wash of 100% MeOH was sufficient to elute this
material. Two 3 mL fractions of the wash were collected resulting in 1.28 mg for the first fraction
(MeOH W1) and 0.51 mg for the second (MeOH W2). These were included in a subsequent
screening against M. tuberculosis in the MABA. Other samples that were also included in order to
explore other possible explanations for the loss of bioactivity, included 1) fractions F3, F4, and
combined fraction F3/4 from the fraction library to test for bioassay anomalies, cancelation of F4

122
activity by F3 (or vice versa), or degradation of material; 2) combined 23 and 24 to test for potential
synergy between TAMs that would have been lost in the isolation process.
Bioassay supported the earlier observation of activity from K123-F3/4 and indicated that
the first of the two methanol washes was responsible for the activity of the parent fraction with an
MIC of 7.8 μg/mL. Interestingly, these washes did not exhibit cytotoxicity when screened against
the Vero cell line. The combined TAMs and the second wash were not significantly active (Table
A3).
Table A3. In vitro anti-TB activity and cytotoxicity of K123 fractions.
Sample H37Rv MABA MIC (µg/mL) Vero IC50 (µg/mL)
K123-F3 2.7 Not tested
K123-F4 3.0 Not tested
K123-F3/4 5.9 Not tested
TAMA / TAMB >50 Not tested
K123-3/4 MeOH W1 7.8 > 50
K123-3/4 MeOH W2 22.2 > 50
Analysis of MS data collected for the first MeOH wash of combined fractions K123-F3/4
revealed six peaks (Figure A12). Four of these shared a common ion pattern that is putatively a
Na+ adduct of the [M+H]+ ion following a loss of H2O (Figure A13). The consistent pattern among
these peaks suggested that they are a class of related analogs.
Figure A12. Selected ion chromatogram of K123-F3/4 MeOH W1.
Kinetex C18 100 x 2.1 mm 2.6 µm 100 Å; 30% ACN 5 min, 30-100% ACN 10 min, 100% ACN 10 min.

123
Figure A13. Representative ion pattern for K123-F3/4 MeOH W1 selected ion peaks.
775.0 780.0 785.0 790.0 795.0 800.0 805.0 810.0 815.0 820.0 m/z0.00
0.25
0.50
0.75
1.00
1.25
1.50Inten.(x10,000,000)
801.4766
796.5183
779.5419
780.4389804.4785 817.4405
Figure A14. 1H NMR spectrum (600 MHz) of K123-F3/4 MeOH W1 in CDCl3.
The molecular weights, absence of UV absorbance between 200 – 600 nm, and 1H NMR
spectrum (Figure A14) were used to dereplicate the compounds present in the MeOH W1 fraction.
Potential compound matches were not found. Since this is a 1.28 mg combination of at least seven
compounds, a greater abundance of each peak should be purified to more confidently assess their
124
potential novelty. Additional chromatographic steps are required to isolate greater amounts of each
compound from the 25.3 mg remaining of K123-F3/4. A larger scale regrow of strain K123 would
also be an option for generating more material for testing. Future studies would involve the
isolation, dereplication, and characterization of novel compounds in this TB-active K123-F3/4 W1
wash fraction.
125
A1.4 CITED LITERATURE.
1. Abdelfattah, M. S. Mansoquinone: Isolation and structure elucidation of new antibacterial
aromatic polyketides from terrestrial Streptomyces sp. Eg5. Nat. Prod. Res. 2009, 23, 212-
218.
2. Igarashi, Y.; Kajiura, T.; Furumai, T.; Hori, H.; Higashi, K.; Ishiyama, T.; Uramoto, M.;
Uehara, Y.; Oki, T. Biosynthesis of hibarimicins. III. Structures of new hibarimicin-related
metabolites produced by blocked mutants. J. Antibiot. (Tokyo) 2002, 55, 61-70.
3. Cho, S. I.; Fukazawa, H.; Honma, Y.; Kajiura, T.; Hori, H.; Igarashi, Y.; Furumai, T.; Oki,
T.; Uehara, Y. Effects of hibarimicins and hibarimicin-related compounds produced by
Microbispora on v-Src kinase activity and growth and differentiation of human myeloid
leukemia HL-60 cells. J. Antibiot. (Tokyo) 2002, 55, 270-278.
4. Kajiura, T.; Furumai, T.; Igarashi, Y.; Hori, H.; Higashi, K.; Ishiyama, T.; Uramoto, M.;
Uehara, Y.; Oki, T. Biosynthesis of hibarimicins. II. Elucidation of biosynthetic pathway
by cosynthesis using blocked mutants. J. Antibiot. (Tokyo) 2002, 55, 53-60.
5. Sousa, T. d. S.; Jimenez, P. C.; Ferreira, E. G.; Silveira, E. R.; Braz-Filho, R.; Pessoa, O. D.
L.; Costa-Lotufo, L. V. Anthracyclinones from Micromonospora sp. J. Nat. Prod. 2012,
75, 489-493.
6. Omarsdottir, S.; Einarsdottir, E.; Ögmundsdottir, H. M.; Freysdottir, J.; Olafsdottir, E. S.;
Molinski, T. F.; Svavarsson, J. Biodiversity of benthic invertebrates and bioprospecting in
Icelandic waters. Phytochem. Rev. 2013, 12, 517-529.
7. Duchamp, D. J.; Branfman, A. R.; Button, A. C.; Rinehart, K. L. X-ray structure of
tirandamycic acid p-bromophenacyl ester. Complete stereochemical assignments of
tirandamycin and streptolydigin. J. Am. Chem. Soc. 1973, 95, 4077-4078.
8. Rinehart, K. L.; MacKellar, F. A.; Grostic, M. F.; Olson, E. C.; Wnuk, R. J.; Branfman, A.
R. Tirandamycin. I. Structure assignment. J. Am. Chem. Soc. 1971, 93, 4943-4945.
9. Meyer, C. E. Tirandamycin, a new antibiotic isolation and characterization. J. Antibiot.
1971, 24, 558-560.
10. Rateb, M. E.; Yu, Z.; Yan, Y.; Yang, D.; Huang, T.; Vodanovic-Jankovic, S.; Kron, M. A.;
Shen, B. Medium optimization of Streptomyces sp. 17944 for tirandamycin B production
and isolation and structural elucidation of tirandamycins H, I and J. J. Antibiot. 2014, 67,
127-132.
11. Espinosa, A.; Socha, A. M.; Ryke, E.; Rowley, D. C. Antiamoebic properties of the
actinomycete metabolites echinomycin A and tirandamycin A. Parasitol. Res. 2012, 111,
2473-2477.
12. Rosen, T.; Fernandes, P. B.; Marovich, M. A.; Shen, L.; Mao, J.; Pernet, A. G. Aromatic
dienoyl tetramic acids. Novel antibacterial agents with activity against anaerobes and
staphylococci. J. Med. Chem. 1989, 32, 1062-1069.
13. Carlson, J. C.; Li, S.; Burr, D. A.; Sherman, D. H. Isolation and characterization of
tirandamycins from a marine-derived Streptomyces sp. J. Nat. Prod. 2009, 72, 2076-2079.
14. Reusser, F. Tirandamycin: Inhibition of ribonucleic acid polymerase. Infect. Immun. 1970,
2, 77-81.
15. Reusser, F. Tirandamycin, an inhibitor of bacterial ribonucleic acid polymerase.
Antimicrob. Agents Chemother. 1976, 10, 618-622.
16. Reusser, F. Tirandamycin: Inhibition of oxidative phosphorylation in rat liver
mitochondria. Infect. Immun. 1970, 2, 82-88.
17. Speer, A.; Rowland, J. L.; Niederweis, M. Mycobacterium tuberculosis is resistant to
streptolydigin. Tuberculosis (Edinb.) 2013, 93, 401-404.

A2. SUPPLEMENTAL INFORMATION.
A2.1. Supplemental information for: DIAZA-ANTHRACENE ANTIBIOTICS FROM A
FRESHWATER-DERIVED ACTINOMYCETE WITH SELECTIVE
ANTIBACTERIAL ACTIVITY TOWARD M. TUBERCULOSIS.
A.2.1.1 DARTS assay for identification of the molecular target of diazaquinomycin A in
M. tuberculosis cell lysate.
Multiple unsuccessful attempts were made at directly isolating a protein target using the
drug affinity responsive target stability (DARTS) assay method developed by the Huang lab at the
University of California, Los Angeles.1, 2 Multiple reagent concentrations, incubation times, and
temperatures were attempted without success. This method primarily uses SDS-PAGE and mass
spectrometry and relies on the ability of the test compound, in our case DAQA, to bind and
stabilize a protein target in the presence of a protease mixture. There are numerous explanations
why this method was unsuccessful, of them being the possibilities that 1) 3 binds or interacts with
a non-protein target that would not be detected by this method, 2) 3 has multiple targets, 3) 3 does
not bind covalently, strongly enough, or in such a conformation as to protect a protein target from
protease degradation, 4) the protein target was in too low of abundance to be identified on an SDS-
PAGE gel.
A2.1.2 Investigation of the ability of diazaquinomycin A (3) to inhibit cellular
respiration.
Menaquinones are critical to electron transport, oxidative phosphorylation, and endospore
formation in bacteria. We recognized that the anthraquinone structure of 3 has a similarity to the
menaquinones (Vitamin K). Additionally, 3 exhibited an oxidative stress component similar to
clofazimine, which interferes with menaquinones in the electron transport chain.3 Thus, we
reasoned that the DAQs may also inhibit electron transport. If 3 competed with menaquinones to
affect electron transport, it would quickly affect ATP levels similar to bedaquiline (BDQ)4 In
collaboration with the Clifton Barry lab, we used a Promega BacTiter-Glo™ assay, which
harnesses the bioluminescence signal from a luciferase-catalyzed reaction for the measurement of

127
ATP levels following incubation with test compound for 24 hours. The heatmap in Figure A15
illustrates that 3 had no direct effect on respiration that would result in depletion of ATP in
M. tuberculosis. ATP increases over 24 hours in certain stress situations, which is seen following
isoniazid and rifampin treatment. Conversely, BDQ, Q203, and carbonyl cyanide
chlorophenylhydrazone (CCCP) are known inhibitors of respiration that deplete ATP in this
timeframe.
Figure A15. M. tuberculosis ATP levels are unaffected following treatment with 3.
aisoniazid; brifampin; cstreptomycin; dbedaquiline; ecarbonyl cyanide chlorophenylhydrazone; fdiazaquinomycin A.
Compound and initial concentration in first well indicated in far left column. Subsequent wells to the right are 2-fold
dilutions down to column 11. Column 12 is drug-free control.
Methods. DMSO stocks of each TB inhibitor were diluted in 7H9/ADC/Tw as two-fold
serial dilution series in duplicate at 50 µL per well in clear round-bottom 96-well plates (Thermo
Scientific #163320) leaving a drug-free media control in column 12. M. tuberculosis H37Rv
(ATCC 27294) was cultured in 7H9/ADC/Tw to an OD of 0.2 and diluted 1:1000 in the same
medium followed by addition of 50 µL of the diluted cell suspension to each well. The plates were
incubated at 37 °C in sealed bags for 24 hours after which 20uL BacTiter Glo reagent (Promega)
was added. Luminescence was recorded after 15 min incubation at room temperate in a Fluorostar
Optima reader.

128
A2.1.3 Antibiotic activity of diazaquinomycin A (3) against a panel of environmental
actinomycete bacteria.
In the interest of generating additional experimental options to aid in characterization of
the DAQA MOA, we screened the compound against a series of aquatic-derived actinomycete
bacteria from the Murphy lab strain library using a disk diffusion assay. Justification for the
experiment was initially based upon the recognition that, as in M. tuberculosis, environmental
actinomycetes such as Streptomyces and Micromonospora species share biochemical pathways
dependent on F420.5 Though 3 activity has been incredibly selective thus far, there remains the
possibility for susceptibility in other microorganisms. Surprisingly, there was a range of activities
observed against these strains (Table A4). As many as ten of the seventeen environmental
actinomycetes exhibited some degree of susceptibility to 3. The zones of inhibition for four of the
susceptible environmental strains were not devoid of colonies, but rather had an observably less
dense lawn surrounding the paper disks, while another strain that was not susceptible in terms of
viability underwent inhibition of the production of a red pigment. Though it is difficult to compare
assays performed in solid agar with those in liquid media, this study adds to the understanding of
DAQA selectivity. Based on activities observed in mycobacteria and these environmental isolates,
this class of compound seems to have the greatest effect on biological processes in bacteria of the
order Actinomycetales. These data suggest that resistant mutant strains could be generated from
DAQ-susceptible environmental actinomycetes to aid in future MOA studies. These strains may
be more amenable to mutant generation with less frequent occurrence of phenotypically resistant
colonies and could serve as a substitute in the event of failed experiments using mc27000.

129
Table A4. Evaluation of the activity of 3 against environmental actinomycete bacteria.
Zone of Inhibition (mm)
Strain
name
16S rRNA
sequence identity
Control
(0 μg) 1 μg 10 μg 25 μg Notes
A001 S. tendae 0 0 0 0
A003 S. tendae 0 0 0 0 red pigment production inhibited
A004 S. koyangensis 0 8 10 12 well defined zones of less dense
colonies
A009 S. flavogriseus 0 0 8 10
A019 S. tendae 0 8 8 10 well defined zones of less dense
colonies
B007 S. griseoflavus 0 0 8 10
B010 S. mordarskii 0 0 0 0
D034 S. tacrolimicus 0 0 0 0 well defined zones of less dense
colonies
D036 S. erythrogriseus 0 10 12 14
D038 S. lienomycini 0 0 0 0
D041 S. griseoincarnatus 0 10 13 18 forms sparse colonies – inhibition
zones difficult to measure
D057 S. jietaisiensis 0 8 10 12 well defined zones of less dense
colonies
D080 S. xinghaiensis 0 0 0 0 forms sparse colonies – inhibition
zones difficult to measure
DAQ producer strains
F001 S. coacervatus 0 0 0 0
B006 M. tulbaghiae 0 9 11 16
Negative control
D012 B. thuringiensis 0 0 0 0
Methods. Paper disks containing 1 μg, 10 μg, and 25 μg of 3 were made by applying
0.025 mg/mL, 0.250 mg/mL, and 0.625 mg/mL solutions of 3, respectively, dissolved in 1:1
DCM:MeOH to 6 mm Whatman #1 filter paper disks in 5 μL increments dropwise, allowing for

130
solvent evaporation between drops. Solvent control blank disks soaked in the equivalent volume
1:1 DCM:MeOH without 3 and dried were also included. One of each of these four disks was then
applied to plates with one of 15 strains identified as actinomycetes by 16S sequencing alongside a
single B. thuringiensis strain as a negative control. These were incubated at room temperature for
11 days. Zones of inhibition were measured as the mm diameter surrounding each paper disk.

131
A2.1.4 CITED LITERATURE.
1. Lomenick, B.; Hao, R.; Jonai, N.; Chin, R. M.; Aghajan, M.; Warburton, S.; Wang, J.; Wu,
R. P.; Gomez, F.; Loo, J. A.; Wohlschlegel, J. A.; Vondriska, T. M.; Pelletier, J.;
Herschman, H. R.; Clardy, J.; Clarke, C. F.; Huang, J. Target identification using drug
affinity responsive target stability (DARTS). Proc. Natl. Acad. Sci. U. S. A. 2009, 106,
21984-21989.
2. Pai, M. Y.; Lomenick, B.; Hwang, H.; Schiestl, R.; McBride, W.; Loo, J. A.; Huang, J.
Drug affinity responsive target stability (DARTS) for small molecule target identification.
Methods Mol. Biol. 2015, 1263, 287-298.
3. Yano, T.; Kassovska-Bratinova, S.; Teh, J. S.; Winkler, J.; Sullivan, K.; Isaacs, A.;
Schechter, N. M.; Rubin, H. Reduction of clofazimine by mycobacterial type 2
NADH:quinone oxidoreductase: a pathway for the generation of bactericidal levels of
reactive oxygen species. J. Biol. Chem. 2011, 286, 10276-10287.
4. Hards, K.; Robson, J. R.; Berney, M.; Shaw, L.; Bald, D.; Koul, A.; Andries, K.; Cook, G.
M. Bactericidal mode of action of bedaquiline. J. Antimicrob. Chemother. 2015, 70, 2028-
2037.
5. Choi, K. P.; Kendrick, N.; Daniels, L. Demonstration that fbiC is required by
Mycobacterium bovis BCG for coenzyme F420 and FO biosynthesis. J. Bacteriol. 2002,
184, 2420-2428.

A2.1.5 Reference spectra and figures.
Figure A16. Fraction library generation scheme.
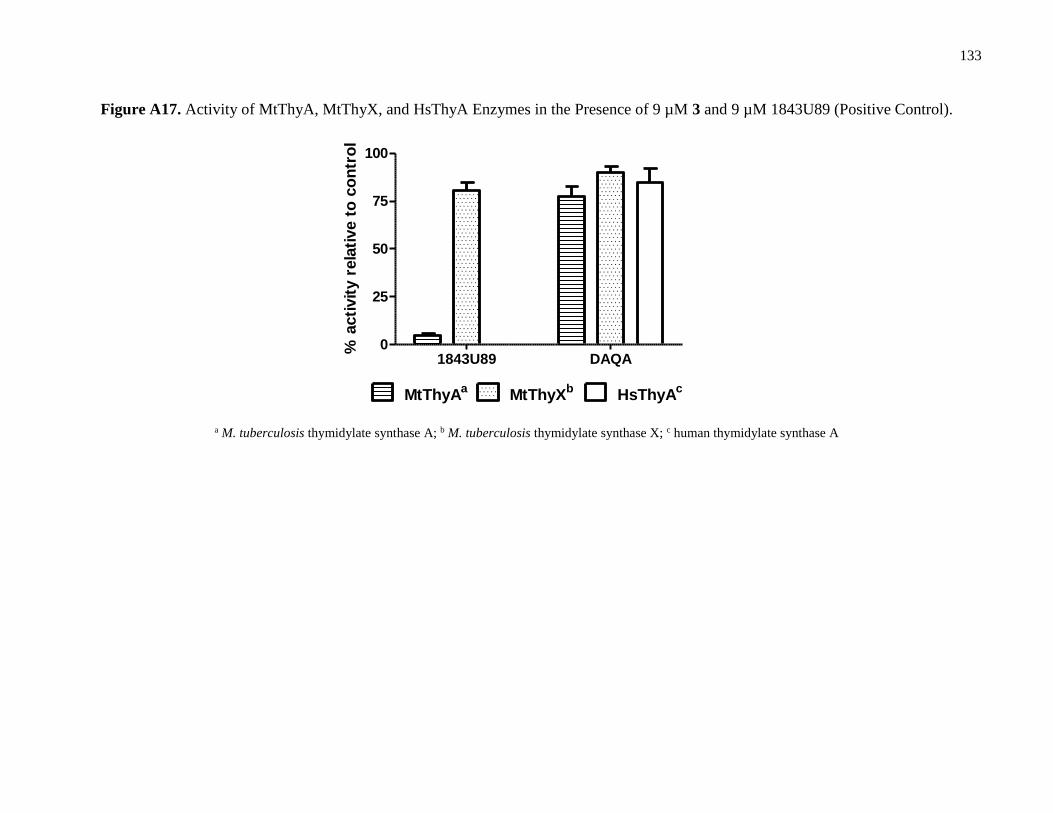
133
Figure A17. Activity of MtThyA, MtThyX, and HsThyA Enzymes in the Presence of 9 µM 3 and 9 µM 1843U89 (Positive Control).
1843U89 DAQA0
25
50
75
100
MtThyAa
MtThyXb
HsThyAc
% a
cti
vit
y r
ela
tive t
o c
on
tro
l
a M. tuberculosis thymidylate synthase A; b M. tuberculosis thymidylate synthase X; c human thymidylate synthase A
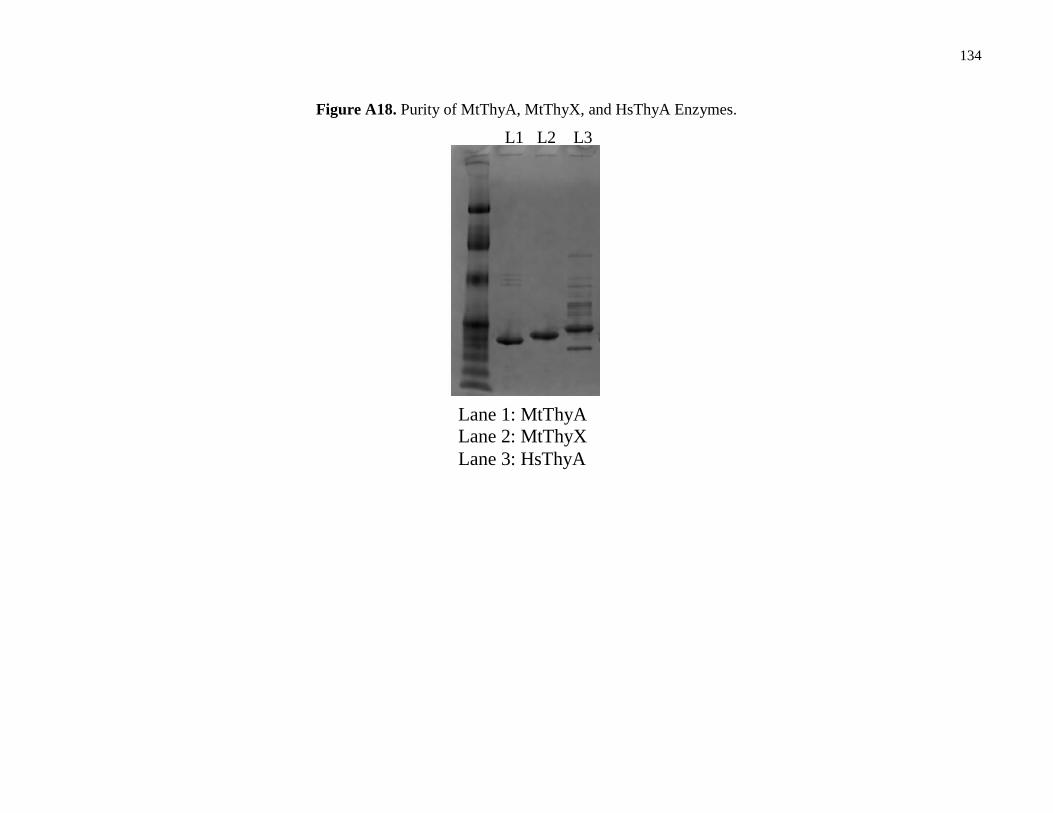
134
Figure A18. Purity of MtThyA, MtThyX, and HsThyA Enzymes.
Figure S2. Purity of MtThyA, MtThyX, and HsThyA Enzymes.
L1 L2 L3
Lane 1: MtThyA
Lane 2: MtThyX
Lane 3: HsThyA

135
Figure A19. Concentration-response curves of 3 against M. tuberculosis anhydrotetracycline-inducible thyA and thyX overexpression
mutants.
0 .0 1 0 .1 1 1 0 1 0 0
0
5 0
1 0 0
1 5 0
0 .4 3 5 5
S lo p e 1 3 .3 5 3
M IC 1C o n c e n t r a t io n ( µ M )
Pe
rc
en
t G
ro
wth
0 .0 1 0 .1 1 1 0 1 0 0
0
5 0
1 0 0
1 5 0
0 .5 3 7 3
S lo p e 1 2 .8 0 1
M IC 1C o n c e n t r a t io n ( µ M )
Pe
rc
en
t G
ro
wth
0 .0 1 0 .1 1 1 0 1 0 0
0
5 0
1 0 0
1 5 0
0 .6 5 7 1
S lo p e 1 2 .3 7 0
M IC 1C o n c e n t r a t io n ( µ M )
Pe
rc
en
t G
ro
wth
0 .0 1 0 .1 1 1 0 1 0 0
0
5 0
1 0 0
1 5 0
0 .9 2 2 7
S lo p e 1 2 .0 6 3
M IC 1C o n c e n t r a t io n ( µ M )
Pe
rc
en
t G
ro
wth
0 .0 1 0 .1 1 1 0 1 0 0
0
5 0
1 0 0
1 5 0
0 .7 5 2 1
S lo p e 1 2 .5 6 7
M IC 1C o n c e n t r a t io n ( µ M )
Pe
rc
en
t G
ro
wth
0 .0 1 0 .1 1 1 0 1 0 0
0
5 0
1 0 0
1 5 0
0 .6 9 6 9
S lo p e 1 2 .2 8 1
M IC 1C o n c e n t r a t io n ( µ M )
Pe
rc
en
t G
ro
wth
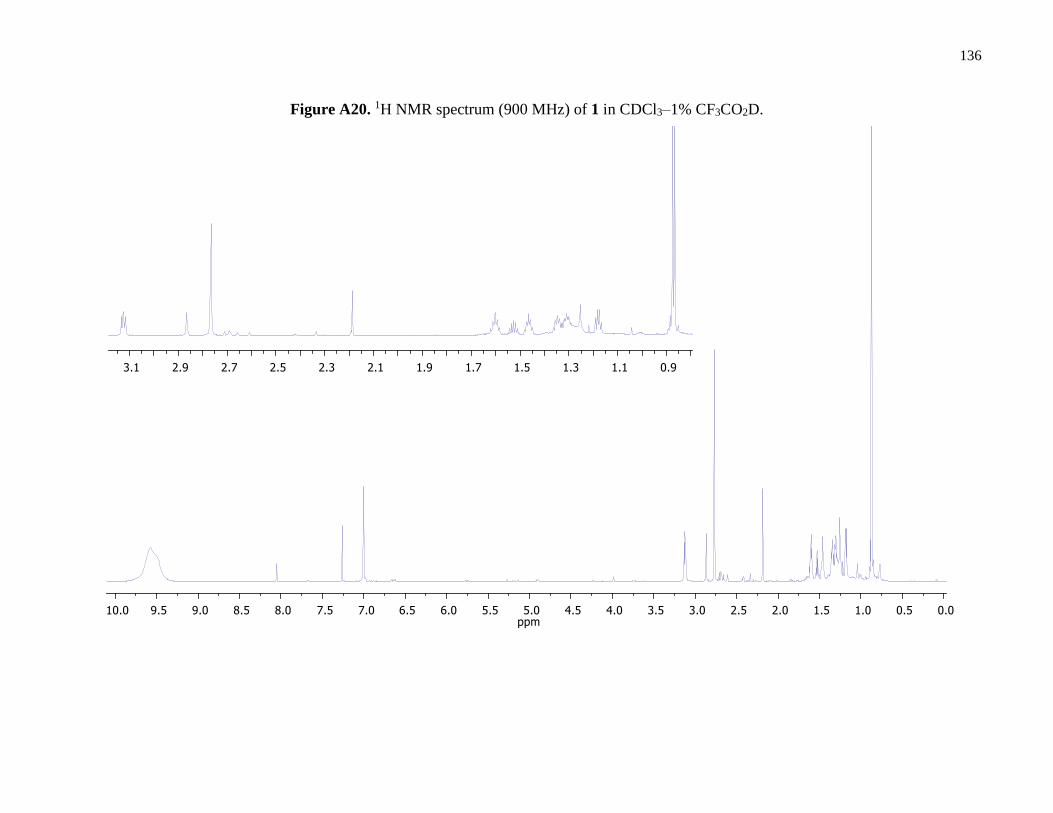
136
Figure A20. 1H NMR spectrum (900 MHz) of 1 in CDCl3–1% CF3CO2D.

137
Figure A21. 13C DEPTQ spectrum (226.2 MHz) of 1 in CDCl3–1% CF3CO2D.
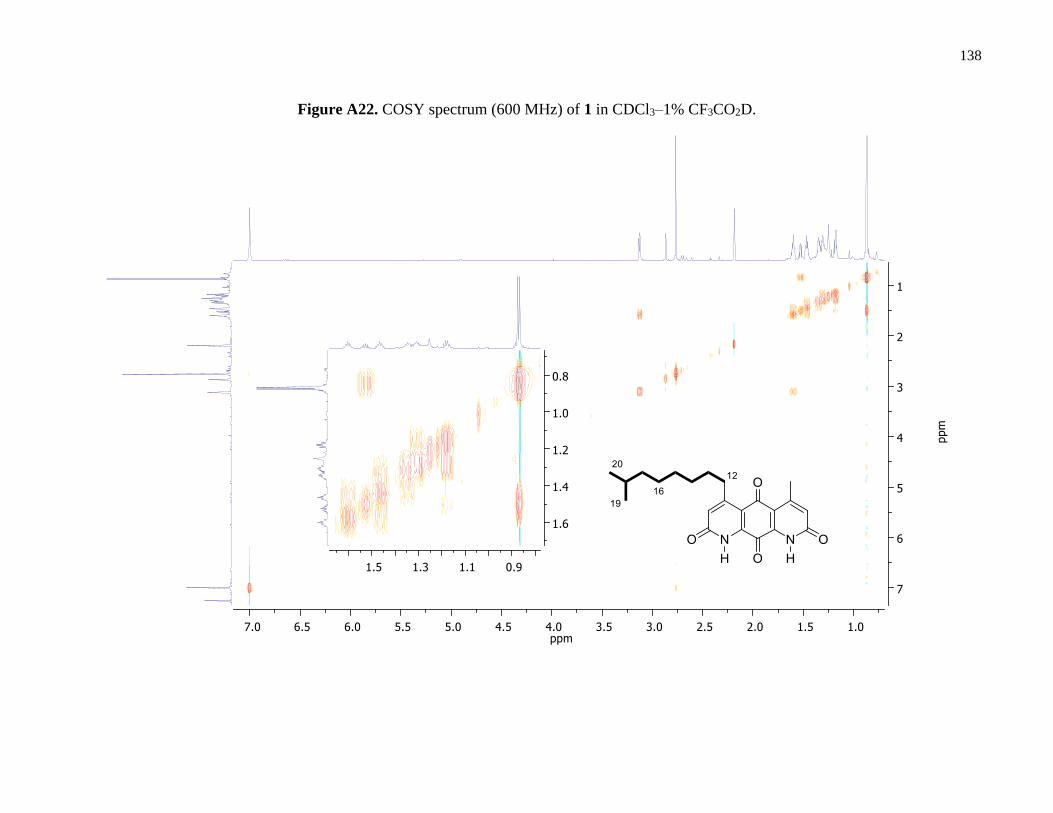
138
Figure A22. COSY spectrum (600 MHz) of 1 in CDCl3–1% CF3CO2D.
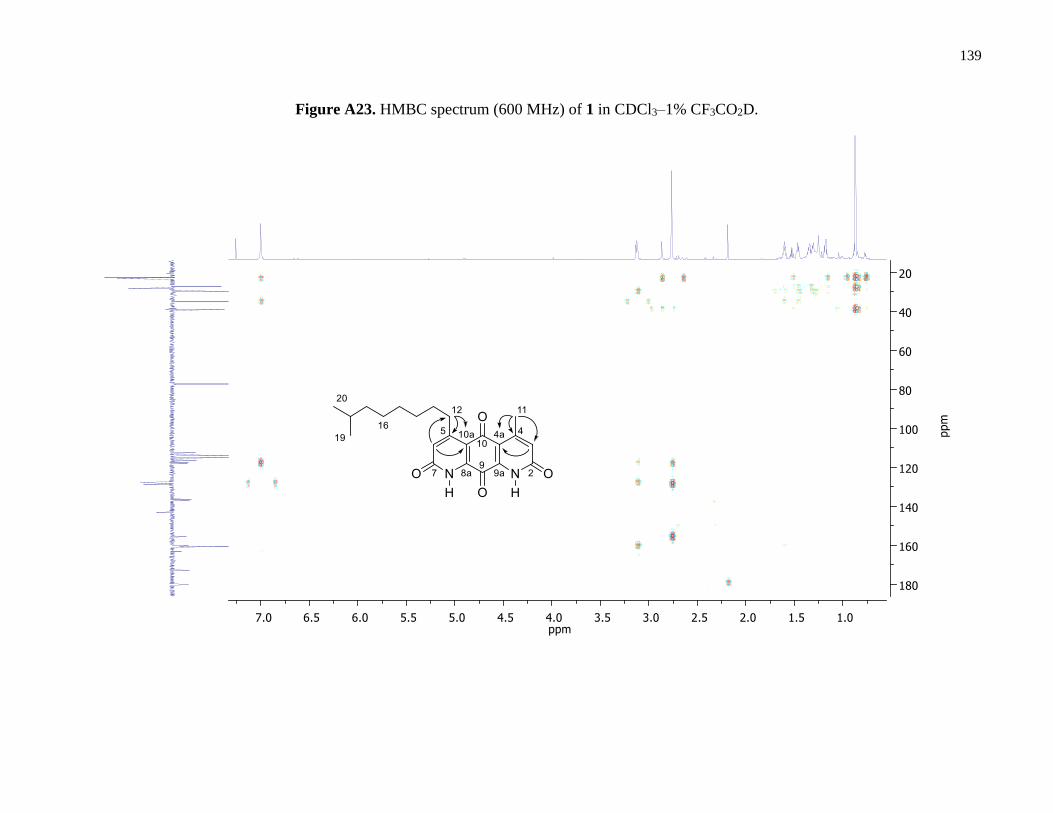
139
Figure A23. HMBC spectrum (600 MHz) of 1 in CDCl3–1% CF3CO2D.

140
Figure A24. 1D-TOCSY spectra (600 MHz) of 1 in CDCl3–1% CF3CO2D.
Arrows indicate irradiated resonances. (A) Expansion of 1H NMR spectrum (600 MHz) of 1; (B) Expansion of 1D-TOCSY spectrum of 1 (irradiation of δH 3.13); (C)
Expansion of 1D-TOCSY spectrum of 1 (irradiation of δH 1.19); (D) Expansion of 1D-TOCSY spectrum of 1 (irradiation of δH 0.87).

141
Figure A25. Expanded HR-ESI-IT-TOF mass spectra of 1.
HR-ESI-IT-TOF MS m/z 383.1993 [M + H]+ (calcd. for C22H27N2O4: 383.1971), m/z 381.1771 [M - H]- (calcd. for C22H25N2O4: 381.1820), m/z 765.3778
[2M + H]+ (calcd. for C44H53N4O8: 765.3863), and m/z 763.3639 [2M - H]- (calcd. for C44H51N4O8: 763.3712).
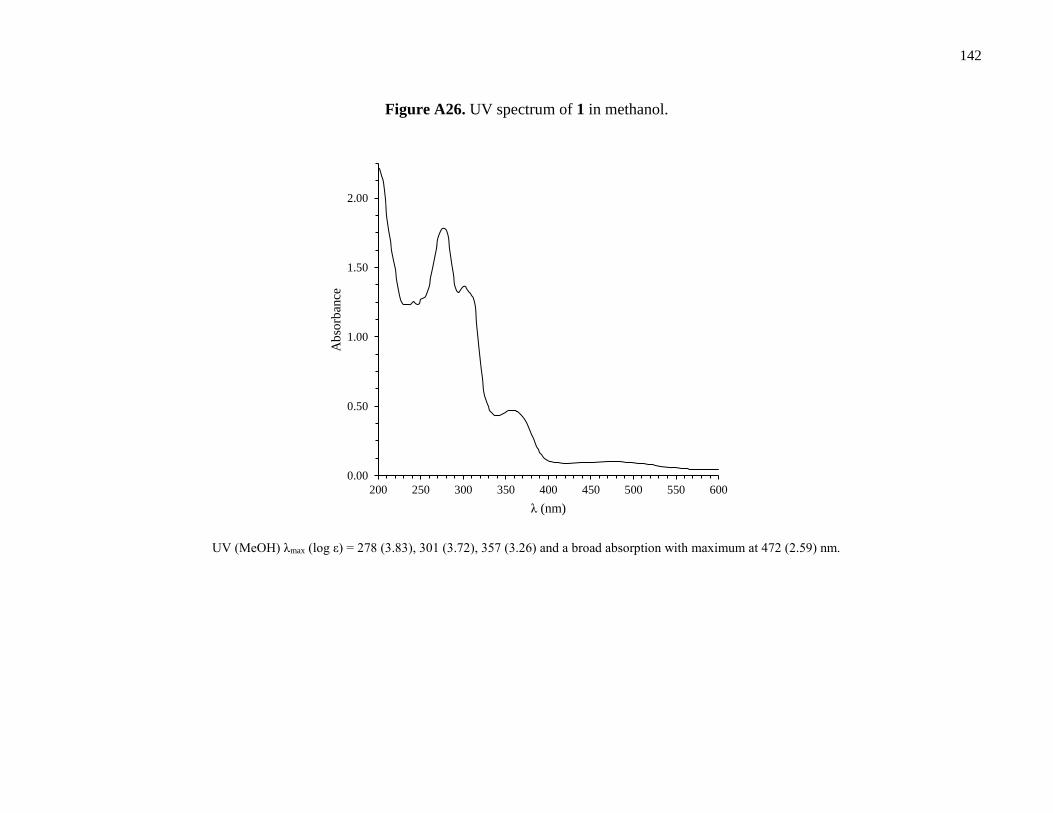
142
Figure A26. UV spectrum of 1 in methanol.
UV (MeOH) λmax (log ε) = 278 (3.83), 301 (3.72), 357 (3.26) and a broad absorption with maximum at 472 (2.59) nm.
0.00
0.50
1.00
1.50
2.00
200 250 300 350 400 450 500 550 600
Ab
sorb
ance
λ (nm)
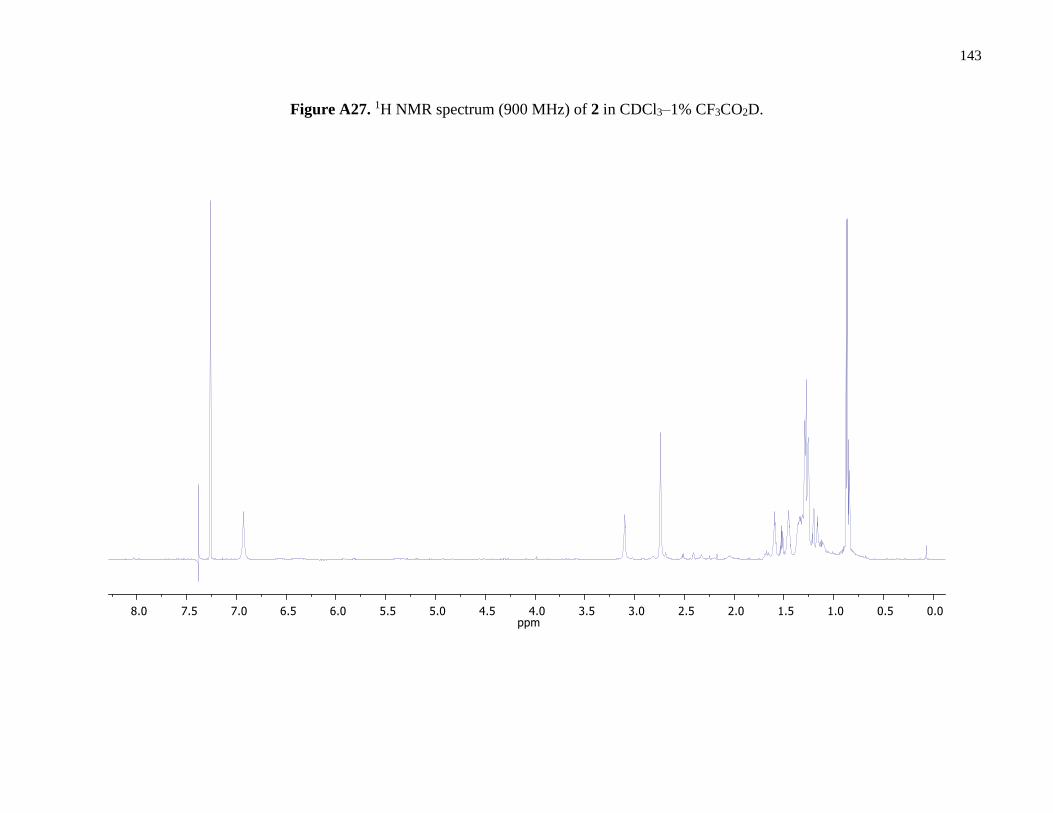
143
Figure A27. 1H NMR spectrum (900 MHz) of 2 in CDCl3–1% CF3CO2D.

144
Figure A28. 13C DEPTQ spectrum (226.2 MHz) of 2 in CDCl3–1% CF3CO2D.

145
Figure A29. COSY spectrum (600 MHz) of 2 in CDCl3–1% CF3CO2D.

146
Figure A30. HMBC spectrum (600 MHz) of 2 CDCl3–1% CF3CO2D.

147
Figure A31. 1D-TOCSY spectra (600 MHz) of 2 in CDCl3–1% CF3CO2D.
Arrows indicate irradiated resonances. (A) Expansion of 1H NMR spectrum (600 MHz) of 2; (B) Expansion of 1D-TOCSY spectrum of 2 (irradiation of
δH 3.10); (C) Expansion of 1D-TOCSY spectrum of 2 (irradiation of δH 1.45); (D) Expansion of 1D-TOCSY spectrum of 2 (irradiation of δH 0.86).

148
Figure A32. Expanded HR-ESI-IT-TOF mass spectra of 2.
HR-ESI-IT-TOF MS m/z 397.2162 [M + H]+ (calcd. for C23H29N2O4: 397.2127), m/z 395.1924 [M - H]- (calcd. for C23H27N2O4: 395.1976), m/z 793.4129
[2M + H]+ (calcd. for C46H57N4O8: 793.4176), and m/z 791.3825 [2M - H]- (calcd. for C46H55N4O8: 791.4025).

149
Figure A33. UV spectrum of 2 in methanol.
UV (MeOH) λmax (log ε) = 278 (3.37), 300 (3.26), 356 (2.90) and a broad absorption with maximum at 472 (2.44) nm.
0.00
0.13
0.25
0.38
0.50
0.63
200 250 300 350 400 450 500 550 600
Ab
sorb
ance
λ (nm)
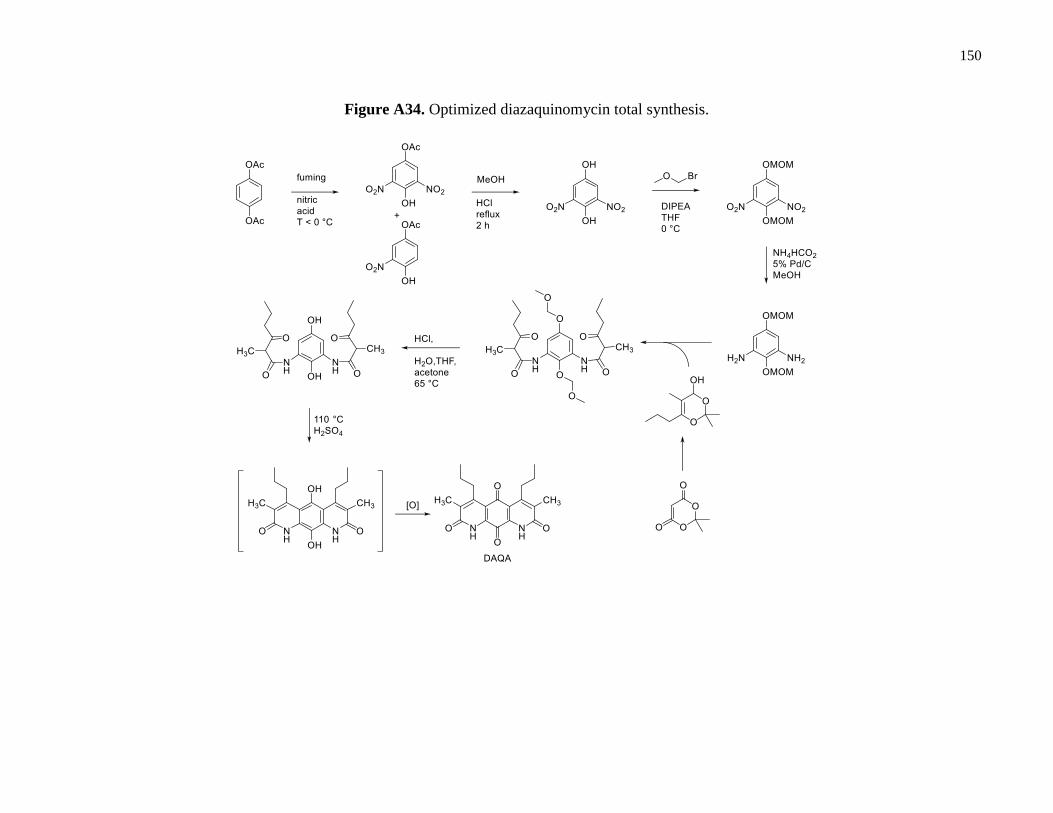
150
Figure A34. Optimized diazaquinomycin total synthesis.

151
Figure A35. Expansion of 1H NMR spectrum (600 MHz) of 6 in CDCl3.

152
Figure A36. Expansion of 1H NMR spectrum (600 MHz) of 9 in CDCl3.

153
Figure A37. Expansion of 1H NMR spectrum (600 MHz) of 10 in CDCl3.

154
Figure A38. Expansion of 1H NMR spectrum (600 MHz) of 11 in CDCl3.
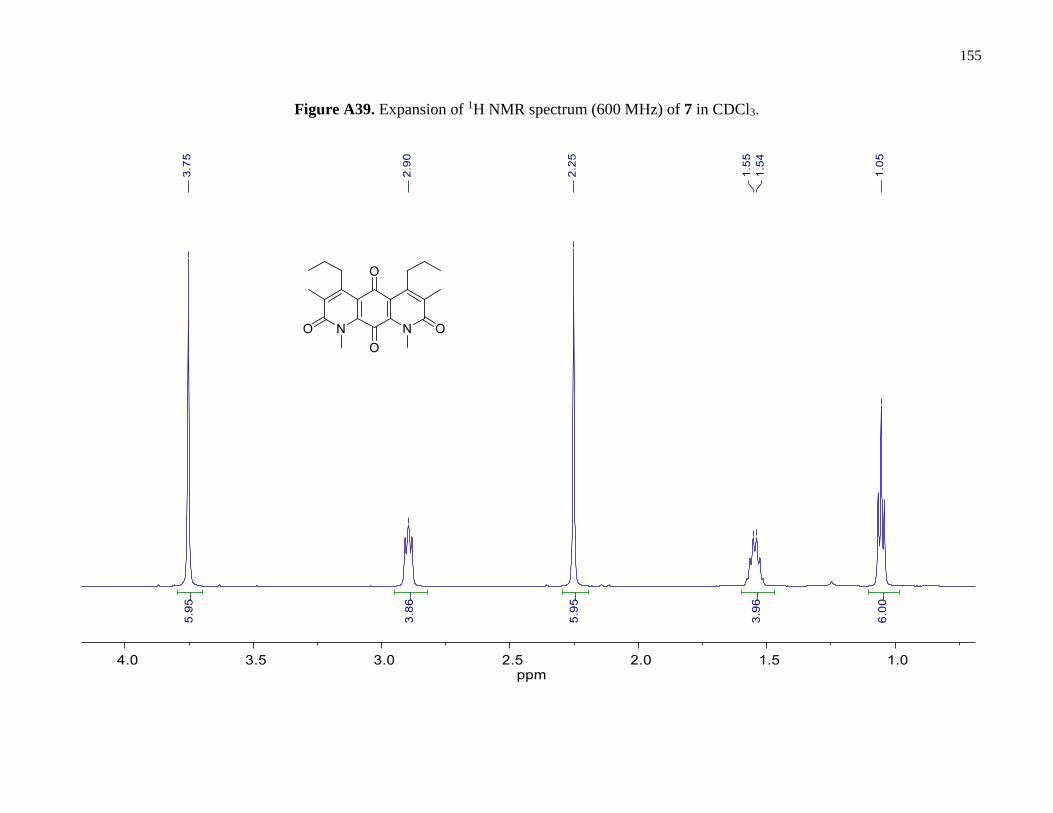
155
Figure A39. Expansion of 1H NMR spectrum (600 MHz) of 7 in CDCl3.

156
Figure A40. Expansion of 1H NMR spectrum (600 MHz) of 8 in CDCl3.

157
Figure A41. Plasmid maps for pCom8-PFR1500, pCom8-PFR1500L, and pBTL10.
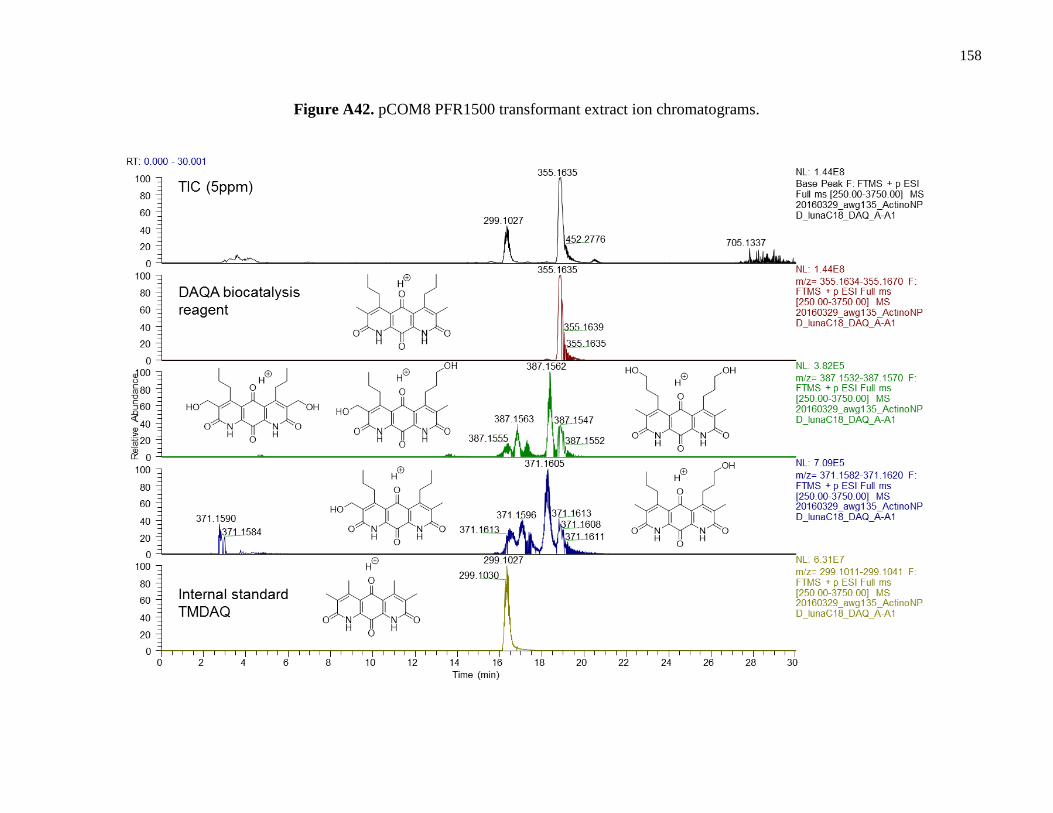
158
Figure A42. pCOM8 PFR1500 transformant extract ion chromatograms.
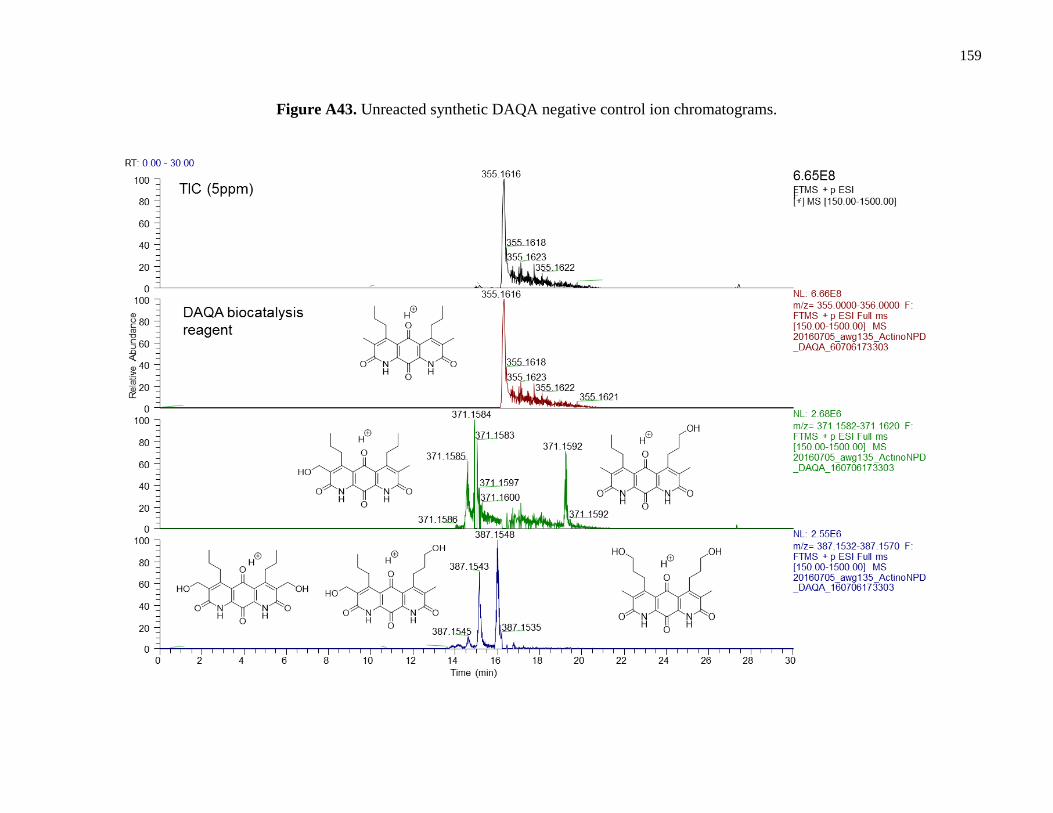
159
Figure A43. Unreacted synthetic DAQA negative control ion chromatograms.

A2.2 Reference spectra and figures for: DIAZAQUINOMYCINS E–G, NOVEL DIAZA-ANTHRACENE ANALOGS FROM A
MARINE-DERIVED STREPTOMYCES SP.
Figure A44. 1H NMR spectrum (900 MHz) of 12 in CDCl3 - 1% CF3CO2D.

161
Figure A45. 13C DEPTQ spectrum (226.2 MHz) of 12 in CDCl3 - 1% CF3CO2D.
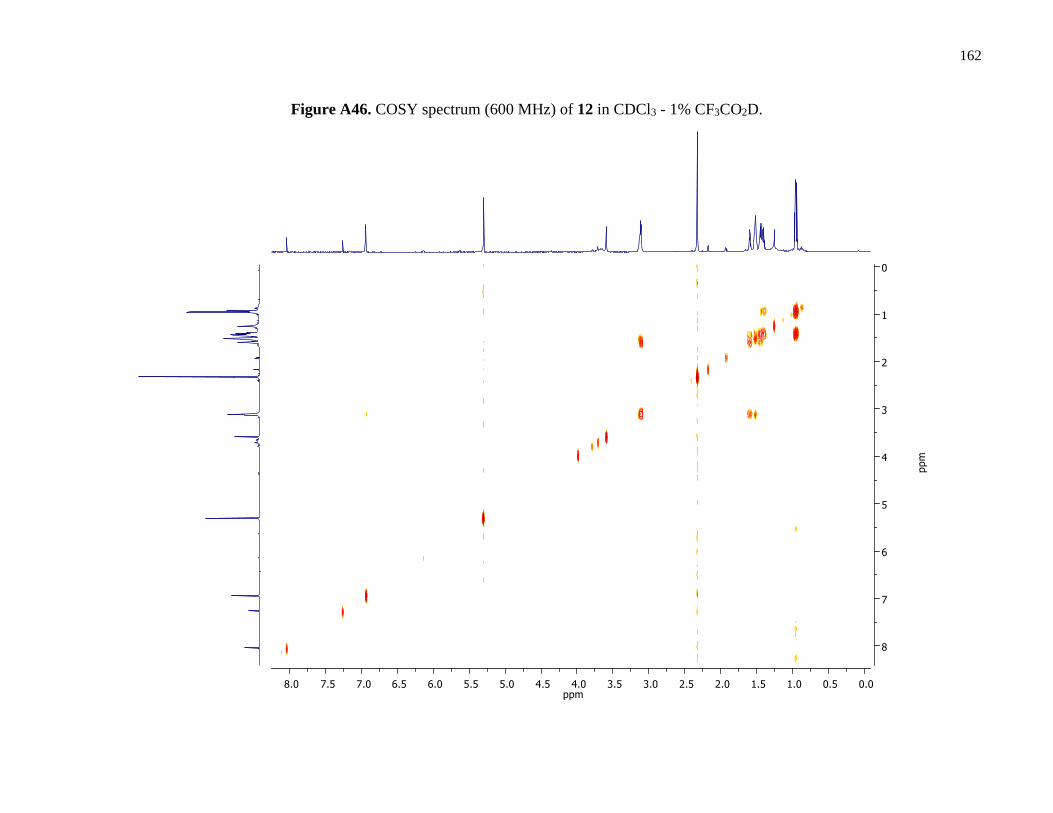
162
Figure A46. COSY spectrum (600 MHz) of 12 in CDCl3 - 1% CF3CO2D.
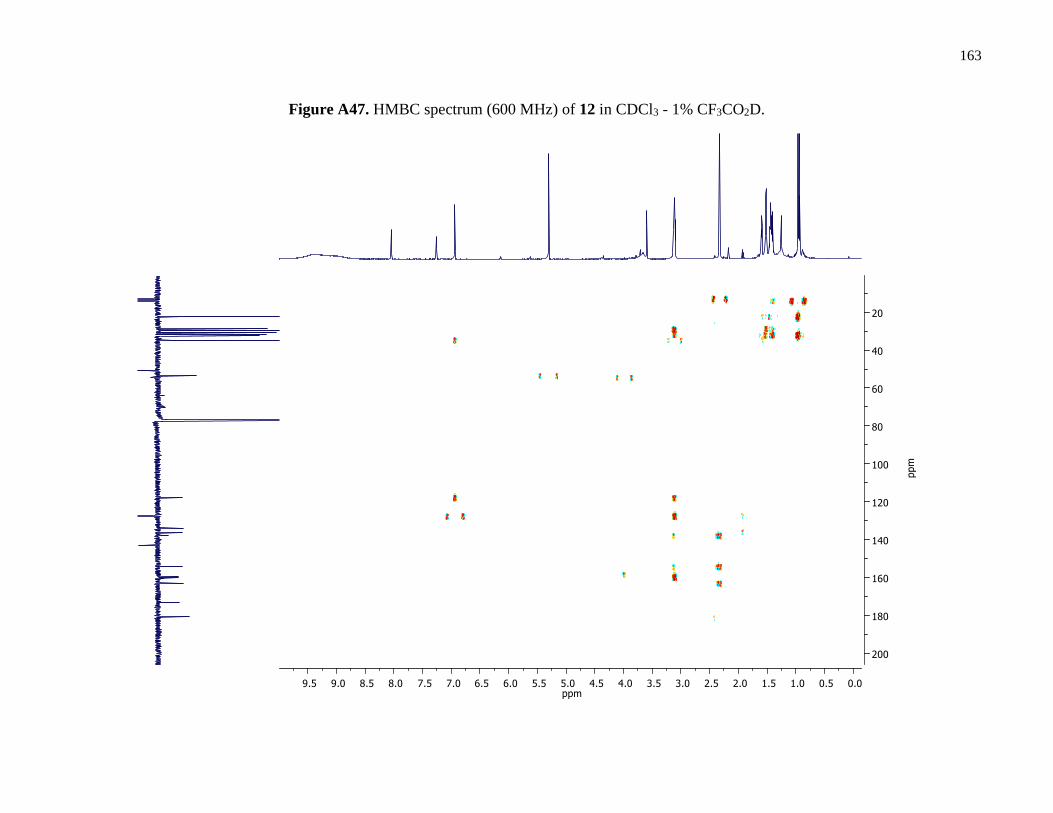
163
Figure A47. HMBC spectrum (600 MHz) of 12 in CDCl3 - 1% CF3CO2D.

164
Figure A48. Selective 1D-TOCSY spectrum (600 MHz) of H2-18 in 12 in CDCl3 - 1% CF3CO2D.

165
Figure A49. Selective 1D-TOCSY spectrum (600 MHz) of H2-13 and H2-14 in 12 in CDCl3 - 1% CF3CO2D.

166
Figure A50. Selective 1D-TOCSY spectrum (600 MHz) of H2-20 in 12 in CDCl3 - 1% CF3CO2D.

167
Figure A51. Expanded HR-ESI-IT-TOF mass spectra of 12.
[M+H]+
[2M + H]+
[2M + Na]+
[M + Na]+
[M-H]-

168
Figure A52. UV spectrum of 12 in ACN.

169
Table A5. 1H and partial 13C NMR data of 13 and 14 in CDCl3 - 1% CF3CO2D.
Position 13C a 1H mult. (J, Hz) b
2
3
4
4a
5
6 127.19 6.95 s and 6.98 s c
7
8a
9
9a
10
10a
11 12.77 2.34 s
12 32.65 3.12 t (7.9)
13 22.28 1.57 m
14 14.37 1.14 t (7.3)
15 34.50 3.13 t (7.5)
16 29.28 1.59 m
17 31.41 1.44 m
18 22.16 1.39 m
19 13.70 0.94 t (7.0)
20
21 a Resonances extracted from HSQC data; b 600 MHz; c Chemically inequivalent α-methine hydrogens of
DAQF and DAQG

170
Figure A53. 1H NMR spectrum (600 MHz) of 13 and 14 in CDCl3 - 1% CF3CO2D.

171
Figure A54. COSY spectrum (600 MHz) of 13 and 14 in CDCl3 - 1% CF3CO2D.
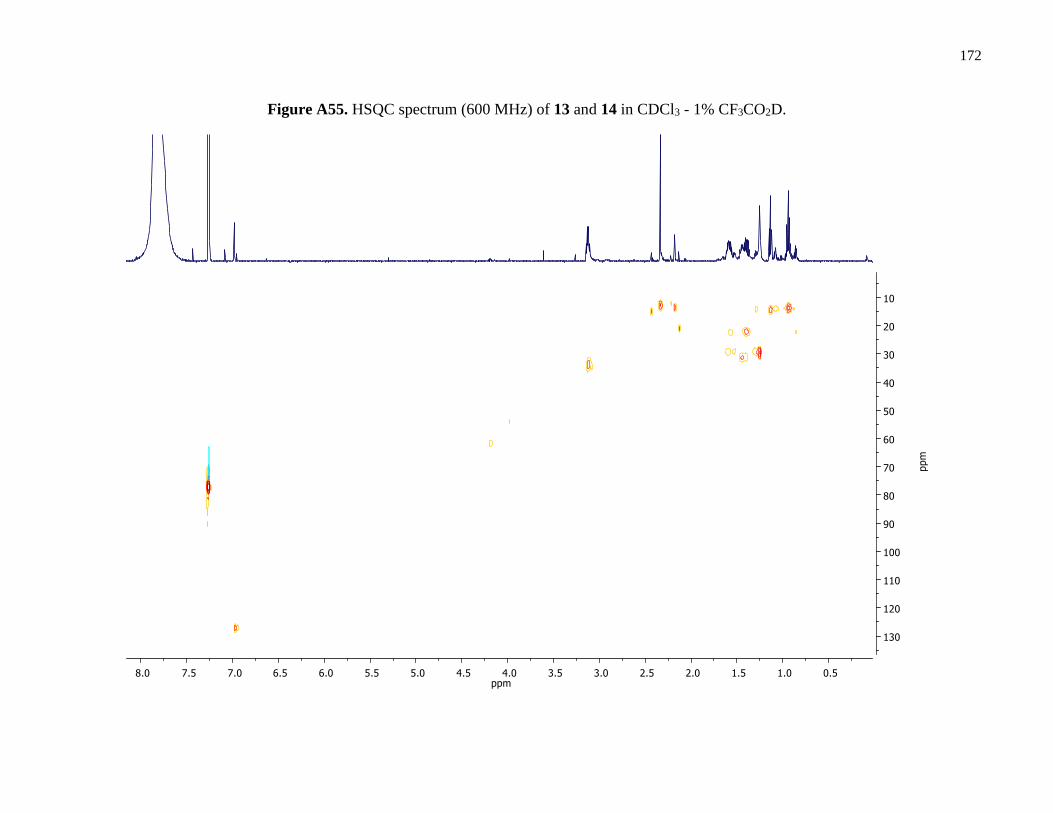
172
Figure A55. HSQC spectrum (600 MHz) of 13 and 14 in CDCl3 - 1% CF3CO2D.

173
Figure A56. HMBC spectrum (600 MHz) of 13 and 14 in CDCl3 - 1% CF3CO2D.
Inequivalency gives rise to two separate HMBC cross peaks (H6 to C10a in DAQF and DAQG).
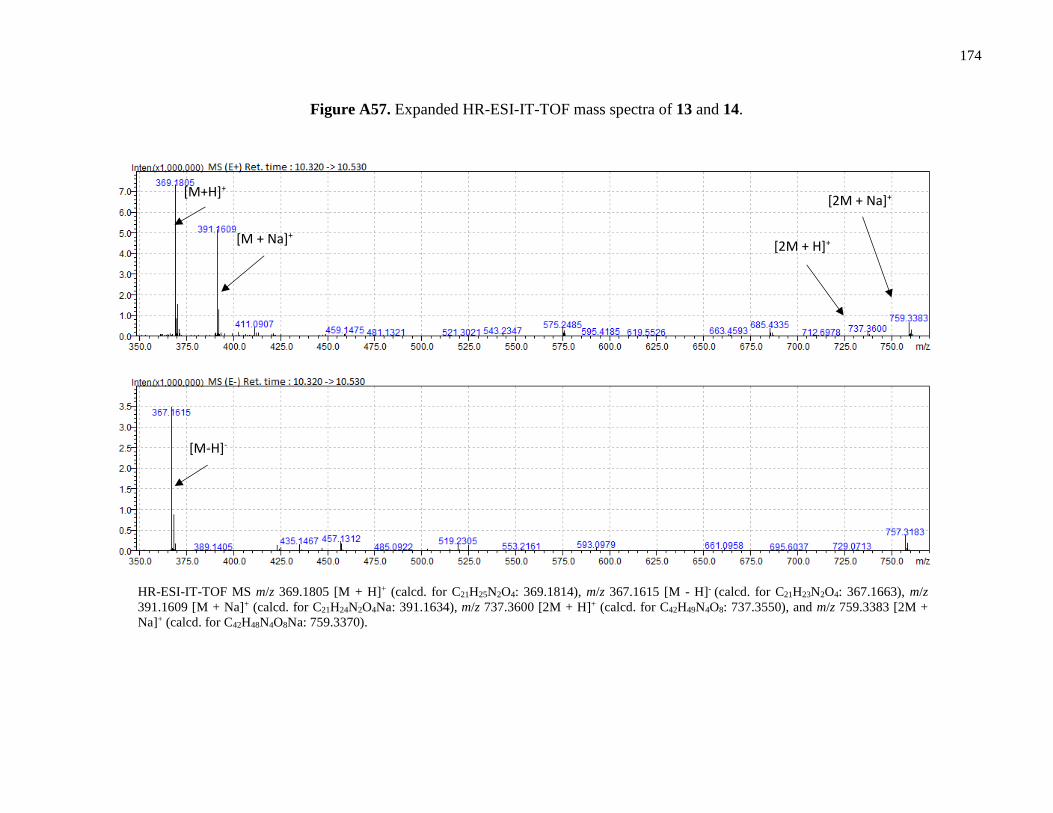
174
Figure A57. Expanded HR-ESI-IT-TOF mass spectra of 13 and 14.
HR-ESI-IT-TOF MS m/z 369.1805 [M + H]+ (calcd. for C21H25N2O4: 369.1814), m/z 367.1615 [M - H]- (calcd. for C21H23N2O4: 367.1663), m/z
391.1609 [M + Na]+ (calcd. for C21H24N2O4Na: 391.1634), m/z 737.3600 [2M + H]+ (calcd. for C42H49N4O8: 737.3550), and m/z 759.3383 [2M +
Na]+ (calcd. for C42H48N4O8Na: 759.3370).
[M+H]+
[2M + H]+
[2M + Na]+
[M + Na]+
[M-H]-
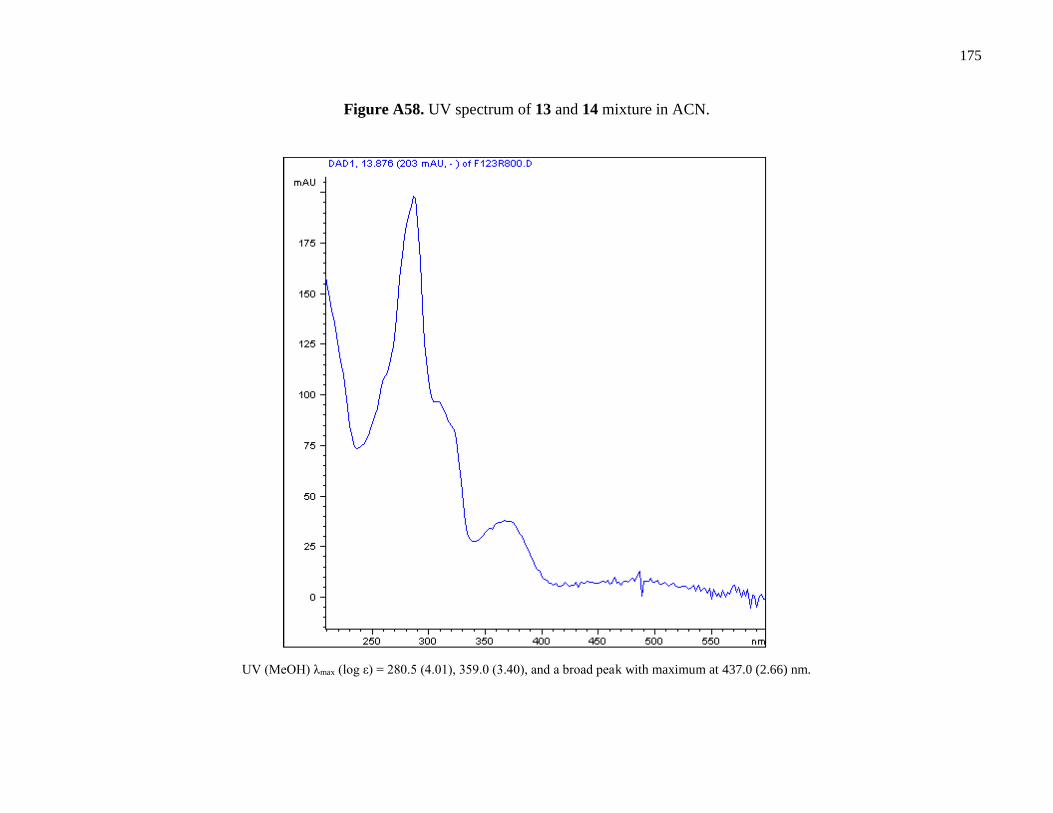
175
Figure A58. UV spectrum of 13 and 14 mixture in ACN.
UV (MeOH) λmax (log ε) = 280.5 (4.01), 359.0 (3.40), and a broad peak with maximum at 437.0 (2.66) nm.

176
Figure A59. Co-crystal structure of 13 and 14.
Structure numbered to emphasize DAQF occupancy in the co-crystal.

177
Figure A60. Deconvolution of co-crystal structure of 13 and 14.
The methyl group at C3 is favored [0.704(8) to 0.296(8)], with the estimated standard deviation cited in parentheses; the propyl
group at C4 is favored [0.566(9) to 0.434(9)]. Taken together, DAQF resides at the crystallographic site 52.6% to DAQG (47.4%).
As noted in the discussion, disordered water molecules are evident from the electron density maps. They occupy sites near the
methine hydrogen atom, or near the end of the propyl group.
If both disordered groups were equal, then they would each refine to 0.5.

178
A2.3 Reference spectra and figures for: A PIMARANE DITERPENE AND CYTOTOXIC ANGUCYCLINES FROM A MARINE-
DERIVED MICROMONOSPORA SP. IN VIETNAM’S EAST SEA.
Figure A61. 1H NMR spectrum (600 MHz) of 15 in CDCl3.

179
Figure A62. 13C DEPTQ spectrum (226.2 MHz) of 15 in CDCl3.

180
Figure A63. COSY spectrum (600 MHz) of 15 in CDCl3.
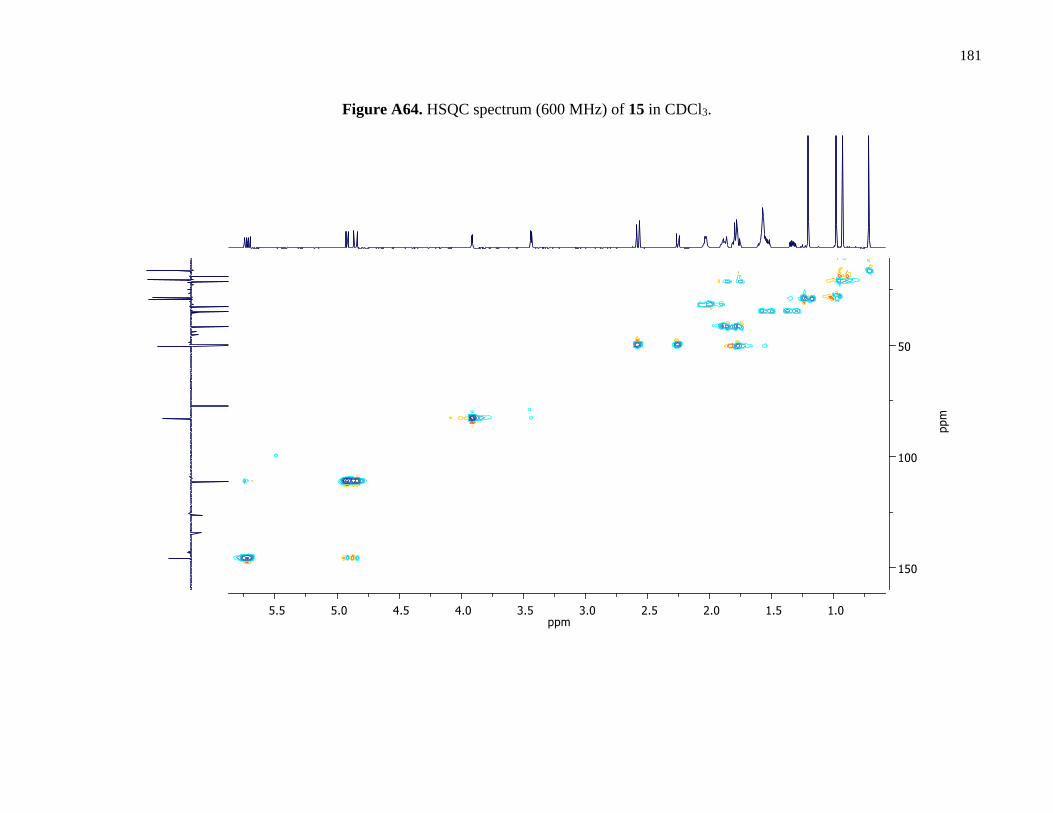
181
Figure A64. HSQC spectrum (600 MHz) of 15 in CDCl3.

182
Figure A65. HMBC spectrum (600 MHz) of 15 in CDCl3.

183
Table A6. 1H NMR data (600 MHz) of 15 in CDCl3 and C6D6.
Position 1H, mult. (J, Hz) in CDCl3 a 1H, mult. (J, Hz) in C6D6
a
1 ax 2.25, d (12.3) 1.76, d (12.3)
eq 2.58, d (12.3) 2.40, d (12.3)
2
3 3.91, d (4.0) 3.59, d (3.7)
3-OH 3.44, d (4.0) 3.66, d (3.7)
4
5 1.78, m 1.45, dd (2.0, 12.5)
6 1.58, m 1.31, m
1.80, m 1.50, m
7 2.03, m 1.76, m
8
9
10
11 ax 1.76, m 1.58, m
eq 1.88, m 1.77, m
12 eq 1.33, m 1.15, m
ax 1.53, m 1.38, m
13
14 1.76, m 1.60, m
1.88, m 1.77, m
15 5.72, dd (17.5, 10.7) 5.73, dd (17.5, 10.7)
16 4.85, dd (17.5, 1.4) 4.91, dd (17.5, 1.4)
4.92, dd (10.7, 1.4) 4.99, dd (10.7, 1.4)
17 0.98, s 0.98, s
18 0.93, s 0.81, s
19 1.21, s 1.13, s
20 0.72, s 0.72, s a s = singlet; d = doublet; dd = doublet of doublets; m = multiplet.
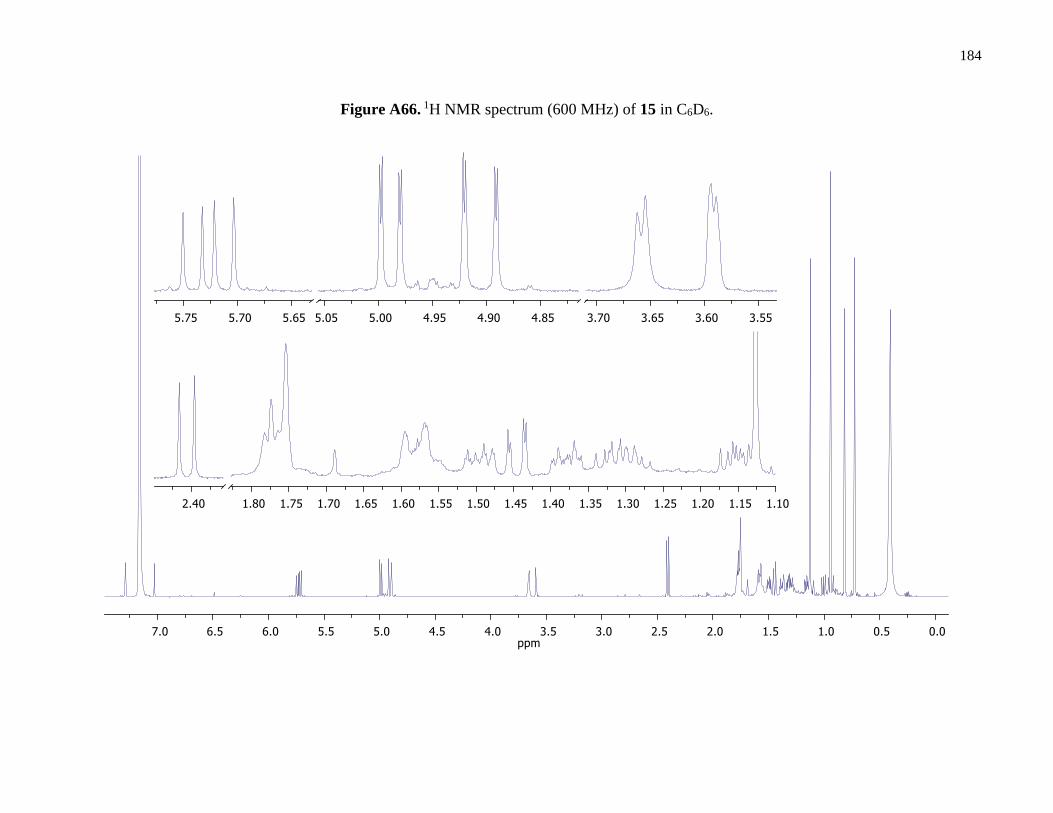
184
Figure A66. 1H NMR spectrum (600 MHz) of 15 in C6D6.

185
Figure A67. COSY spectrum (600 MHz) of 15 in C6D6.

186
Figure A68. HSQC spectrum (600 MHz) of 15 in C6D6.

187
Figure A69. HMBC spectrum (600 MHz) of 15 in C6D6.

188
Figure A70. 1D-TOCSY spectra (600 MHz) of 15 in C6D6.
(A) Expansion of 1H NMR spectrum (600 MHz) of 15; (B) Expansion of 1D-TOCSY spectrum of 15 (irradiation of δH 1.30); (C) Expansion of
1D-TOCSY spectrum of 15 (irradiation of δH 1.15).

189
Figure A71. Expanded HR-ESI-Q-TOF mass spectrum of 15.
HR-ESI-Q-TOF MS m/z 303.2338 [M + H]+ (calcd. for C20H31O2: 303.2319), and m/z 325.2141 [M + Na]+ (calcd. for C20H30O2Na: 325.2138).

190
Figure A72. UV spectrum of 15 in methanol.
UV (MeOH) λmax (log ε) = 204 (3.67) and shoulders at 228 (3.39) and 242 (3.30) nm.
0.00
0.20
0.40
0.60
0.80
1.00
1.20
1.40
1.60
200 250 300 350 400
Ab
sorb
ance
(m
AU
)
λ (nm)

191
Figure A73. CD spectrum of 15 in methanol.
CD (c = 0.0031, MeOH): λmax (Δε) = 225 (+65.2), 250 (-4.4), 290 (+54.4) nm.
350330310290270250230210
-20
-10
0
10
20
30
40
50
60
70
Δɛ
λ (nm)

192
Figure A74. 1H NMR spectrum (600 MHz) of 16 in CDCl3.
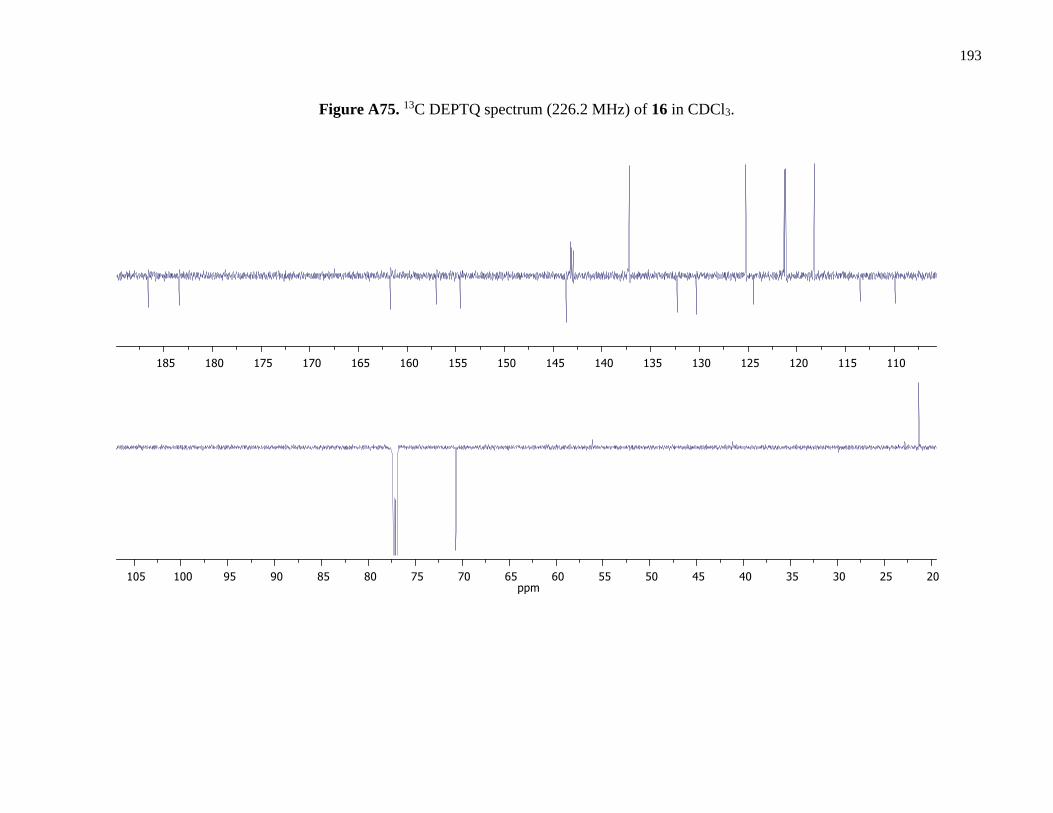
193
Figure A75. 13C DEPTQ spectrum (226.2 MHz) of 16 in CDCl3.

194
Figure A76. COSY spectrum (600 MHz) of 16 in CDCl3.

195
Figure A77. HSQC spectrum (600 MHz) of 16 in CDCl3.
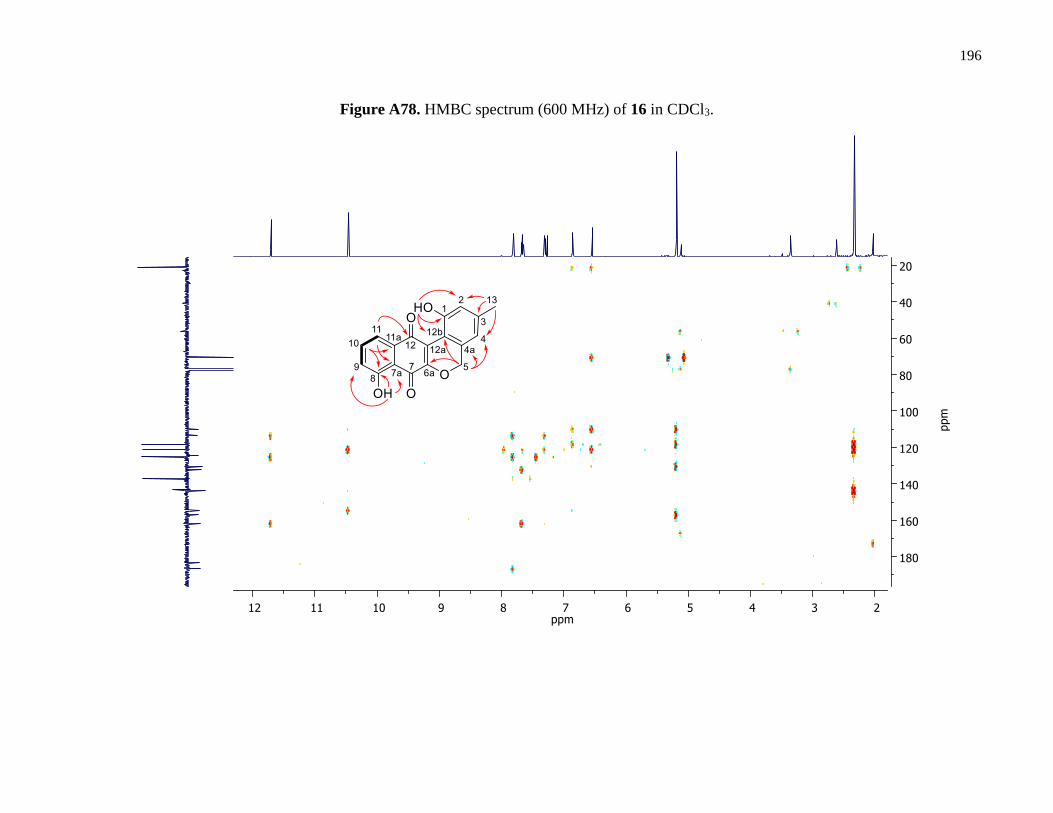
196
Figure A78. HMBC spectrum (600 MHz) of 16 in CDCl3.

197
Figure A79. Expanded HR-ESI-Q-TOF mass spectrum of 16.
HR-ESI-Q-TOF MS m/z 309.0773 [M + H]+ (calcd. for C18H13O5: 309.0757).
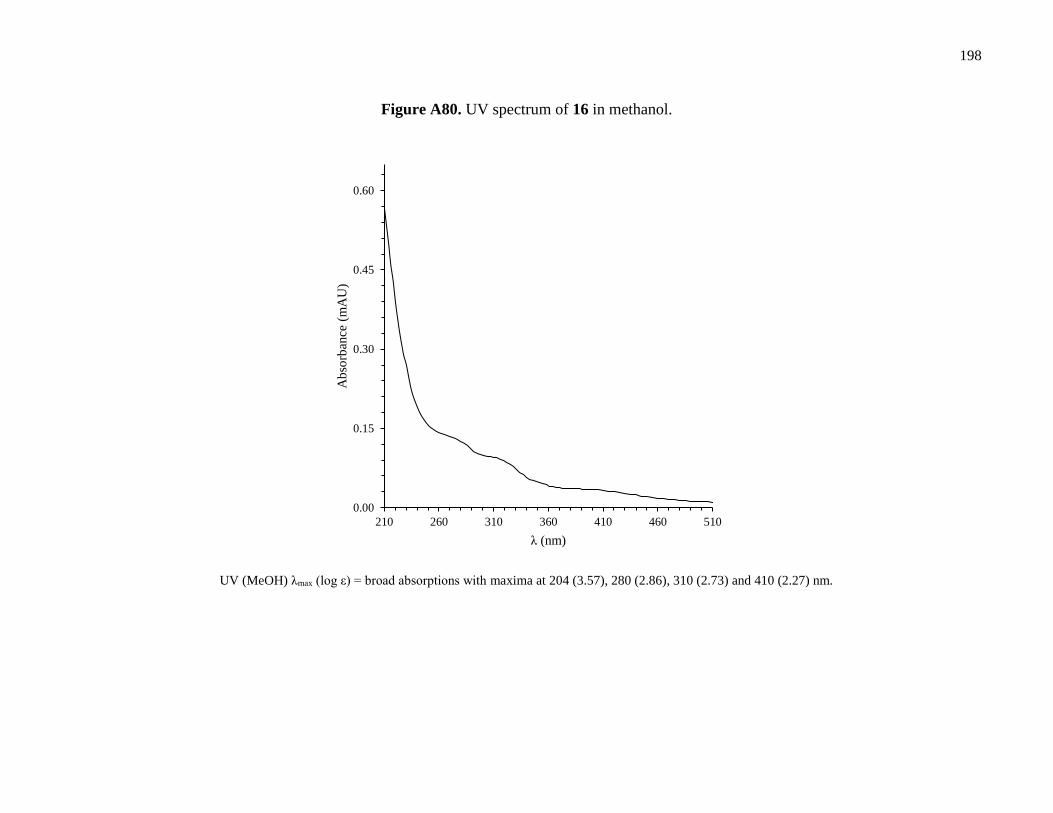
198
Figure A80. UV spectrum of 16 in methanol.
UV (MeOH) λmax (log ε) = broad absorptions with maxima at 204 (3.57), 280 (2.86), 310 (2.73) and 410 (2.27) nm.
0.00
0.15
0.30
0.45
0.60
210 260 310 360 410 460 510
Ab
sorb
ance
(m
AU
)
λ (nm)

199
Figure A81. 1H NMR spectrum (600 MHz) of dehydrorabelomycin (6-hydroxytetrangulol, 17)1-3 in CDCl3.

200
Figure A82. Expanded HR-ESI-Q-TOF mass spectrum of 17.
HR-ESI-Q-TOF MS m/z 321.0763 [M + H]+ (calcd. for C19H13O5: 321.0757).

201
Figure A83. 1H NMR spectrum (600 MHz) of phenanthroviridone (phenanthroviridin aglycone, 18)4, 5 in CDCl3.

202
Figure A84. Expanded HR-ESI-Q-TOF mass spectrum of 18.
HR-ESI-Q-TOF MS m/z 306.0794 [M + H]+ (calcd. for C18H12NO4: 306.0761).

203
Figure A85. 1H NMR spectrum (600 MHz) of WS-5995 A (19)6, 7 in CDCl3.
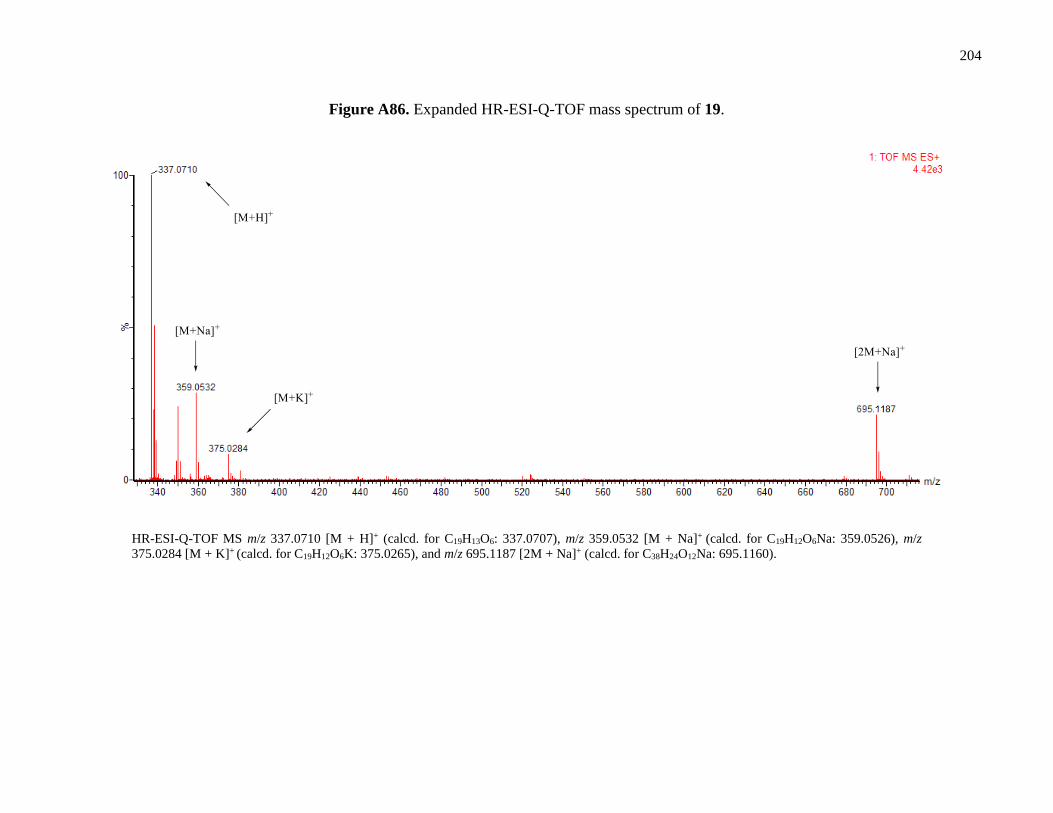
204
Figure A86. Expanded HR-ESI-Q-TOF mass spectrum of 19.
HR-ESI-Q-TOF MS m/z 337.0710 [M + H]+ (calcd. for C19H13O6: 337.0707), m/z 359.0532 [M + Na]+ (calcd. for C19H12O6Na: 359.0526), m/z
375.0284 [M + K]+ (calcd. for C19H12O6K: 375.0265), and m/z 695.1187 [2M + Na]+ (calcd. for C38H24O12Na: 695.1160).

205
A2.4 CITED LITERATURE
1. Yamashita, N.; Takashi, H.; Kazuo, S.; Haruo, S. 6-hydroxytetrangulol, a new CPP32 protease inducer produced by Streptomyces sp. J.
Antibiot. 1998, 1, 79-81.
2. Liu, W. C.; Parker, L.; Slusarchyk, S.; Greenwood, G. L.; Grahm, S. F.; Meyers, E. Isolation, characterization, and structure of
rabelomycin, a new antibiotic. J. Antibiot. 1970, 23, 437-441.
3. Yamashita, N. Manufacture of dehydrorabelomycin with Streptomyces species and use of the antibiotic agent as antitumor agent.
JP 10201494 A, Aug 4, 1998.
4. Fendrich, G.; Zimmermann, W.; Gruner, J.; Auden, J. A. L. Phenanthridine derivatives, process for the preparation thereof, and
compositions containing them. 1990.
5. Gore, M. P.; Gould, S. J.; Weller, D. D. Synthesis of putative intermediates in the biosynthesis of the kinamycin antibiotics: Total
synthesis of phenanthroviridin aglycon and related compounds. J. Org. Chem. 1992, 57, 2774-2783.
6. Ikushima, H.; Iguchi, E.; Kohsaka, M.; Aoki, H.; Imanaka, H. Streptomyces auranticolor sp. nov., a new anticoccidial antibiotics
producer. J. Antibiot. 1980, 33, 1103-1106.
7. Ikushima, H.; Okamoto, M.; Tanaka, H.; Ohe, O.; Kohsaka, M.; Aoki, H.; Imanaka, H. New anticoccidial antibiotics, WS-5995 A and
B: I. Isolation and characterization. J. Antibiot. 1980, 33, 1107-1113.

LICENSE TO USE PUBLISHED WORKS
Chapter 2:

207
Chapters 3 and 4:

208
VITAE
Michael W. Mullowney
Education
2012 – 2016 University of Illinois at Chicago, Chicago, IL
NIH/NCCIH T32 and AFPE Predoctoral Training Fellow and PhD Candidate in
Pharmacognosy, Department of Medicinal Chemistry and Pharmacognosy,
College of Pharmacy.
2009 – 2012 DePaul University, Chicago, IL
Post-baccalaureate studies in chemistry, biology, and calculus.
1998 – 2002 School of Art, Arizona State University, Tempe, AZ
BFA with honors in Intermedia, May, 2002.
1996 – 1998 Rio Salado Community College, Tempe, AZ
Studies in physics, Spanish, and pre-algebra.
1997 Universidad de Salamanca, Salamanca, Spain
Study abroad in Spanish language and culture.
Employment
2013 – 2016 Department of Medicinal Chemistry and Pharmacognosy, College of
Pharmacy, University of Illinois at Chicago, Chicago, IL
NIH and AFPE Graduate Research Fellow to Dr. Brian T. Murphy
2012 College of Pharmacy, University of Illinois at Chicago
Graduate Teaching Assistant
2011 – 2012 Freelance Organic and Biochemistry Chemistry Tutor
2011 – 2012 Kendall Hunt Publishing & Department of Chemistry, DePaul University
Graphic Artist / Online Textbook Developer
2011 – 2012 Department of Chemistry, DePaul University
Undergraduate Organic Chemistry Lab Teacher’s Assistant
2010 – 2012 Department of Chemistry, DePaul University
Research Assistant to Dr. Justin Maresh
Field Research Experience
2015 Two-week field collection trip to Iceland:
209
Collected and processed sediment and invertebrate samples in the
East fjords marine environment and inland freshwater systems by
free diving and SCUBA.
Collected marine sediment samples using PONAR from Icelandic
Coast Guard vessel Thor.
2015 One-day field collection trip in Whitehall, MI:
Organized and directed preparations.
Collected sediment by PONAR and free diving in White Lake and
Lake Michigan.
2014 Two-week field collection trip to Iceland:
Collected sediment and invertebrate samples in the Westfjords
marine environment and inland freshwater systems by SCUBA.
Collected marine sediment samples using PONAR from Icelandic
Coast Guard vessel Ægir.
2014 PADI Open Water Diver and Dry Suit Diver certified.
Awards and Honors
2015 International Association for Great Lakes Research (IAGLR) Scholarship
2015-2016 American Foundation for Pharmaceutical Research (AFPE) Predoctoral
Fellowship in Pharmaceutical Sciences
2014 W. E. van Doren Scholar, Department of Medicinal Chemistry and
Pharmacognosy, College of Pharmacy, University of Illinois at Chicago.
2013-2016 NIH NCCIH T32 Predoctoral Training Fellowship
Professional Societies
2015 – American Association for the Advancement of Science (AAAS)
2015 – International Association of Great Lakes Research (IAGLR)
2014 – American Society of Microbiology (ASM)
2013 – American Society of Pharmacognosy (ASP)
2010 – American Chemical Society (ACS)
Journalistic Publications
2015 Mullowney, M.W. Andersen Receives Farnsworth Award. The American Society
of Pharmacognosy Newsletter, 2015, 51 (3) 8-9.
210
2013 Mullowney, M.W. Õmura Honored: 2013 ASP Research Achievement
Award. The American Society of Pharmacognosy Newsletter, 2013, 49 (3) 5-6.
Peer-Reviewed Publications
2015 Mullowney, M.W.; Ó hAinmhire, E.; Tanouye, U.; Burdette, J.E.; Pham,
V.C.; Murphy, B.T. A Pimarane Diterpene and Cytotoxic Angucyclines
from a Marine-Derived Micromonospora sp. in Vietnam’s East Sea. Mar.
Drugs. 2015, 13, 5815-5827.
2015 Mullowney, M.W.; Newsome, A.; Wan, B.; Wei, X.; Tanouye, U.; Cho,
S. H.; Franzblau S.G.; Murphy, B.T. Diaza-anthracene antibiotics from a
freshwater-derived actinomycete that selectively inhibit M. tuberculosis.
ACS Infect. Dis. 2015, 1, 168–174. (NOTE: This article was featured
on the cover of the journal.)
2014 Mullowney, M.W.; Ó hAinmhire, E.; Shaikh, A.; Wei, X.; Tanouye, U.;
Santarsiero, B.D.; Burdette, J.E.; Murphy, B.T. Diazaquinomycins E–G,
novel diaza-anthracene analogs from a marine-derived Streptomyces sp.
Mar. Drugs. 2014, 12, 3574-3586.
2014 Maresh, J. J.; Crowe, S.O.; Ralko, A.; Aparece, M.D.; Murphy, C.M.;
Krzeszowiec, M.; Mullowney, M.W. Facile one-pot synthesis of
tetrahydroisoquinolines from amino acids via hypochlorite-mediated
decarboxylation and Pictet–Spengler condensation. Tetrahedron Lett.
2014, 55, 5047-5051.
Invited Presentations
2015 Mullowney, M.W.; Hwang, C.H.; Newsome, A.; Klein, L.; Shaikh, A.;
Tanouye, U.; Cho, S.; Franzblau, S.G.; Murphy, B.T. Natural Products
Drug Discovery: Inhibitors of drug-resistant M. tuberculosis from aquatic
actinomycetes. Invited research talk presented at the “Careers in Scientific
Research” event at DePaul University, Chicago, IL, May 15, 2015.
2014 Mullowney, M.W.; Hwang, C.H.; Newsome, A.; Klein, L.; Shaikh, A.;
Tanouye, U.; Cho, S.; Franzblau, S.G.; Murphy, B.T. Diaza-anthracene
antibiotics that inhibit drug-resistant Mycobacterium tuberculosis.
Invited research talk presented at the Baxter-UIC NMR Exchange
Meeting, Baxter Healthcare, Deerfield, IL, May 21, 2014.
Conference Presentations
2015 Mullowney, M.W.; Ó hAinmhire, E.; Tanouye, U.; Burdette, J.E.; Pham,
V.C.; Murphy, B.T. A novel pimarane diterpene and cytotoxic
angucyclines from a marine-derived Micromonospora sp. in Vietnam’s
East Sea. Poster presented at: The 47th annual conference of the American
Society of Pharmacognosy, Copper Mountain, CO, July 27, 2015.

211
2015 Mullowney, M.W., Ó hAinmhire, E.; Tanouye, U.; Wan B.; Cho S.;
Franzblau, S.G.; Burdette, J.E.; Pham, V.C.; Murphy, B.T. A novel
diterpene and cytotoxic molecules from a marine-derived actinomycete in
Vietnam. Poster presented at: The 53rd Annual MIKI Medicinal Chemistry
Meeting in Miniature, The University of Kansas, Lawrence, KS, April 11,
2015.
2014 Mullowney, M.W.; Hwang, C.H.; Newsome, A.; Krishnamoorthy, K.;
Roberts, D.; Klein, L.; Shaikh, A.; Tanouye, U.; Rathod, P.; Parish, T.;
Cho, S.; Franzblau, S.G.; and Murphy, B.T. Diaza-anthracene antibiotics
from marine and freshwater-derived actinomycete bacteria that inhibit
drug-resistant M. tuberculosis. Poster presented at: The 2014 David J.
Slatkin Symposium, Chicago State University, Chicago, IL, November
14, 2014.
2014 Mullowney, M.W.; Hwang, C.H.; Newsome, A.; Krishnamoorthy, K.;
Roberts, D.; Klein, L.; Shaikh, A.; Tanouye, U.; Rathod, P.; Parish, T.;
Cho, S.; Franzblau, S.G.; and Murphy, B.T. Diaza-anthracene antibiotics
from marine and freshwater-derived actinomycete bacteria that inhibit
drug-resistant M. tuberculosis. Poster presented at: The CMIDD 19th
Annual Drug Discovery Symposium, Northwestern University, Chicago,
IL, October 9, 2014.
2014 Mullowney, M.W.; Hwang, C.H.; Newsome, A.; Krishnamoorthy, K.;
Roberts, D.; Klein, L.; Shaikh, A.; Tanouye, U.; Rathod, P.; Parish, T.;
Cho, S.; Franzblau, S.G.; and Murphy, B.T. Diaza-anthracene antibiotics
from marine and freshwater-derived actinomycete bacteria that inhibit
drug-resistant M. tuberculosis. Poster presented at: The 52nd Annual MIKI
Medicinal Chemistry Meeting in Miniature, University of Illinois at
Chicago, Chicago, IL, April 12, 2014.
2014 Mullowney, M.W.; Hwang, C.H.; Newsome, A.; Krishnamoorthy, K.;
Roberts, D.; Klein, L.; Shaikh, A.; Tanouye, U.; Rathod, P.; Parish, T.;
Cho, S.; Franzblau, S.; and Murphy, B.T. Diaza-anthracene antibiotics
from marine and freshwater-derived actinomycete bacteria that inhibit
drug-resistant M. tuberculosis. Poster presented at: Marine Natural
Products Gordon Research Conference: From Discovery to Human
Health; Ventura, CA, March 5-6, 2014.
2014 Mullowney, M.W.; Hwang, C.H.; Newsome, A.; Krishnamoorthy, K.;
Roberts, D.; Klein, L.; Shaikh, A.; Tanouye, U.; Rathod, P.; Parish, T.;
Cho, S.; Franzblau, S.; and Murphy, B.T. Diaza-anthracene antibiotics
from marine and freshwater-derived actinomycete bacteria that inhibit
drug-resistant M. tuberculosis. Poster presented at: Marine Natural
Products Gordon-Merck Research Seminar: Making Waves in Medicine,
Ventura, CA, March 2, 2014.
212
2013 Shaikh, A.; Mullowney, M.W.; Ó hAinmhire, E.; Colunga-Hernandez, D.;
Burdette, J.; and Murphy. B.T. A new antimycin analog from a marine-
derived Streptomyces sp. Poster presented at: The 46th annual conference
of the American Society of Pharmacognosy, St. Louis, MO, July 14, 2013.
Scholarly Presentations
2016 Mullowney, M.W.; Boshoff, H.; Singh, V.; Barry, C.; Mizrahi, V.; Cho,
S.; Franzablau, S.G.; and Murphy, B.T. Progress toward identification of
the diazaquinomycin mechanism of action. Research talk presented at the
Specialized Metabolite Community, College of Pharmacy, University of
Illinois at Chicago, Chicago, IL, September 1, 2016.
2014 Mullowney, M.W.; Newsome, A.; Klein, L.; Wei, X.; Cho, S.; Franzablau,
S.G.; and Murphy, B.T. Antibiotics from aquatic-derived actinomycetes
that inhibit drug-resistant M. tuberculosis. Research talk presented at the
Center for Pharmaceutical Biotechnology, College of Pharmacy,
University of Illinois at Chicago, Chicago, IL, October 30, 2014.
2013 Mullowney, M.W.; Newsome, A.; Klein, L.; Santarsiero, B.; Wei, X.;
Cho, S.; and Murphy, B.T. Diaza-anthracene antibiotics that inhibit drug-
resistant Mycobacterium tuberculosis. Research talk presented at the
Center for Pharmaceutical Biotechnology, College of Pharmacy,
University of Illinois at Chicago, Chicago, IL, November 7, 2013.
2011 Mullowney, M.W.; and Maresh, J. Progress toward Cell-Assisted
Synthesis of Novel Alkaloids. Poster presented at: Chicago Area
Undergraduate Research Symposium (CAURS), Chicago, IL, April, 2011.
2010 Krzeszowiec, M.W.; Speltz, T.; Lumbreras, E.; Terranova, E.; Aparece,
M.; Mullowney, M.; and Maresh, J. Progress toward Cell-Assisted
Synthesis of Novel Alkaloids. Poster presented at: Mathematics and
Technology Showcase, DePaul University, Chicago, IL, November, 2010.
Editing and Review
2014 Linington, R.G.; Williams, P.G.; MacMillan, J.B. Problems in Organic
Structure Determination: A Practical Approach to NMR Spectroscopy;
Taylor & Francis, CRC Press: Boca Raton, FL, USA, 2015.
Technical Skills
Scientific Trained and proficient in NMR, HPLC, ELSD, GC, LC-MS, GC-MS,
small molecule molecular networking, synthetic chemistry, plant cell
culture, and microbiology.
Field PADI Open Water Diver and Dry Suit Diver certified; trained in sediment
and marine invertebrate collection.