antipsychotic relapse prevention for schizophrenia 2... · · 2013-05-02antipsychotic relapse...
TRANSCRIPT

Antipsychotic relapse prevention
for schizophrenia
Prof. Dr. med. Stefan Leucht Vice chairman
Department of Psychiatry and Psychotherapy
Disclosures
• Consulting/advisory board honoraria from Alkermes, Bristol-Myers Squibb, Eli Lilly, Janssen, Johnson & Johnson, MedAvante, Roche
• Lecture honoraria from AstraZeneca, Bristol-Myers Squibb, Eli Lilly, Essex Pharma, Janssen, Johnson & Johnson, Lundbeck Institute, Pfizer, Sanofi-Aventis
• Eli Lilly has provided medication for a trial with Stefan Leucht as the primary investigator

Leucht et al. Lancet 2012;37:2063–2071
• 65 included randomised controlled trials with 6493 patients
• Patients with schizophrenia, stabilized on antipsychotic drugs
• Published over long period, 1959–2011
• Any antipsychotic drug versus placebo (antipsychotics withdrawn)
• 63 DB, 2 open randomised controlled trials
Relapse at 7–12months
• Drug 27%
• Placebo 64%
Relapse prevention: any
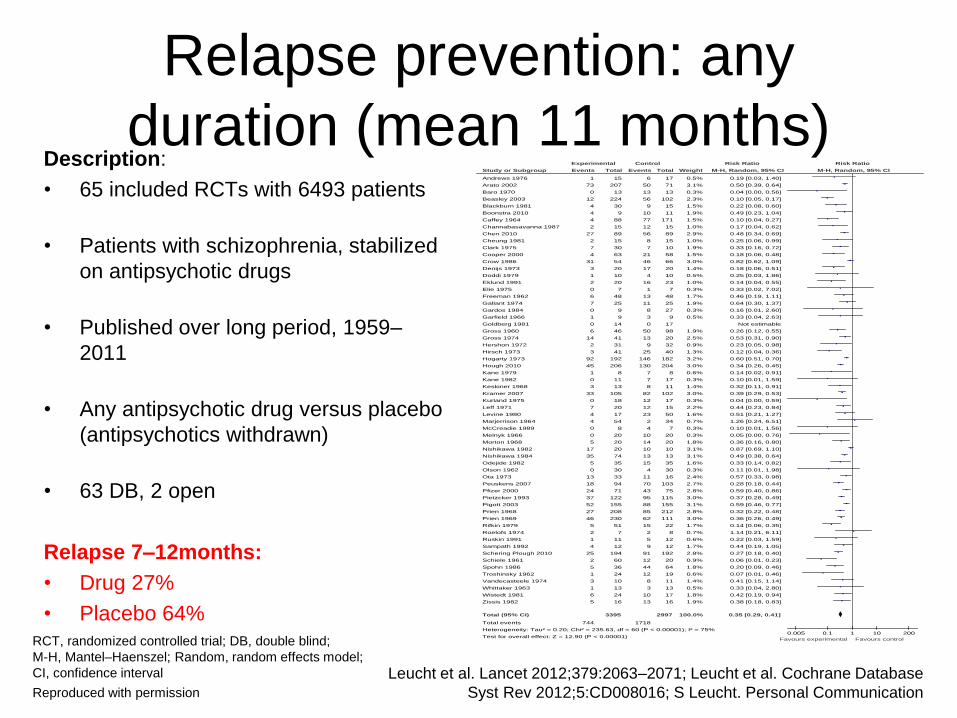
duration (mean 11 months) Description:
• 65 included RCTs with 6493 patients
• Patients with schizophrenia, stabilized
on antipsychotic drugs
• Published over long period, 1959–
2011
• Any antipsychotic drug versus placebo
(antipsychotics withdrawn)
• 63 DB, 2 open
Relapse 7–12months:
• Drug 27%
• Placebo 64%
Study or Subgroup
Andrews 1976
Arato 2002
Baro 1970
Beasley 2003
Blackburn 1981
Boonstra 2010
Caffey 1964
Channabasavanna 1987
Chen 2010
Cheung 1981
Clark 1975
Cooper 2000
Crow 1986
Denijs 1973
Doddi 1979
Eklund 1991
Elie 1975
Freeman 1962
Gallant 1974
Gardos 1984
Garfield 1966
Goldberg 1981
Gross 1960
Gross 1974
Hershon 1972
Hirsch 1973
Hogarty 1973
Hough 2010
Kane 1979
Kane 1982
Keskiner 1968
Kramer 2007
Kurland 1975
Leff 1971
Levine 1980
Marjerrison 1964
McCreadie 1989
Melnyk 1966
Morton 1968
Nishikawa 1982
Nishikawa 1984
Odejide 1982
Olson 1962
Ota 1973
Peuskens 2007
Pfizer 2000
Pietzcker 1993
Pigott 2003
Prien 1968
Prien 1969
Rifkin 1979
Roelofs 1974
Ruskin 1991
Sampath 1992
Schering Plough 2010
Schiele 1961
Spohn 1986
Troshinsky 1962
Vandecasteele 1974
Whittaker 1963
Wistedt 1981
Zissis 1982
Total (95% CI)
Total events
Heterogeneity: Tau² = 0.20; Chi² = 235.63, df = 60 (P < 0.00001); I² = 75%
Test for overall effect: Z = 12.90 (P < 0.00001)
Events
1
73
0
12
4
4
4
2
27
2
7
4
31
3
1
2
0
6
7
0
1
0
6
14
2
3
92
45
1
0
3
33
0
7
4
4
0
0
5
17
35
5
0
13
18
24
37
52
27
46
5
2
1
4
25
2
5
1
3
1
6
5
744
Total
15
207
13
224
30
9
88
15
89
15
30
63
54
20
10
20
7
48
25
9
9
14
46
41
31
41
192
206
8
11
13
105
18
20
17
54
8
20
20
20
74
35
30
33
94
71
122
155
208
230
51
7
11
12
194
60
36
24
10
13
24
16
3395
Events
6
50
13
56
9
10
77
12
56
8
7
21
46
17
4
16
1
13
11
8
3
0
50
13
9
25
146
130
7
7
8
82
12
12
23
2
4
10
14
10
13
15
4
11
70
43
95
88
85
62
15
2
5
9
91
12
44
12
8
3
10
13
1718
Total
17
71
13
102
15
11
171
15
89
15
10
58
66
20
10
23
7
48
25
27
9
17
98
20
32
40
182
204
8
17
11
102
17
15
50
34
7
20
20
10
13
35
30
16
103
75
115
155
212
111
22
8
12
12
192
20
64
19
11
13
17
16
2997
Weight
0.5%
3.1%
0.3%
2.3%
1.5%
1.9%
1.5%
1.0%
2.9%
1.0%
1.9%
1.5%
3.0%
1.4%
0.5%
1.0%
0.3%
1.7%
1.9%
0.3%
0.5%
1.9%
2.5%
0.9%
1.3%
3.2%
3.0%
0.6%
0.3%
1.4%
3.0%
0.3%
2.2%
1.6%
0.7%
0.3%
0.3%
1.8%
3.1%
3.1%
1.6%
0.3%
2.4%
2.7%
2.8%
3.0%
3.1%
2.8%
3.0%
1.7%
0.7%
0.6%
1.7%
2.8%
0.9%
1.8%
0.6%
1.4%
0.5%
1.8%
1.9%
100.0%
M-H, Random, 95% CI
0.19 [0.03, 1.40]
0.50 [0.39, 0.64]
0.04 [0.00, 0.56]
0.10 [0.05, 0.17]
0.22 [0.08, 0.60]
0.49 [0.23, 1.04]
0.10 [0.04, 0.27]
0.17 [0.04, 0.62]
0.48 [0.34, 0.69]
0.25 [0.06, 0.99]
0.33 [0.16, 0.72]
0.18 [0.06, 0.48]
0.82 [0.62, 1.09]
0.18 [0.06, 0.51]
0.25 [0.03, 1.86]
0.14 [0.04, 0.55]
0.33 [0.02, 7.02]
0.46 [0.19, 1.11]
0.64 [0.30, 1.37]
0.16 [0.01, 2.60]
0.33 [0.04, 2.63]
Not estimable
0.26 [0.12, 0.55]
0.53 [0.31, 0.90]
0.23 [0.05, 0.98]
0.12 [0.04, 0.36]
0.60 [0.51, 0.70]
0.34 [0.26, 0.45]
0.14 [0.02, 0.91]
0.10 [0.01, 1.59]
0.32 [0.11, 0.91]
0.39 [0.29, 0.53]
0.04 [0.00, 0.59]
0.44 [0.23, 0.84]
0.51 [0.21, 1.27]
1.26 [0.24, 6.51]
0.10 [0.01, 1.56]
0.05 [0.00, 0.76]
0.36 [0.16, 0.80]
0.87 [0.69, 1.10]
0.49 [0.38, 0.64]
0.33 [0.14, 0.82]
0.11 [0.01, 1.98]
0.57 [0.33, 0.98]
0.28 [0.18, 0.44]
0.59 [0.40, 0.86]
0.37 [0.28, 0.49]
0.59 [0.46, 0.77]
0.32 [0.22, 0.48]
0.36 [0.26, 0.49]
0.14 [0.06, 0.35]
1.14 [0.21, 6.11]
0.22 [0.03, 1.59]
0.44 [0.19, 1.05]
0.27 [0.18, 0.40]
0.06 [0.01, 0.23]
0.20 [0.09, 0.46]
0.07 [0.01, 0.46]
0.41 [0.15, 1.14]
0.33 [0.04, 2.80]
0.42 [0.19, 0.94]
0.38 [0.18, 0.83]
0.35 [0.29, 0.41]
Experimental Control Risk Ratio Risk Ratio
M-H, Random, 95% CI
0.005 0.1 1 10 200
Favours experimental Favours control
Leucht et al. Lancet 2012;379:2063–2071; Leucht et al. Cochrane Database
Syst Rev 2012;5:CD008016; S Leucht. Personal Communication
RCT, randomized controlled trial; DB, double blind;
M-H, Mantel–Haenszel; Random, random effects model;
CI, confidence interval
Reproduced with permission

Effect sizes of general medicine
and psychiatric drugs • Review of
– 94 meta-analyses of 48
general medicine drugs
– 33 meta-analyses of 16
psychiatric drugs
Leucht et al. Br J Psychiatry. 2012;200:97–106 Reproduced with permission

Open questions
• Is antipsychotic relapse prevention indicated in first-
episode patients?
• For how long should it be given?
• With which drug (second- or first generation)?
• What is the role of depot?
• What is the optimum dose?
• What about outcomes beyond relapse (e.g. quality
of life, employment)
• What about the risks – side-effects, mortality,
supersensitivity psychosis

First-episode vs multiple episode
patients (relapse 7–12 months)1–3
Rationale:
• Approximately 20% of first-episode patients will not have a second episode within 5 years4,5
• They are thought to have a better prognosis
Result:
• They benefit as much from maintenance treatment as multiple episode patients!
Problem:
• The 20% without a second episode cannot be identified in advance
Study or Subgroup
2.1.1 first episode
Boonstra 2010
Chen 2010
Crow 1986
Hogarty 1973
Kane 1982
McCreadie 1989
Pietzcker 1993
Rifkin 1979
Subtotal (95% CI)
Total events
Heterogeneity: Tau² = 0.00; Chi² = 5.85, df = 7 (P = 0.56); I² = 0%
Test for overall effect: Z = 6.72 (P < 0.00001)
2.1.2 not first episode
Andrews 1976
Arato 2002
Cheung 1981
Doddi 1979
Eklund 1991
Hirsch 1973
Hogarty 1973
Hough 2010
Kramer 2007
Leff 1971
Marjerrison 1964
Nishikawa 1982
Nishikawa 1984
Odejide 1982
Pfizer 2000
Pietzcker 1993
Rifkin 1979
Sampath 1992
Troshinsky 1962
Subtotal (95% CI)
Total events
Heterogeneity: Tau² = 0.14; Chi² = 69.45, df = 18 (P < 0.00001); I² = 74%
Test for overall effect: Z = 7.93 (P < 0.00001)
Test for subgroup differences: Chi² = 1.36, df = 1 (P = 0.24), I² = 26.5%
Events
2
27
20
10
0
0
7
1
67
1
73
2
1
2
3
52
45
33
7
4
16
35
5
24
13
4
4
1
325
Total
9
89
54
36
11
8
36
12
255
15
207
15
10
20
41
156
206
105
20
54
20
74
35
71
86
39
12
24
1210
Events
10
56
42
24
7
4
23
1
167
6
50
8
3
16
25
107
130
82
12
2
10
13
15
43
49
14
9
12
606
Total
11
89
66
39
17
7
40
4
273
17
71
15
10
23
40
143
204
102
15
34
10
13
35
75
75
18
12
19
931
Weight
3.2%
39.2%
31.7%
14.4%
0.6%
0.6%
9.5%
0.8%
100.0%
1.2%
9.2%
2.3%
1.1%
2.4%
3.1%
9.2%
8.9%
8.8%
5.7%
1.7%
9.1%
9.1%
4.1%
8.1%
6.7%
3.8%
4.3%
1.3%
100.0%
M-H, Random, 95% CI
0.24 [0.07, 0.84]
0.48 [0.34, 0.69]
0.58 [0.39, 0.86]
0.45 [0.25, 0.81]
0.10 [0.01, 1.59]
0.10 [0.01, 1.56]
0.34 [0.17, 0.69]
0.33 [0.03, 4.19]
0.47 [0.38, 0.58]
0.19 [0.03, 1.40]
0.50 [0.39, 0.64]
0.25 [0.06, 0.99]
0.33 [0.04, 2.69]
0.14 [0.04, 0.55]
0.12 [0.04, 0.36]
0.45 [0.35, 0.57]
0.34 [0.26, 0.45]
0.39 [0.29, 0.53]
0.44 [0.23, 0.84]
1.26 [0.24, 6.51]
0.82 [0.64, 1.07]
0.49 [0.38, 0.64]
0.33 [0.14, 0.82]
0.59 [0.40, 0.86]
0.23 [0.14, 0.39]
0.13 [0.05, 0.34]
0.44 [0.19, 1.05]
0.07 [0.01, 0.46]
0.39 [0.31, 0.49]
Favours experimental Control Risk Ratio Risk Ratio
M-H, Random, 95% CI
0.01 0.1 1 10 100
Favours experimental Favours control
1. Leucht et al. Lancet 2012;379:2063–2071; 2. Leucht et al. Cochrane Database Syst Rev 2012;5:CD008016;
3. S Leucht. Personal Communication Reproduced with permission
M-H, Mantel–Haenszel; Random, random effects model;
CI, confidence interval Subgroup comparison p-value = 0.24

Remitted versus symptomatic
patients (relapse 7–12 months)1–3
Rationale:
• Previous reviews lumped symptomatic and remitted patients together,4,5 even including inpatients5
• Nowadays nobody would withdraw medication from symptomatic patients
• Remitted patients may have a better prognosis
Subgroup 2.2.1 in remission
Boonstra 2010 Chen 2010 Cheung 1981 Kane 1982 Nishikawa 1982 Nishikawa 1984 Odejide 1982 Rifkin 1979 Subtotal (95% CI)
Total events Heterogeneity: Tau² = 0.28; Chi² = 38.22, df = 7 (P < 0.00001); I² = 82% Test for overall effect: Z = 4.00 (P < 0.0001)
2.2.2 not in remission
Andrews 1976 Arato 2002 Crow 1986 Doddi 1979 Eklund 1991 Hirsch 1973 Hogarty 1973 Hough 2010 Kramer 2007 Leff 1971 Marjerrison 1964 McCreadie 1989 Pfizer 2000 Pietzcker 1993 Sampath 1992 Troshinsky 1962 Subtotal (95% CI)
Total events Heterogeneity: Tau² = 0.06; Chi² = 31.53, df = 15 (P = 0.007); I² = 52% Test for overall effect: Z = 9.21 (P < 0.00001)
Test for subgroup differences: Chi² = 0.03, df = 1 (P = 0.87), I² = 0%
Events
2 27 2 0
16 35 5 5
92
1 73 20 1 2 3
62 45 33 7 4 0
24 20 4 1
300
Total
9 89 15 11 20 74 35 51
304
15 207 54 10 20 41
192 206 105 20 54 8
71 122 12 24
1161
Events
10 56 8 7
10 13 15 15
134
6 50 42 3
16 25
131 130 82 12 2 4
43 72 9
12
639
Total
11 89 15 17 10 13 35 22
212
17 71 66 10 23 40
182 204 102 15 34 7
75 115 12 19
992
Weight
8.5% 18.6% 7.5% 2.5%
19.6% 19.5% 11.8% 12.0%
100.0%
0.9% 13.5% 10.0% 0.8% 1.9% 2.6%
13.8% 12.5% 12.1% 5.9% 1.3% 0.5%
10.3% 9.3% 3.9% 0.9%
100.0%
M-H, Random, 95% CI
0.24 [0.07, 0.84] 0.48 [0.34, 0.69] 0.25 [0.06, 0.99] 0.10 [0.01, 1.59] 0.82 [0.64, 1.07] 0.49 [0.38, 0.64] 0.33 [0.14, 0.82] 0.14 [0.06, 0.35] 0.38 [0.24, 0.61]
0.19 [0.03, 1.40] 0.50 [0.39, 0.64] 0.58 [0.39, 0.86] 0.33 [0.04, 2.69] 0.14 [0.04, 0.55] 0.12 [0.04, 0.36] 0.45 [0.36, 0.56] 0.34 [0.26, 0.45] 0.39 [0.29, 0.53] 0.44 [0.23, 0.84] 1.26 [0.24, 6.51] 0.10 [0.01, 1.56] 0.59 [0.40, 0.86] 0.26 [0.17, 0.40] 0.44 [0.19, 1.05] 0.07 [0.01, 0.46] 0.40 [0.33, 0.49]
Experimental Control Risk Ratio Risk Ratio M-H, Random, 95% CI
0.01 0.1 1 10 100 Favours experimental Favours control
1. Leucht et al. Lancet 2012;379:2063–2071; 2. Leucht et al. Cochrane Database Syst Rev 2012;5:CD008016;
3. S Leucht. Personal Communication; 4. Gilbert et al. Arch Gen Psychiatry 1995;52:173–188; 5. Davis Am J
Psych 1975;132:1237–1245
Reproduced with permission
M-H, Mantel–Haenszel; Random, random effects model;
CI, confidence interval Subgroup comparison p-value = 0.87

Study or Subgroup
2.7.1 First-generation antipsychotic drugs
Andrews 1976
Cheung 1981
Crow 1986
Doddi 1979
Eklund 1991
Hirsch 1973
Hogarty 1973
Kane 1982
Leff 1971
Marjerrison 1964
McCreadie 1989
Nishikawa 1982
Nishikawa 1984
Odejide 1982
Pietzcker 1993
Rifkin 1979
Sampath 1992
Troshinsky 1962Subtotal (95% CI)
Total events
Heterogeneity: Tau² = 0.24; Chi² = 71.24, df = 17 (P < 0.00001); I² = 76%
Test for overall effect: Z = 6.37 (P < 0.00001)
2.7.2 Second-generation antipsychotic drugsQuetiapine
Arato 2002
Boonstra 2010
Chen 2010
Hough 2010
Kramer 2007
Pfizer 2000Subtotal (95% CI)
Total events
Heterogeneity: Tau² = 0.02; Chi² = 8.48, df = 5 (P = 0.13); I² = 41%
Test for overall effect: Z = 8.79 (P < 0.00001)
Test for subgroup differences: Chi² = 1.44, df = 1 (P = 0.23), I² = 30.4%
Events
1
2
20
1
2
3
62
0
7
4
0
16
35
5
20
5
4
1
188
73
2
27
45
33
24
204
Total
15
15
54
10
20
41
192
11
20
54
8
20
74
35
122
51
12
24778
207
9
89
206
105
71687
Events
6
8
42
3
16
25
131
7
12
2
4
10
13
15
72
15
9
12
402
50
10
56
130
82
43
371
Total
17
15
66
10
23
40
182
17
15
34
7
10
13
35
115
22
12
19652
71
11
89
204
102
75552
Weight
2.1%
3.7%
9.6%
2.0%
3.8%
4.8%
10.6%
1.2%
7.7%
2.9%
1.2%
10.4%
10.4%
6.0%
9.3%
6.1%
6.2%
2.2%100.0%
24.8%
2.1%
16.5%
21.5%
20.0%
15.0%100.0%
M-H, Random, 95% CI
0.19 [0.03, 1.40]
0.25 [0.06, 0.99]
0.58 [0.39, 0.86]
0.33 [0.04, 2.69]
0.14 [0.04, 0.55]
0.12 [0.04, 0.36]
0.45 [0.36, 0.56]
0.10 [0.01, 1.59]
0.44 [0.23, 0.84]
1.26 [0.24, 6.51]
0.10 [0.01, 1.56]
0.82 [0.64, 1.07]
0.49 [0.38, 0.64]
0.33 [0.14, 0.82]
0.26 [0.17, 0.40]
0.14 [0.06, 0.35]
0.44 [0.19, 1.05]
0.07 [0.01, 0.46]0.35 [0.25, 0.48]
0.50 [0.39, 0.64]
0.24 [0.07, 0.84]
0.48 [0.34, 0.69]
0.34 [0.26, 0.45]
0.39 [0.29, 0.53]
0.59 [0.40, 0.86]0.44 [0.37, 0.53]
Experimental Control Risk Ratio Risk Ratio
M-H, Random, 95% CI
0.01 0.1 1 10 100Favours experimental Favours control
Leucht et al. Lancet 2012;379:2063–2071; Leucht et al. Cochrane Database
Syst Rev 2012;5:CD008016; S Leucht. Personal communication
First- vs second-generation
antipsychotics (relapse 7–12 months) Rationale:
• Second-generation
antpsychotics are thought to
be superior (better
compliance, better efficacy)
Result:
• No difference between
second-and first-generation
antpsychotics compared to
placebo
Problem:
• Indirect comparison, there are
many possible confounders
Only head-to-head
comparisons can tell whether
there are differences
FGA, first-generation antipsychotic; SGA, second-generation
antipsychotic; M-H, Mantel–Haenszel; Random, random
effects model; CI, confidence interval
Reproduced with permission Subgroup comparison p-value = 0.23
Kishimoto et al. Mol Psychiatry 2011;[Epub ahead of print]
Reproduced with permission

Results: relapse (estimated,
longest time point) (1)
Kishimoto et al. Mol Psychiatry 2011;[Epub ahead of print]
SGA, second-generation antipsychotic; FGA, first-generation
antipsychotic; M-H, Mantel–Haenszel; Random, random effects model;
CI, confidence interval
Reproduced with permission

Results: relapse (estimated,
longest time point) (2)
Kishimoto et al. Mol Psychiatry 2011;[Epub ahead of print]
CI, confidence interval
Reproduced with permission

Results: relapse (estimated,
longest time point) (3)
• N=19, n= 4206
• Relapse Rate: SGA 29.0%, FGA 37.5%
• Relative Risk =0.80, CI 0.70-0.91
• NNT=17, CI 10-50, p=.003
SGA, second-generation antipsychotic; FGA, first-generation antipsychotic;
CI, confidence interval, NNT, number needed to treat
Kishimoto et al. Mol Psychiatry 2011;[Epub ahead of print] Reproduced with permission

Depot vs oral medication
(relapse 7–12 months)1–3
Rationale:
• Depot drugs are thought to be
superior in relapse prevention
due to improved adherence
Result:
• Compared to placebo depot
drugs reduced relapse
significantly more than oral
medication
Problem:
• Indirect comparison, there are
many possible confounds
• Only head-to-head
comparisons can tell whether
depots are better
Study or Subgroup
2.6.1 depot
Doddi 1979
Eklund 1991
Hirsch 1973
Hough 2010
McCreadie 1989
Odejide 1982
Sampath 1992Subtotal (95% CI)
Total events
Heterogeneity: Tau² = 0.01; Chi² = 6.31, df = 6 (P = 0.39); I² = 5%
Test for overall effect: Z = 8.06 (P < 0.00001)
2.6.2 oral
Andrews 1976
Arato 2002
Boonstra 2010
Chen 2010
Cheung 1981
Hogarty 1973
Kramer 2007
Leff 1971
Marjerrison 1964
Nishikawa 1982
Nishikawa 1984
Pfizer 2000
Pietzcker 1993
Troshinsky 1962Subtotal (95% CI)
Total events
Heterogeneity: Tau² = 0.09; Chi² = 42.46, df = 13 (P < 0.0001); I² = 69%
Test for overall effect: Z = 7.20 (P < 0.00001)
Test for subgroup differences: Chi² = 4.52, df = 1 (P = 0.03), I² = 77.9%
Events
1
2
3
45
0
5
4
60
1
73
2
27
2
62
33
7
4
16
35
24
20
1
307
Total
10
20
41
206
8
35
12332
15
207
9
89
15
192
105
20
54
20
74
71
122
241017
Events
3
16
25
130
4
15
9
202
6
50
10
56
8
131
82
12
2
10
13
43
72
12
507
Total
10
23
40
204
7
35
12331
17
71
11
89
15
182
102
15
34
10
13
75
115
19768
Weight
1.8%
4.4%
6.2%
66.9%
1.0%
9.5%
10.2%100.0%
1.0%
11.7%
2.4%
10.0%
2.0%
11.9%
10.8%
6.0%
1.5%
11.5%
11.4%
9.6%
8.9%
1.1%100.0%
M-H, Random, 95% CI
0.33 [0.04, 2.69]
0.14 [0.04, 0.55]
0.12 [0.04, 0.36]
0.34 [0.26, 0.45]
0.10 [0.01, 1.56]
0.33 [0.14, 0.82]
0.44 [0.19, 1.05]0.31 [0.23, 0.41]
0.19 [0.03, 1.40]
0.50 [0.39, 0.64]
0.24 [0.07, 0.84]
0.48 [0.34, 0.69]
0.25 [0.06, 0.99]
0.45 [0.36, 0.56]
0.39 [0.29, 0.53]
0.44 [0.23, 0.84]
1.26 [0.24, 6.51]
0.82 [0.64, 1.07]
0.49 [0.38, 0.64]
0.59 [0.40, 0.86]
0.26 [0.17, 0.40]
0.07 [0.01, 0.46]0.46 [0.37, 0.57]
Experimental Control Risk Ratio Risk Ratio
M-H, Random, 95% CI
0.01 0.1 1 10 100Favours experimental Favours control
Studies that allowed both depot and oral medication4–6 were excluded from this analysis
MH, Mantel–Haenszel; Random, random effects model; CI, confidence interval 1. Leucht et al. Lancet 2012;379:2063–2071; 2. Leucht et al. Cochrane Database Syst Rev
2012;5:CD008016; 3. S Leucht. Personal Communication; 4. Crow et al. Br J Psych 1986;148:120–127;
5. Kane et al. Arch Gen Psych 1982;39:70–73; 6. Rifkin et al. Biol Psych 1979;14:499–508
Reproduced with permission
Subgroup comparison p-value = 0.03

Study or Subgroup
1.7.1 Relapse (estimated rate preferred, longest time point) - Fluphenazine depot
Barnes 1983
Crawdford 1974
Del Guidice 1975
Falloon 1978
Hogarty 1979
Kaneno 1991
Rifkin 1977
Schooler 1980
Subtotal (95% CI)
Total events
Heterogeneity: Tau² = 0.02; Chi² = 9.06, df = 7 (P = 0.25); I² = 23%
Test for overall effect: Z = 2.33 (P = 0.02)
1.7.2 Relapse (estimated rate preferred, longest time point) - Haloperidol depot
Glick 2005
Subtotal (95% CI)
Total events
Heterogeneity: Not applicable
Test for overall effect: Z = 0.03 (P = 0.97)
1.7.3 Relapse (estimated rate preferred, longest time point) - Olanzapine LAI
Detke 2011
Kane 2010
Subtotal (95% CI)
Total events
Heterogeneity: Tau² = 0.03; Chi² = 1.77, df = 1 (P = 0.18); I² = 44%
Test for overall effect: Z = 0.45 (P = 0.65)
1.7.4 Relapse (estimated rate preferred, longest time point) - Risperidone LAI
Bai 2007
Gaebel 2010
Kamijima 2009
Keks 2007
MacFadden 2010
NCT00246259
Potapov 2008
Rosenheck 2011
Schooler 2011
Subtotal (95% CI)
Total events
Heterogeneity: Tau² = 0.10; Chi² = 31.71, df = 8 (P = 0.0001); I² = 75%
Test for overall effect: Z = 0.16 (P = 0.87)
1.7.5 Relapse (estimated rate preferred, longest time point) - Zuclopenthixol depot
Arango 2006
Subtotal (95% CI)
Total events
Heterogeneity: Not applicable
Test for overall effect: Z = 0.59 (P = 0.56)
Total (95% CI)
Total events
Heterogeneity: Tau² = 0.05; Chi² = 48.15, df = 20 (P = 0.0004); I² = 58%
Test for overall effect: Z = 0.94 (P = 0.35)
Test for subgroup differences: Chi² = 3.96, df = 4 (P = 0.41), I² = 0%
Events
3
2
21
8
22
8
2
54
120
5
5
102
58
160
2
65
18
25
90
11
4
86
75
376
10
10
671
Total
19
14
27
20
55
127
23
107
392
9
9
264
599
863
23
327
147
247
177
32
20
187
146
1306
26
26
2596
Events
3
6
59
5
36
9
3
61
182
9
9
104
23
127
0
122
5
27
82
5
8
90
62
401
6
6
725
Total
17
15
61
24
50
132
28
107
434
16
16
260
322
582
25
326
51
300
172
31
20
182
150
1257
20
20
2309
Weight
1.0%
1.0%
9.5%
2.1%
6.8%
2.2%
0.7%
8.8%
32.1%
3.1%
3.1%
9.4%
5.5%
14.9%
0.2%
8.6%
2.1%
4.9%
9.4%
2.1%
1.8%
9.4%
8.8%
47.4%
2.6%
2.6%
100.0%
M-H, Random, 95% CI
0.89 [0.21, 3.85]
0.36 [0.09, 1.48]
0.80 [0.65, 0.99]
1.92 [0.74, 4.95]
0.56 [0.38, 0.80]
0.92 [0.37, 2.32]
0.81 [0.15, 4.45]
0.89 [0.69, 1.14]
0.79 [0.65, 0.96]
0.99 [0.48, 2.04]
0.99 [0.48, 2.04]
0.97 [0.78, 1.19]
1.36 [0.85, 2.16]
1.08 [0.78, 1.47]
5.42 [0.27, 107.20]
0.53 [0.41, 0.69]
1.25 [0.49, 3.19]
1.12 [0.67, 1.89]
1.07 [0.86, 1.32]
2.13 [0.84, 5.43]
0.50 [0.18, 1.40]
0.93 [0.75, 1.15]
1.24 [0.97, 1.59]
0.98 [0.74, 1.28]
1.28 [0.56, 2.93]
1.28 [0.56, 2.93]
0.93 [0.80, 1.08]
LAI OAP Risk Ratio Risk Ratio
M-H, Random, 95% CI
0.05 0.2 1 5 20
Favours LAI Favours OAP
Kishimoto et al. submitted
New results alter the balance between depot
and oral medication in relapse prevention
LAI, long-acting injectable; OAP, oral antipsychotic; M-H, Mantel–Haenszel;
Random, random effects model; CI, confidence interval
Reproduced with permission

Risk of rehospitalization:
population-based first-episode data
Tiihonen et al. BMJ 2006;333:224–229
Reproduced with permission
Relative risk of rehospitalization by treatment. Adjusted for sex, calendar year, age at onset of follow-up, number of previous relapses, duration of
first hospitalization, and length of follow-up by a multivariate regression model alone (adjusted column) and by multivariate regression and the
propensity score method (fully adjusted column) CI, confidence interval
Number
of
relapses
Person
years
Incidence Crude relative risk
(95% CI)
Adjusted relative
risk (95% CI)
Fully adjusted
relative risk
(95% CI)
Perphenazine depot 53 187 0.28 0.41 (0.29 to 0.59) 0.45 (0.32 to 0.65) 0.32 (0.22 to 0.49)
Olanzapine 329 822 0.40 0.59 (0.45 to 0.75) 0.55 (0.43 to 0.72) 0.54 (0.41 to 0.71)
Clozapine 336 804 0.42 0.61 (0.47 to 0.79) 0.53 (0.41 to 0.69) 0.64 (0.48 to 0.85)
Chlorprothixene 79 146 0.54 0.79 (0.58 to 1.09) 0.83 (0.61 to 1.15) 0.64 (0.45 to 0.91)
Thioridazine 115 201 0.57 0.84 (0.63 to 1.12) 0.82 (0.61 to 1.10) 0.70 (0.51 to 0.96)
Perphenazine oral 155 327 0.47 0.69 (0.58 to 0.82) 0.78 (0.59 to 1.03) 0.85 (0.63 to 1.13)
Risperidone 343 651 0.53 0.77 (0.60 to 0.99) 0.80 (0.62 to 1.03) 0.89 (0.69 to 1.16)
Mixed or rare 775 1229 0.63 0.92 (0.73 to 1.17) 0.85 (0.67 to 1.08) 1.00 (0.78 to 1.28)
Haloperidol oral 73 107 0.68 1.00 1.00 1.00
Chlorpromazine 82 127 0.64 0.94 (0.69 to 1.29) 0.97 (0.71 to 1.33) 1.06 (0.76 to 1.47)
Levomepromazine 52 63 0.82 1.21 (0.84 to 1.73) 0.82 (0.58 to 1.18) 1.09 (0.76 to 1.57)
No antipsychotic drugs 2248 3362 0.67 0.98 (0.77 to 1.23) 1.01 (0.80 to 1.27) 1.16 (0.91 to 1.47)
1.0 0
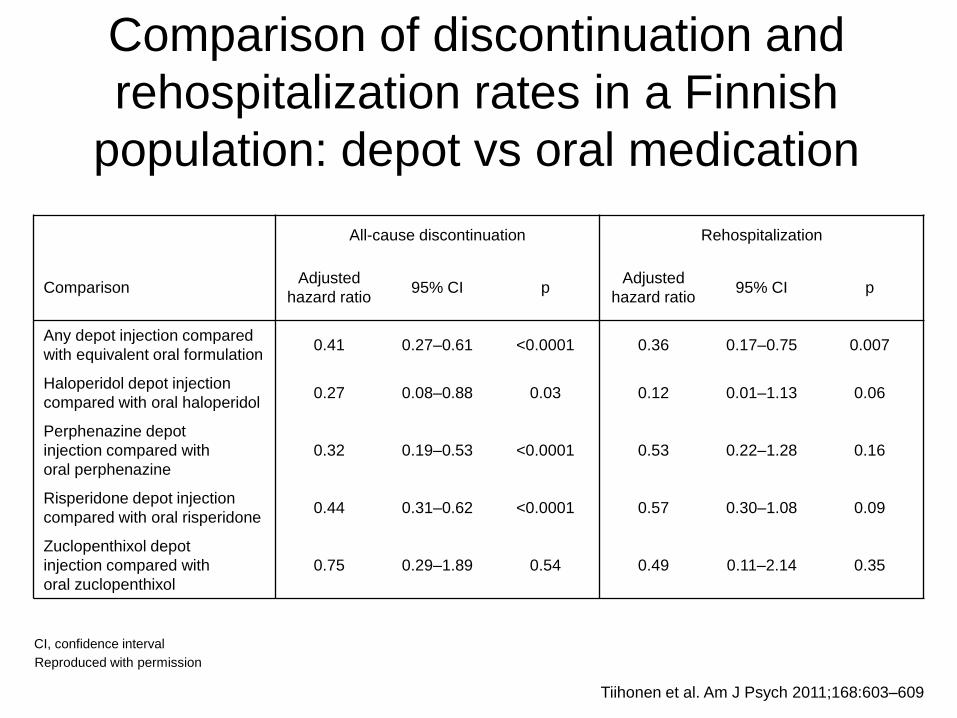
Comparison of discontinuation and
rehospitalization rates in a Finnish
population: depot vs oral medication
Tiihonen et al. Am J Psych 2011;168:603–609
Reproduced with permission
All-cause discontinuation Rehospitalization
Comparison Adjusted
hazard ratio 95% CI p Adjusted
hazard ratio 95% CI p
Any depot injection compared
with equivalent oral formulation 0.41 0.27–0.61 <0.0001 0.36 0.17–0.75 0.007
Haloperidol depot injection
compared with oral haloperidol 0.27 0.08–0.88 0.03 0.12 0.01–1.13 0.06
Perphenazine depot
injection compared with
oral perphenazine
0.32 0.19–0.53 <0.0001 0.53 0.22–1.28 0.16
Risperidone depot injection
compared with oral risperidone 0.44 0.31–0.62 <0.0001 0.57 0.30–1.08 0.09
Zuclopenthixol depot
injection compared with
oral zuclopenthixol
0.75 0.29–1.89 0.54 0.49 0.11–2.14 0.35
CI, confidence interval
CGSblablabla
CGSblablabla
CGSblablabla
CGSblablabla
CGSblablabla
CGSblablabla
CGSblablabla
CGSblablabla
CGSblablabla
CGSblablabla
CGSblablabla
CGSblablabla
CGSblablabla
CGSblablabla
CGSblablabla
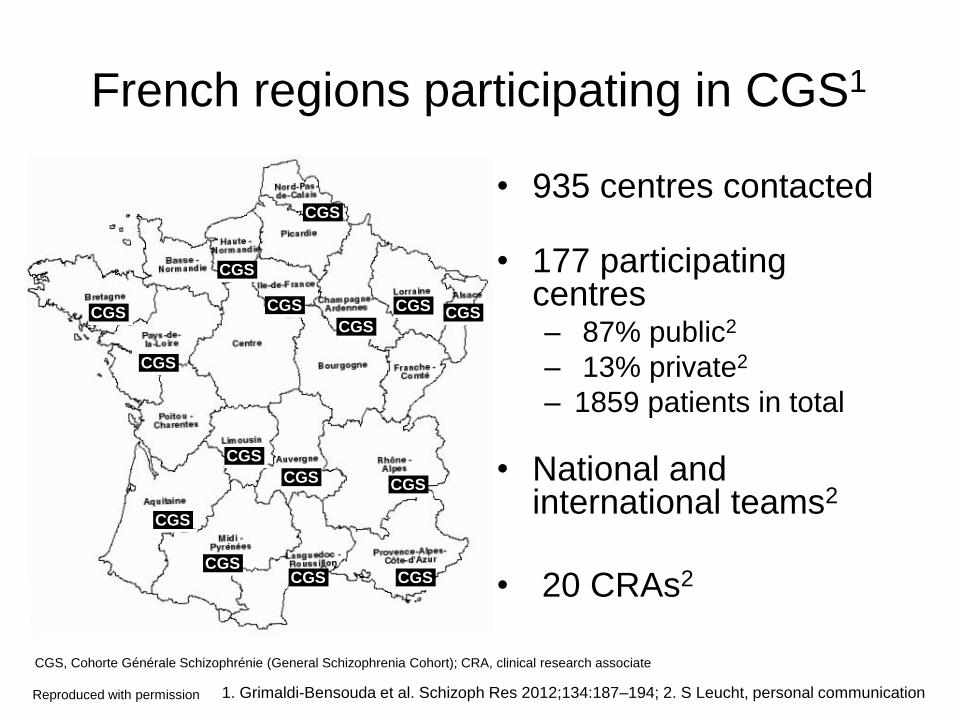
French regions participating in CGS1
• 935 centres contacted
• 177 participating centres – 87% public2
– 13% private2
– 1859 patients in total
• National and international teams2
• 20 CRAs2
CGS, Cohorte Générale Schizophrénie (General Schizophrenia Cohort); CRA, clinical research associate
1. Grimaldi-Bensouda et al. Schizoph Res 2012;134:187–194; 2. S Leucht, personal communication Reproduced with permission

CGS hospitalization: relative risks1
Adjusted rate ratio CI 95 %
RLAI vs
other treatments 0.66 0.46–0.96
Base : 4879 quarter-equivalents (defined exposure)2
Relative rate taking into account confounding factors* and auto-correction
(GEE Poisson)
RLAI significantly reduced by 34% the risk of
hospitalization vs other treatments, after 1 year
CGS, Cohorte Générale Schizophrénie (General Schizophrenia Cohort);
CI, confidence interval; GEE, Generalized Estimating Equations; RLAI, risperidone long-acting injectable
1. Grimaldi-Bensouda et al. Schizoph Res 2012;134:187–194; 2. S Leucht, personal communication
*Adjusted for age, gender, type of schizophrenia, educational level, living arrangements, work, guardianship, indicators of global functioning (CGI), suicidality
through a propensity scores and for hospitalization in the previous 12 months, ambulatory status at entry, switching of drugs in the previous trimester and
polytherapy (vs monotherapy)

Mirror-image studies (n=11)
Haddad et al. Br J Psychiatry Suppl 2009;52:S20–S28
RLAI, risperidone long-acting injectable; HR, hazard ratio; CI, confidence interval
Reproduced with permission
Distribution (%) of total inpatient stay between previous and FGA-LAI antipsychotic treatment periods for each mirror image study.
Each horizontal bar is equivalent to 100%
Denham & Adamson (1971)
Gottfries & Green (1974)
Morritt (1974)
Johnson (1975)
Lindholm (1975)
Marriott & Hiep (1976)
Polonowita & James (1976)
Devito et al (1978)
Freeman (1980)
Tan et al (1981)
Tegeler & Lehmann (1981)
100 80 40 20 0 60 20 40
Previous-treatment period
(% of total inpatient stay)
Conventional depot treatment period
(% of total inpatient stay)

Recommendation for choice of drug in
relapse prevention
• Use the drug that was effective and
tolerated in the acute phase
• Consider higher tardive dyskinesia risk
of first-generation antipsychotics
• Depot drugs improve compliance

Rationale:
• If a patient has received antipsychotics for x years and has not relapsed, does he still need it or is he cured and treatment can be stopped?
Result:
• Patients 3–6 years stable still relapse after withdrawal
Problem:
• Small number of patients (two trials with 54 participants)
• Longest duration stable in first-episode patients: 1 year
Study or Subgroup
2.3.1 stable at least 1 month
Hirsch 1973
Rifkin 1979
Andrews 1976
Kramer 2007
Leff 1971Subtotal (95% CI)
Total events
Heterogeneity: Tau² = 0.19; Chi² = 9.65, df = 4 (P = 0.05); I² = 59%
Test for overall effect: Z = 4.80 (P < 0.00001)
2.3.2 stable at least 3 months
Kane 1982
Eklund 1991
Pietzcker 1993
Hough 2010
Marjerrison 1964Subtotal (95% CI)
Total events
Heterogeneity: Tau² = 0.05; Chi² = 5.84, df = 4 (P = 0.21); I² = 31%
Test for overall effect: Z = 6.28 (P < 0.00001)
2.3.3 stable at least 6 months
Doddi 1979Subtotal (95% CI)
Total events
Heterogeneity: Not applicable
Test for overall effect: Z = 1.03 (P = 0.30)
2.3.4 stable at least 12 months
Troshinsky 1962
McCreadie 1989
Boonstra 2010
Odejide 1982
Chen 2010Subtotal (95% CI)
Total events
Heterogeneity: Tau² = 0.18; Chi² = 6.73, df = 4 (P = 0.15); I² = 41%
Test for overall effect: Z = 3.75 (P = 0.0002)
2.3.5 stable at least 3-6 years
Cheung 1981
Sampath 1992Subtotal (95% CI)
Total events
Heterogeneity: Tau² = 0.00; Chi² = 0.52, df = 1 (P = 0.47); I² = 0%
Test for overall effect: Z = 2.61 (P = 0.009)
Test for subgroup differences: Chi² = 0.58, df = 4 (P = 0.96), I² = 0%
Events
3
5
1
33
7
49
0
2
20
45
4
71
1
1
1
0
2
5
27
35
2
4
6
Total
41
51
15
105
20232
11
20
122
206
54413
1010
24
8
9
35
89165
15
1227
Events
25
15
6
82
12
140
7
16
72
130
2
227
3
3
12
4
10
15
56
97
8
9
17
Total
40
22
17
102
15196
17
23
115
204
34393
1010
19
7
11
35
89161
15
1227
Weight
14.7%
19.2%
6.2%
34.9%
25.0%100.0%
1.7%
6.9%
36.5%
50.2%
4.7%100.0%
100.0%100.0%
8.3%
4.5%
16.8%
24.9%
45.4%100.0%
28.3%
71.7%100.0%
M-H, Random, 95% CI
0.12 [0.04, 0.36]
0.14 [0.06, 0.35]
0.19 [0.03, 1.40]
0.39 [0.29, 0.53]
0.44 [0.23, 0.84]0.27 [0.15, 0.46]
0.10 [0.01, 1.59]
0.14 [0.04, 0.55]
0.26 [0.17, 0.40]
0.34 [0.26, 0.45]
1.26 [0.24, 6.51]0.30 [0.21, 0.44]
0.33 [0.04, 2.69]0.33 [0.04, 2.69]
0.07 [0.01, 0.46]
0.10 [0.01, 1.56]
0.24 [0.07, 0.84]
0.33 [0.14, 0.82]
0.48 [0.34, 0.69]0.31 [0.17, 0.57]
0.25 [0.06, 0.99]
0.44 [0.19, 1.05]0.38 [0.18, 0.78]
Experimental Control Risk Ratio Risk Ratio
M-H, Random, 95% CI
0.01 0.1 1 10 100Favours experimental Favours control
Leucht et al. Lancet 2012;379:2063–2071; Leucht et al. Cochrane Database
Syst Rev 2012;5:CD008016; S Leucht. Personal Communication
For how long should maintenance
treatment be given?
M-H, Mantel–Haenszel; Random, random effects model;
CI, confidence interval
Reproduced with permission
Subgroup comparison p-value = 0.96

Recommendation for duration of
relapse prevention
• First episode patients: at least one year
• Multiple episode patients: at least 3-6
years
• Take into account severity of episodes
and side-effects

50% dose reduction after four weeks or 26
weeks was associated with significantly
more relapses than keeping the initial dose
Wang et al. AJP 2010 Starting dose: risperidone 4-8mg/day

Recommendation for dose in
relapse prevention
• Keep the dose that was effective in the
acute phase
• Use maintenance phase to reduce
excessive doses and polypharmacy

Study or Subgroup
2.4.1 Abrupt withdrawal
Andrews 1976
Arato 2002
Cheung 1981
Hogarty 1973
Hough 2010
Kane 1982
Kramer 2007
Leff 1971
Marjerrison 1964
McCreadie 1989
Nishikawa 1982
Nishikawa 1984
Odejide 1982
Pfizer 2000
Rifkin 1979
Troshinsky 1962Subtotal (95% CI)
Total events
Heterogeneity: Tau² = 0.10; Chi² = 51.47, df = 15 (P < 0.00001); I² = 71%
Test for overall effect: Z = 7.21 (P < 0.00001)
2.4.2 Taper
Boonstra 2010
Chen 2010
Crow 1986
Doddi 1979
Eklund 1991
Hirsch 1973
Pietzcker 1993
Sampath 1992Subtotal (95% CI)
Total events
Heterogeneity: Tau² = 0.15; Chi² = 17.27, df = 7 (P = 0.02); I² = 59%
Test for overall effect: Z = 5.40 (P < 0.00001)
Test for subgroup differences: Chi² = 1.05, df = 1 (P = 0.31), I² = 4.9%
Events
1
73
2
62
45
0
33
7
4
0
16
35
5
24
5
1
313
2
27
20
1
2
3
20
4
79
Total
15
207
15
192
206
11
105
20
54
8
20
74
35
71
51
241108
9
89
54
10
20
41
122
12357
Events
6
50
8
131
130
7
82
12
2
4
10
13
15
43
15
12
540
10
56
42
3
16
25
72
9
233
Total
17
71
15
182
204
17
102
15
34
7
10
13
35
75
22
19838
11
89
66
10
23
40
115
12366
Weight
1.2%
11.5%
2.3%
11.7%
11.0%
0.7%
10.7%
6.4%
1.7%
0.7%
11.2%
11.2%
4.4%
9.6%
4.5%
1.3%100.0%
7.3%
21.9%
21.0%
3.1%
6.5%
8.4%
20.2%
11.6%100.0%
M-H, Random, 95% CI
0.19 [0.03, 1.40]
0.50 [0.39, 0.64]
0.25 [0.06, 0.99]
0.45 [0.36, 0.56]
0.34 [0.26, 0.45]
0.10 [0.01, 1.59]
0.39 [0.29, 0.53]
0.44 [0.23, 0.84]
1.26 [0.24, 6.51]
0.10 [0.01, 1.56]
0.82 [0.64, 1.07]
0.49 [0.38, 0.64]
0.33 [0.14, 0.82]
0.59 [0.40, 0.86]
0.14 [0.06, 0.35]
0.07 [0.01, 0.46]0.43 [0.34, 0.54]
0.24 [0.07, 0.84]
0.48 [0.34, 0.69]
0.58 [0.39, 0.86]
0.33 [0.04, 2.69]
0.14 [0.04, 0.55]
0.12 [0.04, 0.36]
0.26 [0.17, 0.40]
0.44 [0.19, 1.05]0.34 [0.23, 0.50]
Experimental Control Risk Ratio Risk Ratio
M-H, Random, 95% CI
0.01 0.1 1 10 100Favours experimental Favours control
1. Leucht et al. Lancet 2012;379:2063–2071; 2. Leucht et al. Cochrane Database Syst Rev
2012;5:CD008016; 3. S Leucht. Personal Communication; 4. Viguera et al. Arch Gen Psych 1997;54:49–55
Evidence for supersensitivity psychosis
(abrupt vs gradual withdrawal)?1–3 Rationale:
• Long-term use of antipsychotics leads to higher sensitivity of dopamine receptors, if antipsychotics are withdrawn abruptly, there are rebound psychoses
• Thus studies that slowly tapered (at least 3-weeks or on depot4) compared to studies with abrupt withdrawal
Result:
• No difference between abrupt withdrawal and gradual tapering
Problem:
• Subgroup analysis is observational, RCTs would be better
M-H, Mantel–Haenszel; Random, random effects model;
CI, confidence interval
Reproduced with permission
Subgroup comparison p-value = 0.31

The DerSimonian and Laird random effects model with weights calculated by the Mantel–Haenszel method was used throughout
0.1 1
0.40 (0.30-0.55)*
Favours placebo Favours drug
Drug
n/N (%)
PBO
n/N (%)
Relative Risk
(95%CI)
0.40 (0.26-0.61)*
3 months (20 RCTs): 243/1678 (14%) 445/1264 (35%)
0.46 (0.29-0.73)†
6 months (13 RCTs): 133/862 (15%) 199/520 (38%)
9 months (10 RCTs): 100/556 (18%) 115/275 (42%)
RR 0.1 1.0 10
Favours drug Favours placebo
RR
Leucht et al. Lancet 2012;379:2063–2071; Leucht et al. Cochrane
Database Syst Rev 2012;5:CD008016
PBO, placebo; n, number of participants relapsed; N, total number of patients;
RCTs, number of included randomized controlled trials; CI, confidence interval; * p<0.0001. †p=0.0009
Sensitivity analysis: subsequent relapse risk after
different periods in the studies without relapsing
Reproduced with permission

Study duration (weeks)
Log risk ratio
5 23 41 60 79 97 116 134 153 171
0,40
-0,04
-0,48
-0,92
-1,36
-1,80
-2,24
-2,68
-3,12
-3,56
-4,00
Slope = 0.007, 95% CI 0.002-0.010, p<0.0001
Leucht et al. Lancet 2012;379:2063–2071; Leucht et al. Cochrane Database Syst Rev 2012;5:CD008016
Meta-regression with study duration as
a moderator (all studies) Result:
• Superiority of antipsychotics smaller in longer studies than in shorter studies, suggesting that antipsychotics lose their efficacy
• Many reasons, especially non-adherence (50% in a large study, usually not well measured), supersensitivity psychosis
• We need trials that last longer than 2 years to clarify
Reproduced with permission

Rehospitalization
Summary:
• Most important cost factor!
• Same relative risk reduction
• Fewer data
• But on lower level, less than one third of the relapsed patients need to be rehospitalized (10% with drug vs 26% with placebo)
• Important for cost calculations
Study or Subgroup
1.10.1 up to 3 months
Goldberg 1981
Keskiner 1968
Subtotal (95% CI)
Total events
Heterogeneity: Not applicable
Test for overall effect: Z = 0.75 (P = 0.46)
1.10.2 4 to 6 months
Blackburn 1981
Ruskin 1991
Wistedt 1981
Subtotal (95% CI)
Total events
Heterogeneity: Tau² = 0.00; Chi² = 1.57, df = 2 (P = 0.46); I² = 0%
Test for overall effect: Z = 2.99 (P = 0.003)
1.10.3 7 to 12 months
Beasley 2003
Chen 2010
Hirsch 1973
Hough 2010
Kramer 2007
Leff 1971
McCreadie 1989
Troshinsky 1962
Subtotal (95% CI)
Total events
Heterogeneity: Tau² = 0.32; Chi² = 14.06, df = 7 (P = 0.05); I² = 50%
Test for overall effect: Z = 3.81 (P = 0.0001)
1.10.4 > 12 months
Boonstra 2010
Hogarty 1973
Pietzcker 1993
Subtotal (95% CI)
Total events
Heterogeneity: Tau² = 0.00; Chi² = 0.35, df = 2 (P = 0.84); I² = 0%
Test for overall effect: Z = 5.04 (P < 0.00001)
Total (95% CI)
Total events
Heterogeneity: Tau² = 0.16; Chi² = 25.50, df = 14 (P = 0.03); I² = 45%
Test for overall effect: Z = 5.19 (P < 0.00001)
Test for subgroup differences: Chi² = 7.91, df = 3 (P = 0.05), I² = 62.1%
Events
0
1
1
0
0
0
0
2
5
8
3
6
7
0
0
31
1
50
29
80
112
Total
14
13
27
30
11
24
65
224
89
41
206
105
20
8
24
717
9
192
122
323
1132
Events
0
2
2
9
1
5
15
15
14
24
7
13
6
4
8
91
4
84
49
137
245
Total
17
11
28
15
12
17
44
102
89
40
204
102
15
7
19
578
11
182
115
308
958
Weight
2.3%
2.3%
1.6%
1.3%
1.5%
4.4%
4.8%
8.5%
12.6%
5.5%
9.0%
9.8%
1.6%
1.6%
53.4%
2.8%
19.4%
17.7%
40.0%
100.0%
M-H, Random, 95% CI
Not estimable
0.42 [0.04, 4.06]
0.42 [0.04, 4.06]
0.03 [0.00, 0.44]
0.36 [0.02, 8.04]
0.07 [0.00, 1.11]
0.08 [0.01, 0.42]
0.06 [0.01, 0.26]
0.36 [0.13, 0.95]
0.33 [0.17, 0.64]
0.42 [0.11, 1.62]
0.45 [0.18, 1.13]
0.88 [0.37, 2.07]
0.10 [0.01, 1.56]
0.05 [0.00, 0.77]
0.32 [0.18, 0.57]
0.31 [0.04, 2.27]
0.56 [0.42, 0.75]
0.56 [0.38, 0.82]
0.56 [0.44, 0.70]
0.38 [0.27, 0.55]
Experimental Control Risk Ratio Risk Ratio
M-H, Random, 95% CI
0.002 0.1 1 10 500
Favours experimental Favours control
Leucht et al. Lancet 2012;379:2063–2071; Leucht et al. Cochrane Database
Syst Rev 2012;5:CD008016; S Leucht. Personal Communication
M-H, Mantel–Haenszel; Random, random effects model;
CI, confidence interval
Reproduced with permission

Violence/aggressive behaviour
Summary:
• Antipsychotics reduce these outcomes
• Important because although rare aggression leads to stigma and can have dire consequences for the patient
Study or Subgroup
1.17.1 up to 3 months
Whittaker 1963
Subtotal (95% CI)
Total events
Heterogeneity: Not applicable
Test for overall effect: Z = 0.69 (P = 0.49)
1.17.2 up to 6 months
Denijs 1973
Subtotal (95% CI)
Total events
Heterogeneity: Not applicable
Test for overall effect: Z = 1.06 (P = 0.29)
1.17.3 7 to 12 months
Beasley 2003
Hirsch 1973
Kramer 2007
Subtotal (95% CI)
Total events
Heterogeneity: Tau² = 0.00; Chi² = 1.10, df = 2 (P = 0.58); I² = 0%
Test for overall effect: Z = 3.82 (P = 0.0001)
Total (95% CI)
Total events
Heterogeneity: Tau² = 0.00; Chi² = 1.16, df = 4 (P = 0.88); I² = 0%
Test for overall effect: Z = 4.02 (P < 0.0001)
Test for subgroup differences: Chi² = 0.06, df = 2 (P = 0.97), I² = 0%
Events
0
0
0
0
1
7
1
9
9
Total
13
13
20
20
224
41
105
370
403
Events
1
1
2
2
4
21
6
31
34
Total
13
13
20
20
102
40
102
244
277
Weight
4.1%
4.1%
4.5%
4.5%
8.4%
73.8%
9.1%
91.4%
100.0%
M-H, Random, 95% CI
0.33 [0.01, 7.50]
0.33 [0.01, 7.50]
0.20 [0.01, 3.92]
0.20 [0.01, 3.92]
0.11 [0.01, 1.01]
0.33 [0.16, 0.68]
0.16 [0.02, 1.32]
0.28 [0.14, 0.53]
0.27 [0.15, 0.52]
Experimental Control Risk Ratio Risk Ratio
M-H, Random, 95% CI
0.01 0.1 1 10 100
Favours experimental Favours control
Leucht et al. Lancet 2012;379:2063–2071; Leucht et al. Cochrane Database
Syst Rev 2012;5:CD008016; S Leucht. Personal Communication
M-H, Mantel–Haenszel; Random, random effects model;
CI, confidence interval
Reproduced with permission

Quality of life
Summary:
• Better quality of life with antipsychotics compared with placebo
• Could have been different due to side effects
• Only three trials
• Quality of life scales problematic
• Depends on when one measures (at endpoint – once relapse, poor quality of life)
Study or Subgroup
1.29.1 Quality of life - 7 to 12 months
Beasley 2003
Kramer 2007
Subtotal (95% CI)
Heterogeneity: Tau² = 0.19; Chi² = 11.34, df = 1 (P = 0.0008); I² = 91%
Test for overall effect: Z = 1.93 (P = 0.05)
1.29.2 Quality of life - > 12 months
Cheung 1981
Subtotal (95% CI)
Heterogeneity: Not applicable
Test for overall effect: Z = 1.13 (P = 0.26)
Total (95% CI)
Heterogeneity: Tau² = 0.16; Chi² = 11.35, df = 2 (P = 0.003); I² = 82%
Test for overall effect: Z = 2.29 (P = 0.02)
Test for subgroup differences: Chi² = 0.00, df = 1 (P = 0.98), I² = 0%
Mean
-4.25
2
21.3
SD
10.64
12.5
6.8
Total
212
104
316
13
13
329
Mean
7.11
6.1
26.2
SD
14.62
14.7
9.9
Total
92
101
193
5
5
198
Weight
42.1%
41.5%
83.6%
16.4%
16.4%
100.0%
IV, Random, 95% CI
-0.95 [-1.20, -0.69]
-0.30 [-0.58, -0.02]
-0.62 [-1.26, 0.01]
-0.61 [-1.66, 0.45]
-0.61 [-1.66, 0.45]
-0.62 [-1.15, -0.09]
Experimental Control Std. Mean Difference Std. Mean Difference
IV, Random, 95% CI
-2 -1 0 1 2
Favours experimental Favours control
Leucht et al. Lancet 2012;379:2063–2071; Leucht et al. Cochrane Database
Syst Rev 2012;5:CD008016; S Leucht. Personal Communication
SD, standard deviation; IV, Instrumental Variables;
Random, random effects model; CI, confidence interval
Reproduced with permission

Death: natural causes/suicide Study or Subgroup
1.14.1 up to 3 months
Gardos 1984
Subtotal (95% CI)
Total events
Heterogeneity: Not applicable
Test for overall effect: Not applicable
1.14.2 4 to 6 months
Pigott 2003
Prien 1968
Subtotal (95% CI)
Total events
Heterogeneity: Not applicable
Test for overall effect: Not applicable
1.14.3 7 to 12 months
Beasley 2003
Hough 2010
Kramer 2007
Leff 1971
Peuskens 2007
Subtotal (95% CI)
Total events
Heterogeneity: Tau² = 0.00; Chi² = 0.00, df = 1 (P = 0.96); I² = 0%
Test for overall effect: Z = 0.93 (P = 0.35)
Total (95% CI)
Total events
Heterogeneity: Tau² = 0.00; Chi² = 0.00, df = 1 (P = 0.96); I² = 0%
Test for overall effect: Z = 0.93 (P = 0.35)
Test for subgroup differences: Not applicable
Events
0
0
0
0
0
0
0
0
0
0
0
0
Total
9
9
155
208
363
224
206
105
20
94
649
1021
Events
0
0
0
0
0
0
0
1
0
1
2
2
Total
27
27
155
212
367
102
204
102
15
103
526
920
Weight
50.0%
50.0%
100.0%
100.0%
M-H, Random, 95% CI
Not estimable
Not estimable
Not estimable
Not estimable
Not estimable
Not estimable
Not estimable
0.32 [0.01, 7.86]
Not estimable
0.36 [0.02, 8.85]
0.34 [0.04, 3.28]
0.34 [0.04, 3.28]
Experimental Control Risk Ratio Risk Ratio
M-H, Random, 95% CI
0.01 0.1 1 10 100
Favours experimental Favours control
Study or Subgroup
1.13.1 4 to 6 months
Denijs 1973
Hershon 1972
Pigott 2003
Prien 1968
Ruskin 1991
Subtotal (95% CI)
Total events
Heterogeneity: Tau² = 0.00; Chi² = 0.39, df = 3 (P = 0.94); I² = 0%
Test for overall effect: Z = 1.02 (P = 0.31)
1.13.2 7 to 12 months
Beasley 2003
Hirsch 1973
Hough 2010
Kramer 2007
Leff 1971
Odejide 1982
Peuskens 2007
Pfizer 2000
Rifkin 1979
Subtotal (95% CI)
Total events
Heterogeneity: Tau² = 0.00; Chi² = 0.47, df = 2 (P = 0.79); I² = 0%
Test for overall effect: Z = 0.66 (P = 0.51)
Total (95% CI)
Total events
Heterogeneity: Tau² = 0.00; Chi² = 2.19, df = 6 (P = 0.90); I² = 0%
Test for overall effect: Z = 0.36 (P = 0.72)
Test for subgroup differences: Chi² = 1.33, df = 1 (P = 0.25), I² = 25.1%
Events
1
1
1
0
1
4
0
0
0
0
0
0
0
0
1
1
5
Total
20
31
155
208
11
425
224
41
206
105
20
35
94
71
51
847
1272
Events
0
0
0
0
1
1
0
0
0
0
0
1
0
1
0
2
3
Total
20
32
155
212
12
431
102
40
204
102
15
35
103
75
22
698
1129
Weight
13.7%
13.5%
13.3%
19.3%
59.7%
13.5%
13.3%
13.5%
40.3%
100.0%
M-H, Random, 95% CI
3.00 [0.13, 69.52]
3.09 [0.13, 73.17]
3.00 [0.12, 73.08]
Not estimable
1.09 [0.08, 15.41]
2.18 [0.48, 9.81]
Not estimable
Not estimable
Not estimable
Not estimable
Not estimable
0.33 [0.01, 7.91]
Not estimable
0.35 [0.01, 8.50]
1.33 [0.06, 31.36]
0.54 [0.09, 3.36]
1.24 [0.39, 3.97]
Experimental Control Risk Ratio Risk Ratio
M-H, Random, 95% CI
0.01 0.1 1 10 100
Favours experimental Favours control
Leucht et al. Lancet 2012;379:2063–2071;
Leucht et al. Cochrane Database Syst Rev 2012;5:CD008016; S Leucht, personal communication Reproduced with permission
M-H, Mantel–Haenszel; Random, random effects model;
CI, confidence interval

Employment1–3
Summary:
• 80–90% of people with schizophrenia do not have a job!4
• Only two trials reported on employment rates
Study or Subgroup
Chen 2010
Hirsch 1973
Total (95% CI)
Total events
Heterogeneity: Tau² = 0.00; Chi² = 0.53, df = 1 (P = 0.47); I² = 0%
Test for overall effect: Z = 0.29 (P = 0.77)
Events
45
18
63
Total
89
41
130
Events
44
21
65
Total
89
40
129
Weight
70.5%
29.5%
100.0%
M-H, Random, 95% CI
1.02 [0.76, 1.37]
0.84 [0.53, 1.32]
0.96 [0.75, 1.23]
Experimental Control Risk Ratio Risk Ratio
M-H, Random, 95% CI
0.01 0.1 1 10 100
Favours experimental Favours control
1. Leucht et al. Lancet 2012;379:2063–2071; 2. Leucht et al. Cochrane Database Syst Rev 2012;5:CD008016;
3. S Leucht. Personal Communication; 4. Marwaha et al. Social Psychiatry Psychiatr Epidemiol 2004; 39:337–349 Reproduced with permission
M-H, Mantel–Haenszel; Random, random effects model;
CI, confidence interval

Relapse 7-12 months
Relapse independent of duration
Participants rehospitalized
Drop-out due to any reason
Drop-out due to inefficacy
Participants unimproved/worse
Violent/aggressive behaviour
Participants employed
Death (any)
Suicide
Death due to natural causes
Drop-out due to AE
At least one AE
At least one MD
Dyskinesia
Use of antiparkinson medication
Sedation
Weight gain
0.40 (0.33-0.49) -0.39 (-0.46;-0.32) 3 (2-3)
0.35 (0.29-0.41) -0.38 (-0.43;-0.33) 3 (2-3)
0.38 (0.27-0.55) -0.19 (-0.27;-0.11) 5 (4-9)
0.53 (0.46-0.61) -0.24 (-0.30;-0.17) 4 (3-6)
0.37 (0.31-0.44) -0.27 (-0.34;-0.19) 4 (3-5)
0.73 (0.64-0.84) -0.25 (0.35;0.14) 4 (3-7)
0.27 (0.15-0.52) -0.09 (-0.17;-0.01) 11 (6-100)
0.96 (0.75-1.23) -0.02 (-0.14;0.10) 50 (H7- B10)*
0.77 (0.28-2.11) 0.00 (-0.01;0.00) ∞
0.34 (0.04-3.28) 0.00 (-0.01;0.00) ∞
1.24 (0.39-3.97) 0.00 (0.00;0.01) ∞
1.16 (0.70-1.91) 0.00 (-0.01;0.02) ∞
1.01 (0.87-1.18) 0.01 (-0.06;0.08) 100 (H17- B13)*
1.55 (1.25-1.93) 0.06 (0.03;0.10) 17 (10-33)
0.52 (0.28-0.97) -0.01 (-0.02;0.01) 100 (H50- B100)*
1.40 (1.03-1.89) 0.09 (0.02;0.16) 11 (6-50)
1.50 (1.22-1.84) 0.05 (0.00;0.10) 20 (B=∞- H10)*
2.07 (2.31-3.25) 0.05 (0.03;0.07)
20 (14-33)
24 392/1465 (27) 773/1204 (64) 11
62 744/3395 (22) 1718/2997 (57) 9
16 112/1132 (10) 245/958 (26) 13
57 802/2642 (30) 1130/2076 (54) 9
46 412/2539 (16) 830/2007 (41) 8
14 614/880 (70) 569/644 (88) 5
5 9/403 (2) 34/277 (12) 8
2 63/130 (48) 65/129 (50) 11
14 5/1240 (0.4) 7/1116 (0.6) 7
8 0/1021 (0) 2/920 (0.2) 6
14 5/1272 (0.4) 3/1129 (0.2) 7
43 129/2437 (5) 78/1896 (4) 8
10 575/1188 (48) 450/996 (45) 7
22 304/1901 (16) 134/1510 (9) 7
13 18/1051 (2) 37/769 (5) 9
7 182/748 (24) 90/569 (16) 7
10 158/1174 (13) 85/972 (9) 6
10 128/1231 (10) 61/1090 (6) 7
N Drug
n/N
PBO
n/NP
Mean study
duration1
(months)
RR (95% CI) RD (95% CI)
0.1 1.0 10
RR
NNTB/NNTH
(95% CI)
Favours drug Favours placebo
(%) (%)
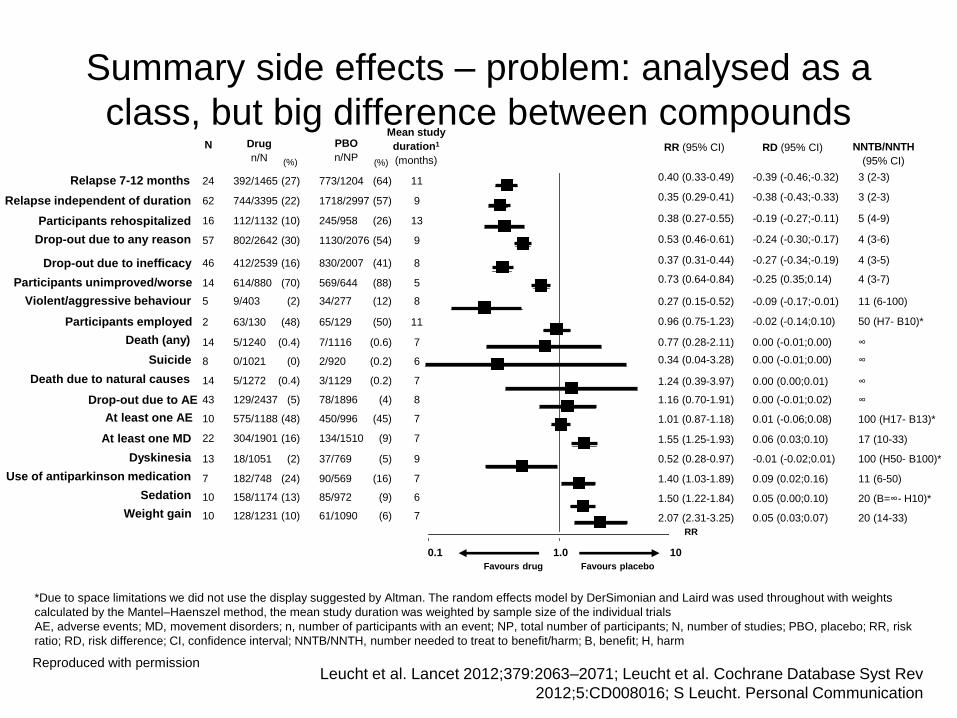
*Due to space limitations we did not use the display suggested by Altman. The random effects model by DerSimonian and Laird was used throughout with weights
calculated by the Mantel–Haenszel method, the mean study duration was weighted by sample size of the individual trials
AE, adverse events; MD, movement disorders; n, number of participants with an event; NP, total number of participants; N, number of studies; PBO, placebo; RR, risk
ratio; RD, risk difference; CI, confidence interval; NNTB/NNTH, number needed to treat to benefit/harm; B, benefit; H, harm
Leucht et al. Lancet 2012;379:2063–2071; Leucht et al. Cochrane Database Syst Rev
2012;5:CD008016; S Leucht. Personal Communication
Side effects – problem: analysed as a class, but
big difference between compounds
Reproduced with permission
0.1 1.0 10
Relapse 7-12 months
Relapse independent of duration
Participants rehospitalized
Drop-out due to any reason
Drop-out due to inefficacy
Participants unimproved/worse
Violent/aggressive behaviour
Participants employed
Death (any)
Suicide
Death due to natural causes
Drop-out due to AE
At least one AE
At least one MD
Dyskinesia
Use of antiparkinson medication
Sedation
Weight gain
0.40 (0.33-0.49) -0.39 (-0.46;-0.32) 3 (2-3)
0.35 (0.29-0.41) -0.38 (-0.43;-0.33) 3 (2-3)
0.38 (0.27-0.55) -0.19 (-0.27;-0.11) 5 (4-9)
0.53 (0.46-0.61) -0.24 (-0.30;-0.17) 4 (3-6)
0.37 (0.31-0.44) -0.27 (-0.34;-0.19) 4 (3-5)
0.73 (0.64-0.84) -0.25 (0.35;0.14) 4 (3-7)
0.27 (0.15-0.52) -0.09 (-0.17;-0.01) 11 (6-100)
0.96 (0.75-1.23) -0.02 (-0.14;0.10) 50 (H7- B10)*
0.77 (0.28-2.11) 0.00 (-0.01;0.00) ∞
0.34 (0.04-3.28) 0.00 (-0.01;0.00) ∞
1.24 (0.39-3.97) 0.00 (0.00;0.01) ∞
1.16 (0.70-1.91) 0.00 (-0.01;0.02) ∞
1.01 (0.87-1.18) 0.01 (-0.06;0.08) 100 (H17- B13)*
1.55 (1.25-1.93) 0.06 (0.03;0.10) 17 (10-33)
0.52 (0.28-0.97) -0.01 (-0.02;0.01) 100 (H50- B100)*
1.40 (1.03-1.89) 0.09 (0.02;0.16) 11 (6-50)
1.50 (1.22-1.84) 0.05 (0.00;0.10) 20 (B=∞- H10)*
2.07 (2.31-3.25) 0.05 (0.03;0.07)
20 (14-33)
24 392/1465 (27) 773/1204 (64) 11
62 744/3395 (22) 1718/2997 (57) 9
16 112/1132 (10) 245/958 (26) 13
57 802/2642 (30) 1130/2076 (54) 9
46 412/2539 (16) 830/2007 (41) 8
14 614/880 (70) 569/644 (88) 5
5 9/403 (2) 34/277 (12) 8
2 63/130 (48) 65/129 (50) 11
14 5/1240 (0.4) 7/1116 (0.6) 7
8 0/1021 (0) 2/920 (0.2) 6
14 5/1272 (0.4) 3/1129 (0.2) 7
43 129/2437 (5) 78/1896 (4) 8
10 575/1188 (48) 450/996 (45) 7
22 304/1901 (16) 134/1510 (9) 7
13 18/1051 (2) 37/769 (5) 9
7 182/748 (24) 90/569 (16) 7
10 158/1174 (13) 85/972 (9) 6
10 128/1231 (10) 61/1090 (6) 7
N Drug
n/N
PBO
n/NP
Mean study
duration1
(months)
RR (95% CI) RD (95% CI)
RR
NNTB/NNTH
(95% CI) (%) (%)
Summary side effects – problem: analysed as a
class, but big difference between compounds
Favours drug Favours placebo
0.1 1.0 10
Favours drug Favours placebo
*Due to space limitations we did not use the display suggested by Altman. The random effects model by DerSimonian and Laird was used throughout with weights
calculated by the Mantel–Haenszel method, the mean study duration was weighted by sample size of the individual trials
AE, adverse events; MD, movement disorders; n, number of participants with an event; NP, total number of participants; N, number of studies; PBO, placebo; RR, risk
ratio; RD, risk difference; CI, confidence interval; NNTB/NNTH, number needed to treat to benefit/harm; B, benefit; H, harm
Reproduced with permission Leucht et al. Lancet 2012;379:2063–2071; Leucht et al. Cochrane Database Syst Rev
2012;5:CD008016; S Leucht. Personal Communication

Summary
• Relapse prevention with antipsychotics is one of the most effective treatments in medicine
• Use the drug that was effective and well tolerated in the acute phase
• First episode patients should receive maintenance treatment for at least one year, multiple episode patients for at least 3-6 years
• Depot antipsychotics have obvious advantages in terms of adherence
• Keep the dose that was effective in the acute phase unless there are side-effects, but use the maintenance phase to reduce polypharmacy
• We found no randomized evidence for supersensitivity psychosis (but animal data) – nevertheless antipsychotics should be gradually withdrawn or reduced
• We need more data on outcomes of social participation (aggression, ability to work, functioning, quality of life, etc)
• We need to clarifiy the long-term morbidity and mortality associated with these drugs
Leucht et al. Lancet 2012;379:2063–2071; Leucht et al. Cochrane Database Syst Rev 2012;5:CD008016

Thank you
• German Ministry for Education and Research
• Cochrane Schizophrenia Group
• Astellas, Bristol-Myers Squibb, Eli Lilly,
Lundbeck, Pfizer, Johnson and Johnson, Sanofi-
Aventis, Eric Chen, George Gardos, Julian Leff,
and Erik Denys for additional information