anuário do instituto de geociências - ufrj ... · issn 0101-9759 e-issn 1982-3908 - vol. 38 - 2 /...
TRANSCRIPT

70
Anuário do Instituto de Geociências - UFRJ www.anuario.igeo.ufrj.br
Application of Open Source Electronics for Studying High Frequency Urban Heat IslandAplicação de Eletrônica Open Source para Estudar Ilha de Calor em Alta Frequência
Federico Ferrelli1,2; Alejandro José Vitale1,3 & María Cintia Piccolo1,2
1 Instituto Argentino de Oceanografía. Consejo Nacional de Investigaciones Científicas y Técnicas. Florida 4500 Ed 1, 8000, Bahía Blanca, Buenos Aires, Argentina
2 Universidad Nacional del Sur, Departamento de Geografía y Turismo 12 de octubre y San Juan, 8000, Bahía Blanca, Buenos Aires, Argentina
3 Universidad Nacional del Sur. Departamento de Ingeniería Eléctrica y Computadoras Avenida Alem 1015, 8000, Bahía Blanca, Buenos Aires, Argentina
E-mails: [email protected]; [email protected]; [email protected] em: 22/06/2015 Aprovado em: 15/12/2015
DOI: http://dx.doi.org/10.11137/2015_2_70_80
Abstract
A new measurement system based on open source electronics (Arduino) was designed to obtain high frequency data to study Urban Heat Island (UHI). The instrument registers geo-referenced information of air temperature, relative humidity, barometric pressure and altitude above sea level in a moving vehicle. The device was designed to analyze the UHI in Bahia Blanca city, Argentina. Measurements were made with the method of urban transects during different days of summer and winter. The spatial distribution of air temperature was associated with wind direction and speed. Relative humidity was low in the downtown area and high in the periphery and the estuarine coast. In conclusion, the device allowed to study the Urban Heat Island in the city. Its use will be useful for urban planning because the measurements are very fast and accurate. Keywords: Urban Heat Island; Arduino; Open source; High frequency data
Resumo
Um novo sistema de medição baseado em eletrônica open source (Arduino) foi projetado para obter dados de alta frequência para estudar Ilha de Calor. O instrumento registra informações georreferenciadas da temperatura do ar, umidade relativa, pressão barométrica e altitude acima do nível do mar em um veículo em movimento. O dispositivo foi projetado para analisar Ilha de Calor na cidade de Bahia Blanca , Argentina. A aplicação foi feita com o método de transectos urbano. Durante a diferentes dias: verão e inverno. Observou-se que a distribuição espacial da temperatura do ar foi associada com a direção e velocidade do vento e umidade relativa foi baixa no centro e alta na periferia e no litoral. Em conclusão, o dispositivo permitiu estudar a Ilha de Calor Urbana nesta cidade. Foi-útil para o planejamento urbano porque as medidas são muito rápida e precisa.Palavras-chave: Ilha de Calor; Arduino; open source; dados de alta frequência
A n u á r i o d o I n s t i t u t o d e G e o c i ê n c i a s - U F R JISSN 0101-9759 e-ISSN 1982-3908 - Vol. 38 - 2 / 2015 p. 70-80

71A n u á r i o d o I n s t i t u t o d e G e o c i ê n c i a s - U F R JISSN 0101-9759 e-ISSN 1982-3908 - Vol. 38 - 2 / 2015 p. 70-80
Application of Open Source Electronics for Studying High Frequency Urban Heat IslandFederico Ferrelli; Alejandro José Vitale & María Cintia Piccolo
1 Introduction
Urban Heat Island (UHI) is a major alteration generated by urbanization that affect the regional climate. The phenomenon is observed in almost all cities of the world and it has been studied extensively. Its intensity vary with time and space and it is influenced by regional climate, atmospheric weather, topography, size and morphology of the city, waterproofing of natural surfaces, lack of evaporative surfaces, urban air composition, among others (Klyskik & Fortuniak, 1999; Wong & Yu, 2005; Tran et al., 2006; Unger et al., 2009).
On a global scale, UHI has been analyzed in different cities and its intensities varies between 2 to 14 ºC depending on site conditions (Camilloni & Barros, 1997; Figuerola & Mazzeo (1998), Oliveira Moreas et al., 2005; Sakata et al.. 2006; Chen et al., 2006; Alcofarado & Andrade, 2006; Kassomenos & Katsoulis, 2006; Tran et al., 2006; Kolokotsa et al., 2009; Pereira Sena, 2014). Cities generate dry and wet environment conditions due to the retention and release of water vapor (Chandler, 1967; Jonsson et al., 2004; George et al., 2007; Sakata et al., 2010; Sundara Kumar et al., 2012).
The UHI has been studied with different methodologies. The most common ones are the installation of meteorological stations in several sites of the city that registered information of meteorological parameters (i.e., downtown, periphery, industries, green areas, etc.) (e.g. Kolokotsa et al., 2009) or 'Urban routes or transects', where weather stations are installed in cars that register thermo-hygrometric data. The measure needs to predefine sampling sites. Once the information is obtained, the data is normalized using a fix station as a reference (e.g. George et al., 2007).
Several studies worldwide have used data from satellites such as NOAA-AVHRR, Landsat TM and ETM +, MODIS, ASTER (e.g. see Aniello et al., 1995; Valor et al., 2000; Voogt & Oke, 2003; Oltra-Carrió et al., 2010; Lin & Zhang, 2011). On the other hand, certain research focuses on determining and characterizing urban climate and urban heat islands (e.g. see Pérez et al., 2003; Rosenzweig et al., 2005; Wong & Yu, 2005; Chen et al., 2006; Santana, 2007; Yuan & Bauer, 2007). Specifically for Argentina, some studies have used satellite images for establishing thermal conditions
of green spaces (Ripoll et al., 2010); inferring urban air temperature from NDVI in San Juan (Cúnsulo et al., 2012) and establishing a thermal ranking of the different soil uses in the city of Cipolletti (Chiementon & Cogliati, 2011).
Few developments of equipment to record UHI has been made. Wong & Yu (2005) studied the UHI in Singapore. They used four stations located in cars for recording air temperature and relative humidity data. The designed study allowed them to related data obtained in different land cover types and environmental conditions. In contrast, Bertz et al. (2010) utilized a motion platform for studying the UHI stress in Rotterdam. This equipment is led by a bicycle circulating through previously defined transects.
The development of low-costs equipment capable of records high frequency measurements of UHI is necessary. In Argentina, there are several urban studies using traditional methods that unfortunately measure with long time inertial logs. Therefore, at the Argentine Institute of Oceanography a simple device was built that allows to measure different meteorological parameters with precision and high sampling frequency.
2 Methodology2.1 Instrumental Development
A simple device was developed to obtain geo-referenced data of several meteorological variables. The Urban Heat Island Device (from now on, UHID) is installed in vehicles and allows to measure the parameters in movement at a constant speed without stopping in a the different selected measuring sites. Because the recording is continuous the measurement time is reduced and permits to study UHI distribution of large cities. These abilities enable that UHID's information can be integrated with other method such as the one presented by Huang et al. (2010) that permit modeling urban land conservation using support vector machines for urban growth.
The equipment has sensors that register GPS information, air temperature, relative humidity, barometric pressure, wind speed and altitude above sea level (Table 1). The latter is determinated through barometric pressure measurements corrected with a fixed meteorological station located in the city to

72A n u á r i o d o I n s t i t u t o d e G e o c i ê n c i a s - U F R JISSN 0101-9759 e-ISSN 1982-3908 - Vol. 38 - 2 / 2015 p. 70-80
Application of Open Source Electronics for Studying High Frequency Urban Heat IslandFederico Ferrelli; Alejandro José Vitale & María Cintia Piccolo
compensate meteorological parameters variation during the sampling time. Sensors were integrated in an open electronic platform based on flexible and easy-to-use software and hardware (Arduino, Figure 1). The response time of the temperature sensor is less than 0.5 seconds and the relative humidity one was less than 1 second.
Parameters are measured in 2 Hz, achieving a high temporal and spatial frequency. The information is adequately tabulated. This feature permits that views and captures can be performed in any terminal program (Figure 2). The system is adaptable to use in a Bluetooth module, facilitating its operation in any vehicle (Shield Bluetooth). It is a standalone instrument and it is able to connect with mobile devices. UHID can be connected with Tablets and Smart phones through an On-The-Go USB (OTG). This characteristic permits that USB devices act as a host, allowing others USB devices (e.g. UHID) to attached to them. The OTG establishes a communication link between one controlling device and the UHID. The information can be registered using several UHID simultaneously and can be applied on any online map systems, also it is able to connect with 4G connectivity and send the information to a common server at the same time.
The UHID has the advantage of being a free availability device. It was developed on a platform of open codes based on flexible and easy-to-use electronic prototypes. Its micro-controller was programmed in Arduino that was available in open source license (http://www.arduino.cc/; Annex 1). The utilization of these types of open access tools was useful because they reduce development costs of scientific equipment and could help to generate networks to create new instruments.
Furthermore, the device is useful to be applied in micro-scale studies because it registers approximately 10 samples each 100 m. Few people is needed to perform the measurements therefore the operation costs are reduced. Also, geo-referenced data allows an easy integration in Geographical Information Systems (GIS). This option facilitates the incorporation of these information with other developed methods. On one hand, it can be mentioned the urban planning method by Köninger (1998). Moreover, the UHID's information could be linked with GIS as in the case of Barnard et al. (1998).
2.2 Application in Cities
Bahía Blanca is localized to the southwest of Buenos Aires province, Argentina. Its urban trees are discontinuous and sometimes nonexistent. The city has two principal parks: Parque de Mayo and Parque
Figure 1 Device connections.
Parameters Sensor Error
TemperatureNTC10K (B57871)
+/- 0.1 °C
Relative Humidity HIH 4000 +/- 2 %
Barometric Pressure BMP 085 +/- 0.3 Hpa.
Altitude above sea
levelBMP 085 +/- 1 m
GPSMEDIATEK
3329+/- 3 m
Table 1 Characterization of each sensor.
Figure 2 Data visualization in a terminal program. Lat: Latitude, Long: Longitude, Vel. km/h: Velocity km h-1, Dir º: Direction, RH: Relative Humidity, AT: Air Temperature, BP: Barometric Pressure, Alt.: Altitude.

73A n u á r i o d o I n s t i t u t o d e G e o c i ê n c i a s - U F R JISSN 0101-9759 e-ISSN 1982-3908 - Vol. 38 - 2 / 2015 p. 70-80
Application of Open Source Electronics for Studying High Frequency Urban Heat IslandFederico Ferrelli; Alejandro José Vitale & María Cintia Piccolo
Independencia and it is bisected by Naposta Grande river (Figure 3). Bahia Blanca has more than 300,000 inhabitants. The city has an important petrochemical plant and the second exportation-importation harbor of Argentina.
Urban transects were selected to analyzed the UHI in Bahia Blanca city (Figure 3). Results were normalized at 11 am local time using data from the meteorological station located in the city (Figure 3). The UHID was applied twice a month in the city during two years (2012-2014). Every measurement registers 25,000 samples of each parameter from both urban transects (Figure 3). In this study we presented the analysis of UHI in February 14th 2013 (summer) and June 6th 2013 (winter). Spatial variation of air temperature and relative humidity was analyzed in a longitude transect (points A and B) in order to relate these parameters with different urban soil covers (Figure 3).
Data was analyzed with the Software ArcGIS 9.3. Interpolation data was made by Ordinary Kriging
method with spherical model and 0.01 cell size. Food and Agriculture Organization of the United Nations (FAO) considered that this method is best suited for geo-sciences and has more applications in scientific fields such fisheries, forestry, civil engineering, image processing, mapping and meteorology.
3 Results3.1 Weather Conditions at the Fix Station
On February 14th, air temperature ranged from 19.9 ºC (7:05 am, local time) to 34.9 ºC (at 5:25 pm, local time) generating a daily amplitude of 15 ºC. Mean temperature was 25.4 ºC. The mean relative humidity was 38.7 % oscillating between 79 % (at 4:20 am local time) and 14 % (at 3:40-5 pm local time). Maximum wind speed was 10.3 km h-1 at 4:50 pm although almost all the measuring day registered calm condition. Mean wind speed was 2.7 km h-1. The most frequent wind direction was from the West (WSW, SW and W).
Figure 3 Location map of Bahía Blanca, Urban Transects, Port, Industrial and Green spaces, Meteorological station and Longitudinal transect.
74A n u á r i o d o I n s t i t u t o d e G e o c i ê n c i a s - U F R JISSN 0101-9759 e-ISSN 1982-3908 - Vol. 38 - 2 / 2015 p. 70-80
Application of Open Source Electronics for Studying High Frequency Urban Heat IslandFederico Ferrelli; Alejandro José Vitale & María Cintia Piccolo
In winter measurements (June 6th), the air temperature ranged from 0.9 ºC (at 8 am) to 16.9 ºC (at 4:10 pm) generating a daily amplitude of 16 ºC. Mean temperature was 9.5 ºC. Mean relative humidity was 54 % with the maximum 100 % at 1:00 am and the minimum 36 % at 4:00 pm. Mean wind speed was 3.4 km h-1 with the maximum value of 11.2 km h-1 at 11:20 pm. Calm conditions was present during the morning. The most frequent wind direction was from the North (N, NNE, NE, ENE).
3.2 Statistical and Spatial Analysis of Measured Data
The data was normalized with the information from the meteorological station located in the city (Figure 3). The mean temperature and relative humidity were obtained calculating the average value with the data obtained throughout the city. The UHID measurements on February 14th 2013 registered a maximum air temperature of 31.5 ºC and a minimum of 24.2 ºC. The intensity of UHI was 6.3 ºC (Difference between the maximum value in downtown and the one corresponding to the meteorological station). Relative humidity ranged from 29 % to 8 %. On the other hand, on June 6th air temperature oscillated between 15.4 ºC and 7.4 ºC with an intensity of UHI of 7.8 ºC. The mean relative humidity was 83.4 %, the maximum value was 90 % and the minimum one was 27 %.
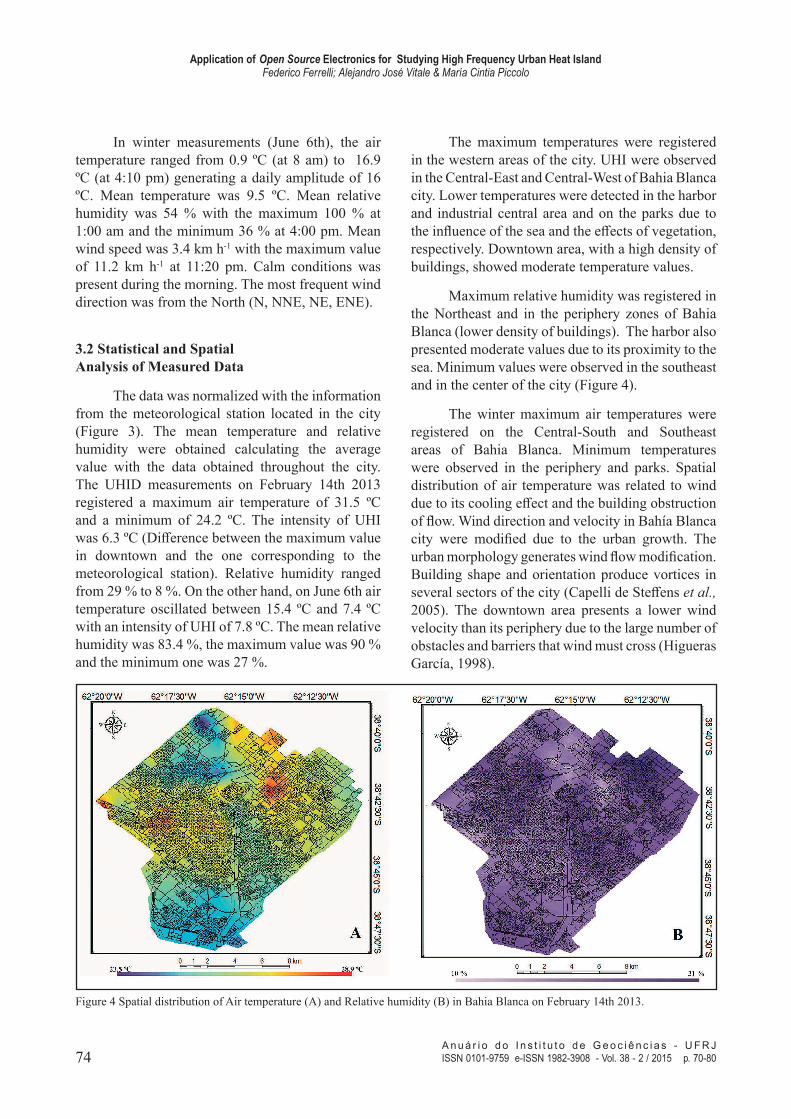
The maximum temperatures were registered in the western areas of the city. UHI were observed in the Central-East and Central-West of Bahia Blanca city. Lower temperatures were detected in the harbor and industrial central area and on the parks due to the influence of the sea and the effects of vegetation, respectively. Downtown area, with a high density of buildings, showed moderate temperature values.
Maximum relative humidity was registered in the Northeast and in the periphery zones of Bahia Blanca (lower density of buildings). The harbor also presented moderate values due to its proximity to the sea. Minimum values were observed in the southeast and in the center of the city (Figure 4).
The winter maximum air temperatures were registered on the Central-South and Southeast areas of Bahia Blanca. Minimum temperatures were observed in the periphery and parks. Spatial distribution of air temperature was related to wind due to its cooling effect and the building obstruction of flow. Wind direction and velocity in Bahía Blanca city were modified due to the urban growth. The urban morphology generates wind flow modification. Building shape and orientation produce vortices in several sectors of the city (Capelli de Steffens et al., 2005). The downtown area presents a lower wind velocity than its periphery due to the large number of obstacles and barriers that wind must cross (Higueras García, 1998).
Figure 4 Spatial distribution of Air temperature (A) and Relative humidity (B) in Bahia Blanca on February 14th 2013.

75A n u á r i o d o I n s t i t u t o d e G e o c i ê n c i a s - U F R JISSN 0101-9759 e-ISSN 1982-3908 - Vol. 38 - 2 / 2015 p. 70-80
Application of Open Source Electronics for Studying High Frequency Urban Heat IslandFederico Ferrelli; Alejandro José Vitale & María Cintia Piccolo
Relative humidity was maximum at North, East and Southeast areas of the city. Furthermore, as on summer measurements, lower values were observed in downtown where high density of buildings are found. Naturally, parks registered maximum values of relative humidity (Figure 5).
The selected longitudinal transect crosses four urban soil covers: Parks, Urban, Downtown and Urban sparse. The difference between Urban
and Urban Sparse is the building density. In the former, there are a large number of buildings, more concentrated, with few bare lands and paved streets. The latter represented a residential space, without low density of buildings, spaces without infrastructure and unpaved streets. The difference between Urban area and downtown is that the latter represents the historical downtown district, with very high density of buildings, constant flow of vehicles and pedestrian traffic and it is the commercial district (Figure 6).
Figure 5 Spatial distribution of Air temperature (A) and Relative humidity (B) in Bahia Blanca on June 6th 2014.
Figure 6 Longitudinal transect (Points A and B) and the distribution of air temperature and relative humidity on February and June 2014.

76A n u á r i o d o I n s t i t u t o d e G e o c i ê n c i a s - U F R JISSN 0101-9759 e-ISSN 1982-3908 - Vol. 38 - 2 / 2015 p. 70-80
Application of Open Source Electronics for Studying High Frequency Urban Heat IslandFederico Ferrelli; Alejandro José Vitale & María Cintia Piccolo
On the summer, relative humidity ranged from 26 % to 28 % and the air temperature ranged from 26.5 ºC to 29 ºC. Parks registered homogeneous temperature values and high relative humidity. In Downtown and Urban-sparse areas relative humidity was minimum (24 %). Also, air temperature was high in Downtown (29.8 ºC) and low in Parks (26.5 ºC).
In winter, the meteorological conditions were different. Air temperature and relative humidity did not present significant variation between soil covers. Despite this, maximum air temperature value was observed in Urban-sparse and minimum ones in Urban area. Relative humidity was high in Urban area (85 %) and low in Urban Sparse (79 %) (Figure 6).
4 Conclusion
We develop a simple device to study Urban Heat Islands. It was based on open source electronics and Software. It allows obtaining a high spatial and temporal frequency data. Also, this instrument permits to measure in a large spatial coverage reducing the working time as compared to traditional methods. The operating costs of this devise and data acquisition are low due to the simplicity of its construction and the little requirement in operation. These abilities allow integrating the measured urban weather information with the methods developed by other authors.
Preliminary results showed an improvement in relation with previous methods and studies. High sampling frequency with GPS and altitude data, enabled a better integration of the information. In Bahia Blanca, the UHI change according to the season. The spatial distribution of air temperature is closely associated to wind flow. On the other hand, relative humidity is low in the city and high in the Periphery and in the Industrial Plant and harbor due to the proximity of the estuary.
Finally, the application of the UHID permitted to obtain precise information of the Bahía Blanca urban environment in a micro-scale approach. The method is very useful to urban planning because measurements are very fast and accurate.
5 Acknowledgments
The authors would like to thanks to Intituto Argentino de Oceanografía - Consejo Nacional de
Investigaciones Científicas y Técnicas, (IADO-CONICET) and Universidad Nacional del Sur (UNS) for funding this research. Also to Centro de Recursos Naturales Renovables de la Zona Semiárida (CERZOS) for supplying meteorological data.
6 References
Alcoforado, M.J. & Andrade, H. 2006. Nocturnal urban heat island in Lisbon (Portugal): main features and modelling attempts. Theoretical and Applied Climatology, 84: 151-159.
Aniello C.; Morgan K.; Busbey A. & Newland N. 1995. Mapping micro-urban heat island using LANDSAT TM and a GIS. Comparative Geosciences, 21: 965-969.
Barnard, L.; Schmidt, B.; Streit, U. & Uhlenküken, C. 1998. Managing, modeling, and visualizing high-dimensional spatio-temporal data in an interated system. GeoInformatica, 2(1): 59-77.
Bertz H.; Heusinkveld, B.G.; Hove, L.W.A.; Jacobs, C.M.J.; Steeneveld, G.J.; Elbers, J.A.; Moors, E.J. & Holtslag, A.A.M. 2010. Use of a mobile platform for assessing urban heat stress in Rotterdam. In: PROCEEDINGS OF THE 7TH CONFERENCE ON BIOMETEOROLOGY. Berichte des Meteorologischen Instituts der Albert-Ludwigs-Universität Freiburg, 12-14 April 2010, p. 433 - 438.
Camilloni, I. & Barros V. 1997. On the urban heat island effect dependence on temperature trends. Climatic Change, 37: 665-681.
Capelli de Steffens, A.M.; Piccolo, M.C. & Campo de Ferreras, A.M. 2005. Clima urbano de Bahía Blanca, Argentina. Ed Dunken, 203 p.
Chandler, T.J. 1967. Absolute and relative humilities in towns. American Meteorology Society, 48: 394-399.
Chen, X.; Zhao, H.; Li, P. & Yin, Z. 2006. Remote sensing image-based analysis of the relationship between urban heat island and land use/cover changes. Remote Sensing of Environment, 104: 133-146.
Chiementon, M.E. & Cogliati M.G. 2011. Variaciones del uso del suelo en Cipolletti, Provincia de Río Negro, Argentina. Contribuciones Científicas GAEA, 23: 51-60.
Cúnsulo M.; Kurbán A. & Papparelli A. 2012. Inferencia de la temperatura del aire urbano a partir del NDVI utilizando imágenes satelitales. Avances en Energías Renovables y Medio Ambiente, 16: 11.01-11.07.
Figuerola, P. I. & Mazzeo N. A. 1998. Urban–rural temperature differences in Buenos Aires. Internacional Journal Climatology 18: 1709–1723.
George, K.; Ziska, L.H.; Bunce J.A. & Quebedeaux B. 2007. Elevated atmospheric CO2 concentration and temperature across an urban-rural transect. Atmospheric Environment, 41: 7654-7665.
Higueras García, E. 1998. Urbanísmo Bioclimático. Criterios medioambientales en la ordenación de asentamientos. Cuadernos de investigación urbanística. Instituto Juan de Herrera, 24, 80 p.
Huang, B.; Xie, C. & Tay, R. 2010. Support vector machines for urban growth modeling. GeoInformatica, 14: 83-99.
Jonsson, P.; Bernnet, C.; Eliasson, I. & Selin Lidgren, E. 2004. Suspended particulate matter and its relation to the urban climate in Dar es Salaam, Tanzania. Athmospheric

77A n u á r i o d o I n s t i t u t o d e G e o c i ê n c i a s - U F R JISSN 0101-9759 e-ISSN 1982-3908 - Vol. 38 - 2 / 2015 p. 70-80
Application of Open Source Electronics for Studying High Frequency Urban Heat IslandFederico Ferrelli; Alejandro José Vitale & María Cintia Piccolo
Environment, 38: 4175-4181.Kassomenos, P.A. & Katsoulis, B.D. 2006. Mesoscale and
macroescale aspects of the morning urban heat island around Athens, Greece. Meteorology and Atmospheric Physics, 94: 209-218.
Klysik, K. & Fortuniak, K. 1999. Temporal and spatial characteristics of the urban heat island of Lodz, Poland. Atmospheric Environment, 33: 3885-3895.
Kolokotsa, D.; Psomas, A. & Karapidakis, E. 2009. Urban heat island in southern Europe: the case of study of Hania, Crete. Solar Energy, 83: 1871-1883.
Köninger, A. 1998. 3D-GIS for urban purposes. GeoInformatica 2 (1): 79-103.
Lin L. & Zhang Y. 2011. Urban Heat Island Analysis using the Landsat TM data and ASTER data: A case study in Hong Kong. Remote Sensing, 3: 1535-1552.
Oliveira Moraes, N.; Morton E. & Gomes Pimentel, L.C. 2005. Simulações Numéricas da Formação de Ilha de Calor na Região Metropolitana do Rio de Janeiro. Anuário do Instituto de Geociências - UFRJ, 28(2): 116-138.
Oltra-Carrio R.; Sobrino J. A.; Gutiérrez-Angonese J.; Gioia A.; Paolini L. & Malizia A. 2010. Estudio del crecimiento urbano, de la estructura de la vegetación y de la temperatura de la superficie del Gran San Miguel de Tucuman, Argentina. Revista de Teledetección, 34: 69-76.
Pereira Sena, C.A.; Almeida França, J. R. & Farias Peres, L. 2014. Estudo da Ilha de Calor na Região Metropolitana do Rio de Janeiro Usando Dados do MODIS. Anuário do Instituto de Geociências - UFRJ, 37(2): 111-122.
Pérez González M.; García Rodríguez P. & Guerra Zaballos A. 2003. Análisis del clima urbano a partir de imágenes de satélite en el centro peninsular español. Anales de Geografía de la Universidad Complutense, 23: 187-206.
Ripoll M. V.; Kurbán A.; Papparelli A.; Cúnsulo M. & Roca G. 2010. Condiciones térmicas de un espacio verde urbano en clima árido. Avances en Energías Renovables y Medio Ambiente, 14: 11.09-11.15.
Rosenzweig C.; Solecki W. D.; Parshall L.; Chopping M.; Pope, G. & Goldberg R. 2005. Characterizing the urban heat island in current and future climates in New Jersey. Environmental Hazards, 6: 51–62.
Runnalls, K.E. & Oke T.R. 1998. The urban heat island of Vancouver, BC. Preprints, Second Urban Environment Symp, Albuquerque, NM, American Meteorological Society, p. 84–87.
Santana L. 2007. Landsat ETM+ image applications to extract information for environmental planning in a Colombian city. International Journal of Remote Sensing, 28: 4225-424.
Sakata, M.; Marumoto, K.; Narukawa, M. & Asakura, K. 2006. Regional variations in wet and dry deposition fluxes of trace elements in Japan. Atmospheric Environment, 40: 521-531.
Shashua-Bar, L.; Pearmutter, D. & Erell, E. 2009. The coding efficiency of urban landscape strategies in a hot dry climate. Landscape and Urban Planning, 92: 179-182.
Sundara Kumar, K.; Udaya Bhaskar P. & Padmakumari K. 2012. Estimation of land surface temperature to study urban heat island effect using Landsat ETM + image. International Journal of Engineering Science and Technology, 4: 771-778.
Tran, H.; Uchihama, D.; Ochi, S. & Yasuoka, Y. 2006. Assessment with satellite data of the urban heat island effects in Asian mega cities. International Journal of Applied Earth Observation, 1: 34-48.
Unger, J.; Gál T.; Rakanczai, J. et al. 2009. Modeling of urban heat island pattern based on the relationship between surface and air temperatures. Quarterly Journal of the Hungarian Meteorological Service, 114(4): 287-302.
Valor E.; Caselles V.; Coll C.; Sámchez F.; Rubio E. & Sospedra F. 2000. Análisis comparativo del efecto de la isla térmica de la ciudad de Valencia con imágenes TM, MUST y AVHRR. Revista de Teledetección, 14: 1-6.
Voogt J. K. & Oke T. R. 2003. Thermal remote sensing of urban climates. Remote Sensing of Environment, 86: 370-384.
Wong, N. & Yu, C. 2005. Study of green areas and urban heat island in a tropical city. Habitat International, 29: 547-558.
Yuan F. & Bauer M. 2007. Comparison of impervious surface area and normalized difference vegetation index as indicators of surface urban heat island effects in Landsat imagery. Remote Sensing of Environment, 106: 375-386.
Annex 1

78A n u á r i o d o I n s t i t u t o d e G e o c i ê n c i a s - U F R JISSN 0101-9759 e-ISSN 1982-3908 - Vol. 38 - 2 / 2015 p. 70-80
Application of Open Source Electronics for Studying High Frequency Urban Heat IslandFederico Ferrelli; Alejandro José Vitale & María Cintia Piccolo

79A n u á r i o d o I n s t i t u t o d e G e o c i ê n c i a s - U F R JISSN 0101-9759 e-ISSN 1982-3908 - Vol. 38 - 2 / 2015 p. 70-80
Application of Open Source Electronics for Studying High Frequency Urban Heat IslandFederico Ferrelli; Alejandro José Vitale & María Cintia Piccolo

80A n u á r i o d o I n s t i t u t o d e G e o c i ê n c i a s - U F R JISSN 0101-9759 e-ISSN 1982-3908 - Vol. 38 - 2 / 2015 p. 70-80
Application of Open Source Electronics for Studying High Frequency Urban Heat IslandFederico Ferrelli; Alejandro José Vitale & María Cintia Piccolo