anyanwu keynote developing knowledge for africas ec. advancement
TRANSCRIPT
African Development Bank Group
DEVELOPING KNOWLEDGE FOR
ECONOMIC ADVANCEMENT IN AFRICA
Prof. John C. AnyanwuLead Research Economist
Development Research DepartmentAfrican Development Bank
TRA, Tunis, Tunisia
* The views expressed here are those of the author and in no way reflect those of the AfDB and its Executive Directors.
KEYNOTE ADDRESS DELIVERED AT THE 2ND INTERNATIONAL CONFERENCE ON AFRICAN DIGITAL LIBRARIES AND ARCHIVES (ICADLA-2), JOHANNESBURG, SOUTH AFRICA, 17 NOVEMBER 2011

Outline of Presentation
I. BRIEF STYLIZED FACTS ON AFRICA’S ECONOMIC PERFORMANCE
II. A SNAPSHOT OF THE CONCEPT OF KNOWLEDGE AND ITS ROLE IN ECONOMIC ADVANCEMTENT
III. THE STATE OF KNOWLEDGE IN AFRICA
IV. RECOMMENDATIONS AND NEXT STEPS
V. CONCLUSION
2

OFFICE OF THE CHIEF ECONOMIST & VICE PRESIDENT, ECONDevelopment Research Department
African Development Bank Group

OFFICE OF THE CHIEF ECONOMIST & VICE PRESIDENT, ECONDevelopment Research Department
African Development Bank Group

OFFICE OF THE CHIEF ECONOMIST & VICE PRESIDENT, ECONDevelopment Research Department
African Development Bank Group

Comparative Global Competitiveness Index (GCI) Performance on Broad
Indices, 2010/2011
SUBINDEXES
GCI 2010-2011
Basic requirements Efficiency enhancers Innovation and sophistication
factors
Economy Score Score Score Score
North Africa 4.1 4.5 3.7 3.3
Sub-Saharan
Africa
3.5 3.7 3.4 3.1
BRICs 4.4 4.6 4.4 3.9
Latin America &
Caribbean
4.0 4.3 3.9 3.4
Southeast Asia 4.3 4.6 4.2 3.7
6
BRIEF STYLIZED FACTS ON AFRICA’S ECONOMIC PERFORMANCE
Source: WEF, WB and AfDB (2011)
Africa is less competitive than other regions
7
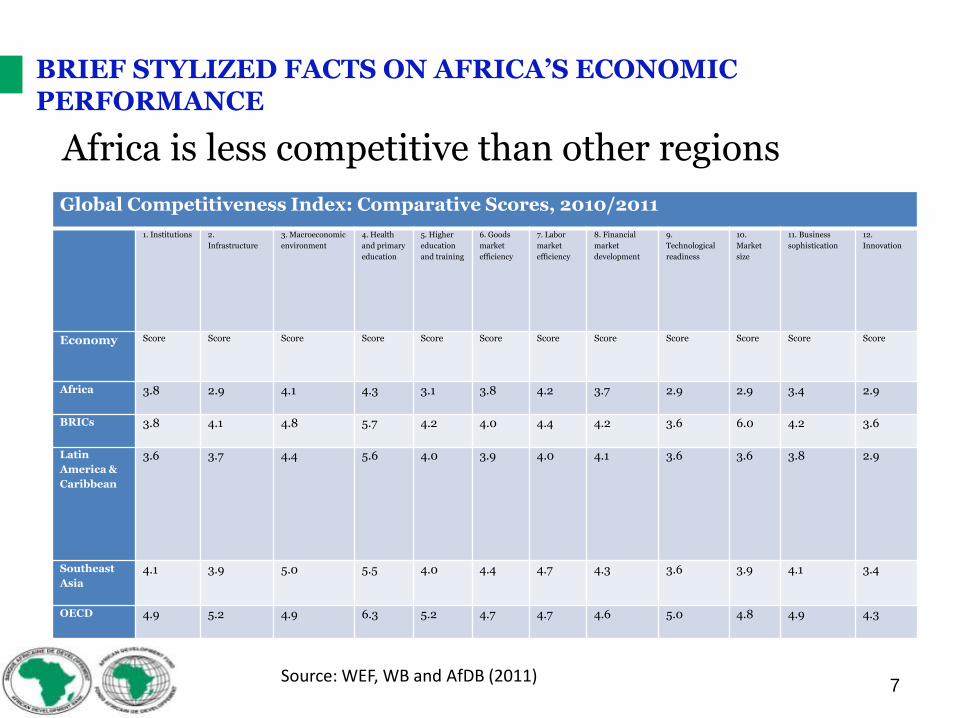
BRIEF STYLIZED FACTS ON AFRICA’S ECONOMIC PERFORMANCE
Source: WEF, WB and AfDB (2011)
Africa is less competitive than other regions
Global Competitiveness Index: Comparative Scores, 2010/2011
1. Institutions 2.
Infrastructure
3. Macroeconomic
environment
4. Health
and primary
education
5. Higher
education
and training
6. Goods
market
efficiency
7. Labor
market
efficiency
8. Financial
market
development
9.
Technological
readiness
10.
Market
size
11. Business
sophistication
12.
Innovation
Economy Score Score Score Score Score Score Score Score Score Score Score Score
Africa 3.8 2.9 4.1 4.3 3.1 3.8 4.2 3.7 2.9 2.9 3.4 2.9
BRICs 3.8 4.1 4.8 5.7 4.2 4.0 4.4 4.2 3.6 6.0 4.2 3.6
Latin
America &
Caribbean
3.6 3.7 4.4 5.6 4.0 3.9 4.0 4.1 3.6 3.6 3.8 2.9
Southeast
Asia
4.1 3.9 5.0 5.5 4.0 4.4 4.7 4.3 3.6 3.9 4.1 3.4
OECD 4.9 5.2 4.9 6.3 5.2 4.7 4.7 4.6 5.0 4.8 4.9 4.3
8
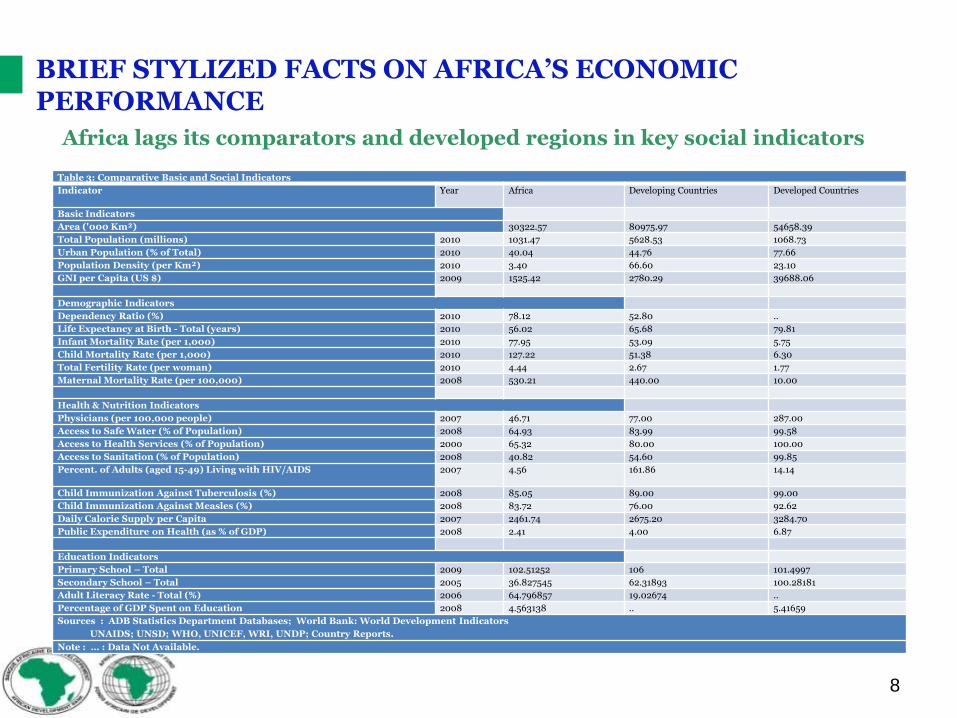
BRIEF STYLIZED FACTS ON AFRICA’S ECONOMIC PERFORMANCE
Africa lags its comparators and developed regions in key social indicators
Table 3: Comparative Basic and Social Indicators
Indicator Year Africa Developing Countries Developed Countries
Basic Indicators
Area ('000 Km²) 30322.57 80975.97 54658.39
Total Population (millions) 2010 1031.47 5628.53 1068.73
Urban Population (% of Total) 2010 40.04 44.76 77.66
Population Density (per Km²) 2010 3.40 66.60 23.10
GNI per Capita (US $) 2009 1525.42 2780.29 39688.06
Demographic Indicators
Dependency Ratio (%) 2010 78.12 52.80 ..
Life Expectancy at Birth - Total (years) 2010 56.02 65.68 79.81
Infant Mortality Rate (per 1,000) 2010 77.95 53.09 5.75
Child Mortality Rate (per 1,000) 2010 127.22 51.38 6.30
Total Fertility Rate (per woman) 2010 4.44 2.67 1.77
Maternal Mortality Rate (per 100,000) 2008 530.21 440.00 10.00
Health & Nutrition Indicators
Physicians (per 100,000 people) 2007 46.71 77.00 287.00
Access to Safe Water (% of Population) 2008 64.93 83.99 99.58
Access to Health Services (% of Population) 2000 65.32 80.00 100.00
Access to Sanitation (% of Population) 2008 40.82 54.60 99.85
Percent. of Adults (aged 15-49) Living with HIV/AIDS 2007 4.56 161.86 14.14
Child Immunization Against Tuberculosis (%) 2008 85.05 89.00 99.00
Child Immunization Against Measles (%) 2008 83.72 76.00 92.62
Daily Calorie Supply per Capita 2007 2461.74 2675.20 3284.70
Public Expenditure on Health (as % of GDP) 2008 2.41 4.00 6.87
Education Indicators
Primary School – Total 2009 102.51252 106 101.4997
Secondary School – Total 2005 36.827545 62.31893 100.28181
Adult Literacy Rate - Total (%) 2006 64.796857 19.02674 ..
Percentage of GDP Spent on Education 2008 4.563138 .. 5.41659
Sources : ADB Statistics Department Databases; World Bank: World Development Indicators
UNAIDS; UNSD; WHO, UNICEF, WRI, UNDP; Country Reports.
Note : … : Data Not Available.
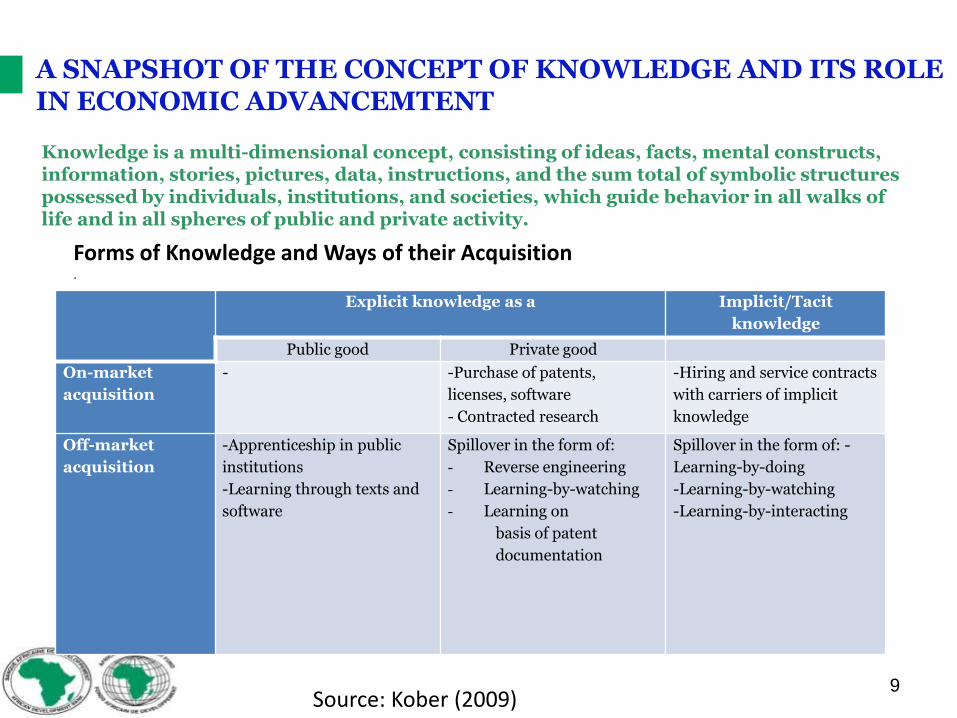
Explicit knowledge as a Implicit/Tacit
knowledge
Public good Private good
On-market
acquisition
- -Purchase of patents,
licenses, software
- Contracted research
-Hiring and service contracts
with carriers of implicit
knowledge
Off-market
acquisition
-Apprenticeship in public
institutions
-Learning through texts and
software
Spillover in the form of:
- Reverse engineering
- Learning-by-watching
- Learning on
basis of patent
documentation
Spillover in the form of: -
Learning-by-doing
-Learning-by-watching
-Learning-by-interacting
9
A SNAPSHOT OF THE CONCEPT OF KNOWLEDGE AND ITS ROLE IN ECONOMIC ADVANCEMTENT
Forms of Knowledge and Ways of their Acquisition.
Knowledge is a multi-dimensional concept, consisting of ideas, facts, mental constructs, information, stories, pictures, data, instructions, and the sum total of symbolic structures possessed by individuals, institutions, and societies, which guide behavior in all walks of life and in all spheres of public and private activity.
Source: Kober (2009)
10
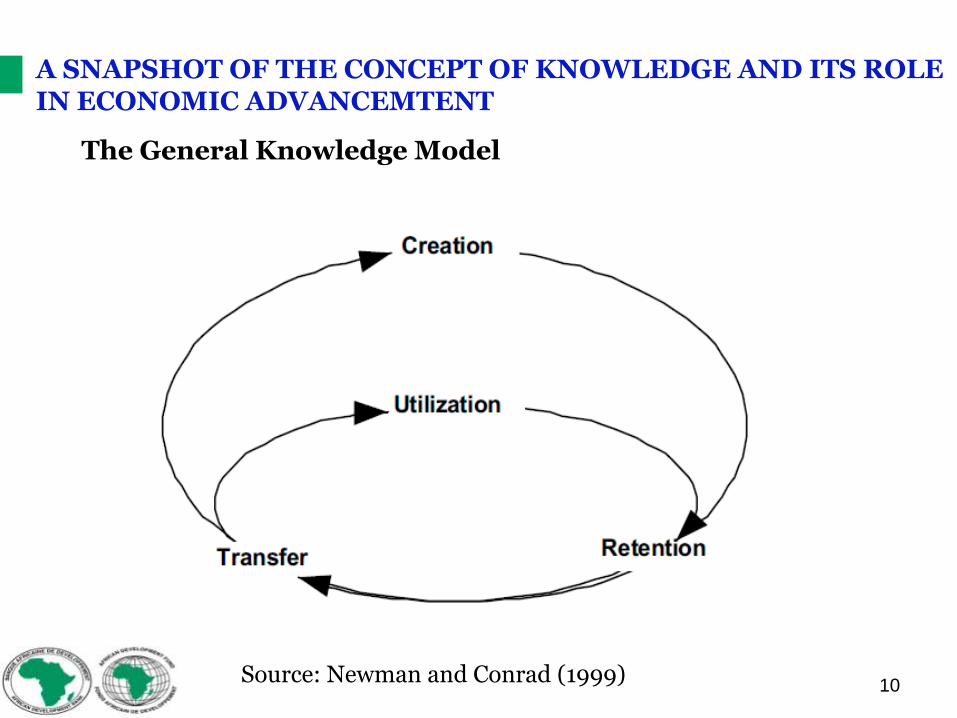
A SNAPSHOT OF THE CONCEPT OF KNOWLEDGE AND ITS ROLE IN ECONOMIC ADVANCEMTENT
Source: Newman and Conrad (1999)
The General Knowledge Model

• Relationships of Knowledge Index and Indicators
11
A SNAPSHOT OF THE CONCEPT OF KNOWLEDGE AND ITS ROLE IN ECONOMIC ADVANCEMTENT
Knowledge Index (KI)
Education Index Innovation Index ICT Index
Adult literacy rate
Secondary enrollment
Tertiary enrollment
R & D researchers
Patent count
Journal articles
Telephones Computers
Internet users
Source: Adapted from World Bank Institute (2007)
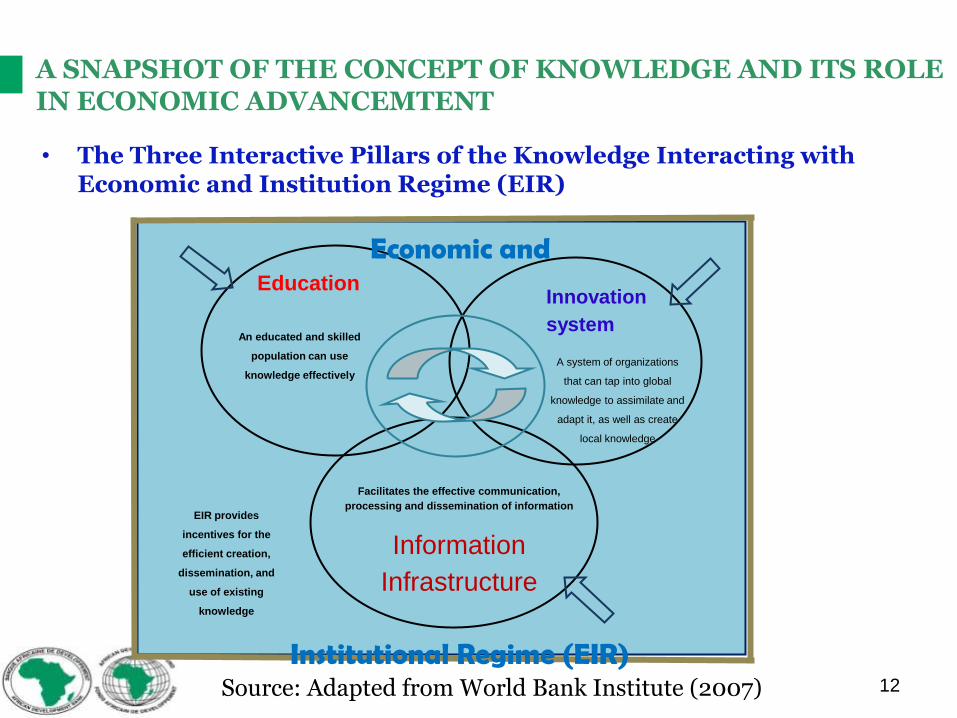
• The Three Interactive Pillars of the Knowledge Interacting with Economic and Institution Regime (EIR)
12
A SNAPSHOT OF THE CONCEPT OF KNOWLEDGE AND ITS ROLE IN ECONOMIC ADVANCEMTENT
Source: Adapted from World Bank Institute (2007)
Education
An educated and skilled
population can use
knowledge effectively
Innovation
system
A system of organizations
that can tap into global
knowledge to assimilate and
adapt it, as well as create
local knowledge
Facilitates the effective communication,
processing and dissemination of information
Information
Infrastructure
EIR provides
incentives for the
efficient creation,
dissemination, and
use of existing
knowledge
Economic and
Institutional Regime (EIR)
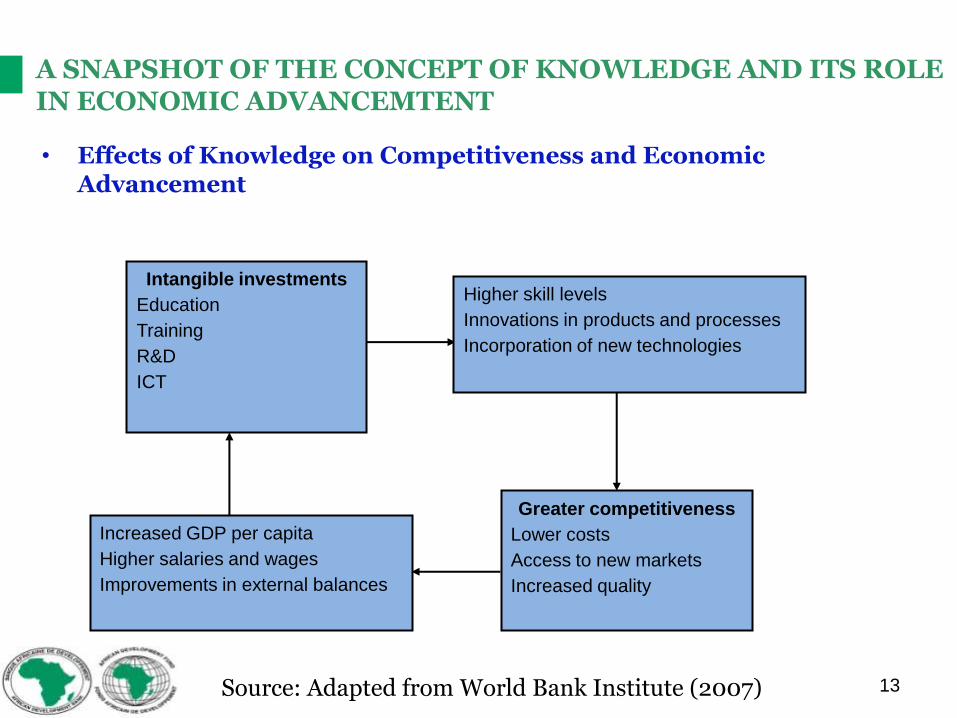
• Effects of Knowledge on Competitiveness and Economic Advancement
13
A SNAPSHOT OF THE CONCEPT OF KNOWLEDGE AND ITS ROLE IN ECONOMIC ADVANCEMTENT
Source: Adapted from World Bank Institute (2007)
Intangible investments
Education
Training
R&D
ICT
Higher skill levels
Innovations in products and processes
Incorporation of new technologies
Greater competitiveness
Lower costs
Access to new markets
Increased quality
Increased GDP per capita
Higher salaries and wages
Improvements in external balances

• Illustration of Knowledge as the Foundation of Economic Advancement: South Korea vs Ghana
14
A SNAPSHOT OF THE CONCEPT OF KNOWLEDGE AND ITS ROLE IN ECONOMIC ADVANCEMTENT
Source: Adapted from World Bank Institute (2007)

OFFICE OF THE CHIEF ECONOMIST & VICE PRESIDENT, ECONDevelopment Research Department
African Development Bank Group

OFFICE OF THE CHIEF ECONOMIST & VICE PRESIDENT, ECONDevelopment Research Department
African Development Bank Group
OFFICE OF THE CHIEF ECONOMIST & VICE PRESIDENT, ECONDevelopment Research Department
African Development Bank Group

OFFICE OF THE CHIEF ECONOMIST & VICE PRESIDENT, ECONDevelopment Research Department
African Development Bank Group

19
THE STATE OF KNOWLEDGE IN AFRICARetreating Knowledge in Africa
Western Europe G7
Europe and Central Asia East Asia and the Pacific
All Countries
Middle East and North Africa Latin America
Sub-Saharan Africa South Asia
High Income
Upper Middle Income
Lower Middle Income
Low IncomeAfrica
24
68
10
200
9
2 4 6 8 102000
Knowledge Index Fitted values
Knowledge Index: Relative Performance Over Time by Region and Income Group
Improvement
Regression

20
THE STATE OF KNOWLEDGE IN AFRICARetreating Knowledge in Africa
Algeria
Angola
Benin
Botswana
Burkina Faso
Cameroon
Cape Verde
Cote d'Ivoire
Djibouti
Egypt, Arab Rep.
Eritrea
Ethiopia
Ghana
Guinea
Kenya
Lesotho
Madagascar
MalawiMali
Mauritania
Mauritius
Morocco
Mozambique
Namibia
Nigeria
Rwanda
Senegal
Sierra Leone
South Africa
Sudan
Swaziland
Tanzania
Tunisia
UgandaZambia
Zimbabwe
12
34
5
2009
1 2 3 4 5 62000
KI Fitted values
Knowledge Index: Relative Performance Over Time
Improvement
Regression

OFFICE OF THE CHIEF ECONOMIST & VICE PRESIDENT, ECONDevelopment Research Department
African Development Bank Group

OFFICE OF THE CHIEF ECONOMIST & VICE PRESIDENT, ECONDevelopment Research Department
African Development Bank Group

OFFICE OF THE CHIEF ECONOMIST & VICE PRESIDENT, ECONDevelopment Research Department
African Development Bank Group

OFFICE OF THE CHIEF ECONOMIST & VICE PRESIDENT, ECONDevelopment Research Department
African Development Bank Group

OFFICE OF THE CHIEF ECONOMIST & VICE PRESIDENT, ECONDevelopment Research Department
African Development Bank Group

OFFICE OF THE CHIEF ECONOMIST & VICE PRESIDENT, ECONDevelopment Research Department
African Development Bank Group

OFFICE OF THE CHIEF ECONOMIST & VICE PRESIDENT, ECONDevelopment Research Department
African Development Bank Group

OFFICE OF THE CHIEF ECONOMIST & VICE PRESIDENT, ECONDevelopment Research Department
African Development Bank Group

OFFICE OF THE CHIEF ECONOMIST & VICE PRESIDENT, ECONDevelopment Research Department
African Development Bank Group

OFFICE OF THE CHIEF ECONOMIST & VICE PRESIDENT, ECONDevelopment Research Department
African Development Bank Group

31
THE STATE OF KNOWLEDGE IN AFRICAPositive Correlation between Knowledge and Current Economic Performance – Dominance of Advanced Economies
AlbaniaAlgeriaAngolaArgentina
AustraliaAustria
Azerbaijan
Bahrain
Bangladesh
Barbados
Belarus
Belgium
Benin BoliviaBosnia and HerzegovinaBotswana
Brazil Bulgaria
Burkina FasoCambodiaCameroon
Canada
Cape Verde
Chile
ChinaColombiaCosta RicaCote d'Ivoire
Croatia
Cyprus
Czech Republic
Denmark
DjiboutiDominicaDominican RepublicEcuadorEgypt, Arab Rep.El Salvador
Eritrea
Estonia
EthiopiaFiji
FinlandFrance
Georgia
Germany
Ghana
Greece
GuatemalaGuinea
GuyanaHonduras
Hong Kong, China
Hungary
Iceland
IndiaIndonesiaIran, Islamic Rep.
Ireland
Israel
Italy
Jamaica
Japan
JordanKazakhstan
Kenya
Korea, Rep.
Kuwait
Kyrgyz Rep.Lao PDR
LatviaLebanon
Lesotho
Lithuania
Luxembourg
Macedonia, FYRMadagascarMalawi
Malaysia
Mali
Malta
Mauritania
MauritiusMexico
MoldovaMongoliaMoroccoMozambique
NamibiaNepal
Netherlands
New Zealand
NicaraguaNigeria
Norway
Oman
Pakistan
PanamaParaguayPeru
Philippines
Poland
Portugal
Qatar
RomaniaRussian Federation
Rwanda
Saudi Arabia
SenegalSerbia
Sierra Leone
Singapore
Slovak Republic
Slovenia
South Africa
Spain
Sri LankaSudanSwaziland
Sweden
Switzerland
Syrian Arab RepublicTajikistanTanzaniaThailand
Trinidad and Tobago
TunisiaTurkey
Uganda Ukraine
United Arab Emirates United Kingdom
United States
Uruguay
Uzbekistan
Venezuela, RB
VietnamYemen, Rep.Zambia Zimbabwe0
2000
040
000
6000
080
000
1000
00
GD
P P
er C
apita
0 2 4 6 8 10Knowledge Index
GDP per capita (current US$)2009 Fitted values
Knowledge Index and GDP Per Capita in 2009

32
THE STATE OF KNOWLEDGE IN AFRICAClose correlation between the Knowledge Index and GDP per Capita in Africa
AlgeriaAngola
Benin
Botswana
Burkina Faso
Cameroon
Cape Verde
Cote d'IvoireDjibouti
Egypt, Arab Rep.
EritreaEthiopia
Ghana
GuineaKenyaLesotho
MadagascarMalawiMali
Mauritania
Mauritius
Morocco
Mozambique
Namibia
Nigeria
Rwanda
Senegal
Sierra Leone
South Africa
Sudan
Swaziland
Tanzania
Tunisia
Uganda
Zambia
Zimbabwe
0
2000
4000
6000
8000
GD
P P
er C
apita
1 2 3 4 5Knowledge Index
GDP per capita (current US$)2009 Fitted values
Knowledge Index and GDP Per Capita of African Countries in 2009

33
THE STATE OF KNOWLEDGE IN AFRICAClose correlation between the Knowledge Index and Economic Growth in Africa
AlgeriaAngola
Benin
Botswana
Burkina Faso
Cameroon
Cape VerdeCote d'Ivoire
Djibouti
Egypt, Arab Rep.
Eritrea
Ethiopia
Ghana
Guinea
KenyaLesotho
Madagascar
Malawi
Mali
Mauritania
Mauritius
Morocco
Mozambique
Namibia
Nigeria
Rwanda
Senegal
Sierra Leone
South Africa
Sudan
Swaziland
Tanzania
Tunisia
Uganda
ZambiaZimbabwe
-50
510
Rea
l GD
P G
row
th R
ate
(%)
1 2 3 4 5Knowledge Index
GDP growth (annual %)2009 Fitted values
Knowledge Index and Economic Growth of African Countries in 2009
34
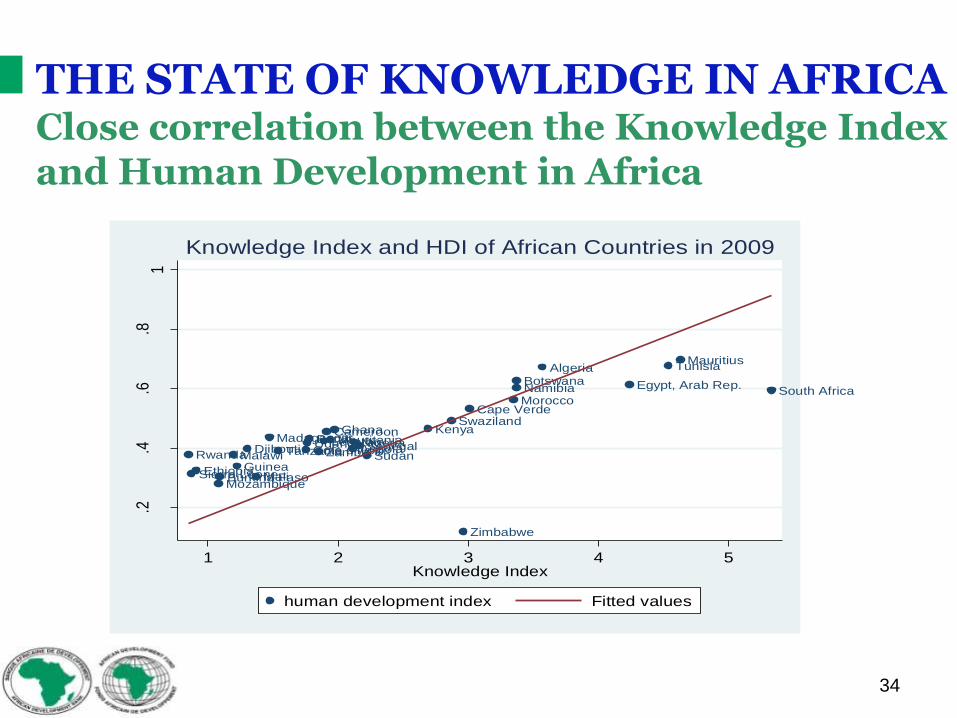
THE STATE OF KNOWLEDGE IN AFRICAClose correlation between the Knowledge Index and Human Development in Africa
Algeria
AngolaBenin
Botswana
Burkina Faso
Cameroon
Cape Verde
Cote d'IvoireDjibouti
Egypt, Arab Rep.
Ethiopia
Ghana
Guinea
KenyaLesothoMadagascar
Malawi
Mali
Mauritania
Mauritius
Morocco
Mozambique
Namibia
NigeriaRwanda
Senegal
Sierra Leone
South Africa
Sudan
Swaziland
Tanzania
Tunisia
UgandaZambia
Zimbabwe
.2.4
.6.8
1
Hum
an
De
velo
pm
ent I
nde
x
1 2 3 4 5Knowledge Index
human development index Fitted values
Knowledge Index and HDI of African Countries in 2009

OFFICE OF THE CHIEF ECONOMIST & VICE PRESIDENT, ECONDevelopment Research Department
African Development Bank Group

36
THE STATE OF KNOWLEDGE IN AFRICAKnowledge accumulation is associated with higher rates of future per capita GDP in Africa
AlgeriaAngola
Benin
Botswana
Burkina Faso
Cameroon
Cape Verde
Côte d’IvoireDjibouti
Egypt
EritreaEthiopia
Ghana
Guinea
KenyaLesotho
Madagascar
Malawi
Mali
Mauritania
Mauritius
Morocco
Mozambique
Namibia
Nigeria
Rwanda
Senegal
Sierra Leone
South Africa
Sudan
Swaziland
Tanzania
Tunisia
Uganda
Zambia
Zimbabwe
56
78
91
0
Pe
r C
ap
ita G
DP
in 2
005
-20
09
0 .5 1 1.5 2Knowledge Index in 2000
(mean) lgdppc20052009 Fitted values
Knowledge Index in 2000 and Per Capita GDP of African Countries in 2005-2009
R2=0.82

37
THE STATE OF KNOWLEDGE IN AFRICAA one-unit improvement in the KI leads to an increase of 0.90 percentage point in per capita GDP
Variable Coefficient
KI2000
Investment rate
Trade openness
Share of urban population
Inflation rate
Constant
0.899
(2.76**)
0.872
(1.87*)
0.366
(1.33)
0.516
(2.54**)
0.032
(0.26)
0.426
(0.29)
Simple Regression of the Effect of Knowledge on Future per Capita GDP, Dependent Variable is per Capita GDFP in 2005-2009
** Significant at 5% significant level; * significant at 10% significant level.

• Developing Educated and Skilled Workers
Creating a culture of continuous learning and openness to new ideas is critical for creating a knowledge-based economy in Africa.
Setting up a computer-based functional literacy (CBFL) program to arrest adult illiteracy.
Investing in hiring more qualified teachers and improved pupil-teacher ratios in schools.
A new system to focus on learning, rather than on schooling, and promote creativity.
38
RECOMMENDATIONS AND NEXT STEPS

• Developing Educated and Skilled Workers
Drastically upgrading higher education -improved training programs and closer links between tertiary and vocational educational institutions o as well as private sector.
Emphasize the enrolment and teaching of sciences, math, and engineering technology
Stronger university-industry linkages
Increased involvement of the private sector, Missions and NGOs – including PPPs in education provision
39
RECOMMENDATIONS AND NEXT STEPS

• Creating an Efficient Innovation System
Increasing R&D investment; strengthening African countries’ R&D infrastructure, developing technological innovations and altering the mind-set of its people toward better creation, acquisition, and use of technology
40
RECOMMENDATIONS AND NEXT STEPS
Impact on national
economy and society
Investments Results Direct effects
Renewing business
structure
Affluence
Regional vitality
Employment
Environment and health
Security and safety
Social well-being
Start-ups, new
business areas
and services
Growth and
globalization of
companies
Productivity
Competence
New knowledge
New business models
Networking
Innovations: products
and services, methods
and processes,
organizational
innovations
R&D
investment
• Creating an Efficient Innovation System
Innovation policies and increased R&D investments are needed in each country in addition to regional strategies
Science and Technology Councils are necessary at the Presidency or Prime Minister levels
Collaboration and linkages among local firms, universities, and research institutes and the worldwide R&D network of multinationals
Leveraging abundant Diaspora knowledge
41
RECOMMENDATIONS AND NEXT STEPS
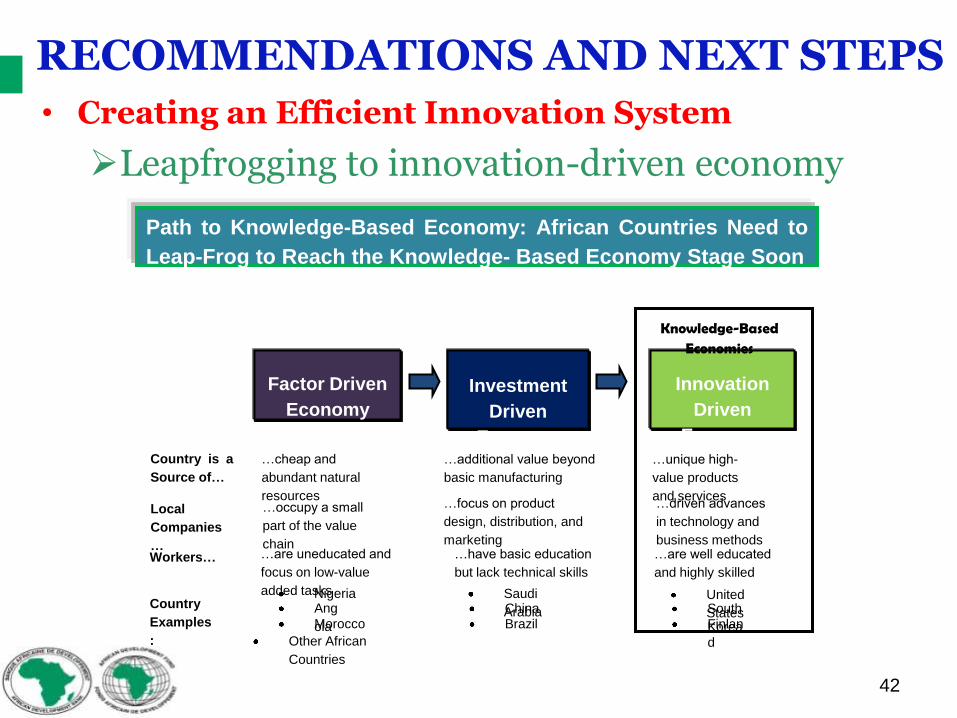
• Creating an Efficient Innovation System
Leapfrogging to innovation-driven economy
42
RECOMMENDATIONS AND NEXT STEPS
Path to Knowledge-Based Economy: African Countries Need to
Leap-Frog to Reach the Knowledge- Based Economy Stage Soon
Factor Driven
Economy
Investment
Driven
EconomyCountry is a
Source of…
Innovation
Driven
Economy
Knowledge-Based Economies
…cheap and
abundant natural
resources
…additional value beyond
basic manufacturing
Local
Companies
…
…occupy a small
part of the value
chain
…focus on product
design, distribution, and
marketing
Workers… …are uneducated and
focus on low-value
added tasks
…have basic education
but lack technical skills
Country
Examples
:
NigeriaAng
olaMorocco
Other African
Countries
Saudi
ArabiaChina
Brazil
…unique high-
value products
and services…driven advances
in technology and
business methods…are well educated
and highly skilled
United
StatesSouth
KoreaFinlan
d

• Creating an Efficient Innovation System
Establishment of science and technology parks
Encouraging venture capital development and angel funds
Develop communication and other infrastructure for R&,
Creating an attractive environment to motivate R&D investments, including favorable tax, and other incentives.
43
RECOMMENDATIONS AND NEXT STEPS
• Creating an Efficient Innovation System
Attracting more foreign direct investment (FDI)
Changing the way students are trained–-a process that will require changes in the education system, labor markets, and government policies
Establishing incubators
44
RECOMMENDATIONS AND NEXT STEPS

• Building a dynamic information infrastructure
Having national and regional ICT Plans (including broadband plans) with a Digital Agenda
Improving the overall environment for innovation and ICT
Establishing an innovation-friendly environment and setting the ICT vision for the future
Providing firms and consumers with incentives to extract value from the use of broadband
45
RECOMMENDATIONS AND NEXT STEPS
• Building a dynamic information infrastructure
Efficiently allocating assets that the public sector controls or influences
Encouraging the deployment, adoption, and use of broadband in areas where the market alone is not enough
Ensuring robust competition in telecommunications, including digital democracy
Ensuring robust competition (including privatization) in the power sector
46
RECOMMENDATIONS AND NEXT STEPS
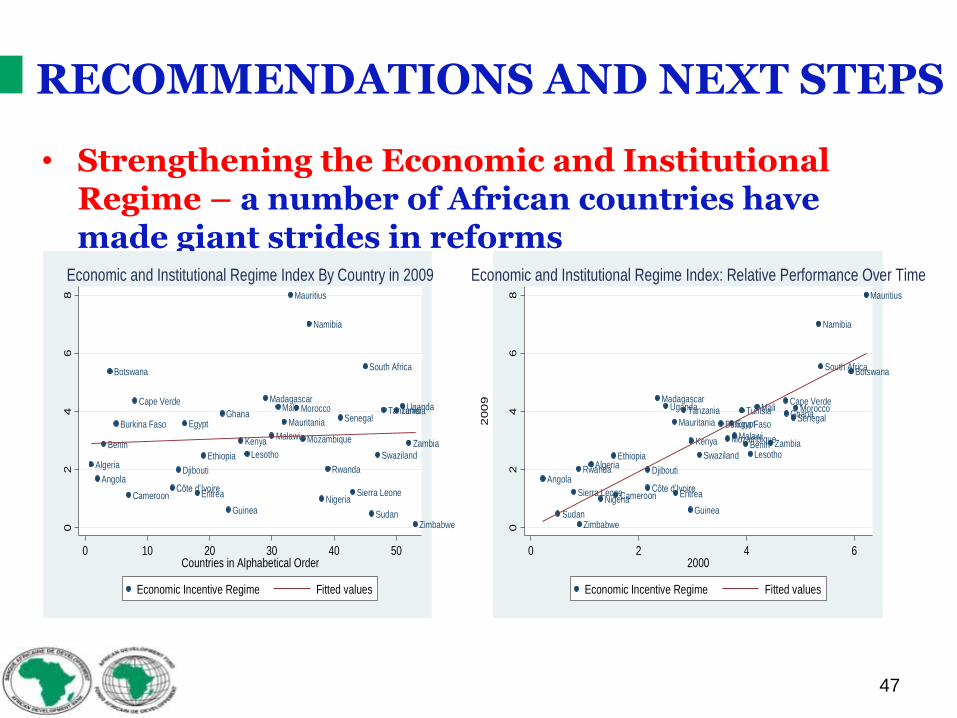
• Strengthening the Economic and Institutional Regime – a number of African countries have made giant strides in reforms
47
RECOMMENDATIONS AND NEXT STEPS
Algeria
Angola
Benin
Botswana
Burkina Faso
Cameroon
Cape Verde
Côte d’Ivoire
Djibouti
Egypt
Eritrea
Ethiopia
Ghana
Guinea
Kenya
Lesotho
Madagascar
Malawi
Mali
Mauritania
Mauritius
Morocco
Mozambique
Namibia
Nigeria
Rwanda
Senegal
Sierra Leone
South Africa
Sudan
Swaziland
TanzaniaTunisiaUganda
Zambia
Zimbabwe02
46
8
Eco
no
mic
an
d In
stitu
tion
al R
eg
ime
Ind
ex in
200
9
0 10 20 30 40 50Countries in Alphabetical Order
Economic Incentive Regime Fitted values
Economic and Institutional Regime Index By Country in 2009
Algeria
Angola
Benin
Botswana
Burkina Faso
Cameroon
Cape Verde
Côte d’Ivoire
Djibouti
Egypt
Eritrea
Ethiopia
Ghana
Guinea
Kenya
Lesotho
Madagascar
Malawi
Mali
Mauritania
Mauritius
Morocco
Mozambique
Namibia
Nigeria
Rwanda
Senegal
Sierra Leone
South Africa
Sudan
Swaziland
Tanzania TunisiaUganda
Zambia
Zimbabwe02
46
8
200
9
0 2 4 62000
Economic Incentive Regime Fitted values
Economic and Institutional Regime Index: Relative Performance Over Time

• Strengthening the Economic and Institutional Regime
Consolidating macroeconomic stability;
Strengthening banking systems to enhance domestic resource mobilization;
Developing capital markets by improving the regulatory framework, reforming labor market practices;
Accelerating the pace of privatization and broadening the domestic investor base.
measures to attract larger volumes of foreign private capital inflows.
48
RECOMMENDATIONS AND NEXT STEPS

• Strengthening the Economic and Institutional Regime
Reforming and strengthening judicial and legal systems and putting in place effective and transparent regulatory frameworks
Physical infrastructure (including ICT infrastructure) development
Strengthening governance through the development of participatory decision-making processes
Improving public service delivery, strengthening capacities, and ensuring greater accountability and transparency in public administration.
49
RECOMMENDATIONS AND NEXT STEPS
• More than money, needed: political, commitment, transparency & accountability, collaborative spirit to formulate the requisite policies, strategies, plans and collective action as well as the institutional changes needed for leapfrogging to a knowledge-based and innovation-driven economy for economic advancement of Africa.
• African countries to redouble their efforts to mobilize domestic revenues
• Leveraging resources from emerging partners like the BRICs
• Conference to provide answers to key digitization questions
• Africa is reborn with a new optimistic face & at a turning point, in spite of challenges.
50
CONCLUSION

Thank you for Your Kind Attention
51