“evaluation of smile esthetics using dimensional … · evaluating facial esthetics. therefore,...
TRANSCRIPT

“EVALUATION OF SMILE ESTHETICS USING DIMENSIONAL
ANALYSIS – AN IN VIVO STUDY.”
Dissertation submitted to
THE TAMILNADU Dr. M.G.R. MEDICAL UNIVERSITY
In partial fulfillment for the Degree of
MASTER OF DENTAL SURGERY
BRANCH V
DEPARTMENT OF ORTHODONTICS AND DENTOFACIAL ORTHOPED ICS
2015-2018

CERTIFICATE
This is to certify that the dissertation titled “AN EVALUATION OF SMILE
ESTHETICS USING DIMENSIONAL ANALYSIS – AN IN VIVO S TUDY” is a bonafide
work done by DR. NEERAJA KURUP under my guidance during her postgraduate study period
between 2015 – 2018.
This dissertation is submitted to THE TAMILNADU Dr. M.G.R. MEDICAL
UNIVERSITY , in partial fulfillment for the degree of Master of Dental Surgery in Branch V-
Orthodontics and Dentofacial Orthopedics.
It has not been submitted (partially or fully) for the award of any other degree or diploma.
DR. R. K. VIJAYAKUMAR, MDS DR. V.PRABHAKAR, MDS
Guide and HOD Principal
Department of Orthodontics Sri Ramakrishna Dental College and
Sri Ramakrishna Dental College and Hospital, Hospital, Coimbatore.
Coimbatore.
Date:
Place: Coimbatore
DECLARATION BY THE CANDIDATE
NAME OF THE CANDIDATE Dr. Neeraja Kurup
TITLE OF DISSERTATION Evaluation of smile esthetics using
dimensional analysis – An In Vivo Study
PLACE OF STUDY Sri Ramakrishna Dental College and Hospital
DURATION OF COURSE 2015-2018
NAME OF GUIDE Dr. R K Vijayakumar
HEAD OF THE DEPARTMENT Dr. R K Vijayakumar
I hereby declare that no part of the dissertation will be utilized for gaining financial
assistance for research or other promotions without obtaining prior permission from the Principal,
Sri Ramakrishna Dental College and Hospital. In addition, I declare that no part of this work will
be published either in print or electronic without permission from the guide who has been actively
involved in the dissertation. The author solely has the rights for publishing the work with prior
permission from Principal, Sri Ramakrishna Dental College and Hospital, Coimbatore.
Principal Signature of Candidate
Sri Ramakrishna Dental College and Hospital
Coimbatore

CERTIFICATE
This is to certify that the dissertation work titled “An evaluation of smile esthetics using
dimensional analysis – An In Vivo Study” of the candidate Dr. Neeraja Kurup with registration
number 241519352 for the award of Masters of Dental Surgery in the Branch of Orthodontics
and Dentofacial Orthopedics. I personally verified the urkund.com website for the purpose of
Plagiarism check. I found that the uploaded thesis file contains from introduction to conclusion
pages and results shows 1 percentage of plagiarism in the dissertation.
Guide and Supervisor sign with Seal
ACKNOWLEDGEMENT
First and foremost I would like to thank my father, JagadeendraNatha Kurup; my mother,
Jayalekshmi Kurup for having raised me to the present situation with great efforts, pain,
sacrifices, their unceasing prayers, hard work and immense love. Without them, this would have
not been possible.
I thank Lord Almighty for showering his blessings upon me infinitely at all times.
I consider it my honour to have Dr. R.K Vijayakumar , as my Guide and the Head of the
Department. I am immensely pleased to place on record my gratitude and heartfelt thanks to Sir
for his valuable advice in regard to this dissertation and during the course of my study.
I am very much thankful to Dr. Jagdeep Raju, for all his valuable suggestions during the course
of my dissertation work.
I am thankful to Dr. Pradeep Kumar, for his help and ideas that he has shared with me during
the course of my dissertation work.
I would like to express my gratitude to Dr. Fayyaz Ahmed, Dr. Aprose Khanna, Dr. Dhivya
Kanya for their continuous support and encouragement.
I would like to extend my wholehearted appreciation to my colleagues, Dr. Indra, Dr. Bava,
Dr.Sangeeth, Dr. Khaniya, Dr. Yaseen, Dr. Mohnish, Dr. Sindhu, Dr. Ananthi, and Dr.
Shamara; who have always shared their ideas and helped me work at my maximum potential.
At this juncture, I’d like to thank my friend Dr. Megha Madhusoodhanan for extending her
whole hearted support to me at all times.
I am grateful to our beloved Director Lt.Gen.(Dr) Murali Mohan and Principal Dr. V.
Prabhakar for their kind help and cooperation in completing this work.
I thank all the students of Sri Ramakrishna Dental College who were part of my
research for their patient cooperation throughout the study.
I thank Dr. Sekkizhar, Assistant Professor, P.S.G. institute of Management Studies for guiding
me with the statistics.
I thank my fiancée Dr. Kannan Venugopal, for being my pillar of strength and for all the genuine
support and encouragement to help me finish this dissertation work. I cannot forget to mention my
sister and my niece who have helped me during course of my study.
A heartfelt thanks to my beloved Grandparents without whose immense blessings and love I
wouldn’t have been what I am today.
In the event that I have failed to mention someone, the fault is all mine and your efforts are not in
the least unappreciated. Last but not the least I would like to thank all those who have directly or
indirectly helped me complete this dissertation work.

CONTENTS
1. INTRODUCTION 1
2. REVIEW OF LITERATURE 3
3. MATERIALS AND METHODOLOGY 16
4. RESULTS 32
5. DISCUSSION 72
6. SUMMARY AND CONCLUSION 81
7. BIBLIOGRAPHY 84


INTRODUCTION

INTRODUCTION
Face depicts the overall attractiveness of an individual in which smile forms a fundamental
role1. A Smile is an individual’s ability to express their emotion and is the sum of many attributes2.
The value of an attractive smile is indubitable. A smile is considered the universal friendly gesture
in all cultures. An attractive smile in modern society is often considered an asset in interviews,
work settings and social interactions3. Smile esthetics has become a primary concern for patients
and orthodontists, because it is a primary reason for which patients seek orthodontic treatment4.
Social perception of esthetics is the most valuable tool for assessing overall facial
attractiveness. Facial attractiveness is best defined by an attractive smile. Hence achieving the best
smile has often been very challenging for Orthodontists5. An esthetic smile is a result of various
components acting in unison with perfect balance of musculature and teeth. Therefore establishing
ideal esthetics may be obstinate and requires tedious planning6. A number of variables affects the
attractiveness of smile which in turn influences the overall facial attractiveness7. Various authors
have contributed to the field of smile esthetics, however very few emphasizes the importance of
smile in all three planes of space8.
The subjectivity of beauty makes it difficult to establish clear cut esthetic goals for
diagnosis and treatment planning. It is often possible to formulate guidelines to optimize
dentofacial esthetics while still satisfying other goals9. Major arena of research interest in terms
of smile esthetics have been confined to analysis of various attributes of smile in frontal view. To

our knowledge, no studies has considered the difference in perception of smile esthetics from
frontal and profile view shot simultaneously. This factor is addressed in this study.
Havens et al10 reported that tooth alignment is a more important factor than the eyes for
evaluating facial esthetics. Therefore, contemporary orthodontists must consider esthetic smiles
by managing the dentition and soft tissues. In clinical orthodontics, patient-driven esthetic
diagnosis and treatment planning have become important. Thus, smile analysis has become an
essential element of diagnosis and treatment planning. The necessity to conduct this study is to
find a correlation, if any between subjective and objective assessments of smile. In order to record
the posed smile from frontal and profile view, digital cameras were used which were placed at
right angles to each other a fixed predetermined distance from the sample. 11
Hence the aim of this study was to evaluate smile esthetics in all three planes of space and
to relate it to overall facial attractiveness. The uniqueness of this study is the use of two digital
cameras for recording smile simultaneously from frontal and profile view. Subjective and objective
assessment of posed smile are done on the samples.
REVIEW OF LITERATURE

REVIEW OF LITERATURE
B. L Herzberg et al(1952)12 made an effort to show definite landmarks or features to be
examined in faces so that treatment may be planned accordingly with the thought in mind of not
distorting favorable facial esthetics and of improving poorly balanced faces. He states that not only
does the orthodontist align teeth, but he can and does frequently improve the functional values of
denture, the health of the teeth and soft tissues and created harmony of facial features where
disharmony and imbalance previously existed. The role of orthodontists is not to make the tooth
straighter, but rather that of the dentofacial orthopedist.
Harvey Peck and Sheldon Peck et al (1970)13 reviewed many refined concepts of facial
esthetics from ancient Egypt through the Renaissance and Western civilization recorded in
sculpture. They mentioned that society today possess ideals of facial esthetics and the disciplines
of psychology and sociology helps in identifying popular esthetic preferences. It was also stated
that the orthodontic community has neglected to study the publics esthetic view point.
Ernst K. Janzen et al (1977)14states that the primary treatment goal in orthodontics is to
produce a well-balanced functional occlusion. However, a well-balanced smile is an additional,
most important treatment objective. A proper evaluation of facial esthetics requires careful clinical
inspection of the patients smile before treatment commences. The ultimate position of anterior
teeth has a great influence on the relationship of the lips to each other and to the surrounding and
underlying facial structures. The teeth should be moved with one mode of movement in a direct
vector line, avoiding “round tripping” as much as possible. Improved facial balance during smiling
is an essential treatment objective and adds an important dimension to successful orthodontic
treatment.

T.G. Matthews et al (1978)15 stated that the anatomy of the smile is an integral part of
dentistry. Its understanding involves close scrutiny of all elements of the oral region. It is not
enough to establish the size of teeth based on the high and low lip lines, size of the mouth, and a
shade to blend with the age and complexion. To create a harmonious smile the dentist must
maintain or create the normal curvature of the lips, proper exposure of the red zone of the lips, an
undistorted philtrum, and undisturbed nasolabial grooves. These entities, maintained in harmony
with the exposed teeth, constitute the anatomy of a smile.
Sheldon Peck et al (1992)16 stated that the biological mechanism underlying gingival
smile line appears to include the combined effects of several variables like anterior maxillary
excess of 2 – 3 mm additionally, greater muscular capacity to raise the upper lip on smiling and
supplemental associated factors, including excessive overjet, excessive interlabial gap at rest and
excessive overbite.
Ronald J. Mackley et al (1992)17 stated that a profile photo is not a reliable source of
information to determine what a person’s actual smile looks like. To maximize the potential for
improving smile, one must include into treatment plan, an objective to move the anterior teeth
vertically to improve their relationship to smiling lip line.
Julie C. Faure et al (2002)18 evaluated the effect of facial symmetry and inter-ocular
distance on the assessment of facial aesthetics, factors that are often suggested as major
contributors to facial aesthetics and concluded that symmetry and inter ocular enlargement had a
negative effect on facial esthetics.
Marc B. Ackerman and James L. Ackerman et al (2002)19 stated that smile analysis and
smile design generally involve a compromise between two factors that are often contradictory: the
esthetic desires of the patient and orthodontist, and the patient’s anatomic and physiologic
limitations. Using digital video and technology, the practitioner can evaluate the patient’s dynamic
anterior tooth display and incorporate smile analysis into routine day practice. Esthetic smile
design is a multifactorial decision-making process that allows the clinician to treat patients with
an individualized, interdisciplinary approach.
Orlagh Hunt et al (2002)20 found that the attractiveness of a person’s smile is influenced
by the amount of maxillary gingival exposure. More attractive ratings were awarded to those
smiles where the amount of gingival exposure was within the range of 0–2 mm.
David M. Sarver and Marc B.Ackerman et al (2003)21 stated that the “art of the smile”
lies in the clinician’s ability to recognize the positive elements of beauty in each patient and to
create a strategy to enhance the attributes that fall outside the parameters of the prevailing esthetic
concept. New technologies have enhanced our ability to see patients better and had facilitated the
quantification and interaction of newer concepts of function and appearance. Visualization and
quantification of the dynamics of the smile is a 2-stage process. The first crucial step is the clinical
examination. The key element in this evaluation is the direct measurement of lip–tooth
relationships both dynamically and in repose. Record taking is the second step in this process.
David M. Sarver and Marc B.Ackerman et al (2003)22 discussed a comprehensive
methodology for recording, assessing, and planning treatment of the smile in 4 dimensions.
Orthodontic history, beginning with Angle and Wuerpel, has taught us that the “art of the smile”
lies in the clinician’s ability to recognize the positive elements of beauty in each patient and then
create a strategy to enhance the attributes that fall outside the parameters of the prevailing esthetic
concept. The difference between contemporary orthodontic practice and that of our predecessors
is that we now can dynamically visualize and quantify our patients’ smiles. Orthodontic diagnosis
has, in a certain sense, come full circle.

Jenny R. Maple et al (2005)28 evaluated the perception of facial attractiveness in profile
digital photographs that were incrementally altered to produce different combinations of
mandibular anteroposterior positions and lower anterior facial heights. Interactions of the
anteroposterior and vertical dimensions and the magnitude of these changes in each dimension
influence the perception of facial attractiveness; the more extreme deviations that result in the
vertical dimension accentuating the horizontal dimension toward an extreme Class II or Class III
were scored as the least attractive.
Roy Sabri et al (2005)23 stated that an optimal smile is characterized by an upper lip that
reaches the marginal ginigiva, with an up or straight curvature between the philtrum and
commissures; an upper incisal line which is coincident with the border of the lower lip; minimal
or no lateral negative space; a commissural line and occlusal frontal plane parallel to the pupillary
line; and pleasantly integrated dental and gingival components. These concepts of smile esthetics
are not new, but are too often overlooked in orthodontic treatment planning. The eight components
of the smile should be considered not as rigid boundaries, but as artistic guidelines to help
orthodontists treat individual patients who are today, more than ever, highly aware of smile
esthetics.
Steven J. Lindauer et al (2005)24 had studied the effects of two common procedures used
to correct deep overbite due to the assumption that overbite correction, specifically maxillary
incisor intrusion, will lead to smile arc flattening and consequently reduce smile attractiveness.
The results of their study suggested that straightening of the smile arc is a common occurrence
during orthodontic treatment and not necessarily related to maxillary incisor intrusion.

Theodore Moore et al (2005)26 stated that having minimal buccal corridors is a preferred
esthetic feature in both men and women, and large buccal corridors should be included in the
problem list during orthodontic diagnosis and treatment planning.
Erdal Isıksal et al (2006)27 stated that subjects with ideal occlusions and Class I patients
treated with or without extractions were not differentiated in smile esthetics by 6 panels of judges
(orthodontists, plastic surgeons, artists, general dentists, dental professionals, and parents).
Transverse characteristics of the smile appeared to be of little significance to an attractive smile.
Maxillary gingival display and the ultimate positions of the anterior teeth have definite effects on
smile esthetics. Treatment modality alone has no predictable effect on the overall esthetic
assessment of a smile.
Sanjay Manhar Parekh et al (2006)25 evaluated changes in attractiveness on the basis of
computerized variations of smile arcs and buccal corridors for male and female smiles judged by
orthodontists and laypersons. They concluded that both laypersons and orthodontists prefers smiles
in which the smile arc was consonant and buccal corridors were minimal. Significantly lower
attractiveness ratings were found for smiles with flat smile arcs and excessive buccal corridors.
Christopher Maulik and Ravindra Nanda et al (2007)30 established dynamic norms for
the smile and showed that orthodontic treatment might not flatten the smile arc as previously
suggested, and, furthermore, that RME appears to be associated with a decreased buccal corridor.
Pieter A. A. M. van der Geld et al (2007)29 stated that a reliable assessment of the smile
line and tooth and gingival display during smiling and speech can be obtained with this digital
videographic method. Moreover, this method is suitable for clinical practices. In view of the
increasing esthetic demands of patients with regard to orthodontics, esthetic dentistry, and dental

surgery treatment, irreversible procedures in dentofacial esthetics should be undertaken only when
adequate information is obtained regarding the smile and functional tooth display.
Pieter Van der Geld et al (2007)31 stated that size of teeth, visibility of teeth, and upper
lip position are critical factors in self-perception of smile attractiveness (social dimension). Tooth
colour and exposure of ginigiva are considered critical factors in satisfying smile appearance
(individual dimension). Smiles with disproportional gingival display are judged negatively and
correlate with personality characteristics.
Laurie McNamara et al (2008)33 stated that the vertical lip thickness proved to be the
most influential variable in smile esthetics. The significant relationship of protrusion of incisors
with the vertical thickness of the vermilion border of upper lip should be considered when planning
orthodontic treatment.
Pieter Van der Geld et al (2008)35 concluded that the upper premolars and first molar are
part of the aesthetic zone in most patients. Lip – tooth relationships during spontaneous smiling,
speech, and at rest follow a consistent pattern. The significant reduction in maxillary lip line
heights with age should be taken into consideration in orthodontic treatment planning.
Roxanne Shafiee et al (2008)32 stated that the clinician judges demonstrated a high level
of agreement in ranking the facial attractiveness of profile, full-face, and smiling photographs
of a group of orthodontically treated patients whose actual differences in physical dimensions were
relatively small. The judges’ rankings of the smiling photographs were significantly better
predictors of their rankings of the triplet of each patient than were their rankings of the profile
photographs.

Vinod Krishnan et al (2008)34 stated that smile analysis should be an important aspect of
orthodontic diagnosis and treatment planning. Orthodontists should not disturb consonant smiles
but create them with proper bracket positioning.
Brian J. Schabel et al (2009)40 analyzed if any correlations could be found between
subjective evaluations of posttreatment smiles captured with clinical photography and rated by a
panel of orthodontists and parents of orthodontic patients, and objective evaluations of the same
smiles from the Smile Mesh program and concluded that no objective measure of the smile could
predict attractive or unattractive smiles as judged subjectively.
Brian J. Schabel et al (2009)39 stated that the Q-sort was more reliable than the VAS for
measuring smile esthetics. Orthodontists and parents of orthodontic patients agreed with respect
to grading of “attractive” and “unattractive” smiles. Laymen had less acceptance with respect to
“attractive” and “unattractive” smiles.
Caroline de Deus Tupinamba´ Rodrigues et al (2009)38 stated that the absence of
variations from beauty norms of a smile has a positive impact on its esthetic perception, but
variations from the norms do not necessarily result in reduced attractiveness.
Hideki Ioi et al (2009)37 had modified the buccal corridor to judge the effects of buccal
corridors on the smile attractiveness between the male and female raters for both the orthodontists
and dental students and concluded that both the orthodontists and dental students preferred broader
smiles to medium or narrow smiles.
Shyam Desai et al (2009)36 established the age-related dynamic norms. As an individual
ages, the smile gets narrower in the vertical and transverse dimension. This dynamically measures
the muscles ability to create a smile that decreases with an increase in age.

Brian J. Schabel et al (2010)42 found that a positive correlation was noted between the
measurements obtained from smiles captured by clinical photography and those captured with
digital video clips. Hence he concluded that a standard digital photograph appears to be a valid
tool for analyzing the posttreatment smile.
David C. Havens et al (2010)46 stated that the presence of a malocclusion has a negative
impact on facial attractiveness. Orthodontic correction of a malocclusion affects overall facial
esthetics positively. Laypersons and orthodontists agree on attractiveness ratings. Overall facial
balance is the most important factor used in deciding facial attractiveness.
Elaine Brough et al (2010)41 stated that the morphology, size, and shade of the maxillary
canine in patients having orthodontic space closure and lateral incisor substitution can have a
marked effect on perceived smile attractiveness.
Elham S. J. Abu Alhaija et al (2010)49 showed that profession and gender affected buccal
corridor spaces (BCS) and midline diastema attractiveness ratings. Wide BCSs, a gingival display
of more than 2 mm, and the presence of a midline diastema of any size were rated as unattractive
by all groups.
Federica Verdecchia et al (2010)48 investigate whether anterior dental alignment in 8- to
10-yr old children influences the first impressions of their peers, and to verify the validity of the
tested method. The results demonstrated that the usage of a questionnaire was reliable tool both
from an internal coherence standpoint and from a test–retest reliability perspective. When
evaluating information regarding the five areas of interest, it could be seen that 8- to 10-year-olds
viewed their peers with well-aligned teeth more propitiously as far as honesty, personal happiness,
and intelligence were concerned. However, there was no statistically significant difference with

regard to pleasantness and extroversion in children with harmonious, as opposed to crowded or
proclined anterior teeth.
Goutam Chakroborty et al (2010)43 aimed to determine the role of gingival component
in designing a smile and concluded that different factors of central zone of smile have fair to good
correlation with lip dynamics as assessed by smile index.
Mohan Bhuvaneswaran et al (2010)45 provided an organized and systematic approach is
required to evaluate, diagnose and resolve esthetic problems predictably. It is of prime importance
that the final result is not dependent only on the looks alone. The ultimate goal as orthodontists is
to achieve pleasing constitution in the smile framework by creating an arrangement of various
esthetic elements.
Nathalie Ghaleb et al (2010)44 stated that upper incisor inclination affects smile aesthetics
in the profile view. There is significant interaction effect between appreciation of incisor
inclination and the judge’s profession. Incisor inclination above normal standard values was
preferred by all panels for optimum smile aesthetics. In the aesthetic photographic position, the
preferred incisor is angulated 93 degrees to the horizontal line and +7 degrees to the lower facial
third. Orthodontists tend to prefer labial crown torque in comparison with lingual crown
inclination.
Sarah H. Abu Arqoub et al (2010)47 studied the influence of altering antero-posterior
(AP) and vertical proportions of the lower face and its effects on rankings for facial attractiveness.
A Class I profile of males with a normal lower face height and Class I profile of females with a
reduced lower face height were ranked as most attractive. Class II male and female profiles with
increased lower face heights were ranked as least attractive. As the vertical and AP dimensions
diverged from normal, attractiveness decreased. Images with Class II profile and increased lower
face heights were considered less attractive than corresponding images with Class III profile and
reduced lower anterior facial heights. Gender had a limited influence on the perception of
attractiveness. A difference in perception of profile attractiveness was found between dentists and
lay people.
Ana B. Macías Gago et al (2011)52 designed a study to determine if the faces considered
more beautiful in a young population exhibit the same parameters used by orthodontists to assess
successful results. The findings show that the faces considered more attractive fulfilled the
cephalometric and facial norms.
Catherine McLeod et al (2011)51 stated that individual perception of smile esthetics
influenced by national/cultural background can affect multiple variables in unequal ways and must
be considered in research and clinical settings.
Guilherme Janson et al (2011)55 stated that that smile attractiveness is similar in treatment
protocols of one , three, and four premolar extractions and that widths of buccal and posterior
corridors do not influence smile attractiveness in these groups.
Li Cao et al (2011)50 stated that both maxillary incisor labiolingual inclination and AP
position play an essential role in the esthetics of the smiling profile. However, when formulating
treatment plans, dentists should never underestimate the labiolingual inclination’s influence on the
smiling profile.
Pieter Van der Geld et al (2011)54 stated that smile line analysis can be performed reliably
with a 3-grade scale (visual) semi quantitative estimation. For a more comprehensive diagnosis,
another measuring tool is proposed, especially in patients whose gingiva is exposed
disproportionately.

Sabrina Elisa Zange et al (2011)53 determined the perception of orthodontists and
laypersons regarding the size of the dark spaces in the buccal corridors and how that affects smile
esthetics in individuals with long and short faces. The presence or absence of dark spaces in the
buccal corridors has little influence over smile esthetics. Hence, while this aspect should be
considered in the orthodontic diagnosis, there is no confirmation for expanding the buccal corridor
to eliminate dark spaces unless they are extremely evident.
Hagai Miron et al (2012)56 stated that in in subjects with a high smile pattern: (1) short
upper lip length, (2) low smiling/resting upper lip length ratio, (3) inferior attachment of the upper
labial vestibule, and (4) prominent upper lip vermilion was found.
Hrushikesh Aphale et al (2012)1 presented the importance of smile characteristics in
obtaining the desired results during orthodontic treatment. The characteristics of smile as a tool to
orthodontic practice may aid in giving the dentist a successful clinical practice.
Angela I-Chun Lin et al (2013)57 Smile esthetics increased with increased recruitment of
muscles involved in smile production. The results were healthy across the subjects, suggesting that
objective rating methods for assessing dynamic smile esthetics could become an important clinical
tool.
Bhavna Singh et al (2013)59 stated that with age, the smile gets narrower vertically,
especially for the male population. The pattern of change observed in the present study must be
considered and incorporated during treatment planning to deliver healthier and long-lasting results
to patients of all age groups.
Burcak Kaya et al (2013)58 stated that many factors affects smile attractiveness. However,
the influence of the interaction of several factors is not as well known. Additionally, patients and
clinicians might view smile esthetics differently. Examining other factors influencing the

perception of smile attractiveness might be of help to clinicians for developing more satisfying
treatment plans for their patients.
Joan F. Walder et al (2013)60 stated that esthetic considerations play an increasingly
important role in patient care, and clinicians need a methodology that includes imaging techniques
to capture the dynamic nature of the smile. Photographs of posed smile are used on a daily basis
to help aid in diagnosis and treatment planning.
Anthony L. Maganzini et al (2014)61 stated that smile esthetics is improved by
orthodontic treatment regardless of the initial severity of the malocclusion. In other words, patients
with complex orthodontic issues or their counterparts with minor issues benefitted equally from
treatment in terms of their smile attractiveness.
Bruna Dieder Correa et al (2014)62 stated that the perceptions of unilateral asymmetries
in the gingival margin levels of the maxillary canines were 1.0 mm for orthodontists and 1.5 to 2.0
mm for laypersons.
Sercan Akyalcin et al (2014)63 stated that a harmonious smile arc relationship and less
gingival display during a smile are significantly associated with smile attractiveness in patients
considered successfully treated according to ABO standards.
Enio Ribeiro Cotrim et al (2015)64 had aimed to highlight differences in perception of
smile esthetics by clinicians, orthodontists and laypeople and assessed factors such as lip thickness,
smile height, color gradation, tooth size and crowding, and also other factors which are associated
with smile unpleasantness. They concluded that the groups highlighted different characteristics
associated with smile unpleasantness. Orthodontists preferred less gingival display, whereas
laypeople highlighted disproportionately arranged teeth and clinicians preferred whiter teeth.

Kyoko Hata et al (2015)65 had studied frontal posed smiles of 100 Japanese females after
orthodontic treatment using a visual analogue scale (VAS). The photographs were ranked based
on the VAS evaluations and 25 photographs with the highest evaluations were selected as group
A, and the 25 photos with the lowest evaluations were designated group B. Then 12 dimensional
items of objective analysis were measured; out of 7 parameters in transverse plane and 5
parameters in vertical plane. Means and standard deviations for measurements of the dimensional
items were compared between the groups. It was found that significant differences were observed
only in the vertical dimension, not in the transverse dimension. Dimensional diagnostic items were
found to be correlated with subjective judgments of postorthodontic frontal smile attractiveness in
Japanese female patients: interlabial gap, intervermillion distance, maxillary gingival display,
maximum incisor exposure, and lower lip to incisor. All five items were in the vertical dimension
only.
Machado RM et al (2016)66 verified whether different levels of maxillary incisal edges
exposure influenced the perception of smile esthetics and whether exposure of gingiva affects this
perception among various groups of orthodontists, dentists, orthodontic patients, and laypersons.
They concluded that most accepted vertical relationship of incisor edges was 1.0-mm step and that
gingival exposure had a positive influence on smile attractiveness.
Chompunuch et al (2017)67 stated that the age of an individual impacts the perception of
smile based on gingival display in maxillary anterior region and the presence of a black triangles
between the maxillary central incisors. Due to the dissimilarity in esthetic assessment of each
person, participation of orthodontists and patients in the decision making and treatment planning
is crucial to provide successful results.

MATERIALS AND METHODOLOGY

MATERIALS USED IN THE STUDY: (Fig 1 – 5)
1. Diagnostic Instruments – Mouth Mirror, Probe, Tweezer
2. Vivitar Tripod – 2
3. Canon DSLR 1200D Camera – 2
4. Measuring Tape - 1
5. Simplex Porta Light with 1000W halogen tube - 1
6. White Chart – 5
7. Smile DesignerPro Software
8. Microsoft Office Powerpoint 2013
9. Protractor
10. Metric Ruler

Figure 1 – Diagnostic instruments Figure 2 – Metric ruler and Protractor
Figure 3 – Halogen light
Figure 4 Measuring tape Figure 5 – Digital Camera mounted on Tripod
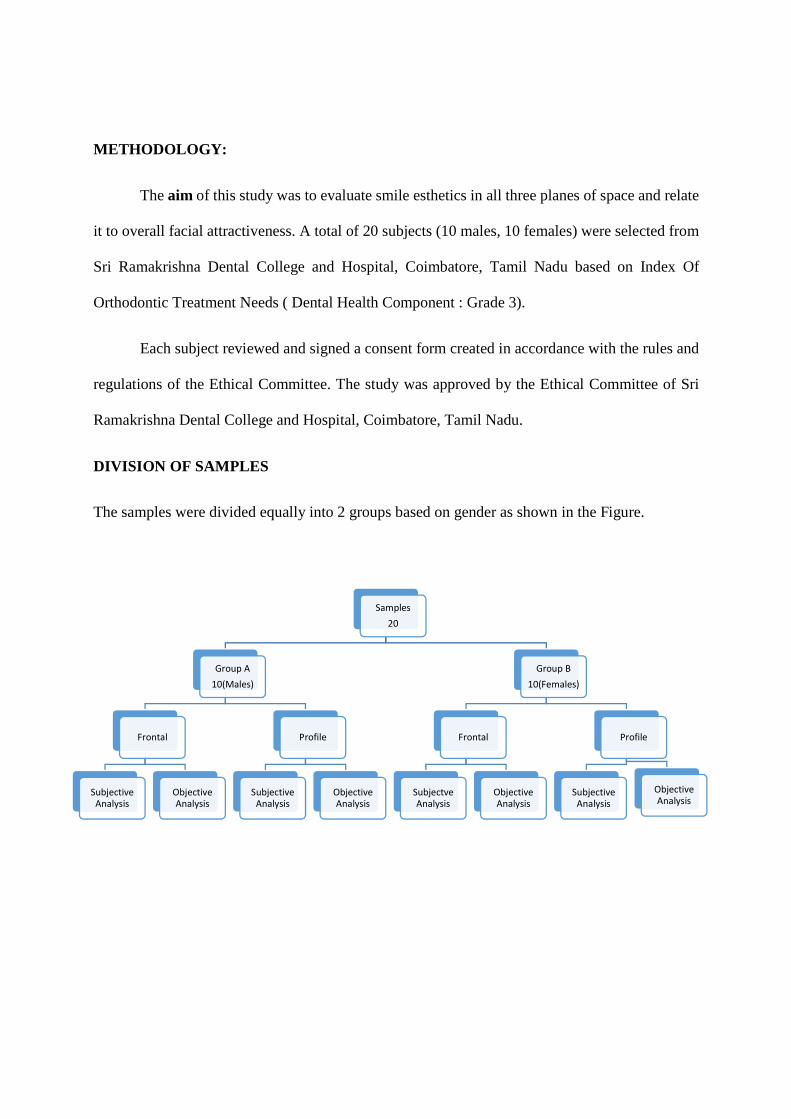
METHODOLOGY:
The aim of this study was to evaluate smile esthetics in all three planes of space and relate
it to overall facial attractiveness. A total of 20 subjects (10 males, 10 females) were selected from
Sri Ramakrishna Dental College and Hospital, Coimbatore, Tamil Nadu based on Index Of
Orthodontic Treatment Needs ( Dental Health Component : Grade 3).
Each subject reviewed and signed a consent form created in accordance with the rules and
regulations of the Ethical Committee. The study was approved by the Ethical Committee of Sri
Ramakrishna Dental College and Hospital, Coimbatore, Tamil Nadu.
DIVISION OF SAMPLES
The samples were divided equally into 2 groups based on gender as shown in the Figure.
Samples
20
Group A
10(Males)
Frontal
Subjective
Analysis
Objective
Analysis
Profile
Subjective
Analysis
Objective
Analysis
Group B
10(Females)
Frontal
Subjectve
Analysis
Objective
Analysis
Profile
Subjective
Analysis
Objective
Analysis

SELECTION CRITERIA:
I. Inclusion Criteria;
1. Age group between 18-23 years
2. Untreated Patients classified on basis of Index of orthodontic treatment need (IOTN),
dental health component Grade 312.
II. Exclusion Criteria;
1. Gross facial asymmetry
2. Previous orthodontically treated Patients
3. Unerupted or impacted supernumerary teeth
4. No active periodontal disease and no periodontal treatment except for routine scaling and
root planing.
All the 20 subjects included in the study were selected based on the inclusion criteria and were
undergraduate students from the institution with the age group between 18-23 years.
Two digital video cameras were used to record the posed smile of the subject in natural head
position from the frontal and profile view at the same time. The cameras were placed at right angles
to each other. The subjects were seated in natural head position with a distance of 3 feet from the
camera lens. The cameras were mounted on a vivitar tripod, for recording the procedure and to
prevent undesired operator movements depicted in Figure – 6.
A white background was standardized, before the video was recorded. Prior to the recording
procedure, subjects were asked to rehearse the phrase “Chelsea eats cheesecake on the
Chesapeake” for producing a relaxed posed smile13. The smile was recorded for a duration of 10
seconds. Subsequently the video was uploaded to GOM media player software and this program
allowed the streaming video to be converted individual photographic frames at the rate of
approximately 30 frames per second14. Thus, a 10 second video resulted in roughly 300 frames.
The frame best representing the subjects posed unstrained smile in both the views were selected.
This frame was identified as “held smile”, which was one of the 15 consecutive frames in which
the smile did not change14. The selected frames from both the views were uploaded to Smile
DesignerPro software for rotation calibration and millimeter scale measurements using the width
of upper central incisors as landmark for calibration of scale to correct the magnification errors15.
Dimensional analysis were quantified for skeletal, dental and soft tissue structures in all three
planes of space in frontal and profile view16. 2 parameters for skeletal, 5 parameters for dental and
7 parameters for soft tissue structures were selected in both the views (Table 1). The following
parameters were measured using Smile DesignerPro software and Microsoft PowerPoint Office
(2013 version) which comprised of Objective Evaluations done on the photograph in two views.
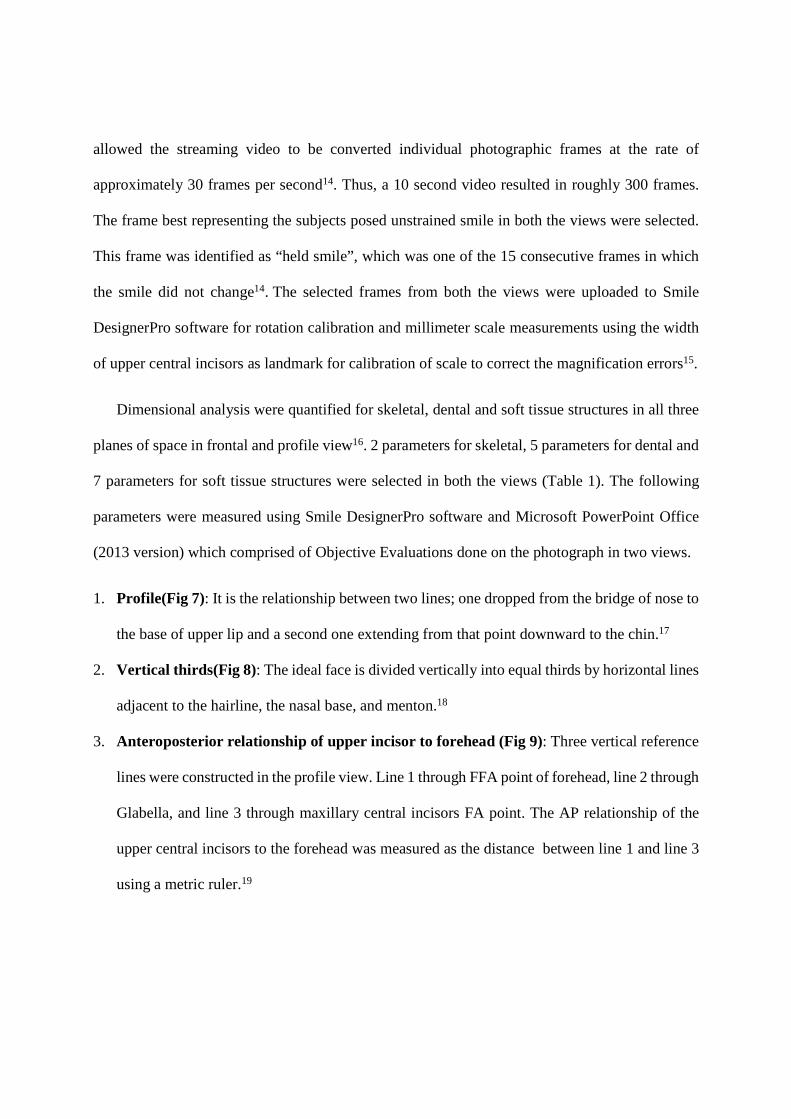
1. Profile(Fig 7): It is the relationship between two lines; one dropped from the bridge of nose to
the base of upper lip and a second one extending from that point downward to the chin.17
2. Vertical thirds(Fig 8) : The ideal face is divided vertically into equal thirds by horizontal lines
adjacent to the hairline, the nasal base, and menton.18
3. Anteroposterior relationship of upper incisor to forehead (Fig 9): Three vertical reference
lines were constructed in the profile view. Line 1 through FFA point of forehead, line 2 through
Glabella, and line 3 through maxillary central incisors FA point. The AP relationship of the
upper central incisors to the forehead was measured as the distance between line 1 and line 3
using a metric ruler.19

4. Tooth Proportions (Golden Proportion, Lombardi): When viewed from frontal aspect, the
width of each anterior tooth is 62% width of the adjacent tooth (mathematical ratio is
1.6:1:0.6).20
5. Dental Midline (Fig 13): The facial midline is identified using soft tissue nasion, nose base,
philtrum. The facial midline should coincide with the maxillary and mandibular incisor midline
or at least be minimally parallel.21
6. Maxillary incisor exposure(Fig 14): Maximum amount on vertical display of maxillary right
central incisor during smile.22
7. Lower incisor exposure (Fig 15): Maximum amount of vertical display of lower right central
incisor during smile.
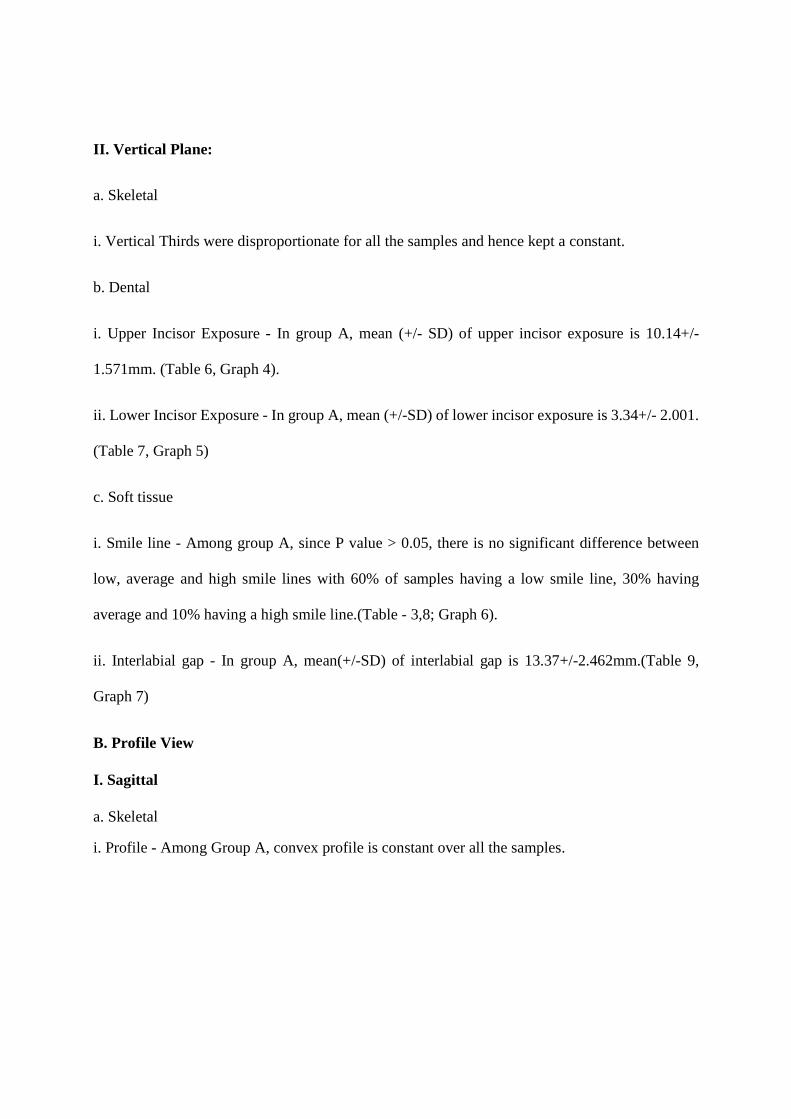
8. Nasal contour (Fig 10): It is classified into straight nose, convex nose in profile view. 23
9. Jaw profile field (Fig 12): Depending upon the location of subnasale point relative to the skin
nasion perpendicular, there are typical profile variations: Average face – Subnasale lying on
skin nasion perpendicular, anteface – subnasale lying in front of skin nasion perpendicular,
retroface – subnasale lying behind skin nasion perpendicular. Based on the change of soft tissue
pogonion relative to subnasale; nine different profile types can be seen.23
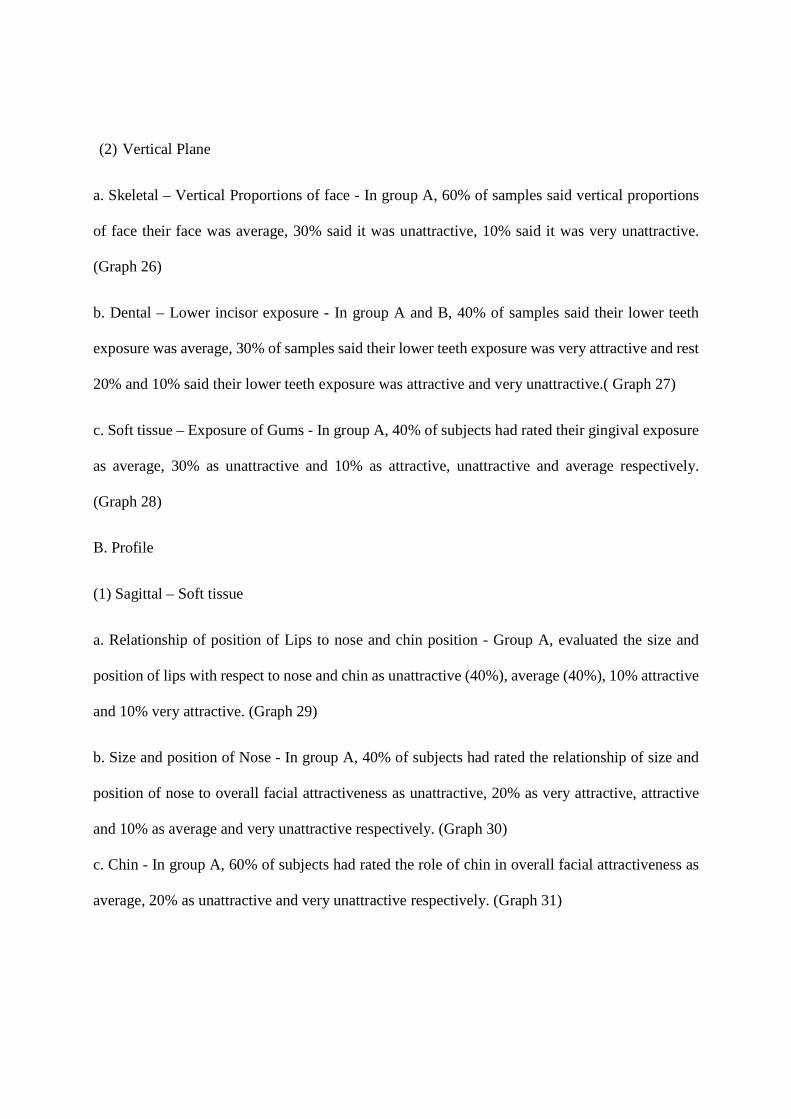
10. Slope of Forehead (Fig 11): The lateral forehead contour is steep, flat, protruding.23
11. Smile arc (Fig 18): It is the curvature of maxillary incisal edges and canines relative to the
curvature of lower lip while smiling.26
12. Buccal Corridor : It is calculated as the difference between the inner intercommisural width
and the visible maxillary dentition width divided by the inner intercommisural width. The ratio
was reported as a percentage. Six sizes of buccal corridors were created: narrow (0%), medium
– narrow (5%), medium (10%), medium – broad (15%), broad (20%), extrabroad (25%). 27

13. Interlabial gap(Fig 17) : Distance between the most inferior portion of the tubercle of the
upper lip and deepest midline point on the superior margin of lower lip to maxillary right
central incisor edge.28
14. Smile line(Fig 16) : Divided into three categories as follows ; High smile – reveals the total
cervicoincisal length of the upper anterior teeth and a continuous band of gingiva, Average
smile – Reveals 75-100% of the maxillary anterior teeth and the interproximal gingiva only,
Low smile line – Displays less than 75% of the anterior teeth.29
PARAMETERS ANALYSED ON PHOTOGRAPH – TABLE 1
SAGITTAL TRANSVERSE VERTICAL
SKELETAL 1.Profile 2.Vertical thirds
DENTAL 3.Anteroposterior position of
maxillary incisors to forehead
4.Tooth proportions –
Golden Proportion
5. Dental Midline
6. Upper Incisor exposure
7. Lower incisor exposure
SOFT TISSUE 8. Nasal contour
9. Gnathic profile field
10. Slope of Forehead
11. Smile arc
12. Buccal Corridor
13.Interlabial gap
14. Smile line
Subjective analysis for evaluation of smile esthetics individually, was carried out using a
questionnaire comprising of 11 questions. Questions were framed based on etiology, diagnosis and
treatment planning. A grading scale of 1 to 5 was used to assess the attractiveness or
unattractiveness of various parameters. The questionnaire was distributed to 20 subjects (10 males,

10 females) together with a template consisting of their own photographs in frontal and profile
view. The questionnaire is presented on the facing page.
Grading scale is as follows:
Attractive Unattractive
1- Least attractive 1- Least unattractive
2- Little less attractive 2- Little less unattractive
3– Average 3– Average
4- Attractive 4- Unattractive
5– Most attractive 5– Most unattractive

SRI RAMAKRISHNA DENTAL COLLEGE AND HOSPITAL
DEPARTMENT OF ORTHODONTICS AND DENTOFACIAL ORTHOPED ICS
EVALUATION OF SMILE ESTHETICS USING DIMENSIONAL ANA LYSIS
INSTRUCTIONS: Answer all the questions and grade your answers from 1 to 5 with 1 being
least and 5 being most
PATIENT NAME:
1. What do you feel about your smile and how would you relate it to the overall facial
attractiveness?
a. Attractive
b. Unattractive
c. I don’t know
2. What do you feel about the arrangement of your teeth and how would you relate it to the overall
facial attractiveness?
a. Attractive
b. Unattractive
c. I don’t know
1 2 3 4 5
1 2 3 4 5
1 2 3 4 5
1 2 3 4 5

3. What do you feel about lower teeth exposure during smile and how would you relate it to
overall facial attractiveness?
a. Attractive
b. Unattractive
c. I don’t know
4. What do you feel about the exposure of your gums during smile and how would you relate it
to the overall facial attractiveness?
a. Attractive
b. Unattractive
c. I don’t know
5. What do you feel about size and position of lips with respect to nose and chin?
a. Attractive
b. Unattractive
c. I don’t know
1 2 3 4 5
1 2 3 4 5
1 2 3 4 5
1 2 3 4 5
1 2 3 4 5
1 2 3 4 5

6. What do you feel about the size and position of your nose and how would you relate it to
overall facial attractiveness?
a. Attractive
b. Unattractive
c. I don’t know
7. What do you feel about the role of chin in overall facial attractiveness?
a. Attractive
b. Unattractive
c. I don’t know
8. How do you relate the symmetry of face on right and left side to overall facial attractiveness?
a. Attractive
b. Unattractive
c. I don’t know
1 2 3 4 5
1 2 3 4 5
1 2 3 4 5
1 2 3 4 5
1 2 3 4 5
1 2 3 4 5

9. What is your opinion regarding the vertical proportions of upper, middle and lower one third
of face and how would you relate it to overall facial attractiveness?
a. Attractive
b. Unattractive
c. I don’t know
10. Which of the following structures do you wish to correct to improve overall facial
attractiveness?
a. Teeth
b. Lips
c. Gums
d. Nose
e. Chin
f. All of the above
g. None of the above
11. Which of the following structures do you find to be the most attractive in both the
photographs?
Frontal Profile
Teeth Teeth
Lips Lips
Gums Gums
Nose Nose
Position of lower jaw Position of lower jaw
1 2 3 4 5
1 2 3 4 5

SRI RAMAKRISHNA DENTAL COLLEGE AND HOSPITAL
DEPARTMENT OF ORTHODONTICS AND DENTOFACIAL ORTHOPED ICS
CONSENT FORM
I Mr./Ms./Mrs. aged years was made aware by the doctor
about the study that involves capturing a video to analyze my smile.
I hereby give my consent to use my records for educational purposes and for publication
in articles or books. I agree to participate in this study and give my full consent for the videographic
recording procedures.
Date:
Place:
Patient Signature:

Figure 6 – Standardization of sample – Cameras placed at right angles to each other.
Figure 7 - Profile Figure 8 – Vertical Proportions
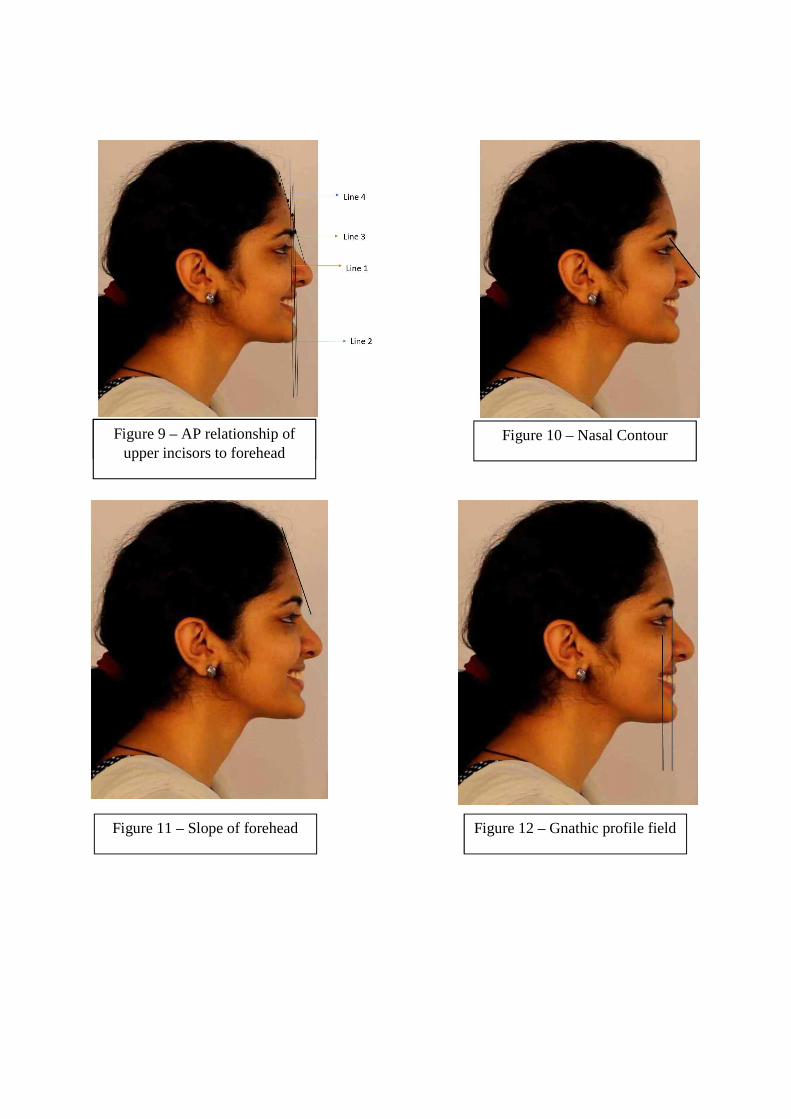
Figure 9 – AP relationship of upper incisors to forehead
Figure 10 – Nasal Contour
Figure 11 – Slope of forehead Figure 12 – Gnathic profile field

Figure 13 – Dental Midline Figure 14 – Upper incisor exposure
Figure 17 – Interlabial gap Figure 18 – Smile arc
Figure 15 – Lower incisor exposure Figure 16 – Smile line

RESULTS

RESULTS
A total of 20 samples were included in the study (10 males (Group A), 10 females (Group B)) with
an age range of 18-23 years. Objective analysis was carried out on photographs in frontal and
profile view. Subjective analysis was carried out by the subjects themselves using the
questionnaire together with a template consisting of their own photographs in frontal and profile
view for perception of their own smile and relating it to overall facial attractiveness.
STATISTICAL ANALYSIS:
Statistical analysis were done using the software SPSS version 22.0 for Windows 10. For
continuous variables, means and standard deviations were calculated. Chi- square test, N – par test,
ANOVA test, Percentage analysis, Cross tabulations were carried out to evaluate the statistical
significance of each parameter in all three planes of space in frontal and profile view. For all tests,
the significance level was set at 0.05.
PARAMETERS ASSESSED:
I. Intra group comparison of objective analysis - males
II. Intra group comparison of objective analysis – females
III. Intra group comparison of subjective analysis – males
IV. Intra group comparison of subjective analysis – females
V. Inter group comparison for objective analysis – frontal
VI. Inter group comparison for objective analysis – profile
VII. Inter group comparison for subjective analysis – frontal
VIII. Inter group comparison for subjective analysis – profile

IX. Intergroup comparison for evaluating order of preference of facial structures from frontal
and profile view - males
X. Intergroup comparison for evaluating order of preference of facial structures from frontal
and profile view - females
XI. Intergroup comparison for correction of various structures between males and females
I. INTRAGROUP COMPARISON OF MALES (OBJECTIVE):
A. Frontal
1. Transverse Plane
i. Dental
a. Midline - In group A, since P value > 0.05 there is no significant difference between midlines
deviated to right, left or midlines that are coincident showing that 60% of samples had a coincident
midline and 20% had their midlines deviated to right and left respectively.(Table -2,3; Graph-1)
b. Golden Proportion - It is disproportionate for all the samples, and hence a constant.
ii. Soft tissue
a. Smile Arc - In group A, since P value > 0.05, there is no significant difference between the
consonant and non-consonant smile arc showing that 70% of samples had a consonant smile arc,
30% had a non-consonant smile arc.(Table-3,4; Graph 2)
b. Buccal Corridor - In group A, since P value is >0.05, there is no significant difference between
the categories of buccal corridor. 50% of males had broad, 30% had medium broad, 10 % each
had medium and narrow buccal corridor. (Table - 3, 5; Graph 3)
II. Vertical Plane:
a. Skeletal
i. Vertical Thirds were disproportionate for all the samples and hence kept a constant.
b. Dental
i. Upper Incisor Exposure - In group A, mean (+/- SD) of upper incisor exposure is 10.14+/-
1.571mm. (Table 6, Graph 4).
ii. Lower Incisor Exposure - In group A, mean (+/-SD) of lower incisor exposure is 3.34+/- 2.001.
(Table 7, Graph 5)
c. Soft tissue
i. Smile line - Among group A, since P value > 0.05, there is no significant difference between
low, average and high smile lines with 60% of samples having a low smile line, 30% having
average and 10% having a high smile line.(Table - 3,8; Graph 6).
ii. Interlabial gap - In group A, mean(+/-SD) of interlabial gap is 13.37+/-2.462mm.(Table 9,
Graph 7)
B. Profile View
I. Sagittal
a. Skeletal
i. Profile - Among Group A, convex profile is constant over all the samples.

b. Dental
i. Labiolingual inclination of upper incisors to forehead - In group A, the mean (+/-SD) labiolingual
inclination was -0.25mm+/- 3.75mm showing that males had maxillary incisors positioned
posterior to foreheads FFA point.(Table 10, Graph 8)
c. Soft tissue
i. Gnathic Profile Field - Among group A, since P value > 0.05, there is no significant difference
between those with average face, gnathic profile, slanting backward and anteface, gnathic profile,
slanting backward showing that 50% of the samples had average and anteface chin respectively.
(Table - 3, 11, Graph 9)
ii. Nasal Contour - Among group A, straight nasal contour is constant over all the samples.
iii. Slope of forehead - Among group A, since P value <0.05 there is a significant difference
between flat, steep and protruding forehead showing that samples with steep forehead being 80%
more prevalent than those with flat(10%) and protruding(10%) slopes of forehead. (Table-3, 12;
Graph 10).
II. INTRAGROUP COMPARISON OF FEMALES (OBJECTIVE):
A. Frontal
1. Transverse Plane
i. Dental
a. Midline - In group B, since P value <0.05, females who had their midline shifted to right (90%)
was more than others who had a coincident midline (10%). (Table-13,14;Graph 11)

b. Golden Proportion - It is disproportionate for all the samples and hence a constant.
ii. Soft tissue
a. Smile arc - In group B, since P value > 0.05, there is no significant difference between consonant
and non-consonant smile arc showing that females with consonant smile arc is 70% and non-
consonant smile arc is 30%. (Table 14, 15; Graph 12)
b. Buccal corridor - In group B, since P value is >0.05, there is no significant difference between
the categories of buccal corridor showing that females had medium and medium broad categories
of buccal corridor of 40%, narrow(10%) and broad (10%). (Table-14, 16; Graph 13)
2. Vertical Plane
i. Skeletal
a. Vertical thirds – Vertical thirds proportions of the face were disproportionate for all and kept
constant.
ii. Dental
a. Upper Incisor Exposure - In group B, mean (+/-SD) of upper incisor exposure is 11.4+/-
2.06mm. (Table 6, Graph 14)
b. Lower incisor exposure - In group B, mean (+/-SD) of lower incisor exposure is 1.73+/-2.161.
(Table 7, Graph 15)

iii. Soft tissue
a. Smile line - Among group B, since P value > 0.05, there is no significant difference between
low, average and high smile lines with average smile line being 80% more prevalent followed by
high smile line (20%). (Table-14, 17; Graph 16)
ii. Interlabial gap - In group B, mean of interlabial gap is 13.63+/-2.833. (Table 9, Graph 17)
B. Profile
1. Sagittal Plane
i. Skeletal
a. Profile - Among group B, since P value > 0.05, there is no significant difference between straight
and convex profiles showing that 80% of the samples had a convex profile and 20% had a straight
profile. (Table-14, 18; Graph 18)
ii. Dental
a. Labiolingual inclination of upper incisors to forehead - In group B, mean on upper incisor
inclination to forehead is -2.3 +/- 1.251mm showing that showing that females had maxillary
incisors positioned posterior to foreheads FFA point. (Table-10, 14; Graph 19)
iii. Soft tissue
a. Gnathic profile field - In group B, since P value < 0.05, there is a significant difference between
average face, gnathic profile, slanting backward and average face, gnathic profile, slanting
backward showing that among females those with average face, gnathic profile, slanting
backward(90%) more prevalent. (Table-14, 19;Graph 20)

b. Nasal Contour - Among group B, since P value < 0.05, there is a significant difference between
those with straight and convex nose; with straight nose being 90% more prevalent. (Table-14, 20;
Graph 21)
c. Slope of forehead - Among group B, since P value <0.05 there is a significant difference between
flat, steep and protruding forehead indicating that samples in this group had flat forehead 90%
more prevalent. (Table 14, 21; Graph 22)
III. INTRA GROUP COMPARISON OF MALES FOR SUBJECTIVE ANALYSIS (Tables-
22, 23)
A. Frontal –
(1) Transverse Plane
a. Skeletal – Symmetry of face - In group A, 40% of samples said their face symmetry were very
unattractive, 30% said it was average, 20% said it was unattractive, 10% said it was very
attractive.( Graph 23)
b. Dental – Arrangement of teeth - In group A, 70% of samples said their teeth arrangement was
unattractive, 10% each said their teeth arrangement was attractive, average and very
unattractive.( Graph 24)
c. Soft tissue – Smile Attractiveness - In group A, 50% of samples rated their smile as
unattractive, 30% of samples rated their smile as very unattractive and 20% rated their smile
as average. (Graph 25)
(2) Vertical Plane
a. Skeletal – Vertical Proportions of face - In group A, 60% of samples said vertical proportions
of face their face was average, 30% said it was unattractive, 10% said it was very unattractive.
(Graph 26)
b. Dental – Lower incisor exposure - In group A and B, 40% of samples said their lower teeth
exposure was average, 30% of samples said their lower teeth exposure was very attractive and rest
20% and 10% said their lower teeth exposure was attractive and very unattractive.( Graph 27)
c. Soft tissue – Exposure of Gums - In group A, 40% of subjects had rated their gingival exposure
as average, 30% as unattractive and 10% as attractive, unattractive and average respectively.
(Graph 28)
B. Profile
(1) Sagittal – Soft tissue
a. Relationship of position of Lips to nose and chin position - Group A, evaluated the size and
position of lips with respect to nose and chin as unattractive (40%), average (40%), 10% attractive
and 10% very attractive. (Graph 29)
b. Size and position of Nose - In group A, 40% of subjects had rated the relationship of size and
position of nose to overall facial attractiveness as unattractive, 20% as very attractive, attractive
and 10% as average and very unattractive respectively. (Graph 30)
c. Chin - In group A, 60% of subjects had rated the role of chin in overall facial attractiveness as
average, 20% as unattractive and very unattractive respectively. (Graph 31)

IV. INTRA GROUP COMPARISON OF FEMALES FOR SUBJECTIV E ANALYSIS
(Table 24, Table 25)
A. Frontal –
(1)Transverse Plane
a. Skeletal – Symmetry of face - In group B, 50% of samples said their face symmetry was average,
30% said it was unattractive, 10% each said it was average and very unattractive respectively.
(Graph 23)
b. Dental – Arrangement of teeth - In group B, 40% of samples said their teeth arrangement was
average, 30% said it was unattractive, 20% said it was very unattractive and 10% said it is
attractive. (Graph 24)
c. Soft tissue – Smile Attractiveness - In group B, 40% of samples rated their smile as unattractive,
30% of samples rated their smile as average, 20% of samples rated their smile as attractive and
10% of samples rated their smile as very unattractive. (Graph 25)
(2) Vertical Plane
a. Skeletal – Vertical Proportions of face - In group B, 30% of samples said vertical proportions
of face their face was attractive, unattractive and average respectively and 10% said it was very
attractive. (Graph 26)
b. Dental – Lower incisor exposure - In group B, 40% of samples said their lower teeth exposure
was average. 20% of samples said their lower teeth exposure was attractive, average and
unattractive respectively. (Graph 27)

c. Soft tissue – Exposure of Gums - In group B, 40% of subjects had rated their gingival exposure
as attractive, 30% as unattractive, 20% as average and 10% as attractive. (Graph 28)
B. Profile -
(1) Sagittal – Soft tissue
a. Relationship of position of Lips to nose, chin position - In Group B, the size and position of lips
with respect to nose and chin was unattractive (40%), average (40%), attractive (20%)
respectively. (Graph 29)
b. Size and position of Nose - In group B, 80% of subjects had rated the relationship of size and
position of nose to overall facial attractiveness as average, 10% rated it as attractive and
unattractive respectively. (Graph 30)
c. Chin - In group B, 50% of subjects had rated the role of chin to overall facial attractiveness as
average, 20% as average and unattractive; respectively and 10% as very attractive. (Graph 31)
V. INTER GROUP COMPARISON FOR OBJECTIVE ANALYSIS – FRONTAL
I. Dental Parameters – Transverse Plane
A. Midline - Since P value < 0.05 (5% level), there is a significant difference between the
Coincident, Left and Right Percentages of Midline. Therefore the samples whose Midline is
deviated to Right is more in percentage (55%) than those whose midlines are coincident (35%),
deviated to left (10%). (Tables - 26, 27; Graph 32)
B. Golden proportion of teeth is disproportionate for all the samples and is a constant

II. Soft tissue - Transverse Plane
a. Smile arc - Since P value > 0.05 (5% level), there is no significant difference between the
Consonant and non-consonant of smile arc showing that 70% of samples had a consonant smile
arc and 30% of sample had a non-consonant smile arc. (Table 28; Graph 33)
b. Buccal Corridor - Since P value > 0.05 (5% level), there is no significant difference among the
samples showing that the sample had medium broad BC of 35%, broad BC of 30%, medium BC
of 25%, narrow BC of 10%. (Table 29; Graph 34)
III. Vertical Plane
1. Skeletal
a. Vertical thirds were disproportionate and hence constant for all samples.
2. Dental
a. Upper Incisor exposure - Since P value is greater than 0.05 (5% level), there is no significant
difference between Group A and B in the average score on this parameter. Group B had greater
upper incisor exposure than group A. (Tables - 30,31; Graph 35)
b. Lower Incisor exposure - Since P value is greater than 0.05 (5% level), there is no significant
difference between Group A and B in the average score on this parameter. Group A had greater
lower incisor exposure than Group B. (Tables - 30,32; Graph 36)

3. Soft tissue
a. Smile Line - Since P value > 0.05 (5% level), there is a no significant difference between the
low, average and high smile line. 55% of samples had an average smile line, followed by low smile
line of 30% and High smile line of 15%. (Table 33; Graph 37)
b. Interlabial gap - Since P value > 0.05 (5% level), there is no significant difference between male
and female in the average score on this parameter. Group A, had a mean interlabial gap of 13.37+/-
2.462mm and Group B had a mean value of 13.63 +/-2.833mm. Group B had more interlabial gap
than group A. (Tables - 9,34; Graph 38)
VI. INTER GROUP COMPARISON FOR OBJECTIVE ANALYSIS – PROFILE
I .SAGITTAL
1. Skeletal
a. Profile - Since P value < 0.05 (5% level), there is a significant difference between samples with
straight profile and convex profile. Therefore the samples whose profile is convex was very high
(90%) than those with straight profile. (Table 33, Graph 39)
2. Dental
a. Labiolingual inclination - Mean of upper incisor inclination to forehead is -0.25mm in group A
and -2.3mm in group B. Since P value > 0.05 (5% level), there is no significant difference between
male and female in the average score on this parameter. (Tables - 34,35; Graph 40)

3. Soft tissue
a. Gnathic Profile Field - Since P value > 0.05 (5% level), there is no significant difference
between average face, gnathic profile, backward slanting and anteface, gnathic profile, backward
slanting. 70% of the sample had average face, gnathic profile, 30% of the sample had anteface,
gnathic profile, backward slanting. (Table 36, Graph-9,20)
b. Nasal Contour - Since P value < 0.05 (5% level), there is a significant difference between the
straight and convex of nasal contour. Therefore, the samples with straight nose more in percentage
(95%) than other sample. (Table 37, Graph 42)
c. Slope of forehead - Among group A, since P value <0.05 there is a significant difference between
flat, steep and protruding forehead, with steep forehead being 80% more prevalent. Among group
B, since P value <0.05 there is a significant difference between flat, steep and protruding forehead,
with flat forehead being 90% more prevalent. (Table 38, Graph 43)
VII. INTER GROUP COMPARISON FOR SUBJECTIVE ANALYSIS – FRONTAL (Tables
- 39, 42)
A. Frontal – (1) Transverse Plane
a. Skeletal – Symmetry of face - In group A, 40% of samples said their face symmetry were very
unattractive, 30% said it was average, 20% said it was unattractive, 10% said it was very
attractive. In group B, 50% of samples said their face symmetry was average, 30% said it was
unattractive, 10% each said it was average and very unattractive respectively. (Graph 23)
b. Dental – Arrangement of teeth - In group A, 70% of samples said their teeth arrangement was
unattractive, 10% each said their teeth arrangement was attractive, average and very

unattractive. In group B, 40% of samples said their teeth arrangement was average, 30% said
unattractive, 20% very unattractive and 10% said it is average.( Graph 24)
c. Soft tissue – Smile Attractiveness - In group A, 50% of samples rated their smile as
unattractive, 30% of samples rated their smile as very unattractive and 20% rated their smile
as average. In group B, 40% of samples rated their smile as unattractive, 30% of samples rated
their smile as average, 20% of samples rated their smile as attractive and 10% of samples
rated their smile as very unattractive. (Graph 25)
(2) Vertical Plane
a. Skeletal – Vertical Proportions of face
In group A, 60% of samples said vertical proportions of face their face was average, 30% said it
was unattractive, 10% said it was very unattractive. In group B, 30% of samples said vertical
proportions of face their face was attractive, unattractive and average respectively and 10% said
it was very attractive. (Graph 26)
b. Dental – Lower incisor exposure - In group A and B, 40% of samples said their lower teeth
exposure was average. In group A, 30% of samples said their lower teeth exposure was very
attractive and rest 20% and 10% said their lower teeth exposure was attractive and very
unattractive. In group B, 20% of samples said their lower teeth exposure was attractive, average
and unattractive respectively. (Graph 27)
c. Soft tissue – Exposure of gums - In group A, 40% of subjects had rated their gingival exposure
as average, 30% as unattractive and 10% as attractive, unattractive and average respectively. In
group B, 40% of subjects had rated their gingival exposure as attractive, 30% as unattractive, 20%
as average and 10% as attractive. (Graph 28)

VIII. INTER GROUP COMPARISON FOR SUBJECTIVE ANALYSI S – PROFILE (Tables
– 40,41)
A. Profile – (1) Sagittal – Soft tissue
a. Relationship of position of Lips to nose, chin position. - Both group A and group B, evaluated
the size and position of lips with respect to nose and chin as unattractive (40%) and average (40%)
respectively. (Graph 29)
b. Size and position of Nose. - In group A, 40% of subjects had rated the relationship of size and
position of nose to overall facial attractiveness as unattractive, 20% as very attractive, attractive
and 10% as average and very unattractive respectively. In group B, 80% of subjects had rated the
relationship of size and position of nose to overall facial attractiveness as average, 10% rated it as
attractive and unattractive respectively. (Graph 30)
c. Chin - In group A, 60% of subjects had rated the role of chin in overall facial attractiveness as
average, 20% as unattractive and very unattractive respectively. In group B, 50% of subjects had
rated the role of chin to overall facial attractiveness as average, 20% as average and unattractive;
respectively and 10% as very attractive. (Graph 31)
IX. INTERGROUP COMPARISON FOR EVALUATING ORDER OF P REFERENCE OF
FACIAL STRUCTURES FROM FRONTAL AND PROFILE VIEW – M ALES (Table 43)
A. Frontal - From the frontal view, males had selected teeth as the best viewable structure (90%);
after teeth; lips (70%), gums (60%), nose (50%) was the order of preference of structures from the
frontal view. (Graph 44)

B. Profile - From the profile view, 70% of males had chosen position of lower jaw as the best
viewable parameter; after position of lower jaw, nose (40%) and teeth (10%) were the order
preference in the profile view. (Graph 44)
X. INTERGROUP COMPARISON FOR EVALUATING ORDER OF PR EFERENCE OF
FACIAL STRUCTURES FROM FRONTAL AND PROFILE VIEW – F EMALES (Table
43)
A. FRONTAL - Females had chosen teeth as the best viewable structure (90%); after teeth; Gums
(80%), Nose (70%), Lips (60%), Position of lower jaw (40%) was the order of preference of
structures from the frontal view. (Graph 44)
B. PROFILE – Among females; 40% had chosen position of lower jaw as the best viewable
structure from the profile view followed by nose (20%).
XI. INTERGROUP COMPARISON FOR CORRECTION OF VARIOUS STRUCTURES
BETWEEN MALES AND FEMALES (Table 44, Graph 45)
Out of 20 samples, 16 of them wanted correction in any part of the face, to increase the facial
attractiveness. Among these, 9 belonged to group A (males) and 7 belonged to group B(females).
Among males, 77.8% opted for correction of their teeth, 55.6 % opted for correction of chin and
nose each, 44.4% opted for correction of lips and 22.2% opted for correction of gums in the order
of preference. Among females, 71.4% opted for correction of their teeth, 28.6% opted for
correction of chin and 14.3% each opted for correction of lips, gums and nose in the order of
preference.
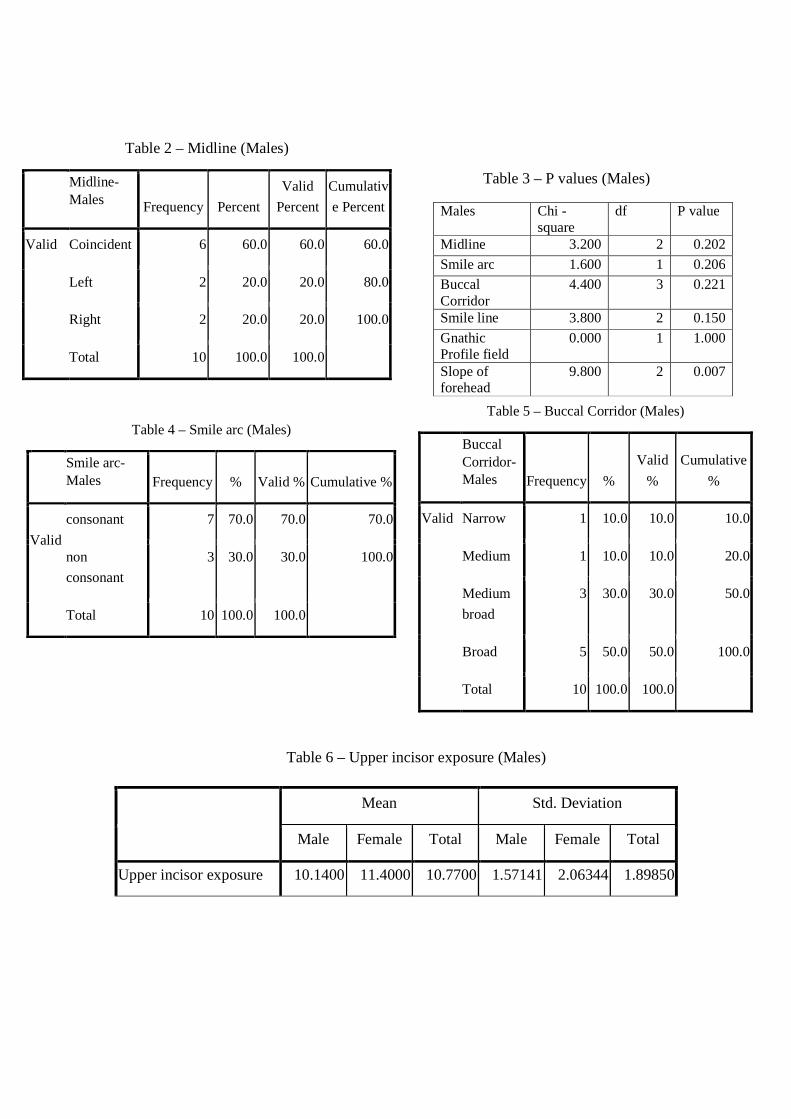
Table 2 – Midline (Males)
Midline-Males Frequency Percent
Valid
Percent
Cumulativ
e Percent
Valid Coincident 6 60.0 60.0 60.0
Left 2 20.0 20.0 80.0
Right 2 20.0 20.0 100.0
Total 10 100.0 100.0
Males Chi - square
df P value
Midline 3.200 2 0.202
Smile arc 1.600 1 0.206
Buccal Corridor
4.400 3 0.221
Smile line 3.800 2 0.150
Gnathic Profile field
0.000 1 1.000
Slope of forehead
9.800 2 0.007
Table 4 – Smile arc (Males)
Smile arc-Males Frequency % Valid % Cumulative %
Valid
consonant 7 70.0 70.0 70.0
non
consonant
3 30.0 30.0 100.0
Total 10 100.0 100.0
Table 5 – Buccal Corridor (Males)
Buccal Corridor-Males Frequency %
Valid
%
Cumulative
%
Valid Narrow 1 10.0 10.0 10.0
Medium 1 10.0 10.0 20.0
Medium
broad
3 30.0 30.0 50.0
Broad 5 50.0 50.0 100.0
Total 10 100.0 100.0
Mean Std. Deviation
Male Female Total Male Female Total
Upper incisor exposure 10.1400 11.4000 10.7700 1.57141 2.06344 1.89850
Table 3 – P values (Males)
Table 6 – Upper incisor exposure (Males)

Table 7 – Lower incisor exposure (Males)
Table 9 – Interlabial gap (Males)
Mean Std. Deviation
Male Female Total Male Female Total
Lower incisor exposure 3.3400 1.7300 2.5350 2.00122 2.16182 2.18927
Table 8 – Smile line (Males)
Smile line Frequency Percent Valid Percent Cumulative Percent
Valid Low 6 60.0 60.0 60.0
Average 3 30.0 30.0 90.0
High 1 10.0 10.0 100.0
Total 10 100.0 100.0
Mean Std. Deviation
Male Female Total Male Female Total
Interlabial gap 13.3700 13.6300 13.5000 2.46218 2.83355 2.58701
Table 10 – Labiolingual inclination (Males)
Mean Std. Deviation
Male Female Total Male Female Total
Labiolingual inclination
-.2500 -2.3000 -1.2750 3.75093 1.25167 2.91762

Table 11 – Gnathic Profile Field (Males)
Gender Gnathic Profile Field Frequency Percent Valid Percent Cumulative Percent
Male Valid Average face, gnathic profile, slanting backward 5 50.0 50.0 50.0
Anteface, gnathic profile, slanting backward 5 50.0 50.0 100.0
Total 10 100.0 100.0
Table 12 – Slope of forehead (Males)
Slope of forehead - Males Frequency Percent Valid Percent Cumulative Percent
Valid Flat 1 10.0 10.0 10.0
Steep 8 80.0 80.0 90.0
Protruding 1 10.0 10.0 100.0
Total 10 100.0 100.0
Table 13 – Midline (Females)
Midline - Females
Frequency %
Valid
%
Cumulati
ve %
Valid Coincident 1 10.0 10.0 10.0
Right 9 90.0 90.0 100.0
Total 10 100.0 100.0
Females Chi-square df P value
Midline 6.400 1 0.011
Smile arc 1.600 1 0.206
Buccal Corridor 3.600 3 0.308
Smile line 3.600 1 0.058
Profile 3.600 1 0.058
Ganthic profile field
0.400 1 0.011
Nasal Contour 6.400 1 0.011
Slope of forehead 6.400 1 0.011
Table 14 – P values (Females)

Table 15 – Smile arc (Females)
Smile arc - Females
Frequency Percent Valid Percent
Cumulative
Percent
Valid consonant 7 70.0 70.0 70.0
non
consonant
3 30.0 30.0 100.0
Total 10 100.0 100.0
Table 16 – Buccal Corridor (Females)
Buccal corridor - Females Frequency Percent Valid Percent Cumulative Percent
Valid Narrow 1 10.0 10.0 10.0
Medium 4 40.0 40.0 50.0
Medium broad 4 40.0 40.0 90.0
Broad 1 10.0 10.0 100.0
Total 10 100.0 100.0
Table 17 – Smile line (Females)
Smile line - Females Frequency Percent Valid Percent
Cumulative
Percent
Valid Average 8 80.0 80.0 80.0
High 2 20.0 20.0 100.0
Total 10 100.0 100.0
Table 18 – Profile (Females)
Profile - Females
Frequency Percent Valid Percent
Cumulative
Percent
Valid Straight 2 20.0 20.0 20.0
Convex 8 80.0 80.0 100.0
Total 10 100.0 100.0

Table 19 – Gnathic Profile Field (Females)
Gnathic Profile field - Females
Frequency %
Valid % Cumulative %
Valid anteface, gnathic profile, slanting backwards 9 90.0 90.0 90.0
average face, gnathic profile, slanting backward 1 10.0 10.0 100.0
Total 10 100.
0
100.0
Table 20 – Nasal Contour ( Females)
Nasal Contour - Females
Frequ
ency Percent
Valid
Percent
Cumulative
Percent
Valid Straight 9 90.0 90.0 90.0
Convex 1 10.0 10.0 100.0
Total 10 100.0 100.0
Table 21 – Slope of forehead (Females)
Slope of forehead - Females Frequency Percent
Valid
Percent
Cumulative
Percent
Valid Flat 9 90.0 90.0 90.0
Steep 1 10.0 10.0 100.0
Total 10 100.0 100.0
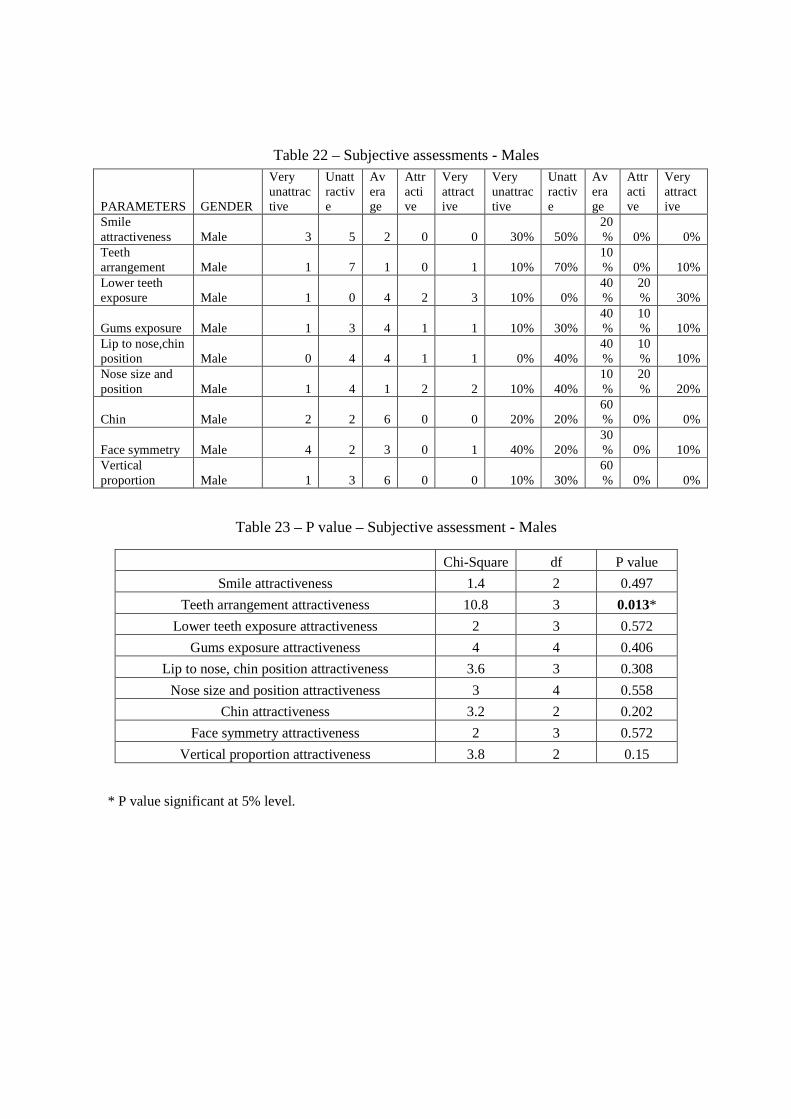
Table 22 – Subjective assessments - Males
Table 23 – P value – Subjective assessment - Males
* P value significant at 5% level.
PARAMETERS GENDER
Very unattractive
Unattractive
Average
Attractive
Very attractive
Very unattractive
Unattractive
Average
Attractive
Very attractive
Smile attractiveness Male 3 5 2 0 0 30% 50%
20% 0% 0%
Teeth arrangement Male 1 7 1 0 1 10% 70%
10% 0% 10%
Lower teeth exposure Male 1 0 4 2 3 10% 0%
40%
20% 30%
Gums exposure Male 1 3 4 1 1 10% 30% 40%
10% 10%
Lip to nose,chin position Male 0 4 4 1 1 0% 40%
40%
10% 10%
Nose size and position Male 1 4 1 2 2 10% 40%
10%
20% 20%
Chin Male 2 2 6 0 0 20% 20% 60% 0% 0%
Face symmetry Male 4 2 3 0 1 40% 20% 30% 0% 10%
Vertical proportion Male 1 3 6 0 0 10% 30%
60% 0% 0%
Chi-Square df P value
Smile attractiveness 1.4 2 0.497
Teeth arrangement attractiveness 10.8 3 0.013*
Lower teeth exposure attractiveness 2 3 0.572
Gums exposure attractiveness 4 4 0.406
Lip to nose, chin position attractiveness 3.6 3 0.308
Nose size and position attractiveness 3 4 0.558
Chin attractiveness 3.2 2 0.202
Face symmetry attractiveness 2 3 0.572
Vertical proportion attractiveness 3.8 2 0.15
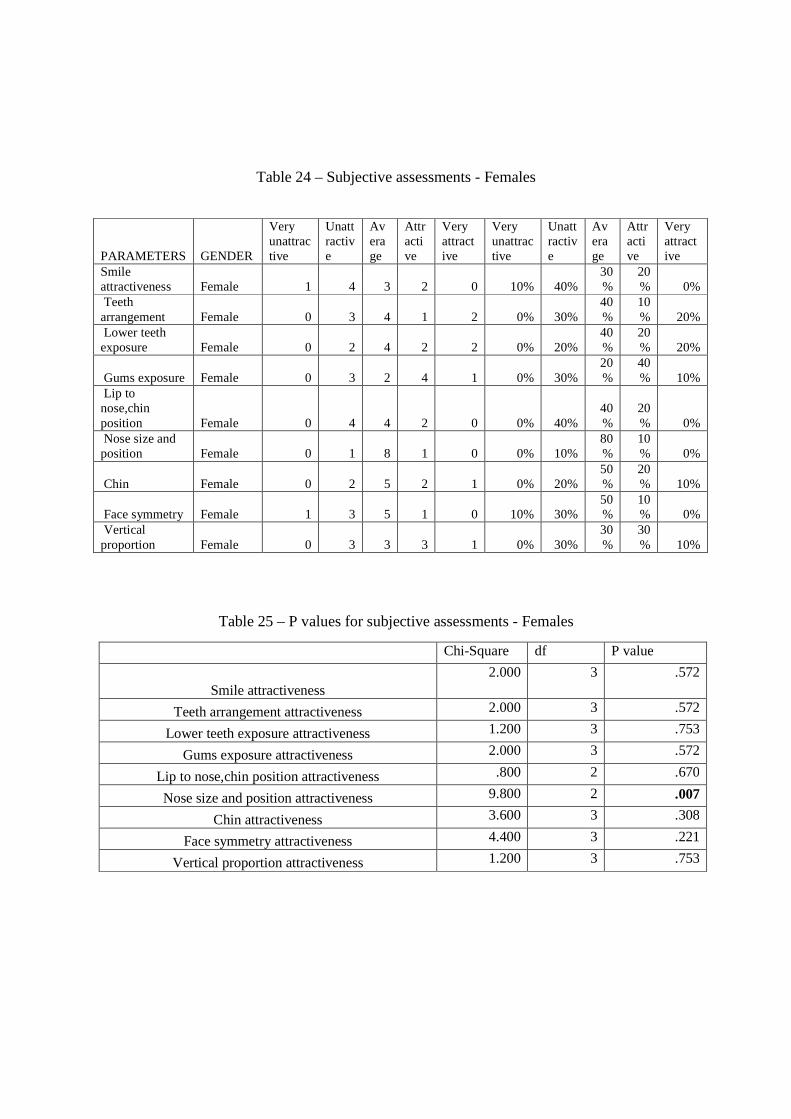
Table 24 – Subjective assessments - Females
Table 25 – P values for subjective assessments - Females
Chi-Square df P value
Smile attractiveness 2.000 3 .572
Teeth arrangement attractiveness 2.000 3 .572
Lower teeth exposure attractiveness 1.200 3 .753
Gums exposure attractiveness 2.000 3 .572
Lip to nose,chin position attractiveness .800 2 .670
Nose size and position attractiveness 9.800 2 .007
Chin attractiveness 3.600 3 .308
Face symmetry attractiveness 4.400 3 .221
Vertical proportion attractiveness 1.200 3 .753
PARAMETERS GENDER
Very unattractive
Unattractive
Average
Attractive
Very attractive
Very unattractive
Unattractive
Average
Attractive
Very attractive
Smile attractiveness Female 1 4 3 2 0 10% 40%
30%
20% 0%
Teeth arrangement Female 0 3 4 1 2 0% 30%
40%
10% 20%
Lower teeth exposure Female 0 2 4 2 2 0% 20%
40%
20% 20%
Gums exposure Female 0 3 2 4 1 0% 30% 20%
40% 10%
Lip to nose,chin position Female 0 4 4 2 0 0% 40%
40%
20% 0%
Nose size and position Female 0 1 8 1 0 0% 10%
80%
10% 0%
Chin Female 0 2 5 2 1 0% 20% 50%
20% 10%
Face symmetry Female 1 3 5 1 0 10% 30% 50%
10% 0%
Vertical proportion Female 0 3 3 3 1 0% 30%
30%
30% 10%

Table 27 – P values for objective assessments - Combined
Table 26 – Midline - Combined
Midline
Frequency Percent Valid Percent Cumulative
Percent
Valid Coincident 7 35.0 35.0 35.0
Left 2 10.0 10.0 45.0
Right 11 55.0 55.0 100.0
Total 20 100.0 100.0
Chi - square
df P value
Midline 6.100 2 0.047
Smile arc 3.200 1 0.074
Buccal Corridor 2.800 3 0.423
Smile line 4.900 2 0.086
Profile 12.800 1 0.000
Gnathic profile field
3.200 1 0.074
Nasal Contour 16.200 1 0.000
Slope of forehead 7.3 2 0.026
Table 28 – Smile arc - Combined
Smile arc
Frequency Percent Valid Percent Cumulative
Percent
Valid consonant 14 70.0 70.0 70.0
non consonant 6 30.0 30.0 100.0
Total 20 100.0 100.0

Table 31 – Numerical parameters – P values
Table 29 – Buccal Corridor - Combined
Buccal Corridor Frequency Percent Valid Percent Cumulative Percent
Valid Narrow 2 10.0 10.0 10.0
Medium 5 25.0 25.0 35.0
Medium broad 7 35.0 35.0 70.0
Broad 6 30.0 30.0 100.0
Total 20 100.0 100.0
Table 30 - Mean Values and Std. Deviations for UI and LI exposure
Mean Std. Deviation
Male Female Total Male Female Total
Upper incisor exposure
10.1400 11.4000 10.7700 1.57141 2.06344 1.89850
Lower incisor exposure
3.3400 1.7300 2.5350 2.00122 2.16182 2.18927
P value Upper Incisor Exposure 0.142 Lower Incisor Exposure 0.101 Interlabial gap 0.829

Table – 32 – Smile line (Combined)
Smile line Frequency Percent Valid Percent Cumulative Percent
Valid Low 6 30.0 30.0 30.0
Average 11 55.0 55.0 85.0
High 3 15.0 15.0 100.0
Total 20 100.0 100.0
Table – 33 – Profile (Combined)
Profile Frequency Percent Valid Percent Cumulative Percent
Valid Straight 2 10.0 10.0 10.0
Convex 18 90.0 90.0 100.0
Total 20 100.0 100.0

Table 34 – Labiolingual inclination (Mean, SD)
Male Female Total
N 10 10 20
Mean -.2500 -2.3000 -1.2750
Std. Deviation 3.75093 1.25167 2.91762
Minimum -5.00 -4.00 -5.00
Maximum 7.00 -1.00 7.00
Sum of Squares df
Mean Square F
P value
Between Groups
21.012 1 21.012 2.688 .118
Within Groups
140.725 18 7.818
Total 161.737 19
Table 37 – Nasal Contour (Combined)
Nasal Contour Frequency Percent Valid Percent
Cumulative Percent
Valid Straight 19 95.0 95.0 95.0
Convex 1 5.0 5.0 100.0
Total 20 100.0 100.0
Table 36 – Gnathic Profile field (Combined)
Gnathic profile field Frequency Percent Valid % Cumulative %
Valid Average face, gnathic profile, slanting backward 14 70.0 70.0 70.0
Anteface, gnathic profile, slanting backward 6 30.0 30.0 100.0
Total 20 100.0 100.0
Table 35 – Labiolingual inclination (P value)

Table 39 – Subjective Parameters (Combined)
Table 38 – Slope of forehead (Combined)
Slope of forehead Frequency Percent Valid Percent Cumulative Percent
Valid Flat 10 50.0 50.0 50.0
Steep 9 45.0 45.0 95.0
Protruding 1 5.0 5.0 100.0
Total 20 100.0 100.0
PARAMETERS GENDER
Very unattractive
Unattractive
Average
Attractive
Very attractive
Very unattractive
Unattractive
Average
Attractive
Very attractive
Smile attractiveness Male 3 5 2 0 0 30% 50%
20% 0% 0%
Female 1 4 3 2 0 10% 40% 30%
20% 0%
Combined 4 9 5 2 0 20% 45% 25%
10% 0%
Teeth arrangement attractiveness Male 1 7 1 0 1 10% 70%
10% 0% 10%
Female 0 3 4 1 2 0% 30% 40%
10% 20%
Combined 1 10 5 1 3 5% 50% 25% 5% 15%
Lower teeth exposure attractiveness Male 1 0 4 2 3 10% 0%
40%
20% 30%
Female 0 2 4 2 2 0% 20% 40%
20% 20%
Combined 1 2 8 4 5 5% 10% 40%
20% 25%
Gums exposure attractiveness Male 1 3 4 1 1 10% 30%
40%
10% 10%
Female 0 3 2 4 1 0% 30% 20%
40% 10%
Combined 1 6 6 5 2 5% 30% 30%
25% 10%
Face symmetry attractiveness Male 4 2 3 0 1 40% 20%
30% 0% 10%
Female 1 3 5 1 0 10% 30% 50%
10% 0%
Combined 5 5 8 1 1 25% 25% 40% 5% 5%
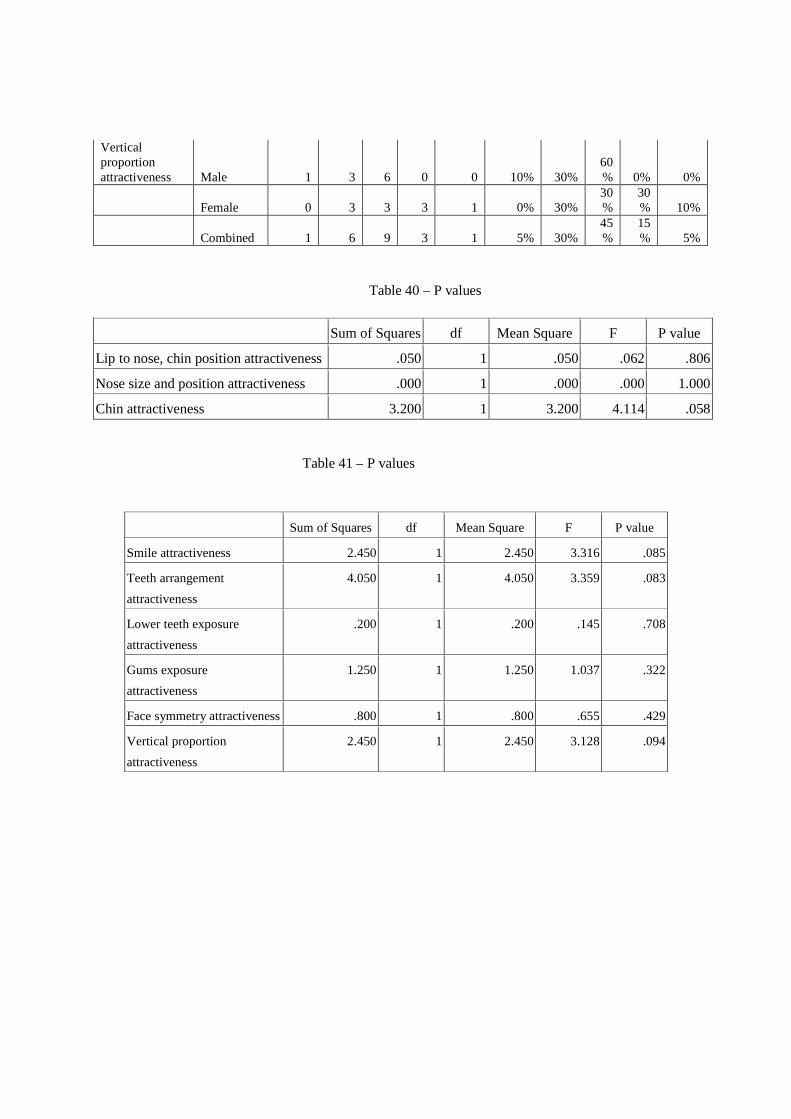
Vertical proportion attractiveness Male 1 3 6 0 0 10% 30%
60% 0% 0%
Female 0 3 3 3 1 0% 30% 30%
30% 10%
Combined 1 6 9 3 1 5% 30% 45%
15% 5%
Sum of Squares df Mean Square F P value
Lip to nose, chin position attractiveness .050 1 .050 .062 .806
Nose size and position attractiveness .000 1 .000 .000 1.000
Chin attractiveness 3.200 1 3.200 4.114 .058
Sum of Squares df Mean Square F P value
Smile attractiveness 2.450 1 2.450 3.316 .085
Teeth arrangement
attractiveness
4.050 1 4.050 3.359 .083
Lower teeth exposure
attractiveness
.200 1 .200 .145 .708
Gums exposure
attractiveness
1.250 1 1.250 1.037 .322
Face symmetry attractiveness .800 1 .800 .655 .429
Vertical proportion
attractiveness
2.450 1 2.450 3.128 .094
Table 40 – P values
Table 41 – P values

PARAMETERS GENDER
Very unattractive
Unattractive
Average
Attractive
Very attractive
Very unattractive
Unattractive
Average
Attractive
Very attractive
Lip to nose, chin position attractiveness Male 0 4 4 1 1 0% 40%
40% 10% 10%
Female 0 4 4 2 0 0% 40% 40% 20% 0%
Combined 0 8 8 3 1 0% 40% 40% 15% 5%
Nose size and position attractiveness Male 1 4 1 2 2 10% 40%
10% 20% 20%
Female 0 1 8 1 0 0% 10% 80% 10% 0%
Combined 1 5 9 3 2 5% 25% 45% 15% 10%
Chin attractiveness Male 2 2 6 0 0 20% 20%
60% 0% 0%
Female 0 2 5 2 1 0% 20% 50% 20% 10%
Combined 2 4 11 2 1 10% 20% 55% 10% 5%
FRONTAL % within Gender* PROFILE
% within Gender*
Gender
combined
Gender Gender
combined
Gender
Male
Female
Male
Female
combined
Male
Female
Male
Female
combined
TEETH 9 9 18 90.0%
90.0% 90%
1 0 1 10.0%
.0% 5%
GUM 6 8 14 60.0%
80.0% 70%
0 0 0 0 0 0%
LIP 7 6 13 70.0%
60.0% 65%
0 0 0 0 0 0%
NOSE 5 7 12 50.0%
70.0% 60%
4 2 6 40.0%
20.0% 30%
JAW POSITION
0 4 4 .0% 40.0% 20%
7 4 11 70.0%
40.0% 55%
Table 42 – Profile view – Subjective assessments
Table 43 – Order of preference of structures

Table 44 – Correction needed (Combined)
Correction needed
Total
Teeth correction
Lip correction
Gum correction
Nose correction
Chin correction
gender Male Count 7 4 2 5 5 9
% within gender*
77.8% 44.4% 22.2% 55.6% 55.6%
Female Count 5 1 1 1 2 7
% within gender*
71.4% 14.3% 14.3% 14.3% 28.6%
Total Count 12 5 3 6 7 16
*Percentages and totals are based on respondents.

Graph – 1 (Midline - Males) Graph – 2 (Smile arc - Males)
Graph – 3 (Buccal Corridor – Males) Graph – 4 (Upper incisor exposure – Males)

Anteroposterior posistion
Graph – 6 (Smile line – Males) Graph – 5 (Lower incisor exposure – Males)
Graph – 7 (Interlabial gap – Males) Graph – 8 (Anteroposterior position of upper incisors to forehead)

Graph – 9 (Gnathic Profile field – Males) Graph – 10 – Slope of forehead (Males)
Graph – 11 (Midline – Males)
Graph - 12
Graph – 13 – Buccal Corridor - Females Graph – 14 – Upper incisor exposure – Females)
Graph – 12 (Smile arc – Males)

Graph – 19 ( AP position of maxillary incisors - females)
Graph – 15 – (Lower incisor exposure – Females)
Graph – 16 – (Smile line – Females)
Graph – 17 (Interlabial gap – Females) Graph – 18 (Profile – Females)
Graph – 20 (Gnathic Profile field – Females)

Graph 26 – Vertical proportions of face Graph 25 - Smile attractiveness
Graph – 21 (Nasal Contour – Females) Graph – 22 (Slope of forehead – Females)
Graph 23 – Facial symmetry Graph 24 – Arrangement of teeth
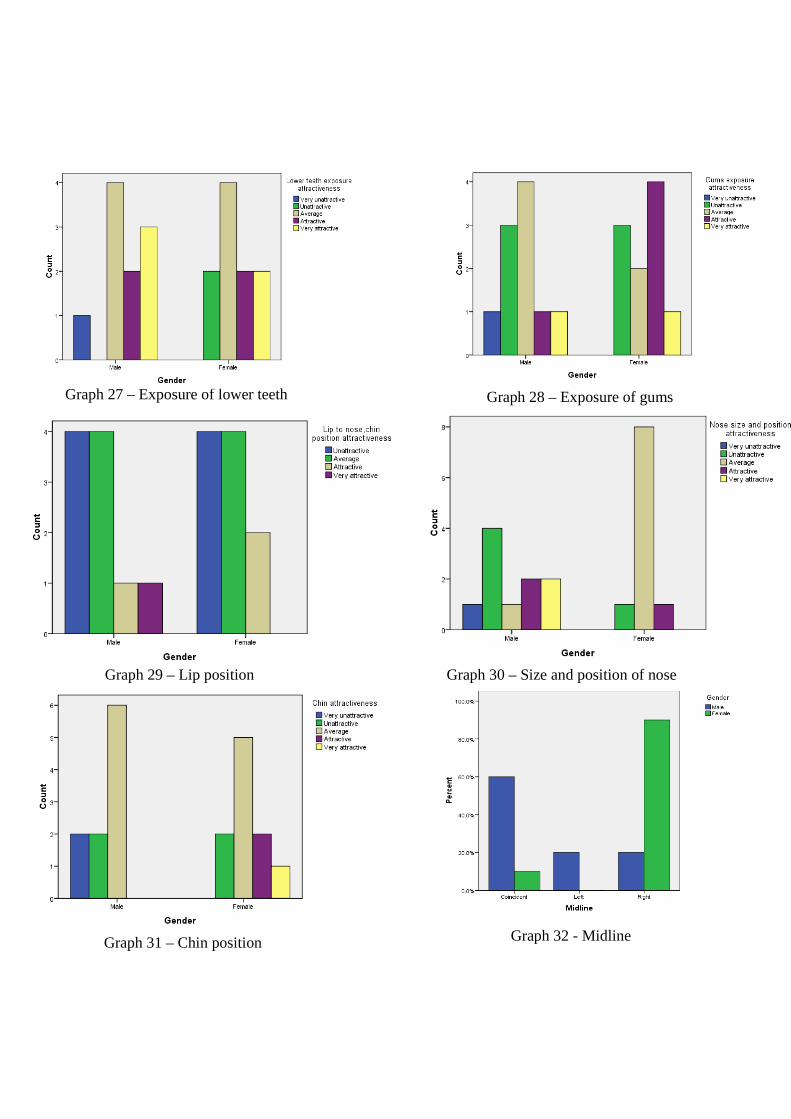
Graph 27 – Exposure of lower teeth
Graph 31 – Chin position
Graph 25 Graph 26
Graph 28 – Exposure of gums
Graph 29 – Lip position Graph 30 – Size and position of nose
Graph 32 - Midline

Graph 33 – Smile arc
Graph 34 – Buccal Corridor
Graph 35 – Upper incisor exposure Graph 36 – Lower incisor exposure

Graph 37 – Smile line Graph 38 – Interlabial gap
Graph 39 - Profile Graph 40 – Antero-posterior position of
maxillary incisors to forehead
An
tero
post
erio
r po
sitio
n

Graph 43 – Slope of forehead
Graph 41 – Position of chin Graph 42 – Nasal Contour
0
2
4
6
8
10
Male Female Male Female
FRONTAL PROFILE
TEETH GUM LIP NOSE JAW POSITION
Graph 44 – Preference of structures
Graph 45 – Correction of structures

DISCUSSION

DISCUSSION
“Beauty lies in the eyes of the beholder”; was put forth by Margaret Hungerford in 1878;
meaning it is subjective opinion. Hence, it is almost impossible to define the ideal smile because
there is much variation in opinion across individuals, ages, cultures and civilizations.80The
emergence of esthetic paradigm has resulted in greater emphasis on facial attractiveness. The “art
of smile” lies in the Orthodontists ability to recognize the positive elements of beauty in each
patient and to create a plan to improve those that fall outside the parameters of the prevailing
esthetic concept.21 Facial attractiveness and smile attractiveness appears to be strongly correlated
to each other.7 The reason being, in social interaction, ones attention is mainly directed towards
mouth and eyes on the speakers face. As the mouth is center of communication in the face, smile
plays an important role in facial expression and appearance.81
In this study, the focus is on smile attractiveness and the interplay between hard, soft tissue
components of smile (objective evaluation) and facial attractiveness (subjective evaluation).9
Dimensional measurements in three planes of space were taken into account to analyze smile
attractiveness and relate it to overall facial attractiveness in frontal and profile views.65 Here, the
focus was on dimensional measurements to improve reliability by using standardized photographs
and calculating enlargement ratio from the subjects maxillary central incisor width to rule out any
magnification errors42. None of the studies from past literature has accounted attractiveness of
posed smile in these two views to find a correlation between subjective opinions and objective
measurements.
In this study, 20 samples were equally divided into 2 groups based on gender. This study
was undertaken with the aim of relating smile esthetics in all three planes of space to overall facial
attractiveness. Proper standardization procedures were followed. The video recording was
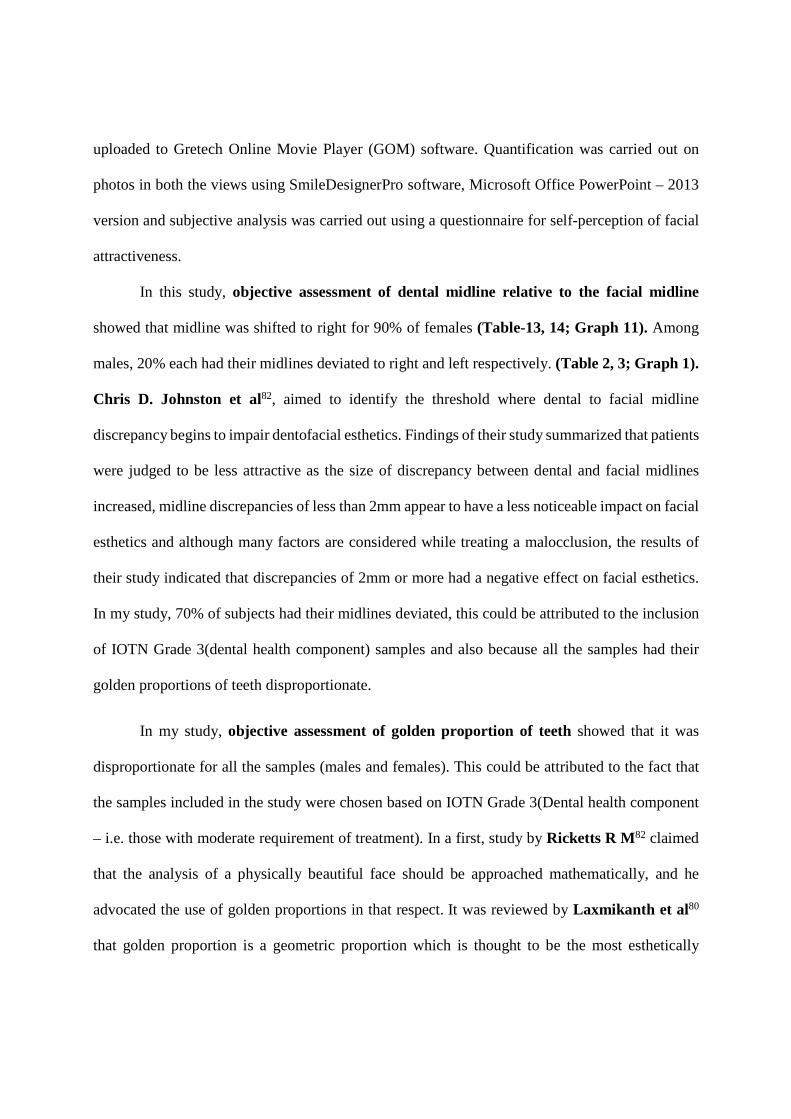
uploaded to Gretech Online Movie Player (GOM) software. Quantification was carried out on
photos in both the views using SmileDesignerPro software, Microsoft Office PowerPoint – 2013
version and subjective analysis was carried out using a questionnaire for self-perception of facial
attractiveness.
In this study, objective assessment of dental midline relative to the facial midline
showed that midline was shifted to right for 90% of females (Table-13, 14; Graph 11). Among
males, 20% each had their midlines deviated to right and left respectively. (Table 2, 3; Graph 1).
Chris D. Johnston et al82, aimed to identify the threshold where dental to facial midline
discrepancy begins to impair dentofacial esthetics. Findings of their study summarized that patients
were judged to be less attractive as the size of discrepancy between dental and facial midlines
increased, midline discrepancies of less than 2mm appear to have a less noticeable impact on facial
esthetics and although many factors are considered while treating a malocclusion, the results of
their study indicated that discrepancies of 2mm or more had a negative effect on facial esthetics.
In my study, 70% of subjects had their midlines deviated, this could be attributed to the inclusion
of IOTN Grade 3(dental health component) samples and also because all the samples had their
golden proportions of teeth disproportionate.
In my study, objective assessment of golden proportion of teeth showed that it was
disproportionate for all the samples (males and females). This could be attributed to the fact that
the samples included in the study were chosen based on IOTN Grade 3(Dental health component
– i.e. those with moderate requirement of treatment). In a first, study by Ricketts R M82 claimed
that the analysis of a physically beautiful face should be approached mathematically, and he
advocated the use of golden proportions in that respect. It was reviewed by Laxmikanth et al80
that golden proportion is a geometric proportion which is thought to be the most esthetically
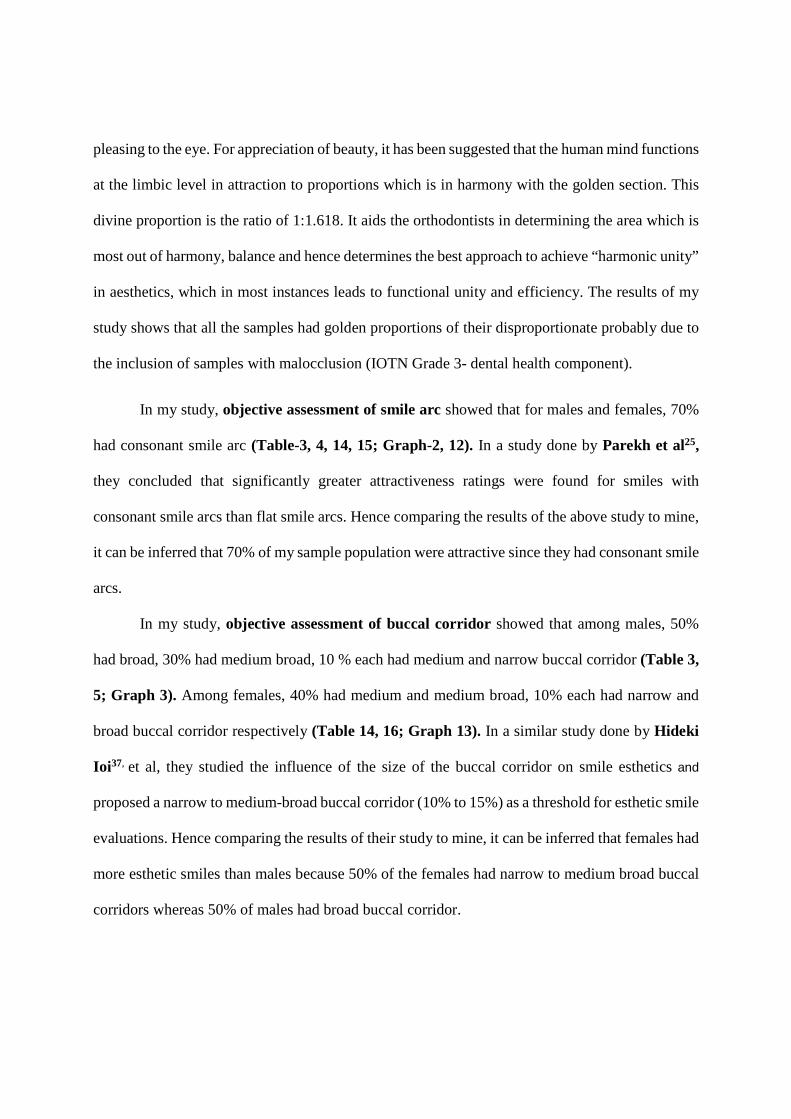
pleasing to the eye. For appreciation of beauty, it has been suggested that the human mind functions
at the limbic level in attraction to proportions which is in harmony with the golden section. This
divine proportion is the ratio of 1:1.618. It aids the orthodontists in determining the area which is
most out of harmony, balance and hence determines the best approach to achieve “harmonic unity”
in aesthetics, which in most instances leads to functional unity and efficiency. The results of my
study shows that all the samples had golden proportions of their disproportionate probably due to
the inclusion of samples with malocclusion (IOTN Grade 3- dental health component).
In my study, objective assessment of smile arc showed that for males and females, 70%
had consonant smile arc (Table-3, 4, 14, 15; Graph-2, 12). In a study done by Parekh et al25,
they concluded that significantly greater attractiveness ratings were found for smiles with
consonant smile arcs than flat smile arcs. Hence comparing the results of the above study to mine,
it can be inferred that 70% of my sample population were attractive since they had consonant smile
arcs.
In my study, objective assessment of buccal corridor showed that among males, 50%
had broad, 30% had medium broad, 10 % each had medium and narrow buccal corridor (Table 3,
5; Graph 3). Among females, 40% had medium and medium broad, 10% each had narrow and
broad buccal corridor respectively (Table 14, 16; Graph 13). In a similar study done by Hideki
Ioi37, et al, they studied the influence of the size of the buccal corridor on smile esthetics and
proposed a narrow to medium-broad buccal corridor (10% to 15%) as a threshold for esthetic smile
evaluations. Hence comparing the results of their study to mine, it can be inferred that females had
more esthetic smiles than males because 50% of the females had narrow to medium broad buccal
corridors whereas 50% of males had broad buccal corridor.

In my study, objective assessment of mean values of upper and lower incisor exposure
reveals that females had greater upper incisor exposure(11.4mm) than males(10.14mm) and males
had greater lower incisor exposure(3.34mm) than females(1.73mm) (Table – 30, 31, 32; Graph
– 35, 36). The results obtained here concurs with that done by Vig RG et al85 in which they found
similar observations with mean value of upper incisor exposure for females as 10.5+/-2.1mm and
males as 9.8mm+/-2.2mm depicting that females had more upper incisor exposure than males.
In my study, objective assessment of smile line showed that among males; 60% of
samples had a low smile line, 30% had average smile line and 10% had high smile line (Table 3,
8; Graph 6). Among females, 80% had average smile line and rest 20% had high smile line (Table
14, 17; Graph 16). In a study conducted by Van der Geld P7 it was found that smile line which
was positioned such that the teeth were entirely displayed and some gingiva [average smile line -
(2 to 4 mm)] were regarded as the most esthetic. Hence it can inferred from my study that females
had more esthetic smiles than males because 80% of females had average smile line.
In my study, objective assessment of interlabial gap showed that males had a mean
interlabial gap of 13.37+/-2.462mm and females had a mean value of 13.63 +/-2.833mm. It can be
seen that in this group of samples, females had more interlabial gap than males (Table 9, 34;
Graph 38). In a study done by Weeden et al86, they concurred that the increase in interlabial gap
could be due to greater amount of facial movements during smiling. Hence when comparing the
results of their study to mine; it can be inferred that females had more facial movements than males
which resulted in a greater interlabial gap than males.
In my study, objective assessment of mean values of AP relationship upper incisor to
forehead shows that females and males had their maxillary central incisors positioned posterior to
foreheads FFA point. (Table – 36, 37; Graph – 40). However, results of my study shows that

females had their maxillary central incisor positioned behind foreheads FFA point to a greater
extent than males. The results of my study concurs with that done by Will Alan Andrews 72 in
which he found that 64% of his sample population had maxillary central incisors positioned
posterior to foreheads FFA point. The findings from this study can be used for routine orthodontic
records diagnosis and treatment planning. The addition of a smiling profile photograph with the
forehead and maxillary incisors fully bared to diagnostic records and clinical evaluation will allow
the orthodontist to document the orientation of the patient’s maxillary central incisors to forehead.
Treatment goals should include the condition that maxillary central incisors be positioned
somewhere at or between foreheads FFA point and glabella and correlated with foreheads
inclination. Andrews proposed to use forehead as a reference to position maxillary incisors since
it is external and does not move during the course of treatment.
In my study, objective assessment of Gnathic profile field showed that 90% females had
an average face, gnathic profile, slanting backward (Table - 2, 19; Graph 20) and for males it was
non – significant with 50% each having average face, gnathic profile, slanting backward and
anteface, gnathic profile, slanting backward ( Table – 3,11 ; Graph 9). Hönn M. et al87 in their
study concluded that straight average face was perceived as most attractive, followed by
moderately retrognathic, as well as mildly prognathic profile lines. The results of my study shows
that 70% of samples had average face, gnathic profile, slanting backward; hence according to
aforementioned study, it could be concluded that 70% of samples were attractive.
In this study, objective assessment of slope of forehead for males showed 80% of male’s
had a steep forehead (Table – 2, 12; Graph 10). For females, 90% had a flat forehead (Table – 2,
21; Graph 22). In a smiliar study done by Farkas and Kolar88 they had stratified patients based
on facial attractiveness and concluded that very attractive patients had flat or protruding forehead

types whereas as those with steep forehead was considered less attractive. Their results were used
to stratify attractive samples based on slope of forehead in my study and it can be concluded that
females are more attractive than males as they had a flat forehead relative to males who had a steep
forehead. In a dissimilar study done by Heidi S. Ellis89 et al, they had simulated a forward or
backward movement of the forehead and kept the lower one third of face in its original and most
natural position, and assessed to determine if changes in the anteroposterior position of a patient’s
soft tissue glabella affects the evaluators subjective ratings of facial attractiveness. The results of
their study suggested that changes of AP position of the soft tissue glabella does impact the
appreciation of facial attractiveness, they attributed this to the fact that the ethnicity of evaluators
or judges can influence the perception of esthetics and another possible explanation was that the
samples had make-up applied for the photo and a few other samples had blemishes and other
distractions.90
In my study, subjective evaluation for relationship of arrangement of teeth to overall
facial attractiveness showed that among males, 70% had rated arrangement of teeth as
unattractive (Table – 22, 23; Graph – 24). Among females, 40% rated arrangement of teeth as
average (Table 24, 25; Graph - 24). Langlois JH et al91 had described the concept of averageness.
He said that averageness can be considered as attractive. Averageness has been demonstrated in
various studies to be a preferred design, but may even concede that beauty goes beyond being
merely more attractive and in fact, differs in important ways from being simply average. Hence
those who had rated their subjective evaluations as average were considered as attractive in my
study. 55% of samples in my study rated their teeth arrangement as unattractive, which could be
related to inclusion of malocclusion samples (IOTN Grade 3- dental component).
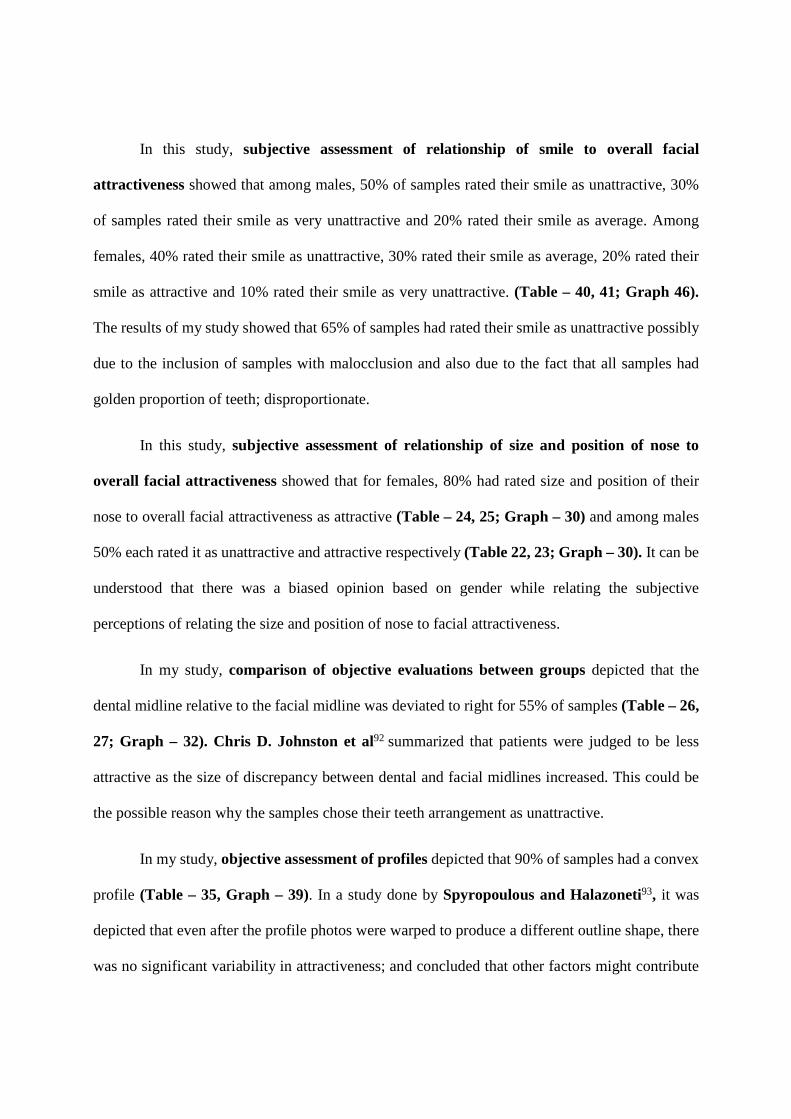
In this study, subjective assessment of relationship of smile to overall facial
attractiveness showed that among males, 50% of samples rated their smile as unattractive, 30%
of samples rated their smile as very unattractive and 20% rated their smile as average. Among
females, 40% rated their smile as unattractive, 30% rated their smile as average, 20% rated their
smile as attractive and 10% rated their smile as very unattractive. (Table – 40, 41; Graph 46).
The results of my study showed that 65% of samples had rated their smile as unattractive possibly
due to the inclusion of samples with malocclusion and also due to the fact that all samples had
golden proportion of teeth; disproportionate.
In this study, subjective assessment of relationship of size and position of nose to
overall facial attractiveness showed that for females, 80% had rated size and position of their
nose to overall facial attractiveness as attractive (Table – 24, 25; Graph – 30) and among males
50% each rated it as unattractive and attractive respectively (Table 22, 23; Graph – 30). It can be
understood that there was a biased opinion based on gender while relating the subjective
perceptions of relating the size and position of nose to facial attractiveness.
In my study, comparison of objective evaluations between groups depicted that the
dental midline relative to the facial midline was deviated to right for 55% of samples (Table – 26,
27; Graph – 32). Chris D. Johnston et al92 summarized that patients were judged to be less
attractive as the size of discrepancy between dental and facial midlines increased. This could be
the possible reason why the samples chose their teeth arrangement as unattractive.
In my study, objective assessment of profiles depicted that 90% of samples had a convex
profile (Table – 35, Graph – 39). In a study done by Spyropoulous and Halazoneti93, it was
depicted that even after the profile photos were warped to produce a different outline shape, there
was no significant variability in attractiveness; and concluded that other factors might contribute

more significantly to facial attractiveness than just the profile outline shape. Ronald J. Mackley94
stated that profile cannot be used as a reliable source of information to determine what a person’s
actual smile looks like. However assessment of profile can be used for diagnostic purposes,
particularly to identify patients with severe disproportions70. Hence it can be concluded that 90%
of samples included in my study had Class II skeletal pattern since they had convex profiles.
In my study, subjective evaluation to determine the order of preference of best
viewable structure from frontal and profile view was done in order to obtain an insight into the
structures influencing the decision of facial attractiveness and the results depicted that 90% of
samples felt that teeth was the best viewable structure from the frontal view; and 55% of samples
felt that position lower jaw was the best viewable from the profile view. A study done by Shaw et
al95; hypothesized that adolescents with normal dental appearance would be judged to be more
socially attractive than others. The results of my study, concurs with the results of the former study
in such a way that the sample population of my study had also considered appearance of teeth; the
most important while analyzing facial attractiveness on the whole. In another study done by Maple
et al28; they altered the position of lower jaw in 4-mm increments and found that when the
anteroposterior position of lower jaw was modified, the farthest the deviation from Class I, the
lesser the profiles were perceived attractive. Hence when comparing the results of the aforesaid
study to mine, it depicts the importance of position of lower jaw in profile view and shows the
importance of keeping orthodontic norms in mind for diagnosis and treatment planning.
In my study, when the subjects were asked regarding their choice of treatment for
correction of facial structures in order to improve attractiveness; it was seen that, 75% of
subjects had opted for correction of teeth which could possibly be due to the inclusion of samples
with malocclusion (IOTN-Grade 3-Dental health component). This is in accordance with the study

done by Havens et al10, who reported that arrangement of teeth is a more important factor for
evaluating facial esthetics. Therefore, contemporary orthodontists must consider esthetic smiles
by managing the dentition and soft tissues.
According to a study conducted by Mohan et al45 they mentioned that it is of prime
importance that the final outcome of orthodontic treatment is not entirely dependent on looks
alone. The ultimate goal is to achieve a pleasing composition in smile, by creating and arrangement
of various esthetics elements.
The results of my study concurs with that done by Schabel et al9, in such a way that not
all objective attributes of smile assessed, could predict attractive or unattractive smiles as judged
subjectively6. This could be attributed to the fact that individual perception of smile esthetics is
influenced by national/cultural backgrounds which in turn can affect multiple variables in unequal
ways96. Hence all of these factors are critical and should be considered in research and clinical
settings.

SUMMARY AND CONCLUSION

SUMMARY AND CONCLUSION
An in vivo study was conducted with the aim of evaluating smile attractiveness in all three
planes of space; from frontal and profile view; and to relate it to overall facial attractiveness. A
total of 20 samples were included in the study and divided equally into 2 groups based on gender;
following which objective and subjective assessments were done. All standardization procedures
were carried out and a video of 10 seconds duration was recorded with two cameras, placed at
right angles to each other, covering both the views at the same time. The best frame depicting
unstrained posed smile was selected for both the views and transferred to SmileDesignerPro
software and quantification was done for objective assessments. A questionnaire together with a
template consisting of photographs in frontal and profile view were distributed to the samples for
assessing facial attractiveness subjectively. Intra group and inter group comparisons were carried
out for both the views based on gender; separately for objective and subjective assessments.
At the end of my study, after finalizing the results statistically, I would like to conclude that;
1. In the profile view, in sagittal plane of space;
a. 50% of males and 40% of females had related the findings of gnathic profile field to be
unattractive, because the samples had a class II skeletal pattern.
b. All males and 95% females, had a straight nasal contour, in spite of that, 50% of males
had related, nasal contour to overall facial attractiveness as unattractive and 80% of females had
rated it as average.

c. 80% of males had a steep slope of forehead and 90% of females had flat forehead
depicting that females were more attractive than males.
d. 70% of males and 40% of females selected chin as the best viewable structure from
profile view to assess overall facial attractiveness.
e. The antero-posterior relationship of maxillary incisors to forehead, as indicated by
Goal anterior limit line, revealed that females had more retroclined incisors than males.
2. In the frontal view , in transverse plane of space;
a. All samples had disproportionate, golden proportion of their teeth, indicating irregular
arrangement of teeth, when viewed from frontal view. 70% of males and 50% of females felt, the
arrangement of teeth to be unattractive, when related to overall facial attractiveness.
b. 80% of males and 50% females had rated their smile as unattractive despite of 70% of
males and females having consonant smile arcs.
c. 90% of males and females had selected teeth as the best viewable structure from frontal
view to assess overall facial attractiveness.
d. 50% of males had broad buccal corridor and 40% of females had medium buccal
corridors depicting that females had more attractive smiles than males.
3. In the frontal view, in vertical plane of space;
a. 60% of males and 30% of females felt that vertical proportions of their faces were
unattractive since all the samples had vertically disproportionate face.
b. 40% of both males and females had related exposure of lower teeth, averagely to facial
attractiveness.

c. In objective findings, 30% of males and 80% of females had an average smile line; but
subjectively, 80% males and 70% females rated their smile to be unattractive.
d. The mean values of inter labial gap for females were more than males, and 40% of both
the genders, rated their lip position as unattractive and only 20% of both the genders found it
attractive.
3. 77.8% of males and 71.4% of females had opted for correction of their teeth to improve their
overall facial attractiveness.
Several areas discussed in this study that requires further explanation could include the
development of a more comprehensive scale for measuring facial attractiveness, increasing the
number, types of samples and raters to represent varied ethnic backgrounds, socioeconomic status,
and age groups which would enable the results to be generalized to other populations. With the
use of modern technology including 3- dimensional imaging and animation one can broaden the
study of perception of facial attractiveness. These aforementioned points should be considered as
determining factors in the future, for more comprehensive studies.
The structures assessed in this study are often overlooked in orthodontic treatment
planning. These structures should not be considered as rigid boundaries, but as artistic guidelines
to help orthodontists, treat patients to improve their overall facial attractiveness.

BIBLIOGRAPHY

BIBLIOGRAPHY
1. Hrushikesh Aphale, Sunil Kumar N, Prasad Gayake, Dipak Sahane , Harsha
Mahajan. The Ideal Smile and Its Characteristics. JDPMS 2012;1 : 1-6
2. Laurie McNamara, James A. McNamara, Jr, Marc B. Ackerman, and Tiziano
Baccett. Hard- and soft-tissue contributions to the esthetics of the posed smile in growing
patients seeking orthodontic treatment. Am J Orthod Dentofacial Orthop 2008; 133:491-9.
3. Christopher Maulika and Ravindra Nanda. Dynamic smile analysis in young adults.
Am J Orthod Dentofacial Orthop 2007; 132:307-315.
4. Li Cao, Ke Zhang, Ding Bai, Yan Jing, Ye Tian, Yongwen Guo. Effect of maxillary
incisor labiolingual inclination and anteroposterior position on smiling profile esthetics.
Angle Orthod. 2011; 81:121–129.
5. Ke Zhang et al. Effects of transverse relationships between maxillary arch, mouth, and
face on smile esthetics. Angle Orthod. 2016; 86:135-141
6. Catherine McLeod et al. Esthetics and smile characteristics evaluated by laypersons.
Angle Orthod. 2011; 81:198-205.
7. Pieter Van der Geld, Paul Oosterveld, Guus Van Heck, Anne Marie Kuijpers-
Jagtman. Smile attractiveness. Angle Orthod. 2007; 77:759-765.
8. David C. Havens, James A. McNamara Jr, Lauren Singler and Tiziano Bacetti. The
role of posed smile in overall facial esthetics. Angle Orthod. 2010; 80:322-328.

9. Brian J. Schabel, Lorenzo Franchi, Tiziano Baccetti, James A. McNamara. Subjective
vs objective evaluations of smile esthetics. Am J Orthod Dentofacial Orthop 2009;
135:S72-9.
10. Havens DC, McNamara JA Jr, Sigler LM, Baccetti T. The role of the posed smile in
overall facial esthetics. Angle Orthod 2010; 80:322-8.
11. Joan F. Walder, Katherine Freeman, Mitchell J. Lipp, Olivier F. Nicolay, George J.
Cisneros. Photographic and videographic assessment of the smile: Objective and
subjective evaluations of posed and spontaneous smiles. Am J Orthod Dentofacial Orthop
2013; 144:793-801.
12. Herzberg BL. Facial esthetics in relation to orthodontic treatment. The Angle
Orthodontist. 1952 Jan;22(1):3-22.
13. Peck H, Peck S. A concept of facial esthetics. The Angle orthodontist. 1970;40(4):284-
317.
14. Janzen EK. A balanced smile—a most important treatment objective. American journal
of orthodontics. 1977 Oct 1;72(4):359-72.
15. Matthews TG, Blatterfein L, Morrow RM, Payne SH. The anatomy of a smile. The
Journal of prosthetic dentistry. 1978 Feb 1;39(2):128-34.
16. Peck S, Peck L, Kataja M. The gingival smile line. The Angle orthodontist. 1992
Jun;62(2):91-100.
17. Mackley RJ. An evaluation of smiles before and after orthodontic treatment. The Angle
orthodontist. 1993 Sep;63(3):183-9.
18. Faure JC, Rieffe C, Maltha JC. The influence of different facial components on facial
aesthetics. The European Journal of Orthodontics. 2002 Feb 1;24(1):1-7.

19. Mark B Ackerman and James L Ackerman. Smile Analysis and smile design in Digital
Era: JCO 2002; 36: 221-236
20. Hunt O, Johnston C, Hepper P, Burden D, Stevenson M. The influence of maxillary
gingival exposure on dental attractiveness ratings. The European Journal of Orthodontics.
2002 Apr 1;24(2):199-204.
21. Sarver DM, Ackerman MB. Dynamic smile visualization and quantification: Part 1.
Evolution of the concept and dynamic records for smile capture. Am J Orthod Dentofacial
Orthop. 2003;124:4–12
22. David M. Sarver and Marc B. Ackerman. Dynamic smile visualization and
quantification: Part 2. Smile analysis and treatment strategies : Am J Orthod Dentofacial
Orthop 2003;124:116-27
23. Lindauer SJ, Lewis SM, Shroff B. Overbite correction and smile aesthetics. Seminars in
Orthodontics. 2005;11(2):62-66.
24. Sabri R. The eight components of a balanced smile. J Clin Orthod. 2005 Mar;39(3):155-
67.
25. Parekh SM, Fields HW, Beck M, Rosenstiel S. Attractiveness of variations in the smile
arc and buccal corridor space as judged by orthodontists and laymen. The Angle
orthodontist. 2006 Jul;76(4):557-63.
26. Moore T, Southard KA, Casko JS, Qian F, Southard TE. Buccal corridors and smile
esthetics. American Journal of Orthodontics and Dentofacial Orthopedics. 2005;
127(2):208-13.

27. Işıksal E, Hazar S, Akyalçın S. Smile esthetics: perception and comparison of treated and
untreated smiles. American Journal of Orthodontics and Dentofacial Orthopedics.
2006;129(1):8-16.
28. Maple JR, Vig KW, Beck FM, Larsen PE, Shanker S. A comparison of providers’ and
consumers’ perceptions of facial-profile attractiveness. American Journal of Orthodontics
and Dentofacial Orthopedics. 2005;128(6):690-6.
29. Van der Geld P, Oosterveld P, Van Heck G, Kuijpers-Jagtman AM. Smile
attractiveness: self-perception and influence on personality. The Angle Orthodontist.
2007;77(5):759-65.
30. Maulik C, Nanda R. Dynamic smile analysis in young adults. American journal of
orthodontics and dentofacial orthopedics. 2007;132(3):307-15.
31. Van der Geld PA, Oosterveld P, van Waas MA, Kuijpers-Jagtman AM. Digital
videographic measurement of tooth display and lip position in smiling and speech:
reliability and clinical application. American Journal of Orthodontics and Dentofacial
Orthopedics. 2007 Mar 31;131(3):301-e1.
32. Shafiee R, Korn EL, Pearson H, Boyd RL, Baumrind S. Evaluation of facial
attractiveness from end-of-treatment facial photographs. American Journal of Orthodontics
and Dentofacial Orthopedics. 2008 Apr 30;133(4):500-8.
33. McNamara L, McNamara JA, Ackerman MB, Baccetti T. Hard-and soft-tissue
contributions to the esthetics of the posed smile in growing patients seeking orthodontic
treatment. American Journal of Orthodontics and Dentofacial Orthopedics. 2008;
133(4):491-9.

34. Krishnan V, Daniel ST, Lazar D, Asok A. Characterization of posed smile by using
visual analog scale, smile arc, buccal corridor measures, and modified smile index.
American Journal of Orthodontics and Dentofacial Orthopedics. 2008;133(4):515-23.
35. Van der Geld P, Oosterveld P, Kuijpers-Jagtman AM. Age-related changes of the
dental aesthetic zone at rest and during spontaneous smiling and speech. The European
Journal of Orthodontics. 2008;30(4):366-73.
36. Desai S, Upadhyay M, Nanda R. Dynamic smile analysis: changes with age. American
Journal of Orthodontics and Dentofacial Orthopedics. 2009;136(3):310-e1.
37. Ioi H, Nakata S, Counts AL. Effects of buccal corridors on smile esthetics in Japanese.
The Angle orthodontist. 2009 Jul;79(4):628-33.
38. de Deus Tupinambá Rodrigues C, Magnani R, Machado MS, Oliveira Jr OB. The
perception of smile attractiveness: variations from esthetic norms, photographic framing
and order of presentation. The Angle Orthodontist. 2009 Jul;79(4):634-9.
39. Schabel BJ, McNamara JA, Franchi L, Baccetti T. Q-sort assessment vs visual analog
scale in the evaluation of smile esthetics. American Journal of Orthodontics and
Dentofacial Orthopedics. 2009 Apr 30;135(4):S61-71.
40. Schabel BJ, Franchi L, Baccetti T, McNamara JA. Subjective vs objective evaluations
of smile esthetics. American Journal of Orthodontics and Dentofacial Orthopedics. 2009
Apr 30;135(4):S72-9.
41. Brough E, Donaldson AN, Naini FB. Canine substitution for missing maxillary lateral
incisors: the influence of canine morphology, size, and shade on perceptions of smile
attractiveness. American Journal of Orthodontics and Dentofacial Orthopedics.
2010;138(6):705-e1.

42. Schabel BJ, Baccetti T, Franchi L, McNamara Jr JA. Clinical photography vs digital
video clips for the assessment of smile esthetics. The Angle orthodontist. 2010
Jul;80(4):678-84.
43. Chakroborty G, Pal TK, Chakroborty A. A study on gingival component of smile.
Journal of the International Clinical Dental Research Organization. 2015 Jul 1;7(2):111.
44. Ghaleb N, Bouserhal J, Bassil-Nassif N. Aesthetic evaluation of profile incisor
inclination. The European Journal of Orthodontics. 2010;33(3):228-35.
45. Bhuvaneswaran M. Principles of smile design. Journal of conservative dentistry: JCD.
2010 Oct;13(4):225.
46. David C. Havens; James A. McNamara,Jr; Lauren M. Sigler; Tiziano Baccetti. The
Role of the Posed Smile in Overall Facial Esthetics. Angle Orthod 2010;80:322-28.
47. Sarah H. Abu Arqoub and Susan N. Al-Khateeb. Perception of facial profile
attractiveness of different antero-posterior and vertical proportions. European Journal of
Orthodontics 2011; 33: 103–111.
48. Federica Verdecchia, Marco Bee, Luca Lombardo, Chiara Sgarbanti and Antonio
Gracco. Influence of anterior tooth alignment on peer perception in 8- to 10-year-old
children. European Journal of Orthodontics 2011; 33: 155-160.
49. Elham S. J. Abu Alhaija, Nada O. Al-Shamsi and Susan Al-Khateeb. Perceptions of
Jordanian laypersons and dental professionals to altered smile aesthetics. European Journal
of Orthodontics 2011; 33: 450-456
50. Li Cao; Ke Zhang; Ding Bai; Yan Jing; Ye Tian; Yongwen Guo Effect of maxillary
incisor labiolingual inclination and anteroposterior position on smiling profile esthetics.
Angle Orthod. 2011; 81:121–129.

51. Catherine McLeod; H.W. Fields; Frank Hechter; Willi am Wiltshire; Wellington
Rody, Jr; James Christensen. Esthetics and smile characteristics evaluated by
laypersons. Angle Orthod. 2011;81:198–205
52. Ana B. Macías Gago, Martín Romero Maroto and Antonio Crego. The perception of
facial aesthetics in a young Spanish population. European Journal of Orthodontics 2012;
34:335–339.
53. Sabrina Elisa Zange; Adilson Luiz Ramos; Osmar Aparecido Cuoghi;Marcos Roge´
rio de Mendonc¸a; Rosely Suguino. Perceptions of laypersons and orthodontists
regarding the buccal corridor in long- and short-face individuals. Angle Orthod.
2011;81:86–90.
54. Pieter Van der Geld, Paul Oosterveld, Jan Schols, and Anne Marie Kuijpers-
Jagtman. Smile line assessment comparing quantitative measurement and visual
estimation. Am J Orthod Dentofacial Orthop 2011; 139:174-80.
55. Guilherme Janson, Nuria C. Bronco, Juliana F. Morais and Marcos R. Freitas. Smile
attractiveness in patients with Class II division 1 subdivision malocclusions treated with
different tooth extraction protocols. European Journal of Orthodontics 2001; 34:1–8.
56. Hagai Miron, Shlomo Calderon, and Dror Allon. Upper lip changes and gingival
exposure on smiling: Vertical dimension analysis. Am J Orthod Dentofacial Orthop
2012;141:87-93.
57. Angela I-Chun Lin,a Thomas Braun,b James A. McNamara Jr, and Geoffrey E.
Gerstner. Esthetic evaluation of dynamic smiles with attention to facial muscle activity.
American J Orthod Dentofacial Orthop 2013;143:819-27

58. Burcak Kaya and Ruzin Uyar. Influence on smile attractiveness of the smile arc in
conjunction with gingival display. Am J Orthod Dentofacial Orthop 2013;144:541-7.
59. Bhavna Singh; Rajiv Ahluwalia; Deepa Verma; Stutee B. Grewal; Rupender Goel;
Priyanka S. Kumar. Perioral age-related changes in smile dynamics along the vertical plane
A videographic cross-sectional study. Angle Orthod. 2013;83:468–475.
60. Joan F. Walder, Katherine Freeman, Mitchell J. Lipp, Olivier F. Nicolay, and George
J. Cisneros. Photographic and videographic assessment of the smile: Objective and
subjective evaluations of posed and spontaneous smiles. Am J Orthod Dentofacial Orthop
2013;144:793-801
61. Anthony L. Maganzini; Sarah B. Schroetter; Kathy Freeman. Improvement in smile
esthetics following orthodontic treatment A retrospective study utilizing standardized
smile analysis. Angle Orthod. 2014; 84:492–499.
62. Bruna Dieder Correa, Marcos Alan Vieira Bittencourt, and Andre Wilson Machado.
Influence of maxillary canine gingival margin asymmetries on the perception of smile
esthetics among orthodontists and laypersons. Am J Orthod Dentofacial Orthop
2014;145:55-63.
63. Sercan Akyalcin; Leslie K. Frels; Jeryl D. English; Stephen Laman. Analysis of smile
esthetics in American Board of Orthodontic patients. Angle Orthod. 2014;84:486–491
64. Cotrim ER, Vasconcelos Júnior ÁV, Haddad AC, Reis SA. Perception of adults' smile
esthetics among orthodontists, clinicians and laypeople. Dental press journal of
orthodontics. 2015 Feb;20(1):40-4.
65. Kyoko Hata, Kazuhito Arai. Dimensional analyses of frontal posed smile attractiveness
in Japanese female patients. Angle Orthod. 2015; 86(1):127-34.

66. Machado RM, Duarte ME, da Motta AF, Mucha JN, Motta AT. Variations between
maxillary central and lateral incisal edges and smile attractiveness. American Journal of
Orthodontics and Dentofacial Orthopedics. 2016 Sep 30;150(3):425-35.
67. Sriphadungporn C, Chamnannidiadha N. Perception of smile esthetics by laypeople of
different ages. Progress in orthodontics. 2017 Dec 1;18(1):8.
68. Peter H Brook, William C Shaw. The development of an index of orthodontic treatment
priority. European Journal of Orthod. 1989; 11:309-320.
69. Durgekar SG, Nagaraj K, Naik V. The ideal smile and its orthodontic implications.
World journal of orthodontics. 2010 Sep 1;11(3).
70. Proffit WR, Fields Jr HW, Sarver DM. Contemporary orthodontics. Elsevier Health
Sciences; 2006.
71. Graber LW, Vanarsdall RL, Vig KW, Huang GJ. Orthodontics. Current Principles and
Techniques. Elsevier Health Sciences; 2016.
72. Andrews WA. AP relationship of the maxillary central incisors to the forehead in adult
white females. Angle Orthod. 2008; 78(4):662-669.
73. Levin EJ. Dental esthetics and the golden proportion. J Prosthet Dent. 1978; 40:244-252.
74. Springer NC, Chang C, Fields HW, Beck FM, Firestone AR, Rosenstiel S, Christensen
JC. Smile esthetics from laypersons perspective. Am J Orthod. 2011; 139(1):e91-101.
75. Rakosi T, Jonas I. Orthodontic diagnosis. G. Thieme Verlag; 1993.
76. Sarver DM. The importance of incisor positioning in the esthetic smile: the smile arc.
American Journal of Orthodontics and Dentofacial Orthopedics. 2001; 120(2):98-111.

77. Moore T, Southard KA, Casko JS, Qian F, Southard TE. Buccal corridors and smile
esthetics. American Journal of Orthodontics and Dentofacial Orthopedics.2005;
127(2):208-13.
78. Passia N, Blatz M, Strub JR. Is the smile line a valid parameter for esthetic evaluation?
A systematic literature review. European Journal of Esthetic Dentistry. 2011 Sep 1;6(3).
79. Abel EL, Kruger ML. Smile intensity in photographs predicts longevity. Psychological
Science. 2010;21(4):542-4.
80. Pratik k. Sharma, Pranay Sharma. Dental smile esthetics: the assessment and creation
of the ideal smile, Semin Orthod 2012; 18: 193-201.
81. Thompson L, Malmberg J, Goodell N, Boring R. The distribution of attention across a
talkers face. Discourse Process. 2004; 38:145-168
82. Chris D Johnston et al. Influence of dental to facial midline discrepancies on dental
attractiveness ratings. European Journal of Orthod 1999; 21:517-522.
83. Ricketts R M. The biologic significance of the divine proportion and Fibonacci series. Am
J Orthod 1982;81:351-70.
84. S.M. Laxmikanth, S.R. Raghavendra. Insights to golden proportion: A review. Journal
of Adv. Clinical and research. 2014;1:25-29.
85. Vig, R.G. and Brundo, G.C. The kinetics of anterior tooth display, J. Prosth. Dent.
39:502-504, 1978.
86. Weeden JC, Trotman CA, Faraway JJ. Three dimensional analysis of facial movement
in normal adults: influence of sex and facial shape. Angle Orthod. 2001; 71:132–140.

87. Honn M, Klaus Dietx, Marie-Luise Eiselt, Gernot Goz. Attractiveness of facial profiles
as rated by individuals with different levels of education. J. Orofac Orthop 2008; 69:20-
30.
88. Farkas LG, Kolar JC. Anthropometrics and art in the aesthetics of women’s faces. Clin
Plast Surg 1987; 14: 599-616.
89. Heidi S. Ellis et al. The effects of computer aided anteroposterior forehead movement on
ratings of facial attractiveness. J Dent Oral Health. 2017; 3(5): 1-6.
90. Andrews LF, Andrews WA. The six elements of orofacial harmony. Andrews Journal.
2000;1(1):13-22.
91. Langlois JH, Roggman LA. Attractive faces are only average. Psychological science.
1990;1(2):115-21.
92. Chris D Johnston et al. Influence of dental to facial midline discrepancies on dental
attractiveness ratings. European Journal of Orthod 1999; 21:517-522.
93. Spyropoulos MN, Halazonetis DJ. Significance of soft tissue profile on facial esthetics.
Am J Orthod Dentofacial Orthop 2001; 119:464-71.
94. Ronald J Mackley. An evaluation of smiles before and after orthodontic treatment. Angle
Orthod. 1993; 63: 183-190.
95. W.C Shaw, G. Reen, M. Dave, C.R Charles. The influence of dentofacial appearance on
social attractiveness of young adults. Am J Orthod. 1985; 87(1):21-31.
96. Giddon DB. Orthodontic applications of psychological and perceptual studies of facial
esthetics. Semin Orthod 1995; 1: 82-93