aoh report update joint dejf & aoh meeting, las vegas november 15 - 18, 2004 air resource...
TRANSCRIPT

AoH Report Update
Joint DEJF & AoH Meeting, Las VegasNovember 15 - 18, 2004
Air Resource Specialists, Inc.

Overview
• WRAP Strategic Plan, Phases 1 & 2
• Review of Phase I report structure
• Review of Phase I data sets
• Review of products generated to date

WRAP Strategic PlanPhase I2003-05
Phase II2005-07
Purpose:Dry run for Phase II.
Refine and apply Phase Iapproaches for SIP/TIPpurposes.
Scale: Regional. Regional and subregional.
Apportionment:96/02 source contributions.Areas each plan to address.
2002 source contributions.Reduction obligations.
Strategies: Identify options, screen. Cost/benefit, select, design.
Communication: Public education. Public acceptance.
Major State/Tribalsubmittals:
2002 emissions inventory. Modeling run specifications.

AoH Phase I Report Structure
Supporting Reports
(Web-based)
Summary Report(Hardcopy and
Web-based)

AoH Phase I Web Page
http://wrapair.org/forums/aoh/ars1/index.html

AoH Phase I Data Sets
• Emissions Inventories– EPA 2002 NEI not available until 12/05;
WRAP facilitated development of “interim” 2002 Emissions
• Modeling Data– RMC to present TSSA results Thursday
(11/18)
• Monitoring Data– IMPROVE aerosol data available. DRI to
present regression analysis results Wednesday (11/17)

2002 Emissions Data• Point and Area – includes U.S., Can., Mex.• Mobile (On-Road & Non-Road)
Road Dust (Paved & Unpaved) – U.S., Can., Mex.– 2003 estimated emissions– VOC, NOx, PM2.5 and SO2 overestimated for off-road– CA provided estimates directly, so these errors don’t apply to CA
• Fire – WRAP states only– Actual 2002 wildland and prescribed fire emission inventories
• Windblown Dust – Modeling domain– Modeled emissions
• Biogenics – U.S.– Modeled emissions
• Modeling Domain Boundary Conditions

WRAP NOX Emissions Summary
0
200,000
400,000
600,000
800,000
1,000,000
1,200,000
1,400,000
AZ CA CO ID MT NV NM ND OR SD UT WA WY
ton
s/yr
Biogenics
Road Dust
Non-Road Mobile
On-Road Mobile
Fires
Area
Point
WRAP States NOX Emissions

WRAP SO2 Emissions Summary
0
50,000
100,000
150,000
200,000
250,000
300,000
AZ CA CO ID MT NV NM ND OR SD UT WA WY
ton
s/yr
Biogenics
Road Dust
Non-Road Mobile
On-Road Mobile
Fires
Area
Point
WRAP States SO2 Emissions

California Emissions Comparison
• EI comparison: WRAP interim 2002 and CA reported 2003
• Differences in EI reporting:– Differences in point and area binning– CA reports reactive organic gases (ROG),
WRAP reports volatile organic compounds (VOC) - specific pollutants differ in some cases
– CA reports SOx, WRAP reports SO2
• EI comparison reasonable, consistent with known differences

California Emissions ComparisonCalifornia 2002 "Interim" vs. 2003 Reported Emissions
0
200
400
600
800
1,000
1,200
1,400
NOXInterim
NOXReported
VOCInterim
ROGReported
SO2Interim
SOXReported
PM2.5Interim
PM2.5Reported
PMCInterim
PMCReported
Th
ousa
nd
Ton
s/Y
ear
.
Road Dust
Off-Road Mobile
On-Road Mobile
Fires
Area
Point


Redwood NP (CA) Spokane Indian Reservation (WA)
Sequoia NP (CA) Sawtooth W (ID)

Rocky Mountain NPHaze Simulation
Based on 20% Worst Days, 2002
Based on 20% Worst Days, 2002

Yosemite NPHaze Simulation
Based on 20% Worst Days, 2002
Based on 20% Worst Days, 2002

Grand Canyon NPHaze Simulation
Based on 20% Worst Days, 2002
Based on 20% Worst Days, 2002
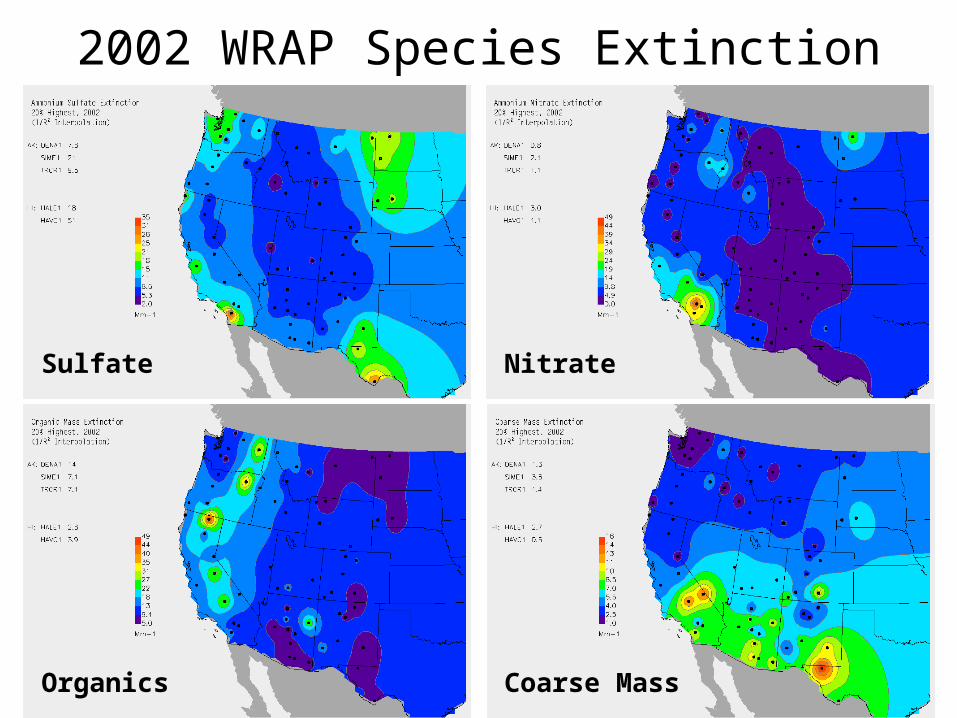
Sulfate Nitrate
Organics Coarse Mass
2002 WRAP Species Extinction

Aerosol Extinction Deciviews
2002 WRAP Extinction and Deciviews
• Both maps based on the same data (deciview map includes Rayleigh scattering for deciview calculation)
• Same general patterns• Different colors due to differences in scales

1/R2 Method
Two Interpolation Methods
Kriging Method
• The 1/R2 method tends to generate islands around monitoring sites; probably more applicable to AoH needs
• The Kriging method generates patterns where there are no monitoring sites, inferring values that may not be real (northern WY, northern UT)

SO 2 Em issions(tons/year)
250 - 500
500 - 1 ,000
1,000 - 1 ,500
1,500 - 2 ,000
2,000 - 2 ,500
2,500 - 3 ,000
3,000 - 3 ,500
3,500 - 4 ,000
4,000 - 4 ,500
4,500 - 5 ,000
5,000 - 5 ,500
5,500 - 6 ,000
>6,000
Sulfate Mass and SO2 Emissions
SO2 Emissions
• Hot spots of SO2 emissions do not correspond with measured hot spots of sulfate mass
Sulfate Mass

Nitrate Mass and NOX Emissions
NOX Emissions
• Hot spots of NOX emissions do not correspond with measured hot spots of nitrate mass
Nitrate Mass
N O X Em issions(tons/year)
1,000 - 2 ,000
2,000 - 3 ,000
3,000 - 4 ,000
4,000 - 5 ,000
5,000 - 6 ,000
6,000 - 7 ,000
7,000 - 8 ,000
8,000 - 9 ,000
9,000 - 10,000
10,000 - 11,000
11,000 - 12,000
12,000 - 13,000
>13,000

PM C Em issions(tons/year)
250 - 500
500 - 750
750 - 1 ,000
1,000 - 1 ,250
1,250 - 1 ,500
1,500 - 1 ,750
1,750 - 2 ,000
2,000 - 2 ,250
2,250 - 2 ,500
2,500 - 2 ,750
2,750 - 3 ,000
3,000 - 3 ,250
>3,250
Coarse Mass and Coarse Mass Emissions
Coarse Mass Emissions
• Hot spots of coarse mass emissions do not correspond with measured hot spots of coarse mass
Coarse Mass

Sample State Emissions
Summary for NOx
• State map with 36 x 36 km gridded emissions
• Brief text description of NOx
• Breakdown of state-wide NOx emissions by source type

The following TSSA results do not represent a full year and should not be used to
draw final conclusions!

Sample “Raw” TSSA and Trajectory
Regression Results
• TSSA attributes to Point and Mobile, WRAP states, eastern U.S., others
• Trajectory Regression attributes to various states, quadrants, others (unique by site)
• Some grouping must be done to compare results
2.9%
19%
0.2%
3.1%
Trajectory Regression
Tagged Species Source Apportionment

CMAQ Tagged Specied Source Apportionment (TSSA)
0%
5%
10%
15%
20%
25%
30%
35%
CO
WY
UT
AZ
NM ID MT
OR
WA
CA
NV
ND
SD
Eas
t
Can
ada
Mex
ico
Initi
al C
ondi
tions
Bou
ndar
y C
ondi
tions
Oth
er
Res
t
Point Sources
Mobile Sources
Trajectory Regression Analysis
0%
5%
10%
15%
20%
25%
30%
35%C
O
WY
UT
AZ
NM
OK
KS
NB
NW
US
SW
US
SE
US
NE
US
Can
ada
Mex
ico
Pac
ific
Coa
st
Pac
ific
Oce
an
Gul
f
Atla
ntic
NE Colorado
SE Colorado
SW Colorado
NW Colorado
Source Attribution Comparison for SO4 atRocky Mountain National Park, CO
In the current CMAQ modeled analysis, source attribution is defined only for mobile and point source emissions. SO4 not attributed to mobile or points sources is labeled "Other". Emissions not included in the identified categories are grouped as "Rest".
Trajectory regression analysis attributes monitoring results using back trajectories and residence times.
Sample “Raw” TSSA and Trajectory
Regression Results
• TSSA attributes to Point and Mobile, WRAP states, eastern U.S., others
• Trajectory Regression attributes to various states, quadrants, others (unique by site)
• Some grouping must be done to compare results

CMAQ Tagged Specied Source Apportionment (TSSA)
Boundary States57%
US Regions14%
International0%
Other Sources29%
0%
5%
10%
15%
20%
25%
30%
35%
CO
WY
UT
AZ
NM
ID,
MT
, O
R,
WA
CA
, N
V
Eas
t
Can
ada
Mex
ico
Initi
al
Bou
ndar
y
Oth
er
Res
t
Point Sources
Mobile Sources
Trajectory Regression Analysis
Other Sources24%
International5%
US Regions27%
Boundary States44%
0%
5%
10%
15%
20%
25%
30%
35%C
O
WY
UT
AZ
NM
ID,
MT
, O
R,
WA
CA
, N
V
Eas
t
Can
ada
Mex
ico
Pac
ific
Coa
st
Pac
ific
Oce
an
Gul
f
Atla
ntic
Source Attribution Comparison for SO4 atRocky Mountain National Park, CO
In the current CMAQ modeled analysis, source attribution is defined only for mobile and point source emissions. SO4 not attributed to mobile or points sources is labeled "Other". Emissions not included in the identified categories are grouped as "Rest".
Trajectory regression analysis attributes monitoring results using back trajectories and residence times. Categories in grey do not directly correspond to categories listed in CMAQ TSSA analysis.
Sample Comparison for
Rocky Mountain NP
• Review similarities and differences between regions
• CO indicated as major contributor in both methods
• Gray bars represent categories that do not correspond between methods

CMAQ Tagged Specied Source Apportionment (TSSA)
Other Sources19%
International0%
US Regions7%
Boundary States74%
0%
5%
10%
15%
20%
25%
30%
35%
CO
WY
UT
AZ
NM
ID,
MT
, O
R,
WA
CA
, N
V
Eas
t
Can
ada
Mex
ico
Initi
al
Bou
ndar
y
Oth
er
Res
t
Point Sources
Mobile Sources
Trajectory Regression Analysis
Other Sources22%
International10%
US Regions7%
Boundary States60%
0%
5%
10%
15%
20%
25%
30%
35%C
O
WY
UT
AZ
NM
ID,
MT
, O
R,
WA
CA
, N
V
Eas
t
Can
ada
Mex
ico
Pac
ific
Coa
st
Pac
ific
Oce
an
Gul
f
Atla
ntic
Source Attribution Comparison for SO4 atMesa Verde National Park, CO
In the current CMAQ modeled analysis, source attribution is defined only for mobile and point source emissions. SO4 not attributed to mobile or points sources is labeled "Other". Emissions not included in the identified categories are grouped as "Rest".
Trajectory regression analysis attributes monitoring results using back trajectories and residence times. Categories in grey do not directly correspond to categories listed in CMAQ TSSA analysis.
Sample Comparison for
Mesa Verde NP
• NM indicated as major contributor by TSSA
• 4 states indicated as equal contributors by Trajectory Regression

Sample Regional Grouping of CIAs

Sample Regional Emissions, Mass,
Extinction Summary
• Lower left map identifies CIAs and major NOx and SO2 source region
• Upper pie displays mass regional mass budget
• Lower right pie displays regional extinction budget (also expressed in deciviews)

Tagged Species Source Apportionment from Colorado to indicated Class I Areas
0
1
2
3
4
5
6
7
8
9
Mou
nt Z
irkel
WM
esa
Ver
deN
PR
ocky
Mou
ntai
n N
PG
reat
San
dD
unes
NP
Mar
oon
Bel
ls-
Wem
inuc
he
WC
anyo
nlan
dsN
PC
hiric
ahua
NM
Sag
uaro
NP
- W
est
Sag
uaro
NP
- E
ast
Sup
erst
itio
nW
Maz
atza
l W
Sal
t C
reek
WW
hite
Mou
ntai
n W
San
Ped
roP
arks
WB
ande
lier
NM
Bos
que
del
Apa
che
W
Gila
W
Bad
land
sN
PW
ind
Cav
eN
P
CO UT AZ NM SD
Con
cent
ratio
n (u
g/m
3)
NO3
SO4
EC
Assessment of Class I AreasAffected by CO Emissions

Next Steps
• DRI and RMC to present results (Wed./Thu.)
• ARS to review report details with AoH (Thu.)
• Synthesize all Trajectory Regression and TSSA results
• Set schedule with AoH subcommittee to review report sections
• Draft report to AoH by mid-December