apache ii : preliminary report on 100 intensive care unit ... · preliminary report on 100...
TRANSCRIPT

Med. J. Malaysia Vol. 46 No. 1 March 1991
APACHE II : Preliminary report on 100 Intensive Care Unit cases in University Hospital, Kuala Lumpur
*G.S. Teoh, MBBS (Malaya) Medical Officer *K.K.Mah, MBBS (Malaya) Medical Officer *Sufian Abd. Majid, MD (UKM) Medical Officer *Streram, MBBS (My sore) Medical Officer M.K. Yee**, MBBS (Malaya), FFARCS (I) Consultant Anaesthesiologist
*Department of Anaesthesia. University Hospital. Kuala Lumpur.
** Fatimah Hospital. /poh. Perak Formerly Lecturer. University Hospital. Kuala LUmf'Jur
Summary A good overall assessment of the severity of illnesses of patients admitted to a general intensive care unit (lCU) is not without problems. The APACHE (acute physiology -and chronic health evaluation) prognostic scoring system enables us to stratify acutely ill patients and compare efficiency of lCU therapy in different hospitals. This preliminary study carried out on 100 consecutive admissions to the ICU in University Hospital, Kuala Lumpur showed the spectrum of ICU admissions and the direct relationship between APACHE 11 score and mortality.
Key words: APACHE 11, outcome prediction, prognostic scoring system, preliminary usage in UHKL.
Introduction
The APACHE (acute physiology and chronic health evaluation) prognostic scoring system was fust developed in the United States in the George Washington University Medical.Centre by William Knaus et all. Their initial goal was to develop a better methodology of measuring case mix among lCU patients. It was noted that death rates varied among ICUs and it was not known whether the cause of the outcome variations was due to differences in therapeutic efficacy or case-selection criteria of admission to various ICUs.
The APACHE approach to severity measurement uses the conceptual model that a patient's prior risk of -death from an acute illness was a function of his major disease, his physiological reserve (which was influenced by his age and the presence of chronic diseases), along with a major contribution from the acute severity of disease as determined by derangements in acute physiologic balance. The basis for
72

APACHE's development was the hypothesis that the severity of acute disease can be measured by quantifying the degree of abnonnality of multiple physiologic variables.
The original APACHE system provides weightings for 34 potential physiologic measures, the sum of which yields an acute physiologic score (APS). In the APACHE IF, the number of physiologic measurements was reduced to 12. There is increased weightage for acute renal failure3, and Glasgow coma score4 •
The APACHE IT scoring system was commenced in the lCU in University Hospital, Kuala Lumpur (UHKL) on August 1, 1990 and this preliminary report is based upon the first 100 consecutive admissions.
Patients and Method Thefrrstl00consecutiveadmissionstothelCUinUHKLfrom 1 August ,1990 to September 23, 1990 were studied ill dus initial report. Admissions were from the operating theatres directly or from the recov~ r()()8;~ferrals from all wards (Medical, Surgical, Paediatrics); and from the Accident and Emergency ward. Patients admitted solely to lCU for the purpose of pain relief (epidural opiates or thoracic epi<hJrals) were excluded from this studY'i.f$ents who underwent cardiac ope_ons were admitted poSt:operatively to the Cardiac Intensive Care Unit and hence were excluded.
The APS is determined from the worst physiologic value during the initial 24 hours fo1lowing ICU admission. 'ftlewetst value may be the highest or lowest value from nonnal. An 12 physiologic variables must be scored to obtain the APS.
Age points were assigned accordingly. Chronic health points were assigned depending on the mode of ICU admissions; five points for non-operative or emergency posl:-opemtive patients and two points for elective post-operative patients.
The APACHE IT score is then calculated as the sum of the APS, age point and chronic health point (refer Appendix A2).
The death rate in this study is the observed hospital death rate i.e. in the JCU or in the wards, following discharge from ICU.
Results A total of 100 lCU patients were studied with ages ranging from 1 month to 82 years. The age distribution is illustrated in Table 1. The largest proportion of the patients (20%) fell into the 61-70 year age group.
Table 2 shows the diagnostic category into which the admissions were classified and the corresponding mortality. There was 100% mortality in those patients admitted with sepsis, haemorrhagic shock and post cardiac arrest (for cerebral resuscitation) and 42% mortality in trauma/emergency neurological patients.
The patients were divided into non-operative and operative categories. There were 43 non-opemtive and 57 operative patients. The distribution of APACHE IT scores in these admissions is illustrated in
73

-...l
.f>.
Appe
Ildh
A. TH
E A
PA
CH
E 1
1 S
EV
ER
ITY
OF
DIS
EA
SE
CLA
SS
IFIC
AT
ION
SY
STE
M
PH
YS
IOLO
GIC
VA
RiA
BL
E
fllG
H A
BNO
RMA
L RA
NG
E lO
W A
BNO
RMA
L RA
NClE
~
+4
. ) •
I .,
0 •
I .2
.3
•
4
VEMPE"ATUR~ -
,"cl
ol f
'Cl
0 )9,9
0 g'
0 0
0 0
0 ~~
9'
HI'
38
,'3
89
' J6
'·3
84
' 34
'3
5.9
' J2
'Jle
' 30
' 31
9'
ME
AN
ART
ERIA
L P
RE
SS
UR
E
-m
m H
O ,Ro
I J
O<i
,9
IIO
l(29
10
l{0'
3 J-i
9 ~9
H
EA
RT
I'IA
n
0 0
0 0
0 0
0 tl
t.nlr
tcul
lll f
eilp
Ontl
.~
~'80
laO
·,19
11
0·13
9 10
10'3
55
69
'O·~
09
R
UPI
A ...
VOI1Y
AA
Ye -
0 0
0 0
0 0
0 ln
on-v
onm
.ttd
0)1 •
• ni
il.l&
d!
~50
35·'
9 2
53
' 11
-2'
10 1
1 6·
9 $5
O
XY
GEN
ATI
ON
: A,.O
D. o
r p.
C.
(mm
HQI
0
0 0
0 $,
FI
O, ~ D
_S ,.c
e.d
A-,q
o,
1-2.~_ f-~4\l9,_ ~~9_
<2
00
/----'oPo.~~ 1-
;:<.--
--1
I-b:
flo.<ii.i~oT.f;.;ry P
.c-;-
--
-t-
----
UP
o,>
70
orO
,1,I-
lo
OP
O,<
55
/lFH
ER
IAlo
H
,H
16
?69
7
5C
f.5
9
7.3
l{.e
SE
RU
M S
OD
IUM
,"'M
911l
1 ):\i
o U
16
0· 17
9 IS
!:{
59
150<
i,.
130C
Jl'9
~ERU!A POTAS~IUM ~I1
'Mo'
/lI
,Cf
.29
0 3
59
,.
0 5.
5·5.
9 3-
3.'
SEFl
UM cR~AnNIII~ '''
'9110
0 m
ll 0
0 0
0 n)ou~le
po'n
l se
~l.
1111 ~
~~I.
,on
oll.
llu,
.\
~ 3
.5 2·
3.4
1.5-
1.9
0.6·
1.4
H~MI
.TOC
Rn ,
'""
So
50-;
~9
46~.
9 ;l
Q1~g
VJ
!IlITE
ilL
OQO
CO
UN
T !
lcU
l/mm
J)
Ro N9
s.9
0 0
Iln 1
.1)00
51
15 1
9.9
J·tu
GL
ASGO
W C
QMA
SCQ
RE ,G
CS}
: Se
ol~
• 15
mln
uo ~
elu.'
(iCS
I!Il
olo'
AC
UTe
PH
VSI
QlO
GV
SCO
RE ,A
PSI:
Sum
011
"1 1
2 In
dlvl
duol
var
iabl
e po
lnl.
:lis'V
'" H,
!<O,
CVl
nou"
mM
oIIL
I 0
0 IH
o, pr
.,."o
d. u
se If
no
ASOs
i :t
52
nH
9
" I\G~
~Oll
'll~
: . '
A
ni;
" pO
ln's
\0 '9
' 0$
'011
0".:
/lOft
yr.,
S 4
4 4S
·54
55·6
4 05
·74
:n~
roln
l,
o 2 3 ~ ~
&l C
HR
ON
IC H
eA
LT
H PQI
HT~
. n
the
pDlla
l'11
hil
i GI
hl,~
or)'
ra'
nv
e,,
, o
l9sn
sys
tem
In·
,u
!"el
sney
'o,
I. Im
mun
o·eo
mp,
oml •
• d 8
ulgn
pol
nla
0\1.
loll
ow
s'
"I. fO
f nO
f'lot
'er4
l1liv
e Of
em
erge
ncy
po
&io
per
allv
e po
llen,
s -
5 po
lnl.
'" b.
lo
r el
eeH
ve p
osl
op
erlll
tlve
pa
lie
nh
-2 po
l~IS
DE
FIN
ITIO
NS
Org
mh:
In
uu
llj.c
le,,_
cy o
r Im
mu
no
·co
mp
rom
ise
d s
lale
ro
uS1
h,v
e b
hn
evi
dent
ptlo
r to
Ihl
s ho
!pil!
/:d I
Idm
is,·
»:Io
n G
nd c
on
form
io
Ih
e fo
llo
win
g c
rlle
tls
'
UV
E.R
: B
ioP
sY"P
,ove
n C
lr'h
ofH
S a
nd
do
cu
me
"le
d p
Orl
sl
hype
rllQ
"slo
~. ~plnodes 0
1 p
ast
up
per
01
ble
ed
ing
1.l1
· (l
lbu
led
10
fPo
fhll
hyp
erte
ns.
ion
. O
f ~HiOf ~pj'bdes
01
tlep
allc
f~l
Iu'e
't'i
nCep
hljl
oPll
lhyl
cOma
0 0
32-0
0.9
22·3
1.9
CA
AO
IOV
ASC
UU
IR:
Now
YOl
k HO
B,I
IIss
oel.l
lo"
Cl ...
IV
.
RE
.SP
IRA
TO
RY
: C
hro
nic
11U
1,I,c
""'e
, o
bs
tru
cll
ve
, O
f v
lIS
cu
h,
dis
us
e f
uu
ltln
Q I
n u
ve
re e
lle
rclu
Hls
lrlc
· li
on
, I,e
., u
na
ble
10
clim
b 5
l1d
l$ o
r p
e,f
orm
ho
us
eh
old
d
ull
es
: 0'
do
cu
me
nte
d c
tuo
nlc
hv
po
.ia
, Il
YO
erca
pn
ia.
seco
nd
Ary
po
lyc
yll
lem
la,
SS
Veh
! p
ulm
on
ary
hvp
e,te
n.
slo
n (
>.4
0mm
HO
I. o
r re
splr
al,,)
1' d
ep
en
de
nc
y.
RE
NA
L:
Rec
eivi
ng
ch
lon
h.
Oio
lvsl
s IM
MU
NO
·CO
MP
RO
MtS
EO
th
e p
.tle
nt
ha
, ,e
ce
lve
d
~hel;py Ih
l! s
up
p'u
ses
resi
ila
nce
to
Infe
cti
on
. e.
g ..
Imm
un
o·s
up
pre
ss
lon
. c"
emo
lher
IllP
Y.
rad
ittl
lon
lo
ng
te
rm o
r 't
ee
nl
1"<'0
" d
ose
ale
lold
s.
or h
as
a d
ises
sE
Ih~1
is
su
llle
ten
llv
3d
... l/l
nced
10 5upp'es~
fes.
istm
nce
10
Inle
cOo
n.
e Q
. le
uke
mili
l. 'y
",p
ho
m&
!. A
.IDS
The
APA
CH
E I
! se
veri
ty o
f dis
ease
cla
ssili
catio
n sy
stem
.
U
/.1Hz
. <
H5
1.
25·7
.32
120l
?Z9
U
U
111·
\19
~ 1
10
0 0
25·2
.9
< 2.
5
0 I
< 0
.6
,
20~9
Ho
0
0 '·2
.9
< 1
0 0
0 IB
·21.
9 _ ~179
<U
APA
CH
E
II SC
OR
E
Sum
01
!!J
!!II
~
l!l A
PS
pO
ln" _
__
__
_
lID "
'0< p
Oln
,. _
__
__
__
_
fC]
Ch
ron
ic H
ea
lth
po
ints
101
.. 11 A
PA
CH
e: 1
1 _
__
__
__
_ _
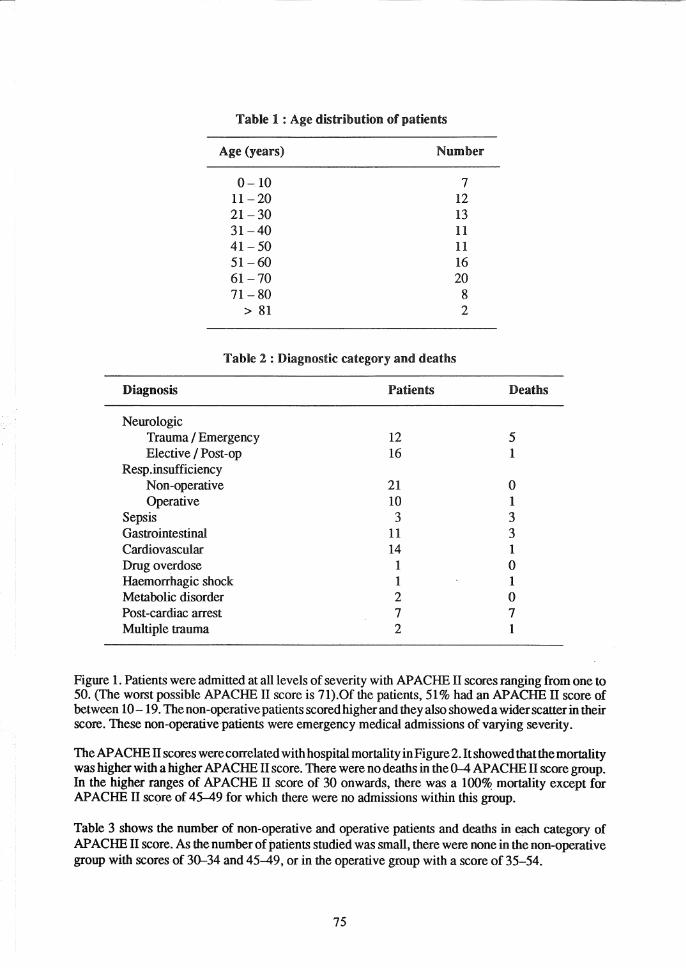
Table 1 : Age distribution of patients
Age (years) Number
0-10 7 11-20 12 21-30 13 31-40 11 41-50 11 51-60 16 61-70 20 71-80 8
> 81 2
Table 2 : Diagnostic category and deaths
Diagnosis Patients
Neurologic Trauma I Emergency 12 Elective I Post -op 16
Resp.insufficiency Non-operative 21 Operative 10
Sepsis 3 Gastrointestinal 11 Cardiovascular 14 Drug overdose 1 Haemorrhagic shock 1 Metabolic disorder 2 Post-cardiac arrest 7 Multiple trauma 2
Deaths
5 1
o 1 3 3 1 o 1 o 7 1
Figure 1. Patients were admitted at all levels of severity with APACHE II scores ranging from one to 50. (The worst possible APACHE II score is 71).Of the patients, 51 % had an APACHE n score of between 10 -19. The non-operative patients scored higher and they also showed a wider scatter in their score. These non-operative patients were emergency medical admissions of varying severity.
The APACHE IT scores were correlated with hospital mortality in Figure 2. It showed that the mortality was higher with a higher APACHE II score. There were no deaths in the 0-4 APACHE n score group. In the higher ranges of APACHE IT score of 30 onwards, there was a 100% mortality except for APACHE n score of 45-49 for which there were no admissions within this group.
Table 3 shows the number of non-operative and operative patients and deaths in each category of APACHE II score. As the number of patients studied was small, there were none in the non-operative group with scores of 30-34 and 45-49, or in the operative group with a score of 35-54.
75

Pe
rce
nta
ge
of
ad
mis
sio
ns
351~--------------------------------------------------------~
30
25
1-.
20 I-
......
. ..
...... ~.
15
~
10 5 o
0-4
5-9
10-1
4 15
-19
20-2
4 2
5-2
93
0-3
43
5-3
94
0-4
44
5-4
95
0-5
4
AP
AC
HE
11
Sco
re
No
n-o
pe
rati
ve
_
Op
era
tive
Fig
1. D
istr
ibu
tio
n o
f A
PA
CH
E U
sco
res
in 1
00
IC
U a
dm
issi
on
s

-...!
-...!
100
80
60
40
20 o
De
ath
ra
te (
%)
0-4
5
-9
10-1
4 15
-19 20~24 2
5-2
93
0-3
43
5-3
94
0-4
44
5-4
95
0-5
4
AP
AC
HE
11
Sco
re
Fig
2,
AP
AC
HE
11
sco
res a
nd
ho
sp
ita
l m
ort
ality
in
100
IC
U a
dm
issio
ns

-.J
00
De
ath
ra
te (
%f
10
0
80
60
40
20 o
t?
"/A
0-4
5-9
10
-14
15-1
9 2
0-2
42
5-2
93
0-3
43
5-3
94
0-4
44
5-4
95
0-5
4
AP
AC
HE
11
Sco
re
_ N
on
-op
era
tive
_
Op
era
tive
Fig
3.
AP
AC
HE
11
sco
res
an
d h
osp
ita
l m
ort
ality
in
100
IC
U a
dm
issi
on
s.

Table 3 : APACHE n scores and hospital mortality in 100 ItU admissions
Non-operative Operative APACHE n Score Patient Death Patient Death
0- 4 1 0 8 0 5- 9 6 0 14 2
10-14 12 1 18 0 15 -19 12 5 9 2 20-24 4 2 5 3 25-29 2 0 2 1 30-34 0 0 1 1 35-39 3 3 0 0 40-44 2 2 0 0 45-49 0 0 0 0 50-54 1 1 0 0
Total 43 14 57 9
A plot of the death rate against the APACHE II score in non-operative and operative patients is illustrated in Figure 3.
A study of 5815 ICU admissions from 13 hospitals in the United States showed a direct relationship between APACHE II scores and observed hospital death rates as shown in Figure 42•
Discussion The analysis of the spectrum of our ICU admissions indicates that patients with respiratory insufficiency formed the largest proportion of admissions followed by neurological patients. The former included patients with asthma, chronic obstructive pulmonary disease, pulmonary oedema, infection and respiratory insuffic~ency after surgery. These patients had a good overall prognosis.
The septic patients had higher mortalities as also demonstrated in the study of ICU admissions in the United States2•
Post cardiac arrest patients generally had a poor outcome in our study. Whether this poor outcome can be attributed to severity of illness such that survival is improbable, or to inappropriate or inadequate ICU treatment needs to be looked into further.
It was noted in our series that longstaying patients may have a low APACHE II score on admission but eventually succumbed. It is perhaps better to do APACHE scoring at frequent intervals so that a better prediction of outcome can be obtained.
The major disadvantages about the APACHE IT prognostic scoring system is that the points allocated forth,e physiologic variables are based on adult values. As such we found that this system wa,s unf9!,tunately not suitable for neonatal cases. Physiologic variables which are abnormal for adults may be normal for neonates.
79

00
o
De
ath
ra
te (
%)
1001'--------------------------------------------------~--~
80
I--
60 1
----
40
f-.
.........
.
20
o L-I ---=~-
0-4
5-9
1
0-1
4
15
-19
2
0-2
4
25
-29
3
0-3
4
35
+
AP
AC
HE
11
Sco
re
_ N
on
-op
era
tive
_
Op
era
tive
Fig
4.
AP
AC
HE
"
sco
res a
nd
ho
sp
ita
l m
ort
ality
In
58
15
IC
U
ad
mis
sio
ns
fro
m 1
3 h
osp
ita
ls i
n th
e U
.S.

Another prognostic scoring system known as the Therapeutic Intervention Scoring System (TISS)S has been devised by Cullen DJ et al. The main disadvantage of TISS is that it cannot be used to compare results between different hospitals or even among different units in the same hospital. This is because the amount of therapeutic intervention required for each patient is very much dependant on the ability of the physician involved or the policy of the unit. The APACHE IT prognostic scoring system overcomes this problem by pre determining the physiologic variables that need to be scored. Thus standardisation of results can be achieved between different hospitals or even within the same unit in each hospital.
We have shown that the APACHE IT scoring system can be used in our ICU in Malaysia. We did not encounter much difficulty in implementing the system as most of the physiological variables were already monitored or could be made available to most ICUs.
It would be interesting to evaluate results among ICUs in Malaysia now that there is a fairly accurate and reliable system of comparing the different categories and severity of ICU patients and their final outcome. Self-assessment and proper audit in the ICU in UHKL would also be a possibility with the implementation of such a system.
Acknowledgement The authors would like to thank Professor A. E. Delilkan for his encouragement, the Anesthesia Department, UHKL and the nursing staff of the ICU, UHKL for their support and assistance in implementing the APACHE IT scoring in UHKL and the Medical Research Resource Centre, UHKL for helping out with the graphics.
References
1. Knaus WA, Zimmennan lE, Wagner DP, Draper EA, Lawrence DE. APACHE - acute physiology and chronic health evaluation: A physiologically based classification system. Critical Care Medicine 1981; 9: 591-597.
2. Knaus W A, Draper EA, Wagner DP,Zimmounman lE. APACHE ll. A severity of disease classification system. Critical Care Medicine 1985; 13: 818-829.
3. Sweet SI, Glenney CV, Fitzgibbons JP, Friedmann P, Teres D. Synergistic effect of acute renal failure and respiratory failure in the surgical intensive care unit. American Ioumal of Surgery 1981; 141 : 492-496.
81
4. Teres 0, Brown RB, Lemeshow S. Mortality of intensive care patients: The importance of coma. Critical Care Medicine 1982; 10 : 86 - 95.
5. Cullen 01, Civetta IM, Briggs BA. Therapeutic intervention scoring system: a method for quantita-tive comparison of patient care. Critical Care Medi-cine 1974; 2 : 57 - 63.