apacity development - unesco · municipal wastewater industrial water consumption figure 1.1 fate...
TRANSCRIPT

on Wastewater: The Untapped Resource
Coursebook
TR
AIN
ING
WO
RK
SHO
P
UNESCO World Water Assessment Programme
apac
ity
Dev
elop
men
tC
World Water Assessment Programme
United NationsEducational, Scientific and
Cultural Organization
Sustainable Development Goals
water andsanitation
Financed by Sultan Bin Abdulaziz Al-Saud Foundation


Capacity Development on Wastewater: The Untapped Resource
Coursebook

The content of this Coursebook is based on excerpts from selected sections of the United Nations World Water Development Report 2017 – Wastewater: The Untapped Resource, published by the United Nations Educational, Scientific and Cultural Organization – 7, place de Fontenoy, 75352 Paris 07 SP, France. The complete Report is available at www.unesco.org/water/wwap. Section 1.3 and parts of Chapter 6 have been developed by WWAP afterwards for the training.
5
CHAPTER 1 | WATER RESOURCES AVAILABILITY AND TRENDS AT THE GLOBAL AND REGIONAL LEVEL 4
1.1 Global wastewater production and treatment 7 1.2 Global water availability – Scarcity growing more severe by the year 8 1.3 Global water availability – Scarcity growing more severe by the year 8
CHAPTER 2 | TECHNICAL ASPECTS OF WASTEWATER 13
2.1 Wastewater sources and components 14 2.2 Impacts of releasing untreated or inadequately treated wastewater 15 2.3 Wastewater collection and treatment 16 2.4 Data and information needs 17
CHAPTER 3 | URBAN WASTEWATER 20
3.1 Sources of wastewater in municipal and urban systems 21 3.2 Composition of municipal and urban wastewater 22 3.3 Urban form and the potential for municipal and urban wastewater use 23
CHAPTER 4 | INDUSTRIAL WASTEWATER 25
4.1 Nature of industrial wastewater 26 4.2 Addressing the resource challenge 27 4.3 Wastewater and sustainable industrial development 28
CHAPTER 5 | AGRICULTURE 29
5.1 Agriculture as a source of water pollution 30 5.2 Agriculture as a user of wastewater 33
CHAPTER 6 | SELECTED RESPONSE OPTIONS FROM THE ARAB REGION TO ADDRESS WASTEWATER MANAGEMENT CHALLENGES 36
CHAPTER 7 | MANAGEMENT, CAPACITY DEVELOPMENT, LEGAL/INSTITUTIONAL FRAMEWORKS, AND THE 2030 AGENDA 40
7.1 The role and limits of ecosystems in wastewater management 41 7.2 Knowledge, research, technology and capacity-building gaps 41 7.3 Capacity building, public awareness and collaboration among stakeholders 42 7.4 Legal and institutional frameworks 43 7.5 Fostering social acceptance 44 7.6 Potential synergies and conflicts 44
TABLE OF CONTENT
6
Colle
cting
wat
er fr
om a
rive
r in
Bor (
Sout
h Su
dan)
Phot
o: ©
Pun
ghi/S
hutte
rsto
ck.c
om
WATER RESOURCES AVAILABILITY AND TRENDS AT THE GLOBAL AND REGIONAL LEVEL
CHAPTER 1

7
Industrial Wastewater
Industrial Water Consump on
Municipal Wastewater
Municipal Water Consump on
Agriculture Drainage
Agriculture Water Requirement
38%16%
3%
8%
3%
32%Industrial wastewater
Agricultural water consumption
Agricultural drainage
Municipal water consumption
Municipal wastewater
Industrial water consumption
Figure 1.1 Fate of freshwater withdrawals: Global consumption and wastewater production by major water use sector (circa 2010)
Source: Based on data from AQUASTAT (n.d.a.); Mateo-Sagasta et al. (2015); and Shiklomanov (1999).
Contributed by Sara Marjani Zadeh (FAO).
slums, who are often directly exposed to wastewater due to a lack of water and sanitation services.
These estimates support the often-cited approximation that, globally, it is likely that over 80% of wastewater is released to the environment without adequate treatment (WWAP, 2012; UN-Water 2015a).
There also appears to be significant variability across different regions. In Europe, 71% of the municipal and industrial wastewater generated undergoes treatment, while only 20% is treated in the Latin American countries. In the Middle East and North Africa (MENA), an estimated 51% of municipal and industrial wastewater is treated. In African countries, the lack of financial resources for the development of wastewater facilities is a major constraint in managing wastewater, while 32 out of 48 Sub-Saharan African countries had no data available on wastewater generation and treatment (Sato et al., 2013).
The treatment of wastewater and its use and/or disposal in the humid regions of high-income countries (e.g. North America, northern Europe and Japan) are motivated by stringent effluent discharge regulations and public awareness about environmental quality. The situation is different in high-income countries in drier regions (e.g. parts of North America, Australia, the Middle East and southern Europe), where treated wastewater is often used for irrigation, given the increasing competition for water between agriculture and other sectors.
The persistent expansion of sewerage and the consequent increases in wastewater volume generate pressure on existing treatment facilities, and in some cases can lead to suboptimal performance.
1.1 Global wastewater production and treatment
Although data on wastewater generation, collection and treatment is grossly lacking, it is clear that, worldwide, the vast majority of wastewater is neither collected nor treated. Furthermore, wastewater collection per se is not synonymous with wastewater treatment. In many cases, collected wastewater is merely discharged directly into the environment without any treatment. Agricultural runoff is almost never collected or treated, so that metrics for these types of wastewater flows are practically non-existent.
The AQUASTAT database of the Food and Agriculture Organization of the United Nations (FAO) estimates global freshwater withdrawals at 3,928 km³ per year. An estimated 44% (1,716 km3 per year) of this water is consumed, mainly by agriculture through evaporation in irrigated cropland. The remaining 56% (2,212 km3 per year) is released into the environment as wastewater in the form of municipal and industrial effluent and agricultural drainage water (see Figure 1.1).
A country’s level of industrial and municipal wastewater treatment is generally a reflection of its income level. On average, high-income countries treat about 70% of the wastewater they generate, while that ratio drops to 38% in upper middle-income countries and to 28% in lower middle-income countries. In low-income countries, only 8% of industrial and municipal wastewater undergoes treatment of any kind (Sato et al., 2013)1. This exasperates the situation for the poor, particularly in
1 For all sources cited in this document, please refer to the WWDR 2017 available at www.unesco.org/water/wwap.

8
Number of months in which water scarcity is >100%
012—34—56—78—910—1112No data
Figure 1.2 Number of months per year in which the volume of surface water and groundwater that is withdrawn and not returned exceeds 1.0 at 30 x 30 arc min resolution (1996–2005)*
*Quarterly averaged monthly blue water scarcity at 30 × 30 arc min resolution. Water scarcity at the grid cell level is defined as the ratio of the blue water footprint within the grid cell to the sum of the blue water generated within the cell and the blue water inflow from upstream cells. Period: 1996–2005.
Source: Mekonnen and Hoekstra (2016, Fig. 3, p. 3).
Even when wastewater is collected and treated, the final quality of the wastewater discharged may be affected by poor operation and maintenance, as well as overflow during storm events, when wastewater is allowed to bypass the treatment plant. Thus, much of the wastewater is not treated (or inadequately treated) and discharged in water bodies, and subsequently affects the water quality (and its availability) for users downstream.
1.2 Global water availability – Scarcity growing more severe by the year
Water resources (surface water and groundwater) are renewed through the continuous cycle of evaporation, precipitation and runoff. The water cycle is driven by global and climatic forces that introduce variability in precipitation and evaporation, which in turn define runoff patterns and water availability over space and time (modulated by natural and artificial storage). Observations over the past decades and projections from climate change scenarios point towards an exacerbation of the spatial and temporal variations of water cycle dynamics (cf. IPCC, 2013). As a result, discrepancies in water supply and demand are becoming increasingly aggravated.
Recent research has demonstrated that two-thirds of the world’s population currently live in areas that experience water scarcity for at least one month a year (see Figure 1.2). Noteworthy is that about 50% of the people facing
this level of water scarcity live in China and India. Such a month-by-month assessment of water scarcity is essential, as the water stress that results from dry periods can be masked by annual averages of water availability. Grid-based assessments, as shown in Figure 1.2, can be easily aggregated to the country scale, and provide more insights into the variability within the country. Average numbers can be misleading, particularly in countries with distinct spatial variations of water resources and uses as, for instance, Australia, Brazil, Chile, Russia and the USA.
About 500 million people live in areas where water consumption exceeds the locally renewable water resources by a factor of two (Mekonnen and Hoekstra, 2016). This includes parts of India, China, the Mediterranean region and the Middle East, Central Asia, arid parts of Sub-Saharan Africa, Australia, Central and Western South America, and Central and Western North America. Areas, where non-renewable resources (i.e. fossil groundwater; never a sustainable source) continue to decrease, have become highly vulnerable and dependent on water transfers from areas with abundant water.
Even though floods and droughts are a natural phenomenon and part of the spatio-temporal variable water cycle dynamics, the frequency and severity of floods and droughts have changed in many river basins worldwide, often due to a combination of climate change and human activities. Land use changes, including urbanization, river channelization and other human activities, modify the storage capacity of catchments and impact high flows as well as groundwater recharge

9
Increase Decrease
Figure 1.3 Projected changes in flood frequency*
* Illustrated as the change of the return period of a 100-year flood. The simulations show the median of the outputs of 11 Global Circulation Models (GCMs) under the future scenario RCP 8.5 and the difference between periods 2071–2100 and 1971–2000 are compared.
Source: Hirabayashi et al. (2013, Fig. 1a).
Reprinted with permission from Macmillan Publishers Ltd: Nature Climate Change, © 2013
and low flows. Changed storage capacity and runoff generation processes can increase the occurrence of water-related disasters. The frequencies of floods (Hirabayashi et al., 2013) and droughts (IPCC, 2013) are likely to change with increasing temperatures. The results of an ensemble of projections (see Figure 1.3) show a large increase in flood frequency (represented by the blue areas, where events that are now considered 100-year floods would increase in frequency) in many areas, including India, Southeast Asia and Central and Eastern Africa, while in other areas the projected flood frequency decreases (represented by the yellow/red areas).
Having too much (floods) or too little (drought) water, which is often accompanied by too dirty water (higher pollution concentrations in both extremes), make the necessity for wastewater use even greater.
The economic costs arising from river flooding worldwide could increase twentyfold by the end of the twenty-first century, if no further actions on flood risk reduction are taken. Over 70% of this increase can be attributed to economic growth in flood-prone areas, in addition to climate change (Winsemius et al., 2016). The Organisation for Economic Co-operation and Development (OECD, 2015a) cites climate scenarios based on modelling undertaken by Winsemius and Ward (2015), which shows that the flood damage in urban areas could reach US$0.7-1.8 trillion per year by 2080.
Globally, drought is arguably the greatest single threat from climate change but locally, sea-level rise (affecting coastal areas) or other threats could be larger (e.g. areas that are extremely vulnerable to floods or landslides). Consequences of drought can be very significant from a socio-economic and environmental perspective. Its impacts range from lower agricultural productivity and disruptions of ecosystem functioning to increased food prices, while insecurity and famine can trigger mass migration. The crisis in Syria was triggered, among other factors, by a historic drought in 2007–2010, which saw very little winter rainfall (partially due to climate change), and which made farming impossible on about 60% of the agricultural land, in spite of the knowledge and technology that were available. The livelihoods of thousands of farmers were impacted, which led to a rural-to-urban migration accompanied by an increased dependence on food imports, and to higher food prices, informal settlements, unemployment and social unrest. Consequently, brought about by civil war and other reasons, a large-scale migration movement started (Kelley et al., 2015). Some of the measures to increase the resilience to drought events include the acceptance of wastewater as a reliable source of water for agriculture and many other uses.
Global water demand is predicted to increase significantly over the coming decades. In addition to demand from the agricultural sector, which is currently responsible for 70% of water abstractions worldwide, large increases are predicted for industry and energy production (WWAP,

0
500
1 000
1 500
2 000
2 500
3 000
10
Figure 1.4 Total renewable water resources (m3/capita/year) in selected countries in the Arab region
Source: Based on data from AQUASTAT (data for 2014).
2015). Changing consumption patterns, including shifting diets towards highly water-intensive foods such as meat (i.e. 15,000 litres of water are needed for 1 kg of beef) will worsen the situation. It is therefore unsurprising that the World Economic Forum (WEF) has consecutively assessed the water crisis as one of the major global risks over the past five years. In 2016, the water crisis was determined as the global risk of highest concern for people and economies for the next ten years (WEF, 2016).
1.3 Regional water availability
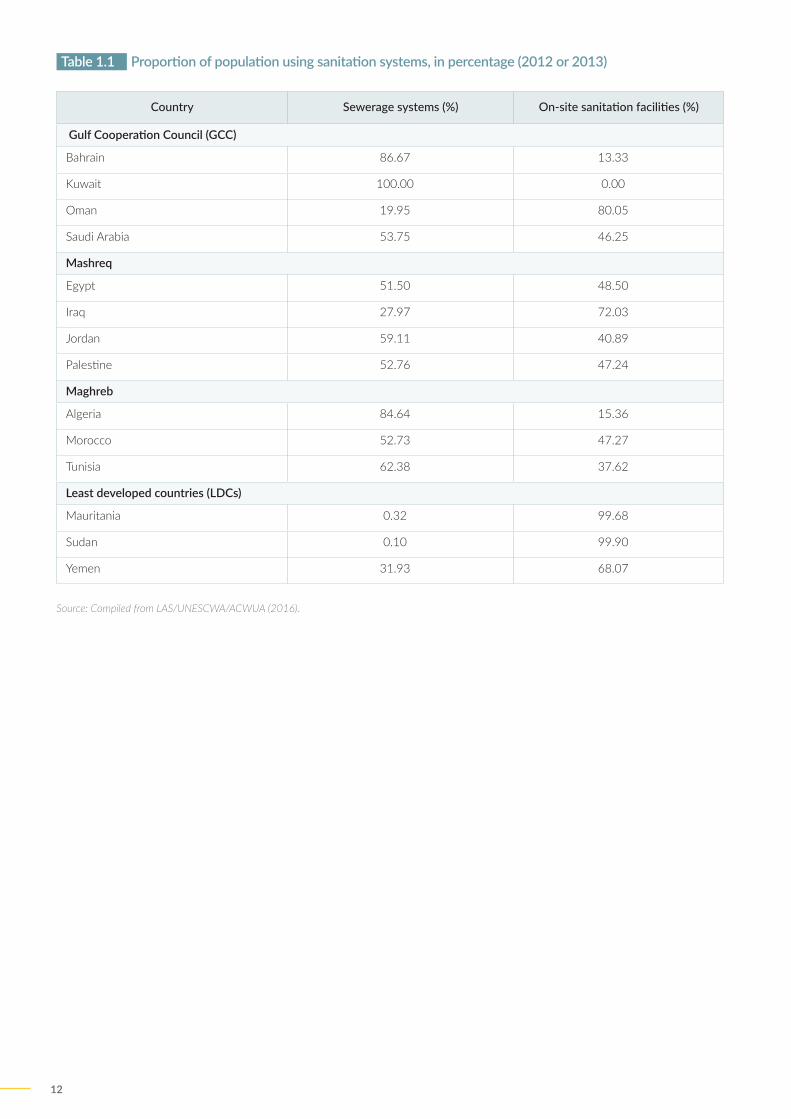
In the Arab region, 18 out of 22 countries are below the water poverty line of 1,000 m3 per capita per year (Figure 1.4) (FAO, 2018). On average, the agricultural sector accounts for 84% of water withdrawal, followed by municipal (10.2%) and industrial (5.8%). The actual rate of water withdrawal has pushed the limits of the sustainable use (Figure 1.5). Thus, meeting the future demand will necessitate use of unconventional water resources such as treated wastewater. However, the share of treated wastewater in overall water use is at a negligible level (Figure 1.6). Low rate of sanitation infrastructure coverage (Table 1.1) is a challenge impeding collection of wastewater for treatment and safe reuse.
Maurit
ania Ira
q
Comoros
Somalia
Sudan
Syria
n Arab Rep
ublic
Morocco
Leban
onEgy
pt
Tunisia
Djibouti
Oman
Algeria
Palesti
ne
Jordan
Libya
Bahrai
n
Yemen
Saudi A
rabia
KuwaitQata
r
United Arab
Emirates
2 80
2
2 46
7
1 52
2
1 36
3
939,
5
908
843,
6
769,
6
637,
1
410,
1
337,
9
311,
7
294,
2
179,
3
123,
4
111,
5
84,2
4
78,2
6
76,0
9
5,13
9
25,9
5
16,3
8

0
500
1 000
1 500
2 000
2 500
3 000
11
Figure 1.5 Total freshwater withdrawal compared to the total renewable water resources (m3/cap/year)
Figure 1.6 Water use by source (%)
Source: Based on data from AQUASTAT (data for 2014).
Source: (LAS, 2018)
Total freshwater withdrawal per capita
1%1%3%
14% 81%
Total renewable water resources per capita
Algeria
Bahrai
n
Comoros
Djibouti
Egypt
Iraq
Jordan
Kuwait
Leban
onLib
ya
Maurit
ania
MoroccoOman
Palesti
neQata
r
Saudi A
rabia
Somalia
Sudan
Syria
n Arab Rep
ublic
Yemen
Tunisia
United Arab
Emirates
197 30
1
294
844
173
8784
312
13
264
1.52
2
179
21
97
338
26
806
718
637
76
1 81
2
306
2 46
7
1 36
3
145
669
123,
4
940
107
764
5
908
187 28
6
770
410
917
306
2 80
2
78112
16
331
132
Surface water
Agricuture drainage water
Groundwater
Desalinated water
Treated wastewater
12
Table 1.1 Proportion of population using sanitation systems, in percentage (2012 or 2013)
Country Sewerage systems (%) On-site sanitation facilities (%)
Gulf Cooperation Council (GCC)
Bahrain 86.67 13.33
Kuwait 100.00 0.00
Oman 19.95 80.05
Saudi Arabia 53.75 46.25
Mashreq
Egypt 51.50 48.50
Iraq 27.97 72.03
Jordan 59.11 40.89
Palestine 52.76 47.24
Maghreb
Algeria 84.64 15.36
Morocco 52.73 47.27
Tunisia 62.38 37.62
Least developed countries (LDCs)
Mauritania 0.32 99.68
Sudan 0.10 99.90
Yemen 31.93 68.07
Source: Compiled from LAS/UNESCWA/ACWUA (2016).

13
TECHNICAL ASPECTS OF WASTEWATER
Aeria
l vie
w o
f bio
gas
plan
t for
sew
age
trea
tmen
tPh
oto:
© K
letr/
Shutt
erst
ock.
com
CHAPTER 2

14
2.1 Wastewater sources and components
There is an often-cited statistic that wastewater is roughly composed of 99% water and 1% suspended, colloidal and dissolved solids (see for example UN-Water, 2015a). Although the exact composition of wastewater obviously varies between different sources and over time, water remains, by far, its principal constituent. Different sources of wastewater can present other types of components in varying concentrations (see Table 2.1).
Domestic and municipal wastewater is likely to contain high bacterial loads, though most of the bacteria present in human faeces are not inherently pathogenic. However, when an infection occurs, a large number of pathogenic microorganisms (such as bacteria, viruses, protozoa and helminths) are spread in the environment through faeces. In order to reduce the disease burden, the removal of pathogens is often the primary objective of wastewater treatment systems.
Wastewater from industrial and mining activities, as well as from solid waste management (e.g. landfill leachate), may also contain toxic organic compounds such as hydrocarbons, polychlorinated biphenyls (PCBs), persistent organic pollutants (POPs), volatile organic compound (VOCs) and chlorinated solvents. Very small amounts of certain organic compounds can contaminate large volumes of water. One litre of gasoline, for example, is enough to contaminate one million litres of groundwater (Government of Canada, n.d.).
‘Emerging pollutants’ can be defined as “any synthetic or naturally occurring chemical or any microorganism that is not commonly monitored in the environment but has the potential to enter the environment and cause adverse ecological and (or) human health effects” (USGS, n.d.). The main categories of emerging pollutants present in wastewater are pharmaceuticals (e.g. antibiotics, analgesics, anti-inflammatory drugs, psychiatric drugs, etc.), steroids and hormones (i.e. contraceptive drugs), personal care products (e.g. fragrances, sunscreen agents, insect repellents, microbeads and antiseptics),
Sources of wastewater Typical components
Domestic wastewater Human excreta (pathogenic microorganisms), nutrients and organic matter. May also contain emerging pollutants (e.g. pharmaceuticals, drugs and endocrine disruptors)
Municipal wastewater Very wide range of contaminants, such as pathogenic microorganisms, nutrients and organic matter, heavy metals and emerging pollutants
Urban runoff Very wide range of contaminants, including incomplete products of combustion (e.g. polycyclic aromatic hydrocarbons and black carbon/soot from fossil fuel combustion), rubber, motor oil, heavy metals, non degradable/organic trash (especially plastics from roads and parking lots), suspended particulate and fertilizers and pesticides (from lawns)
Agricultural runoff (surface flow) Pathogenic microorganisms, nutrients from fertilizers applied to the soils, and pesticides and insecticides derived from the agricultural practices
Livestock production Organic loadings (often very high) and veterinary residues (e.g. antibiotics and artificial growth hormones)
Land-based aquaculture Effluents from settlement ponds are typically rich in organic matter, suspended solids (particulates), dissolved nutrients, and heavy metals and emerging pollutants
Industrial wastewater Contaminants depend on the kind of industry (see Table 6.4 for details)
Mining activities Drainage from tailings, often contains suspended solids, alkalinity, acidity (needs pH adjustment) dissolved salts, cyanide and heavy metals. May contain also radioactive elements, depending on the mine activity (see Table 6.4 for details)
Energy generation Water generated in the energy sector is often a source of thermal pollution (heated water) and usually contains nitrogen (e.g. ammonia, nitrate), total dissolved solids, sulphate and heavy metals (see Table 6.4 for details)
Landfill leachate Organic and inorganic contaminants, with potentially high concentrations of metals and hazardous organic chemicals
Table 2.1 Advantages and disadvantages of selected types of wastewater treatment systems
Source: Based on US EPA (2015 and n.d.b.); UN (n.d.b.); Akcil and Koldas (2006); Government of British Columbia (1992); and Tchobanoglous et al. (2003).

15
pesticides and herbicides, surfactants and surfactant metabolites, flame retardants, industrial additives and chemicals and plasticizers and gasoline additives. Emerging pollutants are rarely controlled or monitored and further research is needed to assess their impacts on human health and the environment. It is possible to reduce/mitigate the use and release of certain types of emerging pollutants through government regulation and private sector engagement.
2.2 Impacts of releasing untreated or inadequately treated wastewater
The discharge of untreated or partially treated wastewater into the environment results in the pollution of surface water, soil and groundwater. Once discharged into water bodies, wastewater is either diluted and transported downstream or it infiltrates into aquifers, where it can affect the quality (and therefore the availability) of freshwater supplies. The ultimate destination of wastewater discharged into rivers and lakes is often the ocean.
The consequences of releasing untreated or inadequately treated wastewater can be classified into three groups: adverse human health effects associated with reduced water quality; negative environmental effects due to the degradation of water bodies and ecosystems; and potential effects on economic activities (UNEP, 2015b). Figure 2.1 shows wastewater components and their effects.
2.2.1 Human health effects
Even though household sanitation facilities have increasingly been improved since 1990, risks to public health remain due to poor containment, leakages during emptying and transport, and ineffective sewage treatment. It is estimated that only 26% of urban and 34% of rural sanitation and wastewater services effectively prevent human contact with excreta along the entire sanitation chain and can therefore be considered safely managed (Hutton and Varughese, 2016).
Sanitation and wastewater-related diseases remain widespread in countries where the coverage of these services is low, where informal use of untreated wastewater for food production is high, and where reliance on contaminated surface water for drinking and recreational use is common. In 2012, an estimated 842,000 deaths in middle- and low-income countries were caused by contaminated drinking water, inadequate handwashing facilities, and inappropriate or inadequate sanitation services (WHO, 2014b).
Improving sanitation and wastewater treatment is also a key intervention strategy to control and eliminate many other diseases, including cholera and some neglected tropical diseases (NTDs), such as dengue fever, dracunculiasis, lymphatic filariasis, schistosomiasis, soil-transmitted helminths and trachoma (Aagaard-Hansen and Chaignat, 2010). Access to improved sanitation facilities can contribute significantly to the reduction of health risks (see Figure 2.2), and further health gains may be realized through the provision of safely managed sanitation services and safely treated wastewater.
2.2.2 Environmental effects
The discharge of untreated wastewater into the environment has an impact on water quality, which in turn affects the amount of water resources available for direct use. Concerns over water quality are rising as an important dimension of water security worldwide. Since 1990, water pollution has been increasing in most rivers in Africa, Asia and Latin America, due to the increasing amounts of wastewater as a result of population growth, increased economic activity and expanding agriculture, as well as the release of sewage with no (or only minimal levels of) treatment (UNEP, 2016). Inadequate wastewater management has also a direct impact on ecosystems and the services they provide (Corcoran et al., 2010).Eutrophication, driven by excess nitrogen and phosphorus, can lead to potentially toxic algal blooms and declines in biodiversity. The discharge of untreated wastewater into seas and oceans partially explains why de-oxygenated dead zones are rapidly growing: an estimated 245,000 km2 of marine ecosystems are affected, and this affects fisheries, livelihoods, and food chains (Corcoran et al., 2010).
Figure 2.1 Wastewater components and their effects
Source: Adapted from Corcoran et al. (2010, Fig. 5, p. 21).
TOXICITY Smelly
Corrosive
Poisonous
Radioactive
Microbes
Biological
Infectious
Chemicals
Pharmaceutical
Inorganic particular material
Decreased ecosystem health (i.e. dead zones)
Contaminated food
Decreasedhuman health
Increased production costs
Contaminated drinkingand bathing water
IMPACT
Solid waste
Suffocate/block
Heavy metals
Organic matter

16
2.2.3 Economic effects
As the availability of freshwater is critical to sustaining the economic welfare of any human community, poor water quality constitutes an additional obstacle to economic development. Poor water quality hampers agricultural productivity in rural and peri-urban settings. Contaminated water can directly affect economic activities that use water, such as industrial production, fisheries, aquaculture and tourism (UNEP, 2015b), and can indirectly limit the export of certain goods due to restrictions (and even bans) on contaminated products.
For example, in the Caribbean, many small island economies are almost entirely dependent on the health of their reefs for tourism, fisheries and shoreline protection (Corcoran et al., 2010), but these reefs are threatened by the discharge of untreated wastewater. While pollution of natural environments may hinder economic activities, tourism itself and the growing demand for environmentally friendly facilities can provide leverage for investments in the maintenance of natural environments, and therefore act as an additional motivating factor for improved wastewater management.
When the discharge of wastewater causes environmental damages, external costs (externalities) are generated and the potential benefits of using wastewater are lost. An economic argument for improved wastewater management can be made in order to minimize the
negative impacts it can cause and to maximize the benefits it can generate. If wastewater is recognized as an economic good, appropriately treated wastewater can have a positive value to both those producing it and those consuming it (UNEP, 2015b).
2.3 Wastewater collection and treatment
This section describes the wastewater collection and treatment systems from a technical point of view. There are essentially two types of wastewater collection and treatment systems:
– Off-site systems, where waste is transported through a sewerage network to a treatment plant or disposal point.
– On-site systems, where waste is accumulated in a pit or septic tank. This tank can be periodically emptied or a new pit/septic tank can be opened in another location. Certain on-site systems have leaching beds that infiltrate the partiality treated water from septic tanks into the ground (old and overstressed systems are a significant cause of pollution in some areas). In the case of emptying, waste is transported for treatment and/or disposal. On-site systems can also include small-scale sewerage systems that convey wastewater to treatment plants located nearby.
Wastewater generated in industries can be treated on-site or released to municipal systems, but it is necessary that discharge permissions have been granted and that quality limits are being respected. Wastewater generated in the agricultural sector (e.g. livestock production, green houses), if collected and treated, can be used within the establishment for irrigation or other purposes.
2.3.1 Wastewater collection
The sewerage network used for wastewater transportation can be separated or combined. In separate systems, different sets of pipes are used to transport the sewage and urban runoff, while in combined systems both flows are conveyed together. Properly installed, operated and controlled, separate systems are expected to reduce the amount of sewage to be treated, to avoid overflows, and to deal more effectively with periodic and potentially large volumes of urban runoff occurring under storm conditions. However, separate sewers do not always operate as efficiently as expected, for example when insufficient controls favour illegal sewage connections to the runoff pipelines.
The endpoint of a sewerage network should be a treatment plant, which aims to remove contaminants from wastewater so that it can be either safely used again (fit-for-purpose treatment) or returned to the water cycle with minimal environmental impacts.
Figure 2.2 Sanitation transitions and associated reductions in diarrhoeal disease
*These estimates are based on limited evidence and should therefore be considered as preliminary, and have not been used in the current burden of disease estimate.
Source: WHO (2014b, Fig. 11, p. 12).
UNIMPROVED SANITATION FACILITIES
IMPROVED SANITATION WITHOUT SEWER
CONNECTIONS
GROUPED:IMPROVED SANITATION
(INCLUDING SEWER CONNECTIONS)
COMMUNITY SANITATION OR SEWER CONNECTIONS
HIGH
LOW
RISK
TO
HEA
LTH
16%
69%*
63%*
28%

17
Wastewater treatment can follow a centralized or decentralized approach. In centralized systems, wastewater is collected from a large number of users, like an urban area, and treated at one or more sites. Collection costs account for over 60% of the total budget for wastewater management in a centralized system, particularly in communities with low population densities (Massoud et al., 2009).
Decentralized systems employ a combination of on-site and/or cluster systems for wastewater treatment, and are often used for individual houses, scattered and low-density communities, and rural areas. Even though decentralized treatment systems often reduce collection costs, they may not provide the same level of benefits and still require a level of operation and maintenance as effective as in centralized systems.
2.3.2 Wastewater treatment
Wastewater treatment consists of a combination of physical, chemical, and biological processes to remove wastewater constituents.
Physical processes enable the removal of substances by the use of natural forces (i.e. gravity) as well as physical barriers, such as filters and membranes or ultraviolet (UV), which are mainly used for disinfection. The use of membranes is increasing because of the high quality of effluent after treatment and for the effective removal of organic micro-pollutants, from pesticides to pharmaceuticals and personal care products (Liu et al., 2009). Membrane systems are characterized by high energy consumption and high levels of operation and maintenance (Visvanathan et al., 2000).
Chemical processes are often used for disinfection and for the removal of heavy metals. Chemically assisted primary treatment, for example using ferric salts or polyelectrolyte, can remove BOD and solids, but the sludge generated is often difficult to treat and dispose of (UN-Water, 2015a). Chemically advanced oxidation has been shown to remove endocrine-disrupting compounds (EDCs) (Liu et al., 2009).Biological processes in wastewater treatment reproduce the degradation that naturally occurs in rivers, lakes and streams. These processes are used in wastewater treatment plants where biological reactors are engineered to boost biochemical degradation under carefully controlled conditions, therefore enhancing the removal of pollutants and the stabilization of sludge.
The processes taking place in the bioreactors can be aerobic or anaerobic. The former often needs more energy in order to maintain the aerobic conditions inside the reactor, and the organic waste is converted into biomass (sludge) and carbon dioxide (CO2). However, it prevents the formation of methane (CH4), which has a greater climate warming potential than CO2 (Cakir and
Stenstrom, 2005). Anaerobic treatment processes generally require less energy and have a lower sludge production and generates CH4, but this can be captured and used as an energy source.
Physical, chemical and biological processes are combined to achieve different ‘levels’ of wastewater: preliminary, primary, secondary, tertiary and quaternary (see Lexicon for a more detailed description).
The selection of the most appropriate technologies depends on the kind of components, pollution load, anticipated use of the treated wastewater and economic affordability. Table 2.2 provides some examples of technologies, the kind of wastewater they are generally used for, and their advantages and disadvantages.
One of the by-products of wastewater treatment is sewage sludge. The sludge generated is rich in nutrients and organic matter, which gives it considerable potential for use as a soil conditioner and fertilizer. In many cases, however, the beneficial value of sewage sludge is not realized because of concerns regarding the pathogens, heavy metals and other compounds it may contain. Other useful by-products from wastewater include biogas (i.e. CH4) and heat, which can be recovered for beneficial use either in the treatment plant or in the adjacent community.
The actual management and operation of wastewater treatment systems is a complex activity that can benefit from a risk assessment approach that evaluates the chain of components that together make up the system. Such assessments can help ensure their proper functioning under expected levels of efficiency, and highlight weak links in the chain that could cause health and safety issues.
2.4 Data and information needs
Data on wastewater collection and treatment are sparse, particularly (but not only) in developing countries. According to Sato et al. (2013), only 55 out of 181 analysed countries had reliable statistical information on generation, treatment, and use of wastewater, 69 countries had data on one or two aspects, and 57 countries had no information at all. Moreover, data from approximately two thirds (63%) of the countries were over five years old. FAO’s main AQUASTAT database has a section on municipal wastewater, where wastewater-related information can be found under the ‘water resources’ and the ‘water use’ sections of each country profile. However, some of this data may be over five years old.
The key challenge with data collection relates to the need of generating data at the national level that it is sufficiently detailed, consistent and comparable with other countries. The GLAAS, a UN-Water initiative implemented by WHO, provides country profiles on sanitation and drinking water

18
coverage. The GLAAS also contains information on topics related to governance, monitoring water data and human resources. Starting with the 2016/2017 reporting cycle, financing will also be included, which might unveil additional information on some aspects of wastewater management. The United Nations Statistical Division (UNSD) is responsible for developing fundamental principles of official statistics to guide the work of national statistics agencies. In 2012, it adopted the System of Environmental-Economic Accounting – Central Framework (SEEA-CF), which includes the System of Environmental-Economic Accounting for Water (SEEA-Water). SEEA-Water proposes a conceptual framework for understanding the interactions between the economy and the environment, and addresses water data needs (UNSD, 2012). SEEA-Water includes standardized tables to be completed by countries on financial expenditures for wastewater management, including measurement of wastewater flows within the economy.
There are other global efforts to enhance data collection related to wastewater at the regional level. OECD and Eurostat conducted a joint survey on inland waters that included questions on the capacity of wastewater treatment plants, and the production of sludge and chemical emissions from industry, agriculture and human settlements (Eurostat, 2014). UNSD and UNEP conduct a biennial environmental data collection campaign in all countries, except those that are covered by the Joint OECD/Eurostat survey. The UNSD/UNEP survey acquires statistics on renewable freshwater resources, freshwater abstraction and use, wastewater generation and treatment, and the population served by wastewater treatment (UNSD, n.d.). Data on the general characteristics and quality of industrial waste and wastewater can be found within the countries’ Pollutant Release and Transfer Registries (PRTRs).
Beyond information on the generation, treatment and use of wastewater, an examination of the wastewater management literature by UN-Water (2015a) revealed other relevant data gaps, including information on the condition of the existing wastewater infrastructure, the performance of wastewater treatment, the fate of faecal sludge, and the volume, quality and location of wastewater used in irrigation. A refined global dataset for wastewater production is under development by AQUASTAT (n.d.a.).

19
Table 2.2 Advantages and disadvantages of selected wastewater treatment systems
Source: Compiled by Birguy M. Lamizana-Diallo (UNEP) and Angela Renata Cordeiro Ortigara (WWAP), based on WHO (2006) and UN-Water (2015a).
Type Nature of wastewater Advantages Disadvantages Components removed
Septic systems Domestic wastewater Simple, durable, easy maintenance, small area required
Low treatment efficiency; necessity of a secondary treatment; effluent not odourless; content must be removed at frequent intervals
COD, BOD, TSS; grease
Composting toilets
Human excreta, toilet paper, carbon additive, food waste
Reduce waste consumption and support the recycling of nutrients (e.g. use of resulting sludge in agriculture)
Need of proper design and maintenance in order to protect the environment and human health
Volume reduced from 10 to 30%; pathogens
Anaerobic filterPre-settled domestic and industrial wastewater of narrow COD/BOD ratio
Simple and fairly durable, if well constructed and wastewater has been properly pre-treated; high treatment efficiency; little land area required
Filter material can incur high construction costs; clogging of filter can occur; effluent not odourless
BOD, TDS, TSS
Anaerobic treatment (e.g. biodigestor, UASB, etc.)
Human excreta, animal and agricultural wastes
Recycling of resource; gas produced can be used for power generation, cooking and lighting
Complex operation and maintenance, which can lead to gas leakage or reduced production and blockage of the digester tank with solids; anaerobic treatment often provides little removal of nutrients
COD, BOD, TSS; grease
Stabilizations ponds
Anaerobic, facultative and maturation ponds
Domestic, industrial and agricultural wastewater; good for small/medium sized towns
Maturation ponds can achieve good bacterial removal; need to be desludged at intervals – failing to do so can have serious consequences; biogas can be recovered as a source of energy
Land-intensive; sometimes high BOD and SS in effluent from algae but relatively harmless; sometimes seen as warm weather process but can be used in moderate climates
BOD, SS, TN, TP
Duckweed-based wastewater stabilizations ponds
Domestic and agricultural wastewater
No clogging risk; high nutrient removal rates
Land-intensive; necessity of constant harvesting; unsuitable in very windy regions
BOD, SS, TN, TP, metals
Constructed wetlands
Domestic and agricultural wastewater; small communities; tertiary treatment for industries
Low or no energy requirements; low maintenance costs; provides aesthetic, commercial and habitat value
Land-intensive; clogging of the system can occur TSS, COD, TN, TP
Aerobic biological treatment (i.e. activated sludge)
Domestic and industrial wastewater
Aerators made from stainless steel are resistant to corrosive wastewater, making them suitable for industrial pulp and paper plants, chemical industry and other rough environments
Good removal of BOD, and the plant can be operated to facilitate N and P removal
Rapid, economic compared to other methods, odour-free
High maintenance requirements; ineffective in deep water (therefore, basins are generally shallow) and under freezing weather conditions
Little removal of bacterial loads and high sludge production
BOD, SS, TN, TP.
Membrane system
Microfiltration, ultrafiltration, nanofiltration, RO
Pre-settled wastewater; can be used in combination with biological processes (MBR, MBBR)
Processes that close the water cycle and produce high-purity water for reuse
Higher costs and higher requirements in operation, maintenance and power consumption
Microfiltration and ultrafiltration eliminate all biological agents and macromolecules; nanofiltration removes simple organic molecules; RO removes inorganic ions
BOD Biological oxygen demand – COD Chemical oxygen demand – MBBR Moving bed biofilm reactor – MBR Membrane biological reactors – RO Reverse osmosis– SS Suspended solids – TDS Total dissolved solids – TN Total nitrogen – TP Total phosphorus – TSS Total suspended solids – UASB Upflow anaerobic sludge blanket

20
URBAN WASTEWATER
Was
tew
ater
in th
e Kl
ong
Ong
Ang
Can
al in
Ban
gkok
(Tha
iland
)Ph
oto:
© A
frira
mPO
E/Sh
utter
stoc
k.co
m
CHAPTER 3

21
3.1 Sources of wastewater in municipal and urban systems
The composition of municipal wastewater can vary considerably, reflecting the range of contaminants released by the different combination of domestic, industrial, commercial and institutional sources.
The precise urban form and legislative/institutional environment usually dictates how this wastewater is collected and treated. However, in most countries, only a proportion of the wastewater is formally collected. A large proportion, mainly from low-income settings, is typically disposed of to the closest surface water drain or informal drainage canal.
In economies that are heavily industrialized or in the process of development and where legislative environments are weak, much of the wastewater is mixed together before treatment and discharge. Where waterborne sewerage is the norm, so-called ‘combined sewerage’ remains common. This is a perfectly logical approach if large volumes of water are used for flushing, resulting in diluted sewage combined with few other wastewater sources (UN-Habitat, n.d.).
It is important to note that, in many cases, large volumes of wastewaters that are legally discharged to decaying and/or badly operated sewerage networks, both combined
and separate, never actually reach a treatment plant. Much is lost en route as a result of broken pipes, or ends up in surface water drains, polluting both groundwater and surface watercourses. There are also many cases of illegal water reuse by communities who deliberately tamper with trunk sewer systems.
3.1.1 Sanitation and the production of wastewater in slums
Wastewater generation is one of the biggest challenges associated to the growth of informal settlements (slums) in the developing world. Although the proportion of slum dwellers in urban areas has slightly decreased since 2000 in terms of percentages (see Figure 3.1), there are more slum dwellers in 2012 than in 2000.In Sub-Saharan African, 62% of the urban population live in slums. The most alarming statistics can be found in countries emerging from conflict and in West Asia, where the proportion living in slums has increased from 67% to 77% and 21% to 25%, respectively (UN-Habitat, 2012).
Slums vary in type, form and population density. However, most are characterized by a lack of paved roads, durable housing, water and sanitation infrastructure and drainage. In these situations, high levels of faecal matter and solid waste are disposed of to surface water drainage canals and ditches. Poor solid waste disposal causes blockages in drainage systems, resulting in flooding. Uncollected wastewater and urban runoff flows are often equivalent to sewered wastewater in terms of toxicity and health risks.
Figure 3.1 Proportion of urban population living in slums 2000–2012
Note: Countries emerging from conflicts included in the aggregate figures as: Angola, Cambodia, Central African Republic, Chad, Democratic Republic of the Congo, Guinea-Bissau, Iraq, Lao People’s Democratic Republic, Lebanon, Mozambique, Sierra Leone, Somalia and Sudan.
Source: Based on data from UN-Habitat (2012, Table 3, p. 127).
Sub-Saharan Africa
Southern Asia
South-Eastern Asia
Eastern Asia
Western Asia
Oceania
Latin America and the Caribbean
Northern Africa
Countries emerging from conflict
Developing regions
65.061.7
45.835.0
39.631.0
37.428.2
20.624.624.124.1
29.223.5
20.313.3
66.676.8
39.432.7
0.0 20.0 40.0 60.0 80.0 100.0

22
Although many slums rely on on-site sanitation, faecal matter is not usually contained and wastewater is still produced as residents often use latrines as bathrooms for personal ablutions with so-called ‘bucket showers’.Slum dwellers frequently have to rely on unsewered communal public toilets, use open space or dispose of faeces in polythene bags (i.e. flying toilet). Communal toilets are not widely used, due to lack of water, poor maintenance, and the cost to the user. A study in the slums of Delhi found that the average low-income family of five could spend 37% of its income on communal toilet facilities (Sheikh, 2008). Finding a suitable place to go to the toilet is especially problematic for women, causing risks related to personal security, embarrassment and hygiene.
3.2 Composition of municipal and urban wastewater
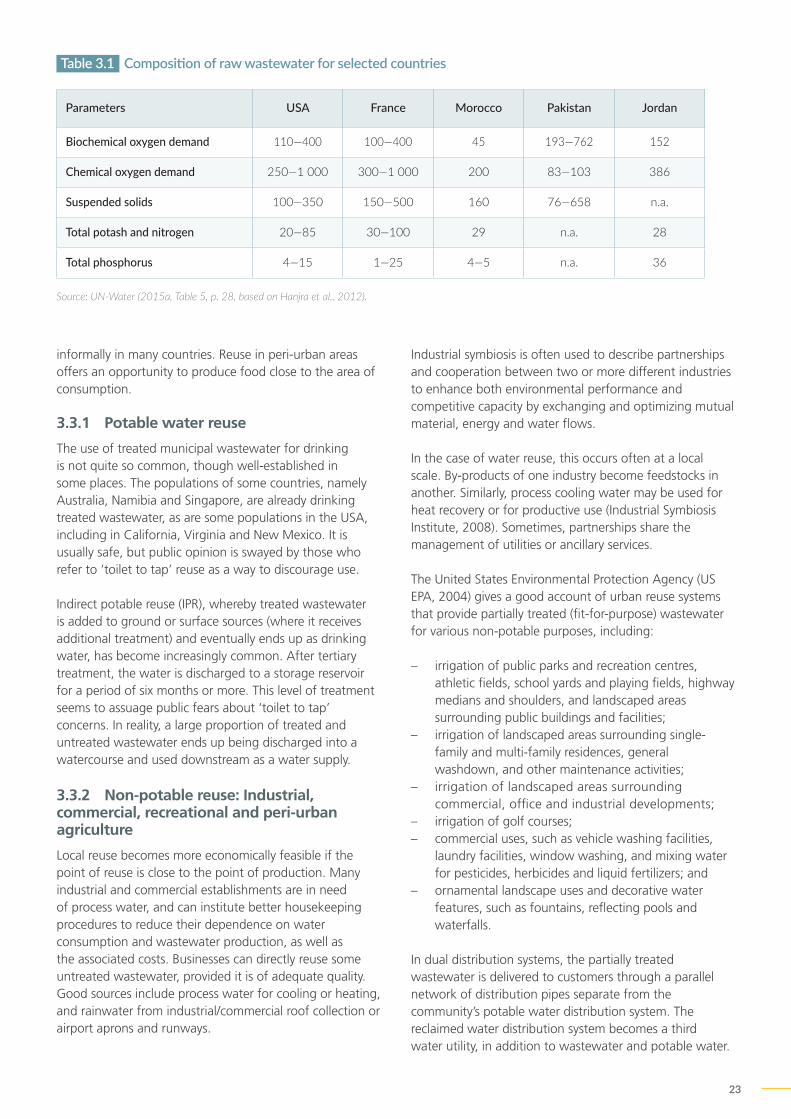
The precise composition of wastewater varies around the world and is governed by a wide range of factors, including domestic water use and the level of commercial/industrialization. Table 3.1 gives selected parameters (UN-Water, 2015a). In developed regions, the BOD:COD ratio2 is likely to be lower than in the developing world, due to a higher proportion of industrial wastewater. This will lower the water’s suitability for biological treatment. In some areas, high levels of inorganic substances, sulphates and alkalinity for example, can affect the wastewater’s suitability for post-treatment use. Sulphates tend to result in hydrogen sulfide production with implications for sewer corrosion. High alkalinities, or water hardness, are likely to cause limescale deposits and will affect the suitability of the water for reuse as process water, for example.
3.2.1 Wastewater from particularly hazardous sources
Wastewater from domestic sources is usually relatively free from hazardous substances, but there are growing concerns about commonly used medications that, even at low concentrations, may have long-term impacts: some known endocrine disrupters in particular (Falconer, 2006).
2 Biochemical oxygen demand (BOD) is the amount of dissolved oxygen needed (i. e., demanded) by aerobic biological organisms to break down organic material present in a given water sample at a certain temperature over a specific time period.
Chemical oxygen demand (COD) is the standard method for indirect measurement of the amount of pollution (that cannot be oxidized biologically) in a sample of water. The higher the chemical oxygen demand, the higher the amount of pollution (mostly inorganic) in the test sample.
If the BOD:COD ratio for untreated wastewater is 0.5 or greater, the waste is considered to be easily treatable by biological means. If the ratio is lower than 0.3 approximately, either the waste may have some toxic components, or acclimated microorganisms may be required for its stabilization.
Industries that use ‘Red List’ substances (see Table 5.4) in their production processes are required to ensure that discharge consents are adhered to, but this is often not the case. Regulatory environments vary considerably. Of particular relevance are small-scale cottage industries and businesses, which are either ‘permitted’ to operate or do so illegally. In informal settings, activities, such as lead recovery from batteries, small-scale mining and mineral processing, and the operation of motor garages and car-washing stations can pose serious risks. There is not much published information available concerning these informal industries.
Small hospitals and clinics (and some of the larger establishments), particularly in the developing world, discharge medical waste untreated. Intensive farming methods and the profligate use of antibiotics in animal husbandry has resulted in high concentrations in municipal wastewater when such installations discharge to municipal sewers. This entails the additional risk of antimicrobial drug resistance (AMR) (Harris et al., 2013).
Other point sources can include intensive agricultural units and large stormwater outlets that serve hazardous or industrial areas. It is important to note that wastewater from food and beverage processing establishments also generally contain relatively high BOD concentrations. This type of waste is not difficult to treat and represents a great opportunity for energy recovery.
3.3 Urban form and the potential for municipal and urban wastewater use
The potential for using municipal and urban wastewater is governed by several issues: first, the level of cross-contamination of wastewater and second, the application and its location. Water scarcity and the cost and availability of new water sources are also important factors.
Obviously, it is better to restrict the discharge of hazardous substances to sewers, particularly those that render the wastewater difficult to treat. Urban runoff, for example, could be directly reused for certain purposes, but once combined with blackwater it would require additional treatment.
The drivers for reuse are legislative and principally driven by economics. If used water is available at a lower or a similar price (including the cost of conveyance), it will be considered over and above conventional freshwater sources. In some water-scarce countries or regions, necessity dictates and favours high levels of reuse.The reuse of water in agriculture is one of the areas of great potential. It is already practised formally and
23
Table 3.1 Composition of raw wastewater for selected countries
Source: UN-Water (2015a, Table 5, p. 28, based on Hanjra et al., 2012).
Parameters USA France Morocco Pakistan Jordan
Biochemical oxygen demand 110—400 100—400 45 193—762 152
Chemical oxygen demand 250—1 000 300—1 000 200 83—103 386
Suspended solids 100—350 150—500 160 76—658 n.a.
Total potash and nitrogen 20—85 30—100 29 n.a. 28
Total phosphorus 4—15 1—25 4—5 n.a. 36
informally in many countries. Reuse in peri-urban areas offers an opportunity to produce food close to the area of consumption.
3.3.1 Potable water reuse
The use of treated municipal wastewater for drinking is not quite so common, though well-established in some places. The populations of some countries, namely Australia, Namibia and Singapore, are already drinking treated wastewater, as are some populations in the USA, including in California, Virginia and New Mexico. It is usually safe, but public opinion is swayed by those who refer to ‘toilet to tap’ reuse as a way to discourage use.
Indirect potable reuse (IPR), whereby treated wastewater is added to ground or surface sources (where it receives additional treatment) and eventually ends up as drinking water, has become increasingly common. After tertiary treatment, the water is discharged to a storage reservoir for a period of six months or more. This level of treatment seems to assuage public fears about ‘toilet to tap’ concerns. In reality, a large proportion of treated and untreated wastewater ends up being discharged into a watercourse and used downstream as a water supply.
3.3.2 Non-potable reuse: Industrial, commercial, recreational and peri-urban agriculture
Local reuse becomes more economically feasible if the point of reuse is close to the point of production. Many industrial and commercial establishments are in need of process water, and can institute better housekeeping procedures to reduce their dependence on water consumption and wastewater production, as well as the associated costs. Businesses can directly reuse some untreated wastewater, provided it is of adequate quality. Good sources include process water for cooling or heating, and rainwater from industrial/commercial roof collection or airport aprons and runways.
Industrial symbiosis is often used to describe partnerships and cooperation between two or more different industries to enhance both environmental performance and competitive capacity by exchanging and optimizing mutual material, energy and water flows.
In the case of water reuse, this occurs often at a local scale. By-products of one industry become feedstocks in another. Similarly, process cooling water may be used for heat recovery or for productive use (Industrial Symbiosis Institute, 2008). Sometimes, partnerships share the management of utilities or ancillary services.
The United States Environmental Protection Agency (US EPA, 2004) gives a good account of urban reuse systems that provide partially treated (fit-for-purpose) wastewater for various non-potable purposes, including:
– irrigation of public parks and recreation centres, athletic fields, school yards and playing fields, highway medians and shoulders, and landscaped areas surrounding public buildings and facilities;
– irrigation of landscaped areas surrounding single-family and multi-family residences, general washdown, and other maintenance activities;
– irrigation of landscaped areas surrounding commercial, office and industrial developments;
– irrigation of golf courses; – commercial uses, such as vehicle washing facilities,
laundry facilities, window washing, and mixing water for pesticides, herbicides and liquid fertilizers; and
– ornamental landscape uses and decorative water features, such as fountains, reflecting pools and waterfalls.
In dual distribution systems, the partially treated wastewater is delivered to customers through a parallel network of distribution pipes separate from the community’s potable water distribution system. The reclaimed water distribution system becomes a third water utility, in addition to wastewater and potable water.
24
Reclaimed water systems are operated, maintained and managed in a way that is similar to the potable water system (US EPA, 2012). Direct use of treated municipal wastewater has been practised for some time, for example in St. Petersburg, Florida, where reclaimed water is provided for several residential properties, commercial developments and industrial parks, as well as a resource recovery power plant, a baseball stadium and some schools (US EPA, 2004).
Supplying nutritionally adequate and safe food to city dwellers poses a substantial challenge. Peri-urban agriculture offers one solution but requires adequate water. Municipal wastewater is often (usually informally) used without treatment, resulting in serious health risks for both farmers and those who consume the food. Social customs and diets dictate how risky this practice is. An example of direct wastewater reuse is the sewage-fed ponds in Kolkata, India (see Box 3.1).
BOX 3.1 SEWAGE-FED AQUACULTURE SYSTEMS OF KOLKATA: A CENTURY-OLD INNOVATION OF FARMERS
Farmers around Kolkata city in India developed a technique of using domestic sewage for fish culture and other agricultural purposes, almost a century ago. This technique is widely used to meet the growing demand for fish in this densely populated Indian city. The technique is considered to be unique and is the largest operational system in the world to convert waste into consumable products. Wastewater and urban runoff from Metropolitan Kolkata (over 13 million inhabitants) generates about 600 million litres of sewage per day. Large-scale usage of sewage for fish culture began in the 1930s. Early success of fish culture in stabilized sewage ponds, which were used as a source of water for growing vegetables, provided stimulus for the large-scale expansion of sewage-fed fish culture system. The area under this unique system of culture peaked at 12,000 ha, but in recent years there has been a steep decline in the area due to the increasing pressure from urbanization. Currently, the area under the sewage-fed culture system has been reduced to less than 4,000 ha and the poor people dependent on these wetlands for their livelihood have been severely affected. However, even today, a considerable amount of fish consumed in Kolkata city is produced from this system. There are appeals to the government to declare the existing sewage-fed aquaculture area as sanctuaries and to protect them from further encroachment by the rapidly expanding population of Kolkata city. In addition, 12,000 ha are also cultivated for growing vegetables.
Source: Extracted from Nandeesha (2002, p. 28).

25
INDUSTRIAL WASTEWATER
Was
tew
ater
trea
tmen
t can
al in
a p
ower
pla
ntPh
oto:
© Jo
hn K
asaw
a/Sh
utter
stoc
k.co
m
CHAPTER 4

26
4.1 Nature of industrial wastewater
Data regarding the general characteristics and quality of industrial wastewater are more available. The toxicity, mobility and loading of industrial pollutants have potentially more significant impacts on water resources, human health and the environment than actual volumes of water. This is reflected in Pollutant Release and Transfer Registries (PRTRs), which contain information from developed countries on the amounts of selected polluting substances (above certain thresholds) released by industry into water, land and air (OECD, n.d.). Such databases could be analysed to obtain a general idea about the overall level of potential recoverable resources among the many undesirable contaminants.
Widely varying industrial activities produce wastewater, which is characterized by a broad spectrum of pollutants (see Table 4.1). Technology is available to remove (or ‘mine’) these pollutants and is only limited by its cost-effectiveness in given industrial situations. This creates two products: the treated water and the materials recovered. The water may be recycled within a plant or by another linked industry, or it may be simply discharged, returning it to the hydrological cycle for others to use. In the USA, it has been estimated that for some major rivers the water has been used and reused over 20 times before it reaches the sea (TSG, 2014). Useful materials may be recovered, such as minerals (phosphates) and metals. Cooling water may provide heat. Residual sludge might yield biogas or may have no other fate than disposal.
Sources: Based on IWA Publishing (n.d.); UNEP (2010); and Moussa (2008).
Table 4.1 Content of typical wastewater in some major industries
Industry Typical content of effluent
Pulp and paper • Chlorinated lignosulphonic acids, chlorinated resin acids, chlorinated phenols and chlorinated hydrocarbons – about 500 different chlorinated organic compounds identified
• Coloured compounds and absorbable organic halogens (AOX)• Pollutants characterized by BOD, COD, suspended solids (SS), toxicity and colour
Iron and steel • Cooling water containing ammonia and cyanide• Gasification products – benzene, naphthalene, anthracene, cyanide, ammonia, phenols, cresols and
polycyclic aromatic hydrocarbons• Hydraulic oils, tallow and particulate solids• Acidic rinse water and waste acid (hydrochloric and sulphuric)
Mines and quarries • Slurries of rock particles• Surfactants• Oils and hydraulic oils• Undesirable minerals, i.e. arsenic• Slimes with very fine particulates
Food industry • High levels of BOD and SS concentrations• Variable BOD and pH depending on vegetable, fruit or meat and season• Vegetable processing – high particulates, some dissolved organics, surfactants• Meat – strong organics, antibiotics, growth hormones, pesticides and insecticides• Cooking – plant organic material, salt, flavourings, colouring material, acids, alkalis, oil and fat
Brewing • BOD, COD, SS, nitrogen, phosphorus - variable by individual processes• pH variable due to acid and alkaline cleaning agents• High temperature
Dairy • Dissolved sugars, proteins, fats and additive residues• BOD, COD, SS, nitrogen and phosphorus
Organic chemicals • Pesticides, pharmaceuticals, paints and dyes, petro-chemicals, detergents, plastics, etc. • Feed-stock materials, by-products, product material in soluble or particulate form, washing and
cleaning agents, solvents and added-value products such as plasticizers
Textiles • BOD, COD, metals, suspended solids, urea, salt, sulphide, H2O2, NaOH• Disinfectants, biocides, insecticide residues, detergents, oils, knitting lubricants, spin finishes, spent
solvents, anti-static compounds, stabilizers, surfactants, organic processing assistants, cationic materials, colour
• High acidity or alkalinity• Heat, foam• Toxic materials, cleaning waste, size
Energy • Production of fossil fuels – contamination from oil and gas wells and fracking• Hot cooling water

27
4.2 Addressing the resource challenge
If wastewater is accepted as a positive input, rather than an unwanted output, of industrial activity demanding disposal, there is a logical and preferred process from its elimination to pro-active use and recycling.
4.2.1 Reducing pollution and pollution prevention
As with many environmental issues, the first step is to prevent or minimize pollution. The goal is to keep the volumes and toxicity of pollution to a minimum at the point of origin. This goes to the core of new green industrial engineering, where the elimination of pollution and wastewater is part of the equation from concept to design for operations and maintenance. However, with established plants, while some re-engineering is possible, pollution reduction might be the only option. This includes substitution with more environmentally friendly raw materials and biodegradable process chemicals, as well as staff education and training to identify pollution issues and remedy them.
4.2.2 Removing contaminants
Industries discharging into municipal systems or surface water have to comply with discharge by-laws or other regulations to avoid fines, so in many cases end-of-pipe treatment is required at the plant before release. In some situations, industries find it also more economical to pay fines than to invest in treatment to meet regulations (WWAP, 2015).
Mixed effluents require complex treatment trains and result in one quality of wastewater discharge to meet local regulations. This water, because it must often meet stringent regulations, may be of unnecessarily higher quality than required for other fates, such as recycling applications. As it is usually more difficult and expensive to treat wastewater containing many pollutants than wastewater with only one such substance, stream separation is often desirable. Mixing more concentrated wastewater with streams that might be suitable for direct discharge or recycling should also be avoided (WWAP, 2006). However, in certain specific cases, appropriate blending of wastewater streams from different sources could potentially lead to beneficial effects in treatment. Either way, fit-for-purpose treatment can optimize the water quality for its next role.
There exists a myriad of possible treatment options, including stabilization ponds, anaerobic digestion and bioreactors to produce biogas, activated sludge, different types of membranes, UV radiation, ozonation, advanced oxidation and the use of wetlands of various sorts (see table 2.2). In 2015, the oil and gas, food and beverage, and mining industries were expected to account for over half of all expenditures on wastewater treatment technologies, and
further growth in technology was anticipated for meeting strict discharge requirements, for example in the mining sector (see Box 6.2). By 2020, the market for industrial water treatment technologies is predicted to grow by 50% (GWI, 2015).
4.2.3 Recycling wastewater and recovering by-products
Recycling within a plant. Overall, industry is in a good position to use or recycle its wastewater internally. This might involve the direct use of untreated wastewater, provided its quality is good enough for the intended purpose. Cooling and heating water, as well as rainwater, may be suitable for washing, pH adjustment and fire protection. However, process water which is sufficiently treated to match resulting quality with intended purpose has more potential for recycling, for example in conveying materials, rinse water, water-cooling towers, boiler feed, production line needs, dust suppression, and washing. This quality is accomplished by decentralized treatment systems. While the technology is generally available, and there is a trend to reduce the gap between treatment and recycling (GE Reports, 2015), obstacles may include implementation, costs not outweighing benefits, long payback periods, maintenance and increased energy consumption.
Moreover, the location and availability (intermittent, batch or continuous production) of the wastewater stream must fit with its intended use.
Using wastewater or recycling treated wastewater is a process that can be repeated many times. It not only reduces the cost for industry of acquiring freshwater by decreasing intake, particularly in areas or times of scarcity, but also has the added benefit of reducing discharges. In this way, the need to meet regulatory standards and the risk of fines is minimized. Furthermore, the practice benefits the environment and adds weight to any social license to operate.
Industrial symbiosis. One notable opportunity for industrial wastewater use and recycling is the cooperation between plants in industrial symbiosis (SSWM, n.d.). This can involve the exchange of process water or the recycling of treated wastewater for purposes similar to in-plant recycling. Examples include steam or hot wastewater, or wastewater that contains organic material and nutrients, and unconverted raw materials that may be economic to recover: oil, used solvents, starch and other substances that can be traded or recycled, perhaps by employing waste registers between adjacent industries (WWAP, 2006). The treatment technology options are similar to those for in-plant purposes and may employ decentralized systems. These may involve a dedicated centralized wastewater treatment plant that services all the industries.
Eco-industrial parks. Industrial symbiosis is best seen in eco-industrial parks which strategically locate industries

28
adjacent to one another to take convenient advantage of wastewater management and recycling. For SMEs, this can be a significant way to save on wastewater treatment costs. Important factors are the sharing of information to match needs, reasonable proximity, and reliability of supply in terms of quantity and quality. Combined Heat and Power Plants (CHP, or cogeneration), which require substantially less cooling water than conventional generation, are more efficient when they are located near to the demand for heat and power such as an industrial complex and as decentralized power supply (Rodríguez et al., 2013). Interesting examples of eco-industrial parks are found in many countries, for example the Shanghai Chemical Industrial Park in China (WWAP, 2015).
The Kalundborg Industrial Symbiosis is an “industrial ecosystem” where the by-products of one enterprise are used as a resource by other enterprises, in a closed cycle. It began in 1961 with the development of a new project to use surface water from Lake Tissø for a new oil refinery with the aim of saving the limited supplies of groundwater. The City of Kalundborg was in charge of building the pipeline while the refinery was responsible for the financing.
The upside of eco-industrial park wastewater arrangements is similar to those for in-house recycling (SSWM, n.d.). The downside include the need for long-term commitments to justify the initial capital expenditures, and the need for further treatment to meet some industries’ needs and possibly regulatory approval hurdles.
Multiple-use systems (MUS) involving cascading reuses of water from higher to lower quality within a river basin may have industrial components, for example, where domestic wastewater may be reclaimed for washing and cooling (UNEP, 2015c).
Reclaiming urban wastewater. Industry can assist on the other side of the wastewater equation by using reclaimed urban wastewater from municipalities: this inter-sector water reuse is growing quickly in many countries (WBCSD, n.d.). It is a very pro-active measure of sustainability as it reduces the requirements for freshwater intake, which is particularly important in areas of water scarcity, and reduces overall municipal discharges. Issues of timing of wastewater availability and its transport to the target industrial plants also need to be worked out. In some cases, municipalities will custom-treat wastewater for specific industries which may not need perfectly clean drinkable water. In California, for example, the Central and West Basin Municipal Water Districts offer reclaimed water of different qualities and costs, including process water for petroleum refining. The State Water Resources Control Board also promotes wastewater for power plant cooling (California Department of Water Resources, 2013).
4.3 Wastewater and sustainable industrial development
Water is not only an operational challenge and a cost item in industry, it is also an opportunity for growth as the incentives for minimizing water use (which includes wastewater use and recycling) reduce costs and water dependency (WBCSD, n.d.).
Industry needs to ‘produce more with less’, which in the case of water means running drier (UNIDO, 2010).
As the reduction of freshwater intake is linked to a decrease in wastewater discharges, there is a major role to be played by cleaner production initiatives that focus on reducing overall water use, closing the water cycle, eliminating wastewater discharge (zero discharge), and reducing or eliminating solvents and toxic chemicals (UNEP, 2010). Cleaner production through green industry creates value by lowering operational costs through the elimination of inefficiencies by using the 3R strategy (reduce, recycle, reuse), which also helps limit environmental impacts (UNIDO, 2010). For example, the UNIDO Transfer of Environmentally Sound Technology (TEST) programme has targeted wastewater pollution from industry on the Danube River, with the goal of improved water efficiency and less wastewater discharges, by analysing the issues and problems and introducing cleaner production solutions and new technology (UNIDO, 2011). Resource efficiency and enhanced environmental performance have even been shown to generate economic benefits for certain SMEs.
More broadly speaking, cleaner production has an important place in industrial ecology, which also includes pollution control, eco-efficiency, life-cycle thinking and closed loop production. These allow the identification of opportunities for enhanced resource efficiency and value-adding activities. The ultimate goal is zero discharge – the situation in which all water is recycled within a plant or traded to another, and the only consumption is through evaporation, which in theory means all the wastewater is used or recycled and there is no discharge (except for minor losses). At that point, water withdrawal (intake) equals consumption (WWAP, 2006). However, the Jevons Paradox3 can take effect: as water efficiency improves, overall water use may in fact increase, with lower cost of production and corresponding increased industrial output.
Once an industry knows its water footprint and pedigree, it can target its wastewater generation to look for possibilities of water reuse and recycling. Moreover, it can expand its efforts into water neutrality (Hoekstra, 2008), which means that after the industry has made efforts to use or recycle its wastewater, the negative impacts of remaining water pollution can be compensated for by investing in projects that promote the sustainable management of water (i.e. wastewater treatment) within local environments. Thus, wastewater might also be seen as resource for promoting investment.
3 In the nineteenth century, William Stanley Jevons argued that gains in technological efficiency did not decrease the use of coal and other resources, but actually increased their consumption and production (Alcott, 2005).
29
AGRICULTUREIrrigation system in ThailandPhoto: © Kosin Sukhum/Shutterstock.com
CHAPTER 5

30
5.1 Agriculture4 as a source of water pollution
Over the past half century, agriculture has expanded and intensified in order to meet the increasing food demand triggered mainly by population growth and changes in diet. The area equipped for irrigation has more than doubled, from circa 1.4 million km2 in 1961 to circa 3.2 million km2 in 2012 (AQUASTAT, 2014). Total livestock has more than tripled from 7.3 billion units in 1970 to 24.2 billion in 2011 (FAOSTAT, n.d.a.). Aquaculture, especially inland fed aquaculture and particularly in Asia, has grown more than twentyfold since the 1980s (FAO, 2012).
Agriculture intensification has frequently come with increased soil erosion, higher sediment loads in water, and excessive use (or misuse) of agricultural inputs (e.g. pesticides and fertilizers) to increase productivity. When the use of such products exceeds the assimilation capacity of agricultural systems, it results in higher pollution loads to the environment. The excess use of irrigation water also enhances the agricultural wastewater flows back into water bodies in the form of deep percolation to aquifers and runoff to surface waters.
5.1.1 Agricultural pollutants: sources and impacts
Agricultural activities release several types of pollutants into the environment (see Table 5.1). These pollutants impact aquatic ecosystems as a result of export from farms, transportation along the hydrological cycle and concentration in water bodies. Typical pollution pathways are: i) percolation to groundwater; ii) surface runoff, drainage water, and flows to streams, rivers and estuaries; and iii) adsorption onto sediments from natural or human-induced soil erosion to sediment-rich streams (FAO/CGIAR WLE, forthcoming).
NUTRIENTS
Natural nutrient sources (and nutrient recycling) have been supplemented with fertilizers to increase agricultural production since the nineteenth century. The excessive mobilization of nutrients is now claimed to have gone beyond the planetary boundaries (Rockström et al., 2009).In crop production, water pollution from nutrients occurs when fertilizers are applied more heavily than crops can absorb them, or when they are washed off the soil surface before they can be incorporated into plants. Excess nitrogen and phosphates can leach into groundwater, or as surface runoff into waterways. While nitrates and ammonia are very soluble, phosphate is not, and it tends to get adsorbed to soil particles. It enters water bodies attached to sediments through soil erosion.
4 Agriculture in this chapter refers to plant and crop production, aquaculture and livestock activities.
In livestock production, feedlots are often located on the banks of watercourses so that (nutrient-rich) animal waste (i.e. urine) can be released directly into the watercourse.
Solid waste (manure) is usually collected to be used as organic fertilizer. In many cases, however, it is not stored in contained areas and washes off by surface runoff into watercourses when there is significant rainfall. In wastewater-fed aquaculture, nutrient loads to water are primarily a function of feed composition and feed conversion (faecal waste). Wastage of feed (feed not taken up by the fish) in intensive fed-aquaculture can significantly contribute to nutrient loads in the water.
These nutrient loads can lead to the eutrophication of lakes, reservoirs and ponds, causing an algae bloom which suppresses other aquatic plants and animals (FAO, 2002). Excessive accumulation of nutrients may also increase adverse health impacts such as the blue baby syndrome, which can be caused by high nitrate levels in drinking water (WHO, 2006a).
PESTICIDES
In many countries, insecticides, herbicides and fungicides are heavily applied in agriculture (Schreinemachers and Tipraqsa, 2012). When improperly selected and managed, they can pollute water resources with carcinogens and other toxic substances that can affect humans and many forms of wildlife. Pesticides may also affect biodiversity by destroying weeds and insects, which can have negative impacts further up in the food chain. In the developed world, even though the use of older broad-spectrum pesticides is still widespread, the trend is toward newer pesticides that are more selective and less toxic to humans and the environment, and that require a lower application per hectare to be effective.
Currently, millions of tonnes of active pesticide ingredients are used in agriculture (FAOSTAT, n.d.b) and cases of acute pesticide poisoning account for significant morbidity and mortality worldwide, especially in developing countries (WHO, 2008), where poor farmers often use severely hazardous pesticide formulations rather than safer alternatives.
SALTS
Over the last decades, the production of brackish drainage and leaching water from agriculture has grown proportionally to the increase in irrigation.
Salts accumulated in soils can be mobilized by irrigation (leaching fractions), transported by drainage water, and cause salinization of receiving water bodies. In addition, excessive irrigation can raise water tables from saline aquifers and this can increase seepage of saline groundwater into water courses and increase their salinization. Intrusion of saline seawater into aquifers is

31
*Measured in the water, directly as total dissolved solids, or indirectly as electric conductivity**Measured in the water as COD and BOD
Source: FAO/CGIAR WLE (forthcoming).
Table 5.1 Categories of major water pollutants from agriculture and the relative contribution from agricultural production systems
Pollutant category Indicators / Examples
Relative contribution from
Crop production Livestock Aquaculture
Nutrients
Primarily nitrogen and phosphorus that are present in chemical and organic fertilizer, animal excreta, and present in water as nitrate, ammonia or phosphate
*** *** *
Pesticides
Herbicides, insecticides, fungicides and bactericides, including organophosphates, carbamates, pyrethroids, organochlorine pesticides and others (many, like DDT, are banned in most countries but their illegal use persists)
*** - -
Salts
Including sodium (Na+), chloride (Cl-), potassium (K+), magnesium (Mg2+), sulphate (SO4
2-), calcium (Ca2+) and bicarbonate (HCO3
-) ions, among others*
*** * *
Sediment
Measured in water as total suspended solids or nephelometric turbidity units – especially from pond drainage during harvesting
*** *** *
Organic matter
Chemical or biochemical substances that require dissolved oxygen in the water for degrading (organic materials, such as plant matter and livestock excreta)**
* *** **
Pathogens Bacteria and pathogen indicators, including E.coli, total coliforms, faecal coliforms and Enterococci
* *** *
Metals Including selenium, lead, copper, mercury, arsenic, manganese and others
* * *Emerging pollutants
Drug residues, hormones, feed additives, etc. - *** **
32
another important cause of salinization of water resources in coastal areas. This intrusion is frequently the result of excessive groundwater extractions for agriculture (Mateo-Sagasta and Burke, 2010).
Major water salinity problems have been reported in the USA, Australia, China, India, Argentina, Sudan and many countries in Central Asia (FAO, 2011). In 2009, approximately 1.1 billion people lived in regions that had saline groundwater at shallow and intermediate depths (van Weert et al., 2009).
Highly saline waters alter geochemical cycles of other major elements, e.g. carbon, nitrogen, phosphorus, sulphur, silica and iron (Herbert et al., 2015), with overall impacts on ecosystems. Salinization can affect freshwater biota at three levels: i) changes within species; ii) changes in the community composition, and; iii) eventually biodiversity loss and migration. In general, when salinity concentrations rise, a decline in biodiversity is observed (including microorganisms, algae, plants and animals) (Lorenz, 2014).
SEDIMENTS AND OTHER POLLUTANTS
Unsustainable land use and improper tillage and soil management in agriculture are major causes of erosion and sediment runoff into rivers, lakes and reservoirs. Sediment in river systems is a complex mixture of mineral and organic matter, which can cause reservoir siltation and affect aquatic life by altering and suffocating habitats, and clogging fish gills. Sediments can also be a carrier of chemical pollutants, such as pesticides or phosphate.Agriculture can also be a source of several other types of pollutants, including organic matter, pathogens, metals and emerging pollutants. Excess of organic matter depletes oxygen from the water bodies and increases the risk of eutrophication and algal blooms in lakes and reservoirs.
Over the last 20 years, new agricultural pollutants have emerged, such as antibiotics, vaccines, growth promoters and hormones that may leach from livestock and aquaculture farms into the water, leading to increasing risks for ecosystems and human health. Residues of heavy metals in agricultural inputs such as fertilizers or animal feed are also emerging threats.
5.1.2 Responses to agricultural pollution
KNOWLEDGE AND RESEARCH
The knowledge gaps related to water pollution from agriculture are considerable. The actual contribution of crops, livestock and aquaculture to water pollution is not known for most basins and countries, particularly in the developing world. Such knowledge is essential for national governments to understand the extent of the problem and to develop meaningful and cost-effective policies.
Moreover, if the pollution source is not well known, the polluter pays principle cannot be applied. A sustained research and modelling effort, supported by water quality
monitoring, would be needed to better understand the pollutant pathways. Robust assessments to understand the pathways, as well as the health and environmental risks from emerging agricultural pollutants, such as animal hormones, antimicrobial and other pharmaceuticals, are also needed.
POLICIES AND INSTITUTIONS
An adequate policy framework is needed to enable the effective control of water pollution from agriculture. Policies can be implemented through several types of instruments: laws and regulations, plans and programmes, economic instruments and information, and awareness and education programmes (FAO, 2013b). Such instruments need to provide farmers with the right incentives for the adoption of good agricultural practices for pollution control.
As environmental and food production policies are normally developed by different ministries, the sense of shared responsibility for pollution legislation and control is generally lacking. There are many cases where this has led to conflict between policies aimed at increasing food production and farm income on the one hand, and on mitigating inland and coastal pollution on the other. Enhanced inter-ministerial cooperation mechanisms are required to develop more coherent policies. Plans and programmes on water pollution control need to be adopted at the basin or watershed scale and cover different sources of pollution – including industry and urban areas, in addition to agriculture – and ideally identify those cases in which wastewater from one sector can become a resource for another sector, in a circular economy.
ON-FARM PRACTICES
On-farm practices play a crucial role in managing and mitigating agricultural pollution. In crop production, management measures to reduce the risk of water pollution by organic and inorganic fertilizers and pesticides include: i) the limitation and optimization of the types, amounts and timing of application of fertilizers and pesticides to crops; ii) the establishment of buffer strips along surface watercourses; and iii) the establishment of protection zones around groundwater supply sources. Moreover, efficient irrigation schemes can greatly reduce both water and fertilizer loss (Mateo-Sagasta and Burke, 2010). For erosion control, good management (i.e. contour ploughing) or restrictions on the cultivation of steeply sloping soils are needed (US EPA, 2003).
The problem of water quality in the livestock and aquaculture sector arises from solid and liquid waste (FAO, 2013b). Manure produced in livestock, for instance, is a valuable material for improving soil fertility and can save on fertilizer costs. However, it is highly polluting if spread at the wrong time or in the wrong place. Without
33
sufficient precautions, livestock and aquaculture practices can also contribute to the microbiological contamination of rivers and groundwater. Therefore, measures to control and eliminate the spreading of pathogens (i.e. bacteria from livestock slurries) and other pollutants (i.e. nitrate) are critical.
The risks associated with brackish or saline agricultural drainage (return flow) also need to be managed. Relevant water management options include the minimization of drainage by conserving water, treatment of drainage water (i.e. evaporation ponds for saline drainage), or water reuse. Brackish or saline drainage water can be reused directly downstream, or blended with freshwater. These approaches would require planning at the watershed level to adapt agriculture practices and crops to the increasing salt content after different cycles of reuse, which can also include the production of prawns and fish in brackish or saline waters.
Integrated aquaculture-agriculture, where crops, vegetables, livestock, trees and fish are managed collectively, can lead to increases in the stability in production, resource-use efficiency and environmental sustainability. Integrated farming ensures that waste from one enterprise become an input in another farm. In this way, the use of resources is optimized and pollution is reduced (FAO, 2013b).
5.2 Agriculture as a user of wastewater
With increasing demands for agricultural commodities, farmers are looking into non-conventional water sources. Due to its high nutrient content, domestic and municipal wastewater presents an attractive option, especially where conventional water resources are scarce or lacking.
If wastewater is used in agriculture without the necessary safety precautions, microbiological and chemical pollutants can accumulate in crops, livestock products, soil or water resources, and lead to severe health impacts for exposed food consumers and farm workers. However, if adequately treated and safely applied, wastewater is a valuable source of both water and nutrients, contributing to food security and the improvement of livelihoods.
Wastewater may be used directly or indirectly in agriculture. Direct use refers to planned and deliberate use of treated or untreated wastewater for some beneficial purpose, including irrigation, aquaculture and livestock. Indirect use occurs when treated, partially treated or untreated wastewater is discharged into reservoirs, rivers and other water bodies, including groundwater, that supply water for agriculture. Indirect use poses the same health risks as planned wastewater use projects, but may
have a greater potential for health problems because the water user is unaware of the wastewater being present (FAO, 1997).
Another important way in which wastewater is used indirectly for agriculture is by means of managed aquifer recharge (MAR) in which treated or partially treated wastewater is infiltrated into aquifers through ponds, trenches, lagoons or injection wells and subsequently re-abstracted (Dillon et al., 2012). In many cases, the soil and the unsaturated zone of the aquifer help to remove pollutants from the wastewater so that the re-abstracted groundwater can be used for all types of crops.
Wastewater is typically rich in both suspended solids (particulates) and dissolved nutrients. To optimize water reuse, its quality, quantity and location are important factors to be considered (Iannelli et al., 2011).
5.2.1 Wastewater use: an opportunity for agriculture
IRRIGATION
According to FAO’s AQUASTAT (n.d.b.), around 3,928 km³ of water per year is withdrawn worldwide (see Figure 1.1), of which 44% (1,716 km³ per year) is consumed and 56% (2,212 km³ per year) is released as wastewater, including agricultural drainage and wastewater.
Municipal wastewater accounts for the majority of wastewater directly used in agriculture. Municipal water demand corresponds to 11% of global water withdrawal (AQUASTAT, n.d.b.). Out of this, only 3% is consumed and the remaining 8% is discharged as wastewater, representing 330 km³ per year (Mateo-Sagasta et al., 2015), much of which could potentially be used for agricultural irrigation.
Agricultural drainage and wastewater, on the other hand, account for 32% (1,257 km³ per year) of water withdrawal. This highlights the fact that policies, planning and implementation should not be entirely focused on municipal wastewater management, but also on sustainable agricultural drainage, return flow and wastewater management. As discussed above, water reuse for agriculture can have significant health benefits, including increased food security and improved nutrition.
Today, the planned use of municipal wastewater is a common pattern in countries of the Middle East and North Africa (MENA), Australia, and the Mediterranean, as well as in Mexico, China and the USA (AQUASTAT, n.d.b.). However, there is no comprehensive inventory of the extent of treated or untreated wastewater used in agriculture, apart from the incipient efforts by institutions like AQUASTAT (n.d.a.). Inadequate wastewater treatment and the resulting large-scale water pollution suggest that the area irrigated with unsafe wastewater is probably ten
34
times larger than the area using treated wastewater (Drechsel and Evans, 2010).
According to FAO, globally 2.75 million km2 of land are actually irrigated (AQUASTAT, 2014). The approximately 330 km³ of municipal wastewater generated every year could potentially irrigate 40 million hectares (with approx. 8,000 m³ per hectare) (Mateo-Sagasta et al., 2015), or 15% of all irrigated lands. Estimates of the total area that is being irrigated with raw and diluted wastewater are still fragmentary, but the numbers are likely to range between 5 and 20 million hectares, with the largest share probably in China (Drechsel and Evans, 2010), which translates to between 2% and 7% of the world’s total irrigated area. The low percentage of wastewater that is being used by agriculture in a planned manner – and its unsafe application in most cases – confirms the vast potential for improving and increasing the application of used water (from municipal, industrial and agricultural sources) to meet the water demand for global food production.
AQUACULTURE AND LIVESTOCK
The objective of fertilizing an aquaculture pond with excreta or wastewater is to produce natural food for fish. A wide range of fish species have been cultivated in this manner. Fish can be grown in ponds that receive effluent or sludge, where they can feed on algae and other organisms that grow in the nutrient-rich water. The fish, thereby, remove the nutrients from the wastewater and are eventually harvested for human consumption or as feed.
The quality and condition of the fish will influence local acceptance. The microbial flora of a fish reflects that of the water from which it was taken (e.g. in the digestive tract, on the skin or in the fluids of the body cavities). There may be concern about contamination of the fish, especially when they are harvested, cleaned and prepared. If they are cooked well, they should be safe, but it is advisable to move the fish to a clear-water pond for several weeks before they are harvested for human consumption.
The use of water by livestock, and the contribution of livestock to water supply depletion, is high and growing (FAO, 2006). Animal products have a particularly large water requirement per unit of nutritional energy produced compared to food of plant origin (Gerbens-Leenes et al., 2013). Safe use of wastewater may have a significant role in replacing freshwater for producing harvested fodder (e.g. hay or silage), or for service water replacement (e.g. cooling and cleaning facilities). The usage of wastewater in the livestock sector, whether from municipal/industrial production or from the same livestock facility, is primarily dictated by the quality of the wastewater. A minimum of secondary treatment
and disinfection is generally recommended. In addition, reclaimed water intended for use with cattle must have been treated to remove helminth parasites. Such treatment can either be based on lagooning (for a period of 25 days or longer) or on an approved method of filtration, such as sand or membrane filtration (EPA Victoria, 2002).
5.2.2 Risks
The use of wastewater for irrigation has been most successful in urban and peri-urban areas, where wastewater is easily available and reliable, generally free of charge, and where there is a market for agricultural produce. Sometimes, storage of wastewater may be necessary to provide partial treatment or because supply trends may not match the demand (e.g. seasonal variabilities).
Collected wastewater will go through certain treatment procedures at the wastewater treatment plant level prior to being applied on the field or used for any other purposes. Although required treatment levels vary according to the wastewater source (type and concentration of contaminants) and the expected use (crop type, harvesting method, etc.), secondary treatment is often considered sufficient for use in agriculture.
The treated wastewater and/or the reused water will then need to go through appropriately controlled application techniques, and potentially additional treatment if required.
HEALTH RISKS
Wastewater use constitutes a risk for the health of farmers, food chain workers and consumers, due to possible microbial and chemical contamination. The use of low-cost labour is a common practice among farmers using wastewater, and much of this work is carried out by women. As a result, they face higher health risks, including pathogen exposure, and potential transmission to family members (Moriarty et al., 2004).
Different approaches have been proposed for the mitigation of health risks. Many approaches have focused on water quality and strict regulations at the point of use, making wastewater treatment a central element for water reuse (Asano and Levine, 1998; Mara and Cairncross, 1989). In the European Union, for example, the Aquarec project proposes seven (treatment-based) quality categories for different types of reuse, with microbial and chemical limits for each category (Salgot et al., 2006).
However, in low-income countries, strict water quality standards for reuse are often perceived as unaffordable and therefore fail in practice. WHO Guidelines for the Safe Use of Wastewater, Excreta and Greywater in Agriculture (WHO, 2006a) acknowledge the potential health risks of wastewater with no or inadequate treatment, and the

35
necessity to reduce such risks. The guidelines propose the use of a number of barriers (multiple-barrier approach) to protect public health along the sanitation and food chains, from wastewater generation to consumption, instead of focusing only on the quality of wastewater at its point of use.
ENVIRONMENTAL RISKS
While using treated wastewater and optimizing nutrient input to wastewater-irrigated soils may have multiple environmental benefits, there are some environmental risks associated with the use of untreated or partially treated wastewater in irrigation. These risks include soil contamination, groundwater pollution and surface water degradation.
Trading partially treated urban wastewater (for irrigation) in exchange for access to freshwater sources (for other uses in urban and peri-urban areas) is one approach which can contribute to an overall better management of water resources and reduce negative health and environmental impacts (Hanjra et al., 2012).
The mobility of contaminants and their ability to accumulate aggravate the threat they pose to the environment and to society.
Soil: Wastewater for irrigation adds nutrients, dissolved solids, salts and heavy metals to the soil. Over time, excessive amounts of these elements may accumulate in the root zone with possible harmful impacts on soil. The long-term use of wastewater could result in soil salinity, waterlogging, breakdown of soil structure, overall reduction in productive capacity of soil and lower crop yields. Impacts depend on factors such as the source, use intensity, and composition of wastewater, as well as soil properties and the crops’ own biophysical characteristics.
Groundwater: The use of wastewater has the potential both to recharge groundwater aquifers (positive externality) and to pollute groundwater resources (negative externality). Percolation of excess nutrients, salts and pathogens through the soil may lead to the degradation of groundwater. However, the actual impact will depend on a range of factors, including the scale of wastewater use, the quality of the groundwater, the depth to the water table, soil drainage and soil characteristics (e.g. porous, sandy). In irrigated areas with shallow groundwater tables, the impact of irrigation with inadequately treated wastewater on groundwater quality is likely to be substantial.
Surface water: When runoff from wastewater irrigation systems drains into surface water, particularly small confined lakes and water bodies, the remains of nutrients may cause eutrophication, particularly if phosphates in the orthophosphate form are present. Imbalances in the plant and microbiological communities of water bodies may in turn affect other higher forms of aquatic life and reduce biodiversity. If these water bodies serve local communities, the ecological impacts can be translated into economic impacts.
36
SELECTED RESPONSE OPTIONS FROM THE ARAB REGION TO ADDRESS WASTEWATER MANAGEMENT CHALLENGES
Miy
ahun
a W
aste
wat
er T
reat
men
t Pla
nt in
Am
man
(Jor
dan)
Phot
o: ©
ACW
UA
CHAPTER 6

37
The Arab region is the driest in the world, with 18 out of 22 Arab countries falling below the water poverty line of 1,000 m³ per capita in 2014 (AQUASTAT, n.d.b). The following examples illustrate how the use of safely treated wastewater has become a means for increasing water availability in several Arab states and has been included as a core component of water resources management plans at the regional and national levels.
Access to improved sanitation is largely prevalent in the Arab region, but connections to sewerage networks and wastewater treatment facilities remain more limited. Network coverage is generally provided in larger urban centres, while septic tanks and cesspits remain common in rural areas and in the region’s least developed countries (UNESCWA, 2013). Off-network sanitation systems, however, complicate the collection and treatment of wastewater and reduce the ability to sustainably manage wastewater as a resource in most areas. Regional monitoring and reporting on water, sanitation and wastewater services is conducted under the auspices of the Arab Ministerial Water Council through the MDG+ Initiative5. The MDG+ data presented in Table 6.1 show that, during the year 2013, 69% of the wastewater collected in Arab States was safely treated, with 46% undergoing secondary treatment and 23% undergoing tertiary treatment. Furthermore, 84% of all wastewater collected in the water-scarce Gulf Cooperation Countries (GCC) underwent tertiary treatment, and 44% of their total safely treated wastewater volume was subsequently used. At the Arab regional level, 23% of the safely treated wastewater is being used, mostly for irrigation and groundwater recharge.
5 The MDG+ Initiative is a regional, intergovernmental initiative that collects country-level data from National Monitoring Teams, comprised of the national ministry responsible for water and wastewater utilities, and statistical offices in each Arab State. The initiative collects data on access to water supply, sanitation and wastewater treatment services in the Arab region. The wastewater indicators measured by the MDG+ Initiative clarify the quantity of wastewater treated by level, the quantity of treated wastewater used and for what purpose, and the tariff applied on sanitation services. Detailed descriptions and methods of calculating the MDG+ indicators can be found in UNESCWA (2013).
EXAMPLE 6.1 WATER REUSE IN TUNISIA
Water reuse has been a priority in Tunisia since the early 1980s, when Tunisia launched a nationwide water reuse programme to increase the country’s usable water resources. Most municipal wastewater receives secondary biological treatment through activated sludge, with some limited tertiary treatment also in place.
Restrictions on treated wastewater use to protect public health have received considerable attention and are in line with WHO recommendations (WHO, 2006b). Tunisian regulations allow for the use of secondary treated effluent on all crops except vegetables, whether eaten raw or cooked. Regional agricultural departments supervise the use of safely treated wastewater and collect charges from the farmers. Tunisian farmers pay for irrigation water onthe basis of the volume of water required and the area to be irrigated.
While there is strong government support for treated wastewater use, farmers continue to prefer irrigation from groundwater due to social acceptance, regulations concerning crop choices, and other agronomic considerations. Farmers in the arid south have also expressed concerns about the long-term impacts of saline wastewater on their crop productivity and soils. In addition, farmers consider the health restrictions as an impediment to growing high-value crops such as vegetables. To address these challenges, Tunisian policy-makers have sought to improve the coordination and pursue demand-driven approaches to improve the planning of wastewater reclamation and irrigation projects with safely treated effluent (Qadir et al., 2010).
Contributed by Manzoor Qadir (UNU-INWEH).
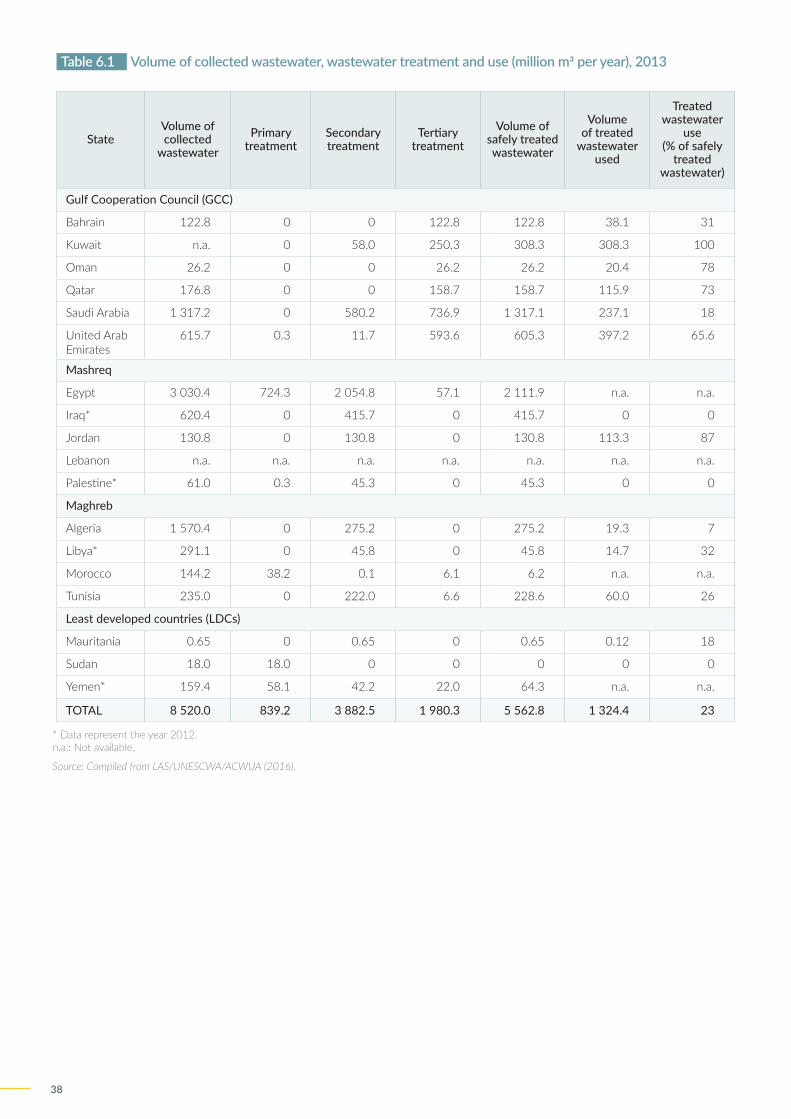
38
Table 6.1 Volume of collected wastewater, wastewater treatment and use (million m3 per year), 2013
StateVolume of collected
wastewaterPrimary
treatmentSecondary treatment
Tertiary treatment
Volume of safely treated wastewater
Volume of treated
wastewater used
Treated wastewater
use (% of safely
treated wastewater)
Gulf Cooperation Council (GCC)
Bahrain 122.8 0 0 122.8 122.8 38.1 31
Kuwait n.a. 0 58.0 250.3 308.3 308.3 100
Oman 26.2 0 0 26.2 26.2 20.4 78
Qatar 176.8 0 0 158.7 158.7 115.9 73
Saudi Arabia 1 317.2 0 580.2 736.9 1 317.1 237.1 18
United Arab Emirates
615.7 0.3 11.7 593.6 605.3 397.2 65.6
Mashreq
Egypt 3 030.4 724.3 2 054.8 57.1 2 111.9 n.a. n.a.
Iraq* 620.4 0 415.7 0 415.7 0 0
Jordan 130.8 0 130.8 0 130.8 113.3 87
Lebanon n.a. n.a. n.a. n.a. n.a. n.a. n.a.
Palestine* 61.0 0.3 45.3 0 45.3 0 0
Maghreb
Algeria 1 570.4 0 275.2 0 275.2 19.3 7
Libya* 291.1 0 45.8 0 45.8 14.7 32
Morocco 144.2 38.2 0.1 6.1 6.2 n.a. n.a.
Tunisia 235.0 0 222.0 6.6 228.6 60.0 26
Least developed countries (LDCs)
Mauritania 0.65 0 0.65 0 0.65 0.12 18
Sudan 18.0 18.0 0 0 0 0 0
Yemen* 159.4 58.1 42.2 22.0 64.3 n.a. n.a.
TOTAL 8 520.0 839.2 3 882.5 1 980.3 5 562.8 1 324.4 23
* Data represent the year 2012. n.a.: Not available.
Source: Compiled from LAS/UNESCWA/ACWUA (2016).
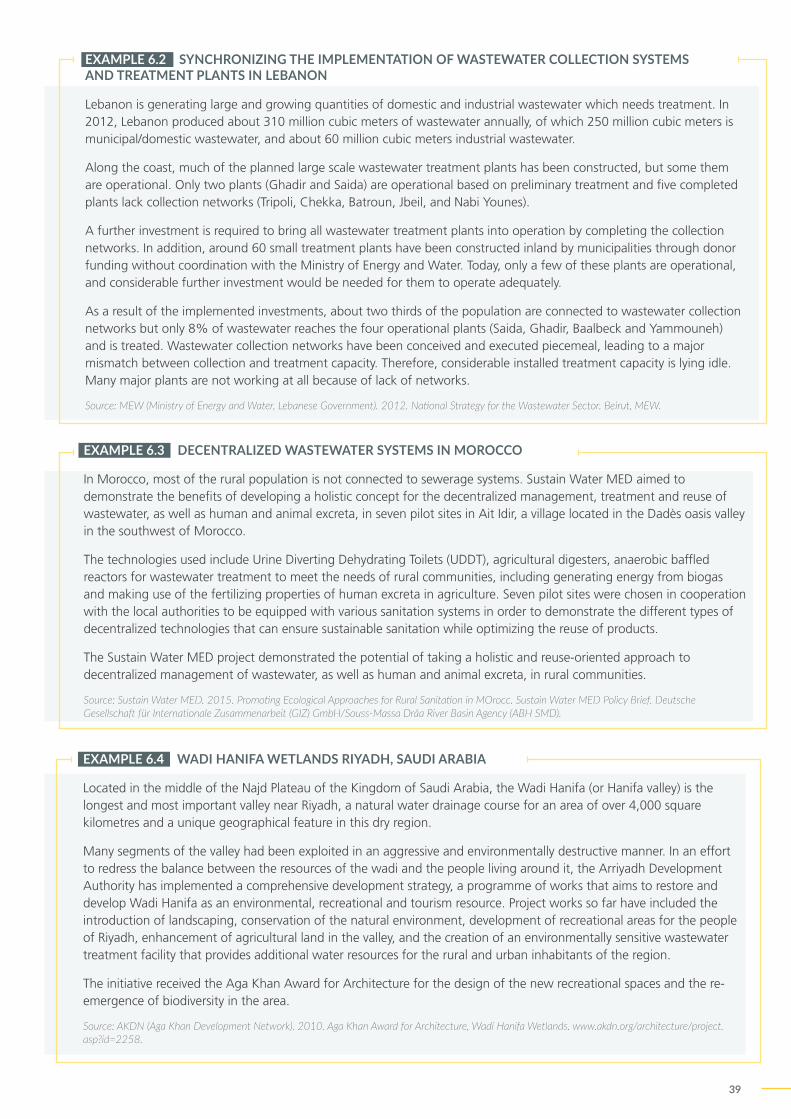
39
EXAMPLE 6.4 WADI HANIFA WETLANDS RIYADH, SAUDI ARABIA
Located in the middle of the Najd Plateau of the Kingdom of Saudi Arabia, the Wadi Hanifa (or Hanifa valley) is the longest and most important valley near Riyadh, a natural water drainage course for an area of over 4,000 square kilometres and a unique geographical feature in this dry region.
Many segments of the valley had been exploited in an aggressive and environmentally destructive manner. In an effort to redress the balance between the resources of the wadi and the people living around it, the Arriyadh Development Authority has implemented a comprehensive development strategy, a programme of works that aims to restore and develop Wadi Hanifa as an environmental, recreational and tourism resource. Project works so far have included the introduction of landscaping, conservation of the natural environment, development of recreational areas for the people of Riyadh, enhancement of agricultural land in the valley, and the creation of an environmentally sensitive wastewater treatment facility that provides additional water resources for the rural and urban inhabitants of the region.
The initiative received the Aga Khan Award for Architecture for the design of the new recreational spaces and the re-emergence of biodiversity in the area.
Source: AKDN (Aga Khan Development Network). 2010. Aga Khan Award for Architecture, Wadi Hanifa Wetlands. www.akdn.org/architecture/project.asp?id=2258.
EXAMPLE 6.3 DECENTRALIZED WASTEWATER SYSTEMS IN MOROCCO
In Morocco, most of the rural population is not connected to sewerage systems. Sustain Water MED aimed to demonstrate the benefits of developing a holistic concept for the decentralized management, treatment and reuse of wastewater, as well as human and animal excreta, in seven pilot sites in Ait Idir, a village located in the Dadès oasis valley in the southwest of Morocco.
The technologies used include Urine Diverting Dehydrating Toilets (UDDT), agricultural digesters, anaerobic baffled reactors for wastewater treatment to meet the needs of rural communities, including generating energy from biogas and making use of the fertilizing properties of human excreta in agriculture. Seven pilot sites were chosen in cooperation with the local authorities to be equipped with various sanitation systems in order to demonstrate the different types of decentralized technologies that can ensure sustainable sanitation while optimizing the reuse of products.
The Sustain Water MED project demonstrated the potential of taking a holistic and reuse-oriented approach to decentralized management of wastewater, as well as human and animal excreta, in rural communities.
Source: Sustain Water MED. 2015. Promoting Ecological Approaches for Rural Sanitation in MOrocc. Sustain Water MED Policy Brief. Deutsche Gesellschaft für Internationale Zusammenarbeit (GIZ) GmbH/Souss-Massa Drâa River Basin Agency (ABH SMD).
EXAMPLE 6.2 SYNCHRONIZING THE IMPLEMENTATION OF WASTEWATER COLLECTION SYSTEMS AND TREATMENT PLANTS IN LEBANON
Lebanon is generating large and growing quantities of domestic and industrial wastewater which needs treatment. In 2012, Lebanon produced about 310 million cubic meters of wastewater annually, of which 250 million cubic meters is municipal/domestic wastewater, and about 60 million cubic meters industrial wastewater.
Along the coast, much of the planned large scale wastewater treatment plants has been constructed, but some them are operational. Only two plants (Ghadir and Saida) are operational based on preliminary treatment and five completed plants lack collection networks (Tripoli, Chekka, Batroun, Jbeil, and Nabi Younes).
A further investment is required to bring all wastewater treatment plants into operation by completing the collection networks. In addition, around 60 small treatment plants have been constructed inland by municipalities through donor funding without coordination with the Ministry of Energy and Water. Today, only a few of these plants are operational, and considerable further investment would be needed for them to operate adequately.
As a result of the implemented investments, about two thirds of the population are connected to wastewater collection networks but only 8% of wastewater reaches the four operational plants (Saida, Ghadir, Baalbeck and Yammouneh) and is treated. Wastewater collection networks have been conceived and executed piecemeal, leading to a major mismatch between collection and treatment capacity. Therefore, considerable installed treatment capacity is lying idle. Many major plants are not working at all because of lack of networks.
Source: MEW (Ministry of Energy and Water, Lebanese Government). 2012. National Strategy for the Wastewater Sector. Beirut, MEW.

40
CHAPTER 7
MANAGEMENT, CAPACITY DEVELOPMENT, LEGAL/INSTITUTIONAL FRAMEWORKS, AND THE 2030 AGENDA
Elle
rnto
rs B
ridge
in H
ambu
rg (G
erm
any)
Phot
o ©
Bor
is St
rouj
ko/S
hutte
rsto
ck.c
om

41
7.1 The role and limits of ecosystems in wastewater management
There is a clear link between sustainable wastewater management and healthy ecosystems, and if managed well, this relationship can be mutually beneficial. ‘Green infrastructure’ (GI) refers to natural (e.g. riparian buffers, wetlands and mangroves) or semi-natural ecosystems (e.g. constructed wetlands, rain gardens, bio-retention ponds), which can provide services such as sediment filtration and pollution removal, comparable to certain functions of ‘grey infrastructure’ (e.g. conventional piped drainage and water treatment systems). The GI approach relies on the provision of ecosystem services to deliver primary water and wastewater management benefits, accompanied by a wide array of secondary co-benefits (e.g. carbon sequestration, biodiversity protection, recreation), in a cost-effective and sustainable manner (UNEP-DHI/IUCN/TNC/WRI, 2014). Protecting and restoring these GI systems benefits human society and contributes to healthy ecosystems.
Riparian buffers are vegetated areas next to water resources that act as filters and protect water quality, provide bank stabilization, and aquatic and wildlife habitat (see Table 7.1) (Lowrance et al., 1995).
Natural ecosystems are known as the kidneys of the environment, removing pollutants, regulating water flow and storing sediment. They can be very effective and economical in terms of providing wastewater treatment services, provided that these ecosystems are healthy, the pollutant load (and types of contaminants) in the effluent is regulated, and the pollution-carrying capacity of the ecosystem is not exceeded. There are natural limits to the assimilative capacity of ecosystems, beyond which they are threatened and can no longer perform a purifying role.
Once the concentration of contaminants in runoff reaches critical thresholds, there is a risk of abrupt and irreversible environmental change (Steffen et al., 2015).
Constructed wetlands and pond systems are recognized as a reliable wastewater treatment technology. In these systems, the planted vegetation greatly increases the surface contact area, which helps remove contaminants along the filter bed consisting usually of a combination of sand and gravel.
7.2 Knowledge, research, technology and capacity-building gaps
The use of existing technologies requires financing, technical capacity and infrastructure, which developing countries often lack. It also requires knowledge transfer, information sharing and capacity-building through education and training to support the sustainability of technology applications. These knowledge, technology and capacity gaps should be assessed through a gap and capacity analysis that will facilitate the required technology transfer, education and capacity-building efforts where needed.
The extremely low level of secondary and advanced wastewater treatment in developing countries indicates an urgent need for technological upgrades in wastewater treatment and safe use options to support the achievement of SDG Target 6.3. Appropriate and affordable technologies need to be transferred from developed to developing countries, supported by knowledge transfer and capacity-building. In addition to North–South cooperation, South–South cooperation can further support developing countries in improving their scientific, technological and innovative capacity. The transfer of new technologies, where their application is feasible and affordable, should be equally promoted.
Source: Lowrance et al. (1995, Table 6, p. 30).
Table 7.1 Effects of riparian buffers of different sizes on the reduction of sediment and nutrients from field surface runoff
Bufferwidth
(m)
Buffertype
Sediment Nitrogen Phosphorus
Input(mg/l)
Output(mg/l)
Reduction(%)
Input(mg/l)
Output(mg/l)
Reduction(%)
Input(mg/l)
Output(mg/l)
Reduction(%)
4.6 Grass 7 284 2 841 61.0 14.1 13.6 4.0 11.3 8.1 28.5
9.2 Grass 7 284 1 852 74.6 14.1 10.9 22.7 11.3 8.6 24.2
19.0 Forest 6 480 661 89.8 27.6 7.1 74.3 5.0 1.5 70.0
23.6 Grass/Forest 7 284 290 96.0 14.1 3.5 75.3 11.3 2.4 78.5
28.2 Grass/Forest 7 284 188 97.4 14.1 2.8 80.1 11.3 2.6 77.2
42
Emerging pollutants represent an evident knowledge and research gap. Research is needed to improve the understanding of the dynamics of these pollutants in water resources and the environment, and the methods to remove these pollutants from wastewater (UNESCO, 2015). Improved techniques for the assessment, monitoring and removal of emerging pollutants are required, as is further research on the potential for multi-resistant pathogen development. There are also huge gaps in the existing regulatory and monitoring frameworks, as well as in data availability regarding the occurrence level of emerging pollutants in wastewater and receiving water bodies (UNESCO, 2015).
Another necessary element for research and capacity building is a new health risk assessment related to pathogens present in wastewater and the mitigation measures required in developing countries. The most common health risk assessments are based on models that were largely studied and verified in developed countries. Similar models and studies are required for developing countries as well. While health risk mitigation measures generally target pathogen-related threats, health risks related to chemical pollutants also require attention, especially due to the ineffective industrial wastewater management in developing and emerging countries.
It is also essential to understand how external factors like climate change will impact wastewater management. Research on the impacts of climate change on wastewater systems and treatment processes has only recently begun to appear (GWP, 2014) and many questions remain to be studied. Furthermore, more research efforts and innovative data collection and sharing tools are needed to address the enormous data gaps with regard to wastewater.
7.2.1 Barriers to research, innovation and technology applications
Lack of financing is a major barrier for the application of existing technologies in developing countries, but also for the promotion of research and the transitioning of new technologies for large-scale applications in developed countries. The high costs of high-end technologies hamper their widespread application, especially in developing countries. Furthermore, a limited market niche for new technology applications halters innovation (Daigger, 2011). The limited knowledge about the market for products recovered from wastewater adds to this challenge. Scarce data and information on wastewater form another major impediment to research and innovation, as is the (often-missing) link between the academia, industry and local government.
Translating innovation into practical application requires research into financing opportunities and into ways to create a market niche for new technologies,
building human and technical capacities, and engaging stakeholders, including the private sector. This can be enabled through strong political will and government support.
7.3 Capacity building, public awareness and collaboration among stakeholders
Access to scientific knowledge, research, new technologies, appropriate education and training on sustainable solutions for wastewater management is not readily available in less developed countries. Education and capacity building is vital and can be offered through training programmes focusing on different aspects of wastewater management in developing countries, both targeting water professionals and as part of formal educational curricula at different levels. This can directly influence issues of social perception and acceptance, especially in wastewater use and resource recovery.
The social dimension should not be underestimated. Safe water reuse, for example, requires active stakeholder participation, based on an understanding of benefits and risks. Public education campaigns can raise awareness among the general public about the ways in which water can and is being safely reused, even for drinking purposes, with provocative examples – like water reuse by astronauts on the International Space Station. Enabling stakeholder involvement and capacity development as early as possible is critical for the success of planned reuse projects. Where reuse is based on a multi-barrier approach, behavioural change and the acceptance of best practices are keys to success. As stakeholders might lack the appropriate risk awareness and/or do not directly benefit from adopting safety measures, a better understanding of gender-specific incentives (both positive or negative) is needed to promote recommended practices, with the highest potential for local adoption (Karg and Drechsel, 2011).
Institutional capacity building is essential. If the entity in charge of operation and maintenance of wastewater facilities lacks the appropriate institutional capacity, the risk of failure will remain, regardless of whether the utility is managing smaller, decentralized or larger centralized plants (Murray and Drechsel, 2011). In this regard, a new generation of scientists, engineers and professionals, addressing different aspects of wastewater management, needs to be trained to face the problems that arise from increasingly complex and interconnected issues at different scales. Future wastewater managers will require a mix of technical and managerial skills in order to develop and implement a compendium of solutions across the various wastewater flows, from

43
pollution abatement at the source through collection and treatment to water reuse and the recovery of useful by-products.
Concrete efforts are required to train female researchers in the field of wastewater, in order to promote a greater number of women scientists in the higher echelons of scientific institutions and decision-making in developed and developing countries alike (WWAP, 2016). There is an urgent need, both in developed and developing countries, for education at all levels – from informal education for children and adults to higher education curriculum development – on the values of wastewater, while the risks of wastewater mismanagement for human and environmental health need urgent attention.
The development and implementation of innovative, transdisciplinary and holistic educational and training approaches, including actualized, distance, student-catered, problem-based learning and training materials, are essential to ensure that the issues and challenges can be embraced with deeper insight, advanced knowledge and greater confidence.
7.4 Legal and institutional frameworks
One of the main reasons why wastewater has been largely neglected is that it often lacks an institutional home, and many reformed water utilities have not realized the value in investing in wastewater infrastructure (UN-Water, 2015a). Improving wastewater governance therefore requires the alignment of varying interests in ways that allow people and organizations to collaborate towards meeting basic common needs while maximizing benefits across the various stages of wastewater management.
Regulatory frameworks need to be appropriate to time and place, recognizing the diversity of economies and cultures and the very different needs of different parts of society (UNEP, 2015b). Although there is a need to raise standards for water quality nearly everywhere, achieving progress will require a flexible and incremental approach. Adequate regulation is time-consuming and expensive, but if the whole-life costs and benefits of managing wastewater are factored in, the savings for society, the environment and the economy can be substantial (UNEP, 2015a). An effective regulatory framework requires that the implementing authority has the necessary technical and managerial capacity and performs in an independent fashion, with sufficient powers to enforce rules and guidelines. Transparency and access to information motivates compliance by promoting trust among users with respect to the implementation and enforcement processes (UN-Water, 2015b).
Wastewater management is of international concern, as pollution problems have no borders. The importance of international collaboration is illustrated by the case of the Danube and the Black Sea. Adequate national and international coordination can help ensure that limited financial resources are spent in the most effective way.
However, actions to address water pollution – by cleaner production and consumption processes and more efficient and comprehensive treatment – are nearly always undertaken locally. Hence, local regulation, stakeholder consultation and motivation for compliance remain critical elements of any sustainable wastewater management strategy.
Policies and regulatory instruments are also implemented locally and need to be adapted to varied circumstances. For example, where economic inequalities are stark, one centralized service provision strategy is unlikely to serve all users. It is therefore important that the political, institutional and financial support be distributed equally, as ‘bottom-up’ initiatives and small-scale local (i.e. decentralized) provision of wastewater management services also need the support and enabling environments to thrive.
Likewise, the ways of treating and using wastewater need to be chosen according to local circumstances, taking into account ecosystem needs, competing uses of water and culturally acceptable practices. Within such constraints, water can – and needs to – be reused as intensively as possible as a response to water scarcity and the increasing demand for food and energy. Where high-quality effluent is required, the adoption of (or changes in) water reuse legislation has been shown to be the main ‘push factor’ that influenced treatment plants in changing their current technology by essentially forcing them to implement advanced treatment schemes (DEMOWARE, 2016).
In many countries, new legislation and institutional arrangements will be required to accommodate and regulate the use of wastewater for a variety of uses, ranging from irrigation and industrial water recycling to aquifer recharge and the enhancement of ecosystem services. As an additional source of water, treated wastewater can be integrated into national water supply schemes (Hanjra et al., 2015b).
New regulations regarding the recovery of wastewater by-products are also required. Although the technical expertise is available, there is often little or no legislation on quality standards for these products, creating market uncertainties that can discourage investment. Markets for these products could be stimulated by financial or legal incentives (e.g. compulsory blending of recovered phosphates in artificial fertilizer). Applying quality criteria to the end product, rather than to the input material, could also help promote market acceptance of high-quality materials from municipal

44
wastewater and further stimulate the recycling of nutrients and other by-products of wastewater as a critical part of the circular economy.
The management of wastewater and the consequent protection of water resources is an area where societies’ ability to act for the benefit of those without a political voice of their own – the vulnerable, the coming generations and ecosystems – is continually challenged. Where the enforcement of standards and permits is required, the impartiality of public authorities is crucial. Transparency and public participation in policy-making may be ways to assure sensible, acceptable and sustainable solutions. A common vision and generalized agreement on the goals of wastewater management is the best guarantor of their successful implementation.
7.5 Fostering social acceptance
Even if wastewater use projects are technically well-designed, appear financially realizable and have incorporated appropriate health protection measures, water reuse schemes can still fail, if planners do not adequately account for the dynamics of social acceptance. Overall acceptance of (safe) wastewater use varies with the development stage of a society and can be a dynamic process, which makes social feasibility studies, close participation of user groups, and trust building critical components of a successful wastewater use programme (Drechsel et al., 2015b). While water scarcity can promote a positive perception of wastewater use, other factors will impact its public acceptance, including the availability of alternative water sources, levels of education, perceptions of health risks, religious concerns and the means and messages used in knowledge sharing and communication. Overcoming negative public perceptions is particularly critical in the case of drinking water (i.e. potable water reuse). Although these systems often present higher water quality standards than other water sources, extensive information campaigns and participation by the public are required to build trust in the system and overcome the so-called ‘yuck’ factor.
The health risks associated with water reuse need to be assessed, managed, monitored and reported on a regular basis in order to gain public acceptance and to maximize the benefits of using wastewater while minimizing the negative impacts (UN-Water, 2015a). In low- to middle-income countries with limited treatment capacity, where untreated or partially treated wastewater is released into water bodies and then abstracted and used for informal irrigation, the cultural and social challenge is not the introduction of water reuse but the prevention of unintentional/unsafe use of untreated wastewater. In those cases, support is needed for a transition towards safe reuse of wastewater (Drechsel et al., 2015b).
7.6 Potential synergies and conflicts
Achieving the 2030 Agenda for Sustainable Development will require concerted efforts to manage the potential conflicts and synergies between SDG 6 and other SDGs. A careful analysis of goals and targets may highlight conditions, where the achievement of one goal may favour the achievement of another. Conversely, situations where achieving one goal may hinder the achievement of another will require the identification of acceptable trade-offs (UN-Water, 2016b).
7.6.1 Potential synergies
SDG 6 cannot be fully achieved by addressing each target independently. For example, “increased access to sanitation (6.2) must be harmonised with increased wastewater treatment (6.3) in order to support good ambient water quality (6.3) and to guarantee healthy water-related ecosystems (6.6). Similarly, good ambient water quality (6.3) greatly facilitates the provision of safe drinking water (6.1), which must be provided sustainably (6.4), without negative consequences for water-related ecosystems (6.6). Increasing recycling and safe reuse (6.3) and water-use efficiency (6.4) make more water available for drinking (6.1) and other uses (6.4), and can reduce impacts on water-related ecosystems (6.6). Sustainable water supply and use (6.4), good ambient water quality (6.3), and healthy water-related ecosystems (6.6) are inter-dependent” (UN-Water, 2016b).
The achievement of SDG Target 6.3 is also a precondition to the achievement of other SDGs and the overarching goal of eradicating poverty. Appropriate wastewater collection and treatment helps protect the water quality in river basins and the goods and services that these provide, while significantly reducing the number of people exposed to water-related diseases (SDG Targets 3.3 and 3.9), providing related health and economic benefits and contributing to poverty alleviation (SDG Targets 1.1 and 1.2).
Water-related diseases and malnutrition prevent people from working and attending school, both of which strengthen the cycle of poverty (UNDP, 2006). Investing in water and wastewater management would provide particularly high returns by breaking the link between unsafe water and diseases that causes diarrhoea, particularly in developing countries. Prolonged diarrhoea intensifies poor health and malnutrition in children, and often leads to stunted growth due to poor nutrient absorption and loss of appetite (UNICEF/WHO, 2009). Therefore, improved sanitary conditions and wastewater management contribute to the success of nutrition enhancement strategies (SDG Target 2.2), reduces preventable deaths among children (SDG Target 3.2) and enhances children’s attendance and performance in school (SDG Target 4.7).

45
Reducing the burden of disease also reduces the time spent taking care of sick family members, leaving more time to participate in the formal economy (SDG 8) and in social and political decision-making. Women, who are often the main caregivers and who are responsible for the water supply within households, would also benefit from improved sanitation conditions and wastewater management, as they are frequently responsible for the management and use of greywater or wastewater in agriculture. Inclusive and gender-sensitive water management policies also support the achievement of gender equality (SDG 5).
Improved wastewater treatment and the increase in water reuse, as called for in SDG Target 6.3, will support the transition to a circular economy by helping reduce water withdrawals and the loss of resources in production systems and economic activities. The exchanges of energy, water and material flows in wastewater by-products can allow businesses to enhance their environmental performance and competitive capacity. These exchanges are often mutually beneficial, favouring a reduction in production costs, water consumption and/or wastewater treatment costs (SDG Targets 8.2 and 8.4).
Building climate-resilient wastewater infrastructure networks can decrease the direct economic losses caused by disasters (SDG Target 11.5), while increasing the capacity of human settlements to recover from natural hazards such as floods and droughts (SDG Target 13.1). Improved wastewater management also has great
potential for reducing GHG emissions (SDG Target 13.2). Wastewater can be considered a reliable source of water in the planning and development of new settlements and water resource projects (SDG Target 11.6).
The achievement of SDG Target 6.3 also contributes to the reduction of land-based pollution in terrestrial and marine ecosystems (SDGs 14 and 15).
7.6.2 Potential conflicts
In cases where interlinkages between SDG Target 6.3 and the other SDGs are not mutually beneficial, it will be important to balance conflicting needs and manage trade-offs.
Ending hunger, increasing food sufficiency (SDG Target 2.1), and doubling smallholders’ productivity and incomes (SDG Target 2.3) are essential to support poverty eradication (SDG 1). However, the achievement of SDG 2 also implies an increase in agricultural productivity, which may lead to an increase in water demand and the use of herbicides, pesticides and fertilizers, with a consequent decline in water quality and quantity if resources are not properly managed. The use of best agricultural practices needs to be promoted in parallel with the reduction of food waste.Improving drinking water coverage in formal and informal settlements (SDG 11) is a matter of fundamental importance to the fulfilment of the human right to water and sanitation. This needs to go alongside the expansion of wastewater collection and treatment so as to avoid impacts on water quality, human health and the environment.
Figure 7.1 Percentage of untreated wastewater in 2015 in countries with different income levels and aspirations for 2030 (50% reduction over 2015 baseline)
Source: Based on data from Sato et al. (2013).
Low-income countries
Lower middle-income countries
Upper middle-income countries
High-income countries
Wastewater treatment (%)
15
0 20 40 60 80 100
31
36
62
72
9246
30
Untreated wastewater in 2030 (Aspiration)
Untreated wastewater in 2015 (Baseline)

46
Increasing economic growth (SDG 8) and the development of small-scale industries (SDG Target 9.3) also present potential conflicts with the achievement of SDG Target 6.3 where pollution and the release of untreated wastewater are concerned. Economic development or improving ‘the access of small-scale industries in developing countries to financial services’ needs to occur in compliance with environmental health and safety regulations. The creation of an enabling environment where small-scale industries are required to respect environmental regulations in order to access to financial services can be a positive incentive.Finally, reducing inequality within and between countries (SDG Target 10.1) means that ensuring adequate wastewater management services are available to all. This is one of the keys to achieving sustainable development and ensuring that enough water of good quality will be available for future generations.

47

The UNESCO World Water Assessment Programme (WWAP) brings together the work of numerous UN-Water Members and Partners to publish the United Nations World Water Development Report (WWDR) series.
The annual World Water Development Reports focus on strategic water issues. UN-Water Members and Partners, all experts in their respective fields, contribute the latest findings on a specific theme.
The 2017 edition of the World Water Development Report focuses on ‘Wastewater’ and seeks to inform decision-makers, inside and outside the water community, about the importance of managing wastewater as an undervalued and sustainable source of water, energy, nutrients and other recoverable by-products, rather than something to be disposed of or a nuisance to be ignored.
The report’s title – Wastewater: The Untapped Resource – reflects the critical role that wastewater is poised to play in the context of a circular economy, whereby economic development is balanced with the protection of natural resources and environmental sustainability, and where a cleaner and more sustainable economy has a positive effect on the water quality. Improved wastewater management is not only critical to achieving the Sustainable Development Goal on clean water and sanitation (SDG 6), but also to other goals of the 2030 Agenda for Sustainable Development.
In a world where demands for freshwater are continuously growing, and where limited water resources are increasingly stressed by over-abstraction, pollution and climate change, neglecting the opportunities arising from improved wastewater management is nothing less than unthinkable.
Financed by Sultan Bin Abdulaziz Al-Saud Foundation