appendix 1a - literature review and built examples - … · literature review and built examples...
TRANSCRIPT
Literature Review and Built Examples — Appendices January 2004
Page 1 of 49
Appendix 1A
Spot test measurements
Literature Review and Built Examples — Appendices January 2004
Page 2 of 49
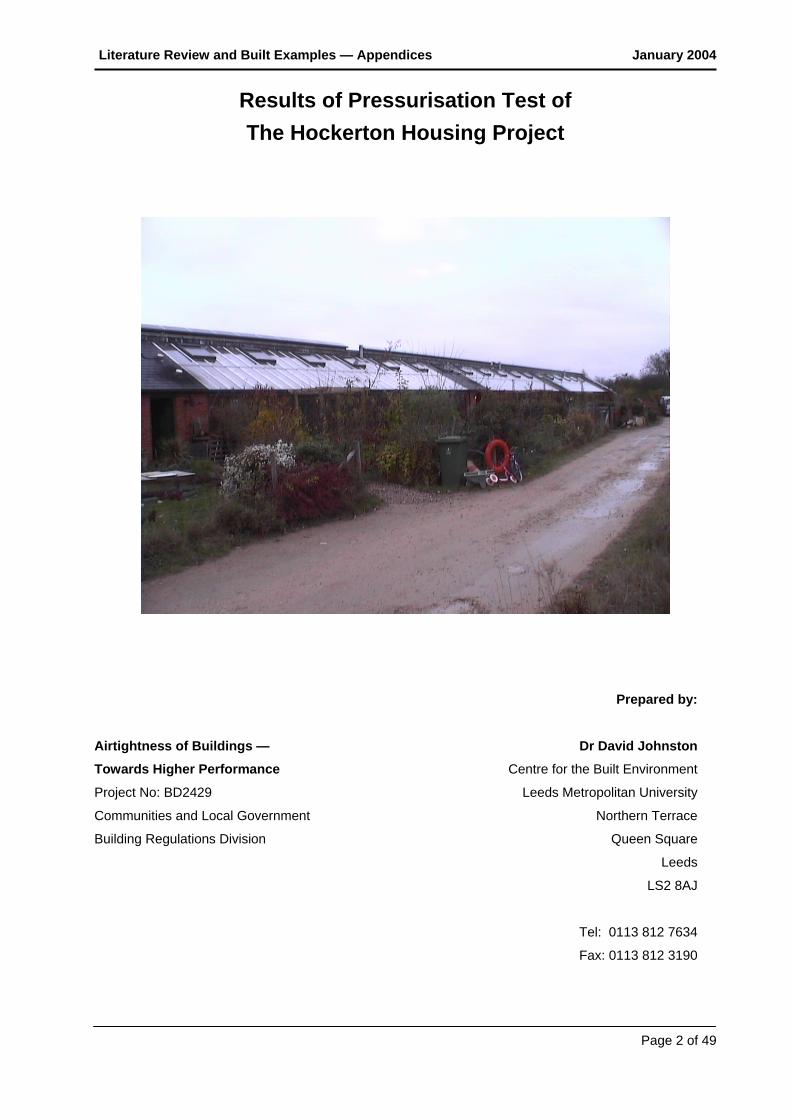
Results of Pressurisation Test of The Hockerton Housing Project
Prepared by:
Airtightness of Buildings — Dr David Johnston
Towards Higher Performance Centre for the Built Environment
Project No: BD2429 Leeds Metropolitan University
Communities and Local Government Northern Terrace
Building Regulations Division Queen Square
Leeds
LS2 8AJ
Tel: 0113 812 7634
Fax: 0113 812 3190
Literature Review and Built Examples — Appendices January 2004
Page 3 of 49
1 Introduction
This report presents the results of the pressure tests carried out on the Hockerton Housing Project, Hockerton on 5 November 2003. The tests were carried out by Neil Prescott of Building Sciences Ltd.
2 Building Description
The Hockerton Housing Project consists of a terrace of five single storey earth-sheltered dwellings, each of which has an internal floor area of 122 m2. A south-facing conservatory runs the full width of each dwelling.
The dwellings have been constructed using masonry cavity and reinforced concrete rear and side walls, a reinforced concrete ground floor slab and a pre-cast concrete beam-and-block roof. All of these elements are insulated externally using 300 mm of expanded polystyrene. The south-facing wall of the dwellings is of brick-block construction, with a 150 mm fully filled cavity. Internal walls are constructed from 200 mm dense concrete blocks, and all of the internal walls are wet plastered.
3 Air Leakage Standard
A new national standard – TM23 Testing buildings for air leakage (CIBSE, 2000) – has been introduced in the UK, which covers the pressure testing of all buildings. This has been adopted as the test standard for Part L1 of the Building Regulations 2000 (England and Wales), which came into force in April 2002 (ODPM, 2001).
Traditionally, the airtightness of dwellings has been expressed as an air leakage rate in air changes per hour (ac/h). However, the Approved Document Part L1 2002 (England and Wales) is written in terms of air permeability, and compliance can be demonstrated by pressure testing to show that the air permeability does not exceed 10 m3/(h.m2) @ 50Pa (although for dwellings a pressure test is not mandatory).
TM23 (CIBSE, 2000) defines air change rate and air permeability as follows:
Air change rate
This is the volume flow rate per cubic metre of building internal volume (ac/h) at a test pressure of 50Pa.
Air permeability
This is the leakage rate per square metre of building envelope (m3/(h.m2)) at a test pressure of 50Pa. The envelope area taken into account in calculating air permeability is the internal surface area of the external façade, and includes the walls, roofs and the total ground floor area. No deductions are made for partitions or the separating walls with adjacent buildings or garages.
Literature Review and Built Examples — Appendices January 2004
Page 4 of 49
The calculated internal volume and envelope area for each dwelling (excluding the conservatory) is 324 m3 and 372 m2, respectively. If the conservatory is included, the internal volume and envelope area of each dwelling increases to 472 m3 and 491 m2, respectively.
4 Fan Pressurisation System
Fan pressurisation systems are used to quantify the air leakage of the envelope of buildings. The leakiness of the envelope is quantified by connecting a single large fan or a series of fans into an external doorway and pressurising the building whilst measuring the air flow rate required to maintain a pressure difference across the building envelope. The leakier the building, the greater the air flow required to maintain a given pressure differential (in almost all cases a differential of 50Pa is used).
The fan system used on this project consisted of an Infiltec Blower Door (Model E3). All other external doors were kept closed during the test.
Tests are normally carried out when the outside wind speed is low to minimise any wind induced pressure variations. Air volume flow rate Q (m3/s) through the fans is measured by calibrated flow grids over a suitable range of building pressure differentials ΔP(Pa). These are then corrected for internal/external temperature difference, in accordance with TM23. A best-fit power-law profile of the form Q=Cenv (ΔP)n is fitted to the data where both the coefficient Cenv and exponent n are constants.
Cenv is then corrected for the measured barometric pressure to a specified test pressure of 50Pa, providing CL.
The theoretical leakage rate at 50Pa is then calculated from the formula:
Q50=CL(ΔP)n
The air change rate can then be calculated by dividing the air volume flow rate (m3/h) through the building envelope at a pressure differential of 50Pa (Q50), by the building volume (V). The result is expressed in terms of air changes per hour (ac/h).
To compare the envelope leakage characteristics between buildings of different shapes and sizes, air permeability (Q50/ST) is used. ST is the total internal surface area (m2). The result is expressed in terms of m3 leakage per hour per m2 of envelope area (m3/(h.m2)).
5 Test Procedure
The mean internal and external temperatures were measured and recorded during the tests. The temperature values recorded were used to standardise the air flow rate through the fan systems to commonly agreed conditions. A further parameter measured was wind speed. If the measured wind speed had been too high (i.e. > 3 m/s) the test would not have been carried out.
Literature Review and Built Examples — Appendices January 2004
Page 5 of 49
The test procedure consisted of pressurising each dwelling to approximately 50Pa then taking a set of measurements of the building pressure differential and flow rate through the fans. The fan speeds were then reduced in several steps and the readings repeated at each of the speed settings. Each dwelling was then depressurised, and the test procedure repeated. The result is two sets of measurements; one for pressurisation and one for depressurisation.
The following temporary seals were in place at the time of the tests:
• The supply and extract ducts of the MVHR system were sealed using duct tape.
• The air bricks within the conservatory of the dwelling tested had been sealed by the dwellings occupants.
In addition, all of the trickle vents were adjusted to the closed position.
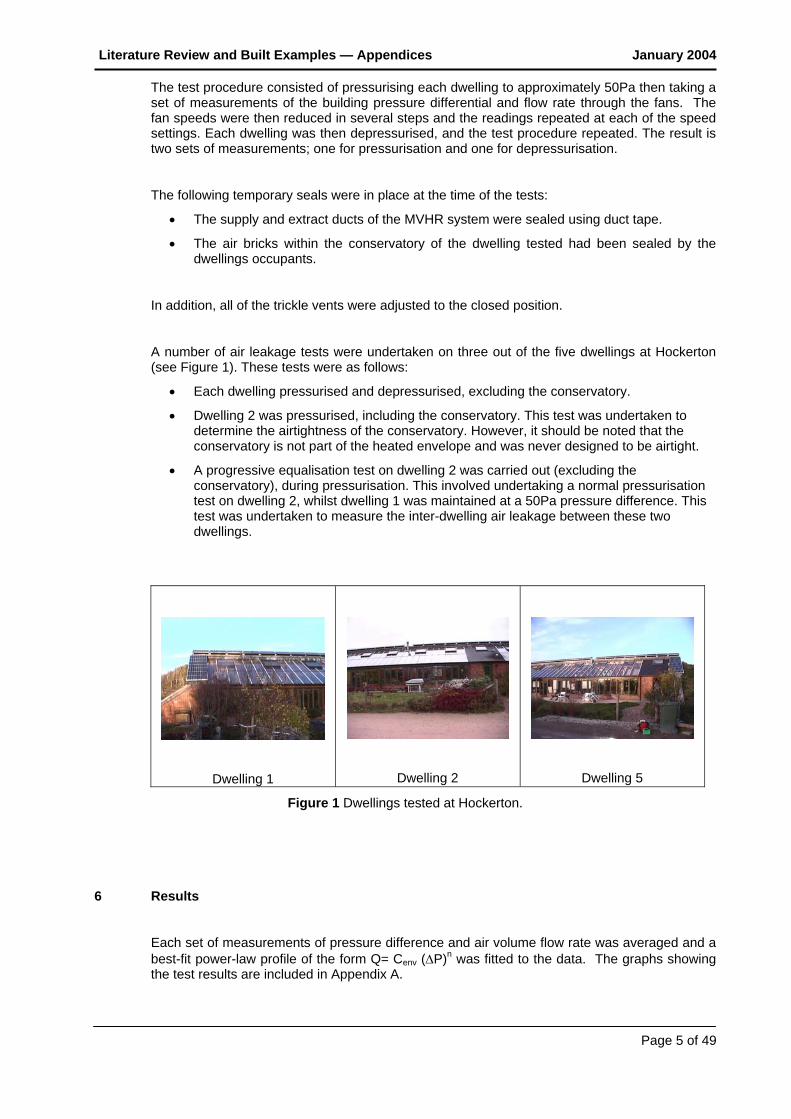
A number of air leakage tests were undertaken on three out of the five dwellings at Hockerton (see Figure 1). These tests were as follows:
• Each dwelling pressurised and depressurised, excluding the conservatory.
• Dwelling 2 was pressurised, including the conservatory. This test was undertaken to determine the airtightness of the conservatory. However, it should be noted that the conservatory is not part of the heated envelope and was never designed to be airtight.
• A progressive equalisation test on dwelling 2 was carried out (excluding the conservatory), during pressurisation. This involved undertaking a normal pressurisation test on dwelling 2, whilst dwelling 1 was maintained at a 50Pa pressure difference. This test was undertaken to measure the inter-dwelling air leakage between these two dwellings.
Dwelling 1
Dwelling 2
Dwelling 5
Figure 1 Dwellings tested at Hockerton.
6 Results
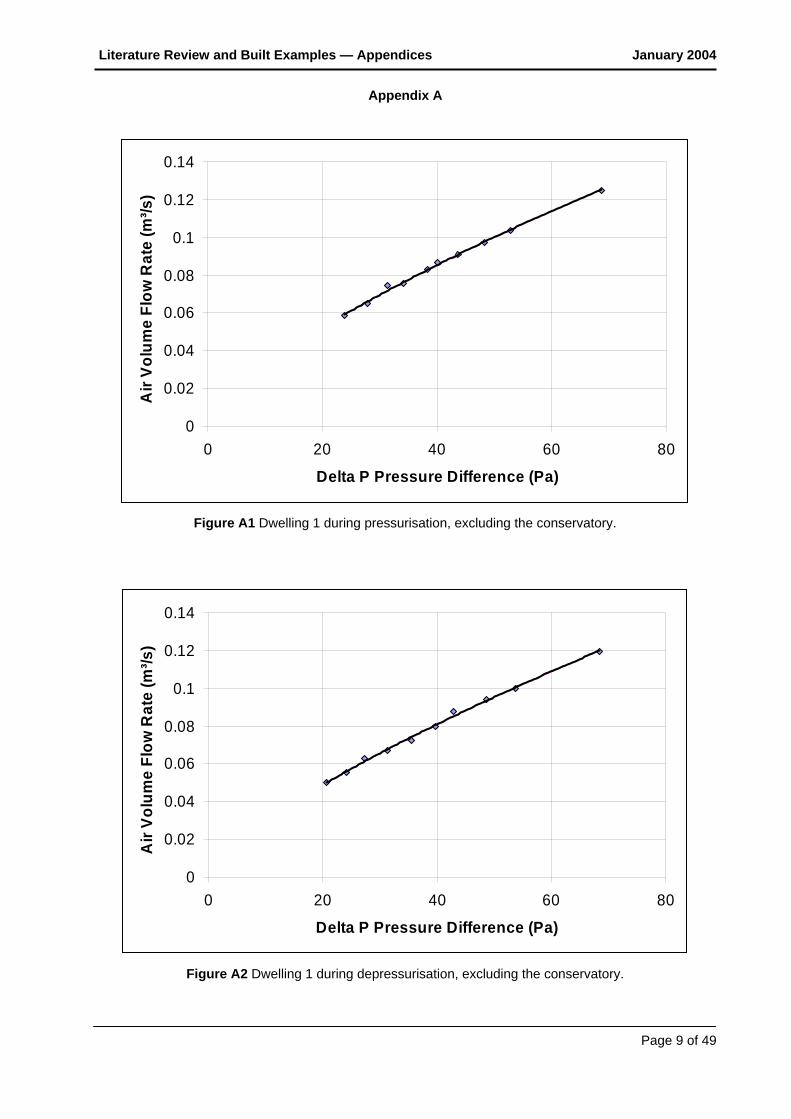
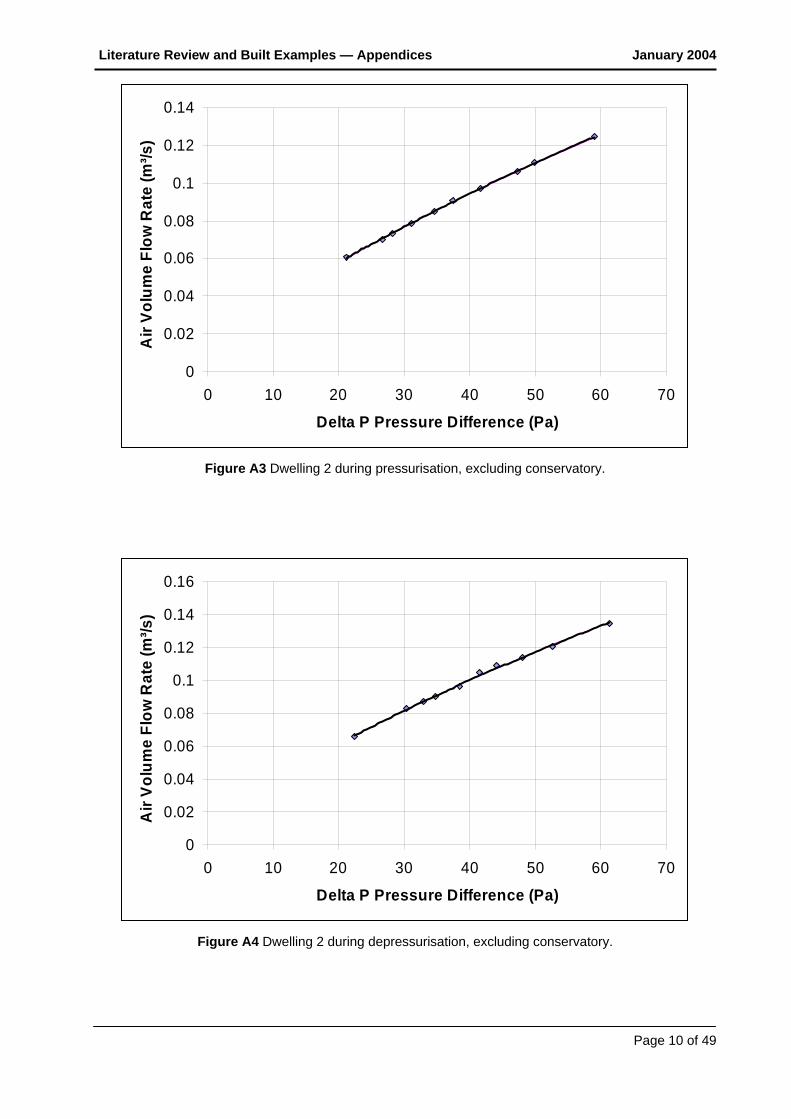
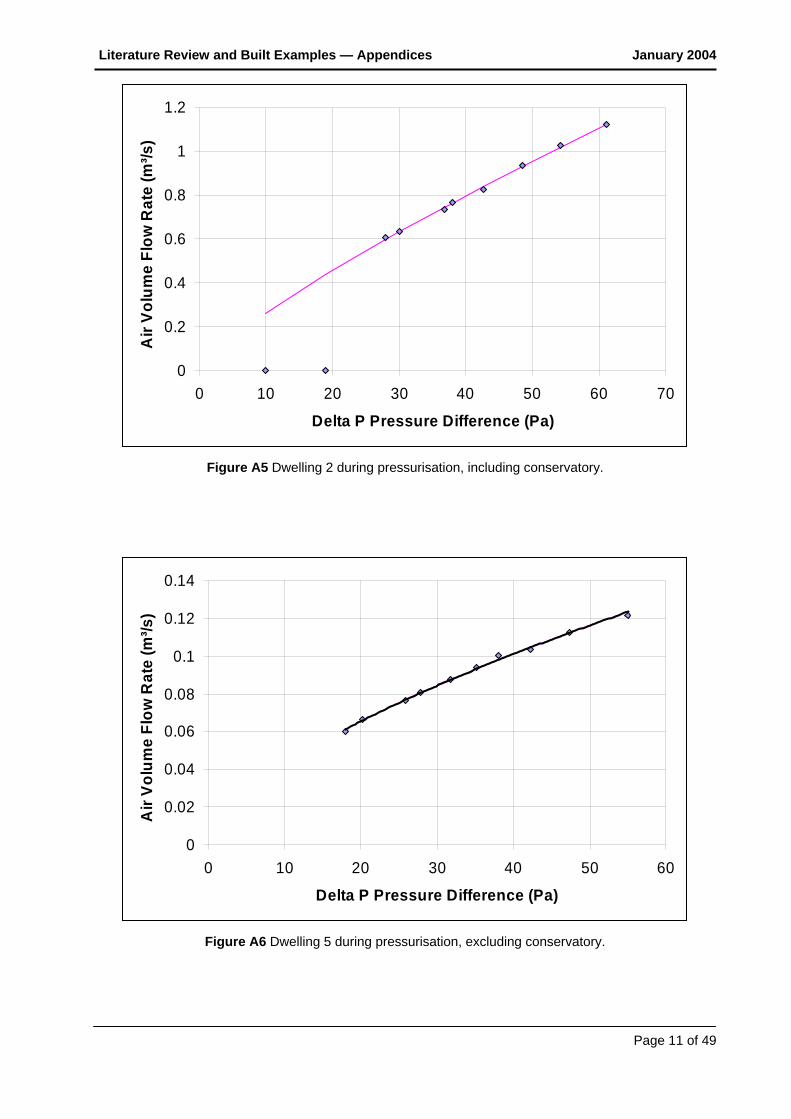
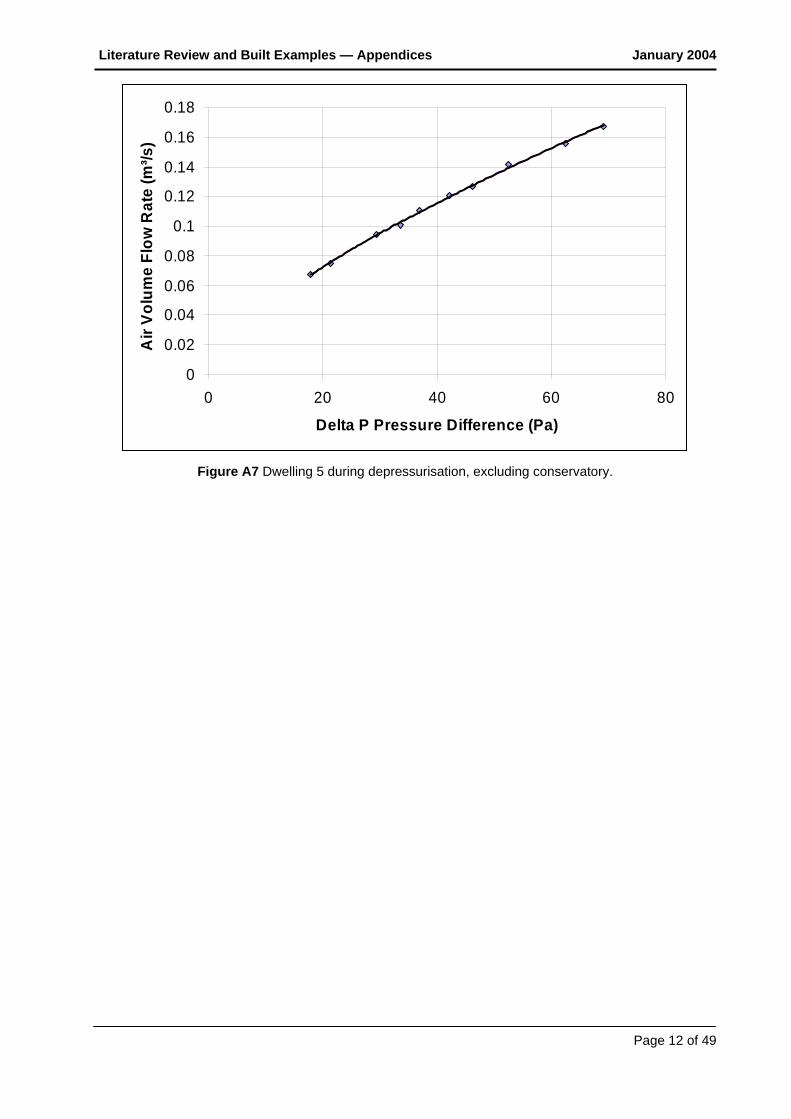
Each set of measurements of pressure difference and air volume flow rate was averaged and a best-fit power-law profile of the form Q= Cenv (ΔP)n was fitted to the data. The graphs showing the test results are included in Appendix A.
Literature Review and Built Examples — Appendices January 2004
Page 6 of 49
Air change rate
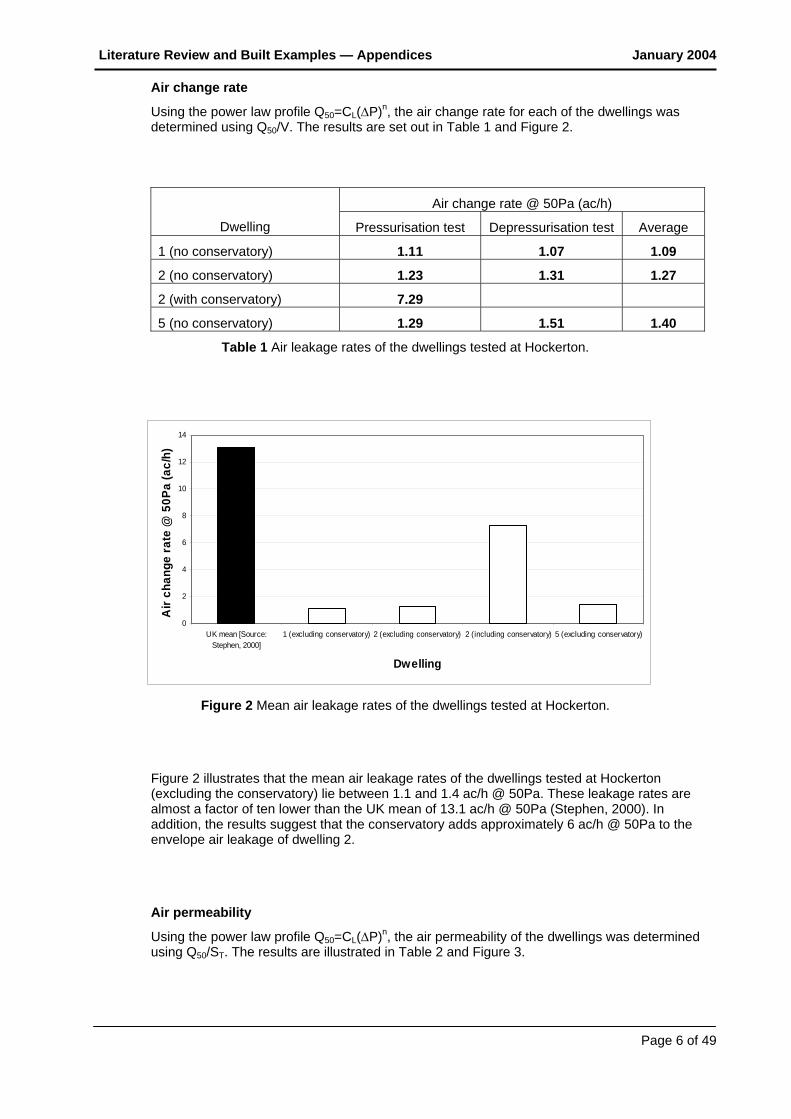
Using the power law profile Q50=CL(ΔP)n, the air change rate for each of the dwellings was determined using Q50/V. The results are set out in Table 1 and Figure 2.
Air change rate @ 50Pa (ac/h)
Dwelling Pressurisation test Depressurisation test Average
1 (no conservatory) 1.11 1.07 1.09
2 (no conservatory) 1.23 1.31 1.27
2 (with conservatory) 7.29
5 (no conservatory) 1.29 1.51 1.40
Table 1 Air leakage rates of the dwellings tested at Hockerton.
0
2
4
6
8
10
12
14
UK mean [Source:Stephen, 2000]
1 (excluding conservatory) 2 (excluding conservatory) 2 (including conservatory) 5 (excluding conservatory)
Dwelling
Air
chan
ge ra
te @
50P
a (a
c/h)
Figure 2 Mean air leakage rates of the dwellings tested at Hockerton.
Figure 2 illustrates that the mean air leakage rates of the dwellings tested at Hockerton (excluding the conservatory) lie between 1.1 and 1.4 ac/h @ 50Pa. These leakage rates are almost a factor of ten lower than the UK mean of 13.1 ac/h @ 50Pa (Stephen, 2000). In addition, the results suggest that the conservatory adds approximately 6 ac/h @ 50Pa to the envelope air leakage of dwelling 2.
Air permeability
Using the power law profile Q50=CL(ΔP)n, the air permeability of the dwellings was determined using Q50/ST. The results are illustrated in Table 2 and Figure 3.

Literature Review and Built Examples — Appendices January 2004
Page 7 of 49
Air permeability @ 50Pa (m3/(h.m2)
Dwelling Pressurisation test Depressurisation test Average
1 (no conservatory) 0.97 0.93 0.95
2 (no conservatory) 1.07 1.14 1.11
2 (with conservatory) 7.01
5 (no conservatory) 1.13 1.32 1.23
Table 2 Air permeability of the dwellings tested at Hockerton.
0
2
4
6
8
10
12
14
ApprovedDocument Part L1
(2002)
UK mean [Source:Stephen, 2000]
1 (excludingconservatory)
2 (excludingconservatory)
2 (includingconservatory)
5 (excludingconservatory)
Dwelling
Air
perm
eabi
lity
@ 5
0Pa
(m3 /h
/m2 )
Figure 3 Mean air permeability of the dwellings tested at Hockerton.
Figure 3 illustrates that the mean air permeability of the dwellings at Hockerton (excluding the conservatory) lie between 0.95 and 1.23 m3/(h.m2) @ 50Pa. This is considerably lower than the UK mean of 11.48 m3/(h.m2), and the maximum specified level of 10 m3/(h.m2) that is contained within the Approved Document Part L1 (ODPM, 2001). Even if the conservatory is included in the test, the air permeability of dwelling 2 only increases to 7 m3/(h.m2). Therefore, all of the dwellings tested would satisfy the air leakage criterion set out in Approved Document Part L1.
Pressure equalisation test
The pressure equalisation test on dwelling 2 revealed that there was no significant inter-dwelling leakage between this dwelling and dwelling 1.
Leakage identification
The main air leakage paths within the dwellings were identified by pressurising the building, and locating the main areas of air leakage using hand held smoke generators. Although it was possible to identify the main air leakage paths within the dwellings, it was not possible to quantify the contribution that these leakage paths made to the dwelling’s overall air leakage. Nevertheless, the results were informative.
Literature Review and Built Examples — Appendices January 2004
Page 8 of 49
The main air leakage paths observed were as follows:
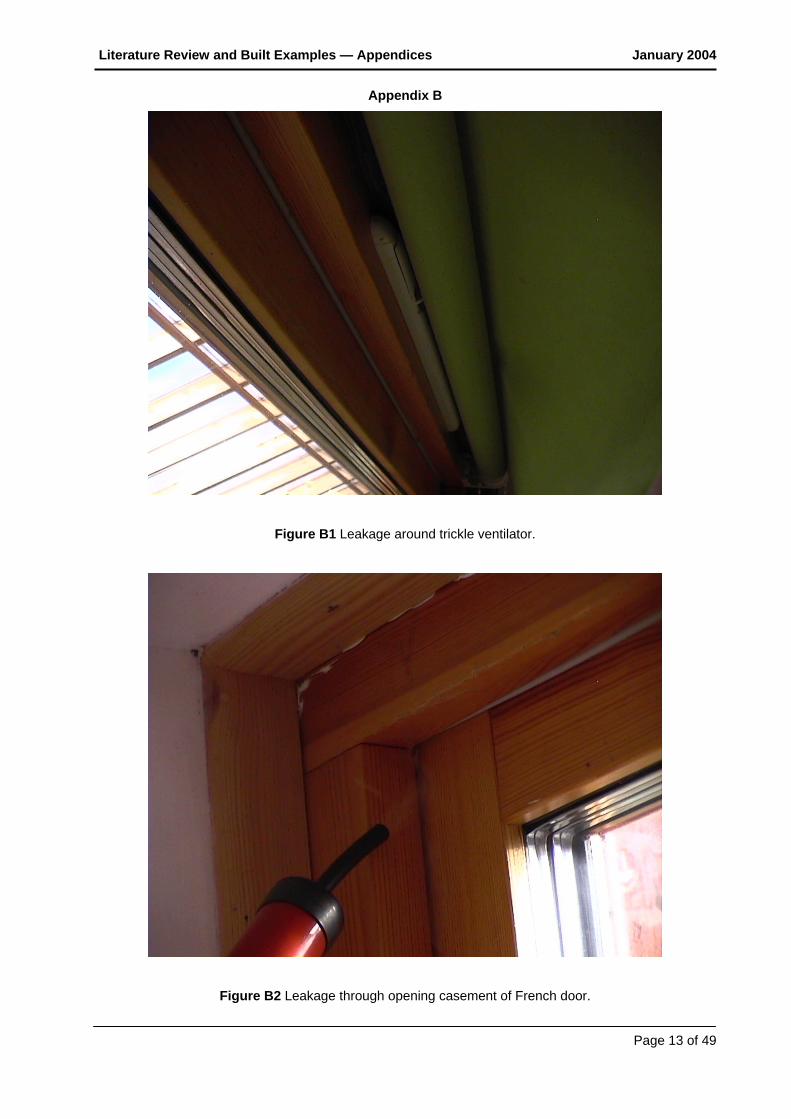
• Around trickle ventilators (see Figure B1).
• The opening casements of the French doors in all of the dwellings (see Figure B2).
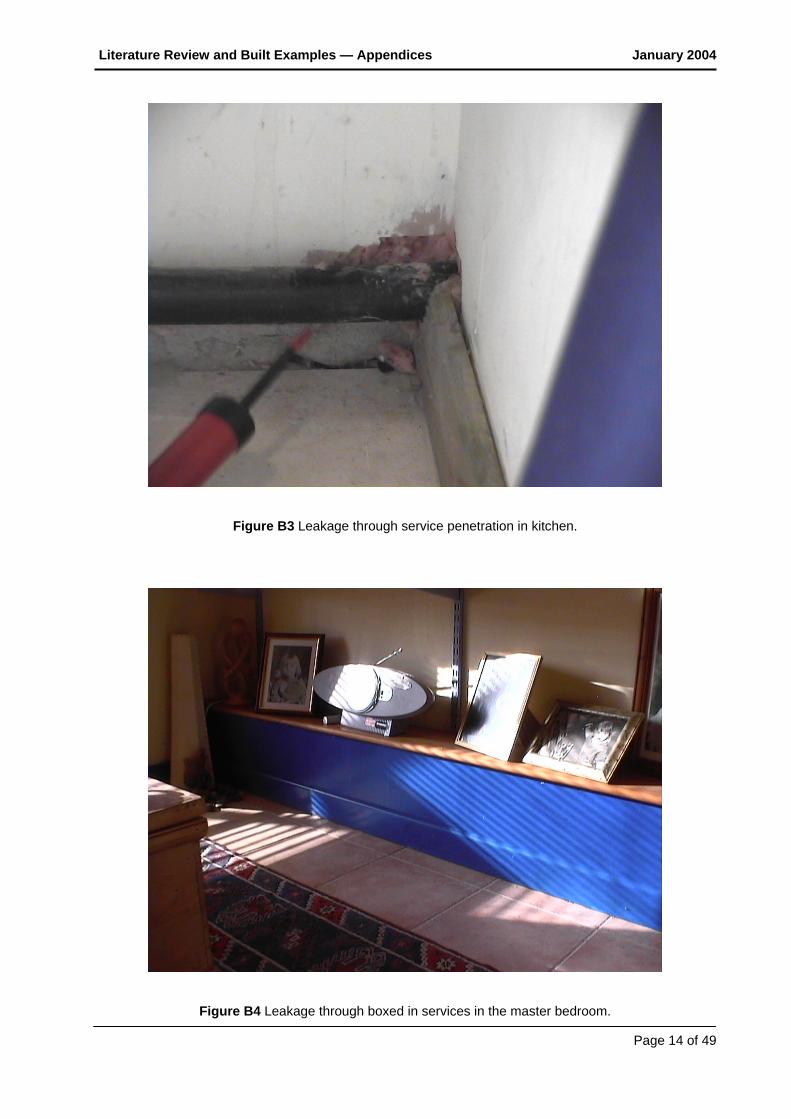
• Service penetrations in the kitchen of dwelling 2 (see Figure B3).
• Service penetrations in the porch of dwelling 2.
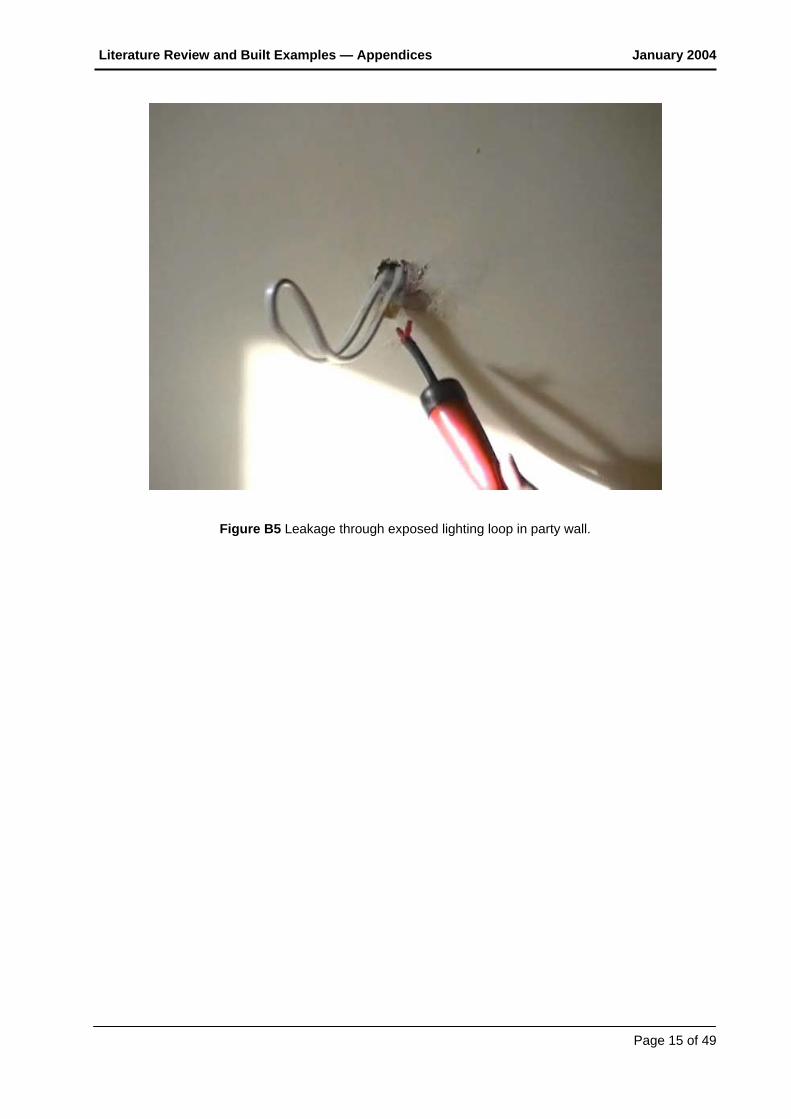
• Through the boxed-in services in the master bedroom of all of the dwellings (see Figure B4).
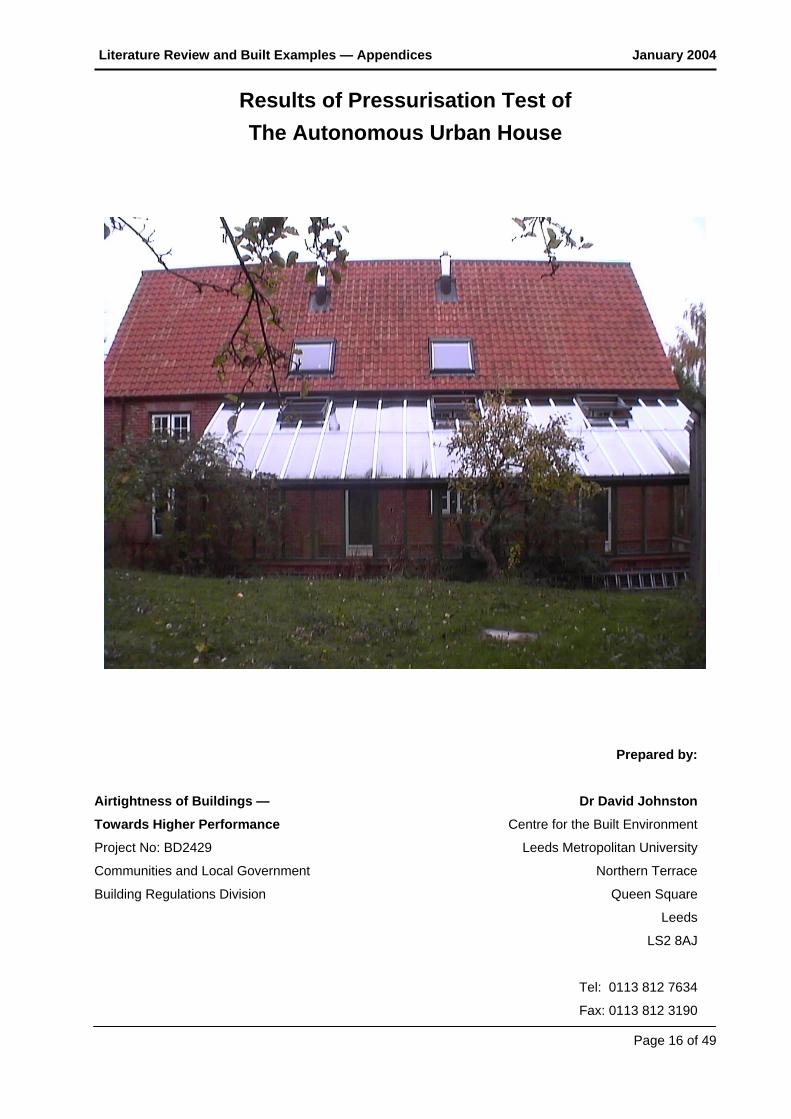
• Through an exposed lighting loop in the party wall of dwelling 2 (see Figure B5).
References
CIBSE (2000) Testing Buildings for Air Leakage: CIBSE Technical Memoranda TM23: 2000. London, The Chartered Institute of Building Services Engineers.
ODPM (2001) The Building Regulations 2000 Approved Document Part L1: Conservation of Fuel and Power in Dwellings. 2002 Edition. Office of the Deputy Prime Minister, London, HMSO.
STEPHEN, R. (2000) Airtightness in UK Dwellings. BRE Information Paper IP 1/00, January 2000. Garston, Watford, Building Research Establishment.
Report Status
The information contained within this report has been produced for the purpose of a research project undertaken by Leeds Metropolitan University for Communities and Local Government. A copy of this report has been provided to the occupants of the Hockerton Housing Project for their own use. The information in this report may be used in material published by the Hockerton Housing Project with appropriate acknowledgement and reference.
Disclaimer
Whilst all reasonable care and attention has been taken in compiling this report, the author and Building Sciences Ltd do not accept any responsibility or liability for any statements contained within it that may be used or relied upon by any other party.
Literature Review and Built Examples — Appendices January 2004
Page 9 of 49
Appendix A
0
0.02
0.04
0.06
0.08
0.1
0.12
0.14
0 20 40 60 80
Delta P Pressure Difference (Pa)
Air
Volu
me
Flow
Rat
e (m
³/s)
Figure A1 Dwelling 1 during pressurisation, excluding the conservatory.
0
0.02
0.04
0.06
0.08
0.1
0.12
0.14
0 20 40 60 80
Delta P Pressure Difference (Pa)
Air
Volu
me
Flow
Rat
e (m
³/s)
Figure A2 Dwelling 1 during depressurisation, excluding the conservatory.
Literature Review and Built Examples — Appendices January 2004
Page 10 of 49
0
0.02
0.04
0.06
0.08
0.1
0.12
0.14
0 10 20 30 40 50 60 70
Delta P Pressure Difference (Pa)
Air
Volu
me
Flow
Rat
e (m
³/s)
Figure A3 Dwelling 2 during pressurisation, excluding conservatory.
0
0.02
0.04
0.06
0.08
0.1
0.12
0.14
0.16
0 10 20 30 40 50 60 70
Delta P Pressure Difference (Pa)
Air
Volu
me
Flow
Rat
e (m
³/s)
Figure A4 Dwelling 2 during depressurisation, excluding conservatory.
Literature Review and Built Examples — Appendices January 2004
Page 11 of 49
0
0.2
0.4
0.6
0.8
1
1.2
0 10 20 30 40 50 60 70
Delta P Pressure Difference (Pa)
Air
Volu
me
Flow
Rat
e (m
³/s)
Figure A5 Dwelling 2 during pressurisation, including conservatory.
0
0.02
0.04
0.06
0.08
0.1
0.12
0.14
0 10 20 30 40 50 60
Delta P Pressure Difference (Pa)
Air
Volu
me
Flow
Rat
e (m
³/s)
Figure A6 Dwelling 5 during pressurisation, excluding conservatory.
Literature Review and Built Examples — Appendices January 2004
Page 12 of 49
0
0.02
0.04
0.06
0.08
0.1
0.12
0.14
0.16
0.18
0 20 40 60 80
Delta P Pressure Difference (Pa)
Air
Volu
me
Flow
Rat
e (m
³/s)
Figure A7 Dwelling 5 during depressurisation, excluding conservatory.
Literature Review and Built Examples — Appendices January 2004
Page 13 of 49
Appendix B
Figure B1 Leakage around trickle ventilator.
Figure B2 Leakage through opening casement of French door.
Literature Review and Built Examples — Appendices January 2004
Page 14 of 49
Figure B3 Leakage through service penetration in kitchen.
Figure B4 Leakage through boxed in services in the master bedroom.
Literature Review and Built Examples — Appendices January 2004
Page 15 of 49
Figure B5 Leakage through exposed lighting loop in party wall.
Literature Review and Built Examples — Appendices January 2004
Page 16 of 49
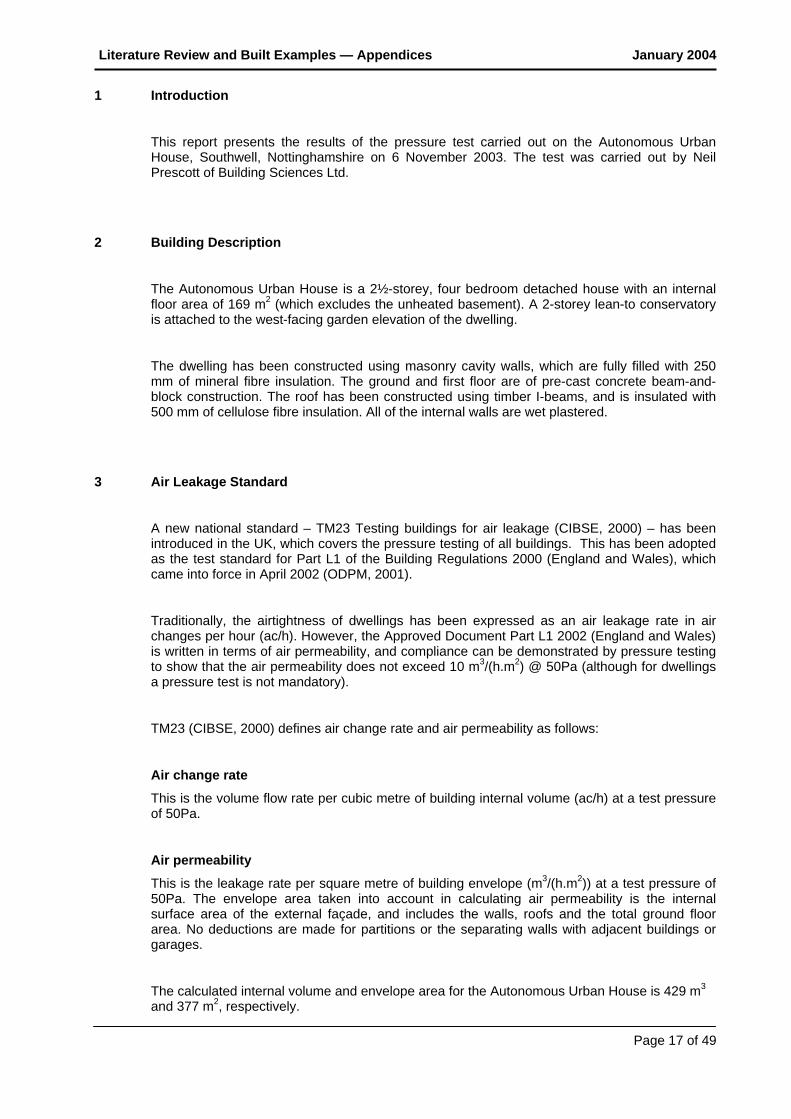
Results of Pressurisation Test of The Autonomous Urban House
Prepared by:
Airtightness of Buildings — Dr David Johnston
Towards Higher Performance Centre for the Built Environment
Project No: BD2429 Leeds Metropolitan University
Communities and Local Government Northern Terrace
Building Regulations Division Queen Square
Leeds
LS2 8AJ
Tel: 0113 812 7634
Fax: 0113 812 3190
Literature Review and Built Examples — Appendices January 2004
Page 17 of 49
1 Introduction
This report presents the results of the pressure test carried out on the Autonomous Urban House, Southwell, Nottinghamshire on 6 November 2003. The test was carried out by Neil Prescott of Building Sciences Ltd.
2 Building Description
The Autonomous Urban House is a 2½-storey, four bedroom detached house with an internal floor area of 169 m2 (which excludes the unheated basement). A 2-storey lean-to conservatory is attached to the west-facing garden elevation of the dwelling.
The dwelling has been constructed using masonry cavity walls, which are fully filled with 250 mm of mineral fibre insulation. The ground and first floor are of pre-cast concrete beam-and-block construction. The roof has been constructed using timber I-beams, and is insulated with 500 mm of cellulose fibre insulation. All of the internal walls are wet plastered.
3 Air Leakage Standard
A new national standard – TM23 Testing buildings for air leakage (CIBSE, 2000) – has been introduced in the UK, which covers the pressure testing of all buildings. This has been adopted as the test standard for Part L1 of the Building Regulations 2000 (England and Wales), which came into force in April 2002 (ODPM, 2001).
Traditionally, the airtightness of dwellings has been expressed as an air leakage rate in air changes per hour (ac/h). However, the Approved Document Part L1 2002 (England and Wales) is written in terms of air permeability, and compliance can be demonstrated by pressure testing to show that the air permeability does not exceed 10 m3/(h.m2) @ 50Pa (although for dwellings a pressure test is not mandatory).
TM23 (CIBSE, 2000) defines air change rate and air permeability as follows:
Air change rate
This is the volume flow rate per cubic metre of building internal volume (ac/h) at a test pressure of 50Pa.
Air permeability
This is the leakage rate per square metre of building envelope (m3/(h.m2)) at a test pressure of 50Pa. The envelope area taken into account in calculating air permeability is the internal surface area of the external façade, and includes the walls, roofs and the total ground floor area. No deductions are made for partitions or the separating walls with adjacent buildings or garages.
The calculated internal volume and envelope area for the Autonomous Urban House is 429 m3 and 377 m2, respectively.
Literature Review and Built Examples — Appendices January 2004
Page 18 of 49
4 Fan Pressurisation System
Fan pressurisation systems are used to quantify the air leakage of the envelope of buildings. The leakiness of the envelope is quantified by connecting a single large fan or a series of fans into an external doorway and pressurising the building whilst measuring the air flow rate required to maintain a pressure difference across the building envelope. The leakier the building, the greater the air flow required to maintain a given pressure differential (in almost all cases a differential of 50Pa is used).
The fan system used on this project consisted of an Infiltec Blower Door (Model E3). All other external doors were kept closed during the test.
Tests are normally carried out when the outside wind speed is low to minimise any wind induced pressure variations. Air volume flow rate Q (m3/s) through the fans is measured by calibrated flow grids over a suitable range of building pressure differentials ΔP(Pa). These are then corrected for internal/external temperature difference, in accordance with TM23. A best-fit power-law profile of the form Q=Cenv (ΔP)n is fitted to the data where both the coefficient Cenv and exponent n are constants.
Cenv is then corrected for the measured barometric pressure to a specified test pressure of 50Pa, providing CL.
The theoretical leakage rate at 50Pa is then calculated from the formula:
Q50=CL(ΔP)n
The air change rate can then be calculated by dividing the air volume flow rate (m3/h) through the building envelope at a pressure differential of 50Pa (Q50), by the building volume (V). The result is expressed in terms of air changes per hour (ac/h).
To compare the envelope leakage characteristics between buildings of different shapes and sizes, air permeability (Q50/ST) is used. ST is the total internal surface area (m2). The result is expressed in terms of m3 leakage per hour per m2 of envelope area (m3/(h.m2)).
5 Test Procedure
The mean internal and external temperatures were measured and recorded during the tests. The temperature values recorded were used to standardise the air flow rate through the fan systems to commonly agreed conditions. A further parameter measured was wind speed. If the measured wind speed had been too high (i.e. > 3 m/s) the test would not have been carried out.
The test procedure consisted of pressurising the dwelling to approximately 50Pa then taking a set of measurements of the building pressure differential and flow rate through the fans. The fan speeds were then reduced in several steps and the readings repeated at each of the speed settings. The dwelling was then depressurised, and the test procedure repeated. The result is two sets of measurements; one for pressurisation and one for depressurisation.
Literature Review and Built Examples — Appendices January 2004
Page 19 of 49
The following temporary seals were in place at the time of the tests:
• The through-the-wall balanced MVHR systems in the bathrooms and the kitchen were sealed using duct tape.
In addition, all of the trickle vents were adjusted to the closed position.
6 Results
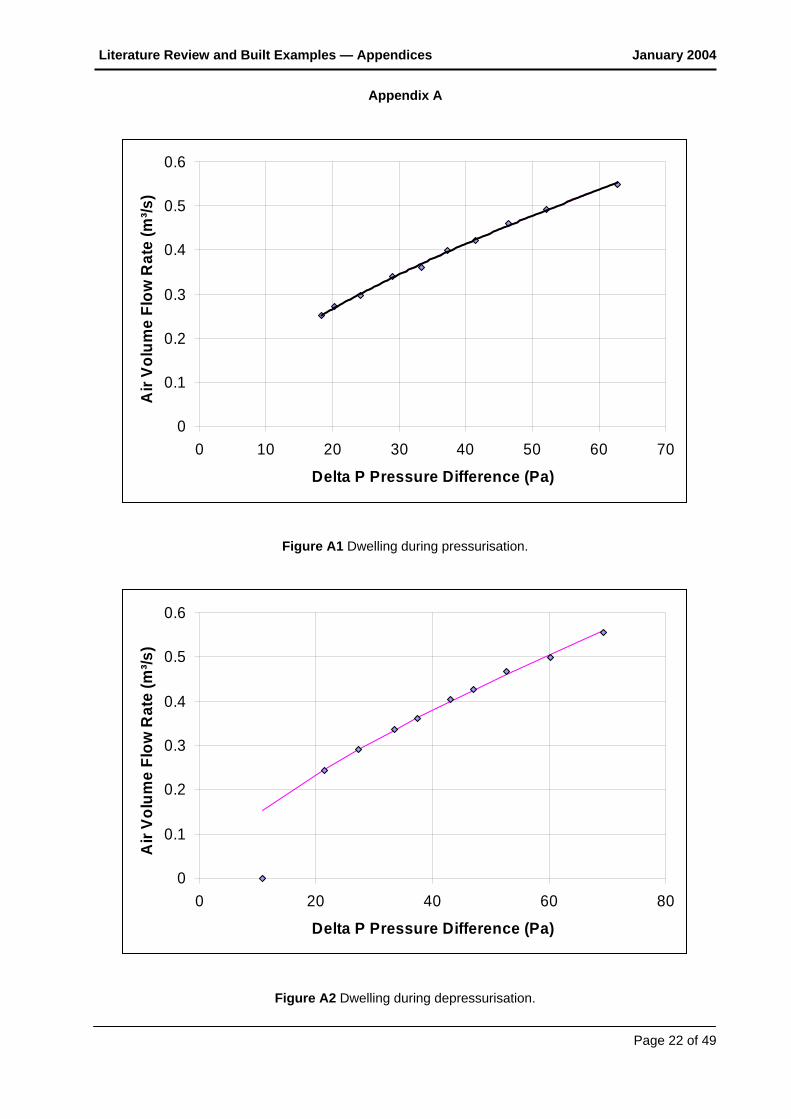
Each set of measurements of pressure difference and air volume flow rate was averaged and a best-fit power-law profile of the form Q= Cenv (ΔP)n was fitted to the data. The graphs showing the test results are included in Appendix A.
Air change rate
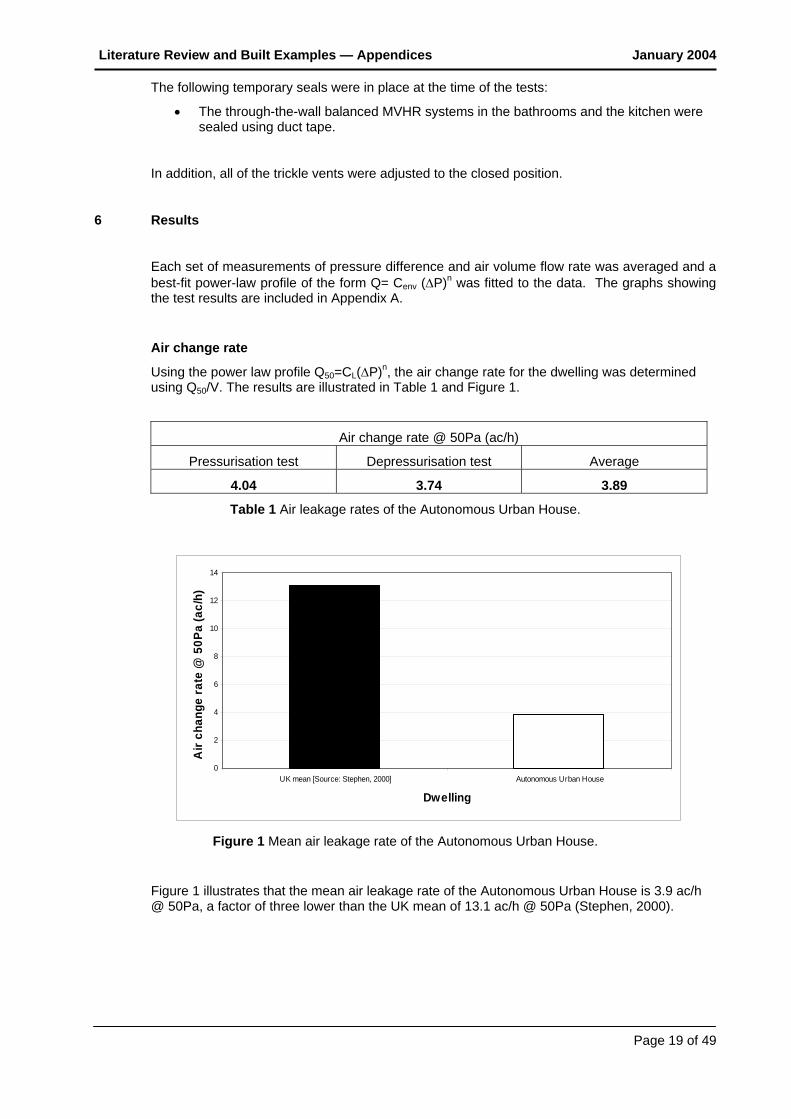
Using the power law profile Q50=CL(ΔP)n, the air change rate for the dwelling was determined using Q50/V. The results are illustrated in Table 1 and Figure 1.
Air change rate @ 50Pa (ac/h)
Pressurisation test Depressurisation test Average
4.04 3.74 3.89
Table 1 Air leakage rates of the Autonomous Urban House.
0
2
4
6
8
10
12
14
UK mean [Source: Stephen, 2000] Autonomous Urban House
Dwelling
Air
chan
ge ra
te @
50P
a (a
c/h)
Figure 1 Mean air leakage rate of the Autonomous Urban House.
Figure 1 illustrates that the mean air leakage rate of the Autonomous Urban House is 3.9 ac/h @ 50Pa, a factor of three lower than the UK mean of 13.1 ac/h @ 50Pa (Stephen, 2000).
Literature Review and Built Examples — Appendices January 2004
Page 20 of 49
Air permeability
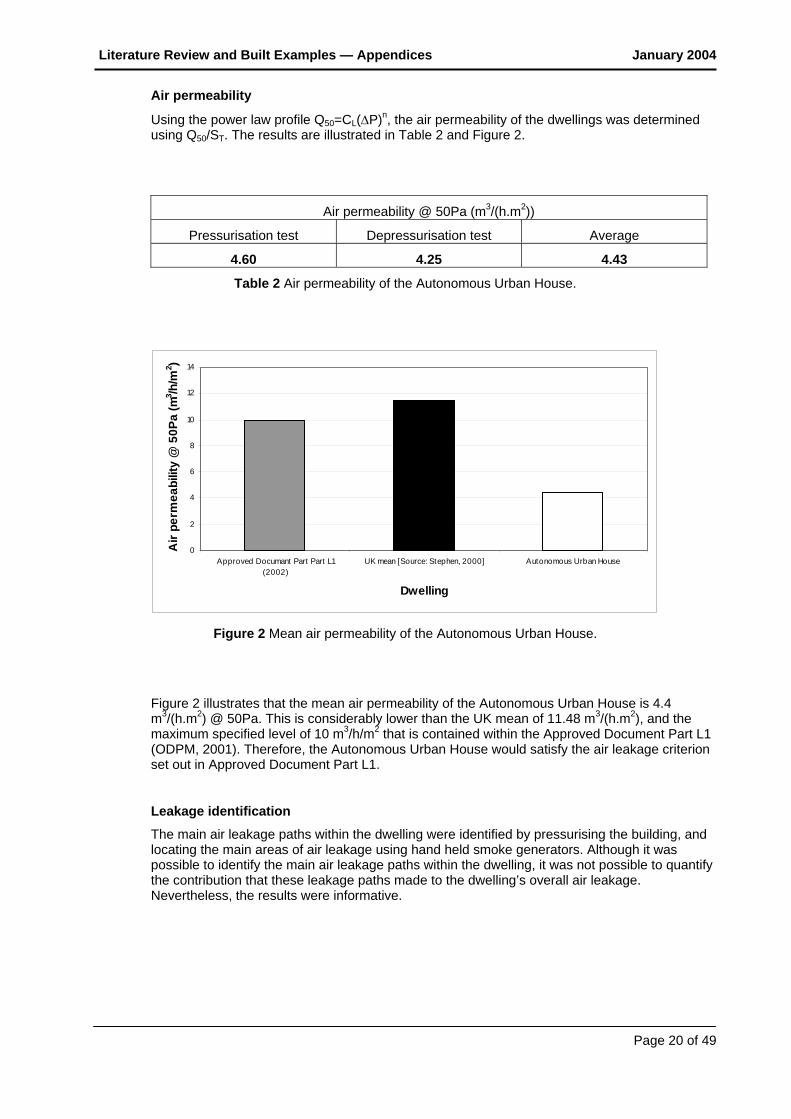
Using the power law profile Q50=CL(ΔP)n, the air permeability of the dwellings was determined using Q50/ST. The results are illustrated in Table 2 and Figure 2.
Air permeability @ 50Pa (m3/(h.m2))
Pressurisation test Depressurisation test Average
4.60 4.25 4.43
Table 2 Air permeability of the Autonomous Urban House.
0
2
4
6
8
10
12
14
Approved Documant Part Part L1(2002)
UK mean [Source: Stephen, 2000] Autonomous Urban House
Dwelling
Air
perm
eabi
lity
@ 5
0Pa
(m3 /h
/m2 )
6
Figure 2 Mean air permeability of the Autonomous Urban House.
Figure 2 illustrates that the mean air permeability of the Autonomous Urban House is 4.4 m3/(h.m2) @ 50Pa. This is considerably lower than the UK mean of 11.48 m3/(h.m2), and the maximum specified level of 10 m3/h/m2 that is contained within the Approved Document Part L1 (ODPM, 2001). Therefore, the Autonomous Urban House would satisfy the air leakage criterion set out in Approved Document Part L1.
Leakage identification
The main air leakage paths within the dwelling were identified by pressurising the building, and locating the main areas of air leakage using hand held smoke generators. Although it was possible to identify the main air leakage paths within the dwelling, it was not possible to quantify the contribution that these leakage paths made to the dwelling’s overall air leakage. Nevertheless, the results were informative.
Literature Review and Built Examples — Appendices January 2004
Page 21 of 49
The main air leakage paths observed were as follows:
• Around trickle ventilators.
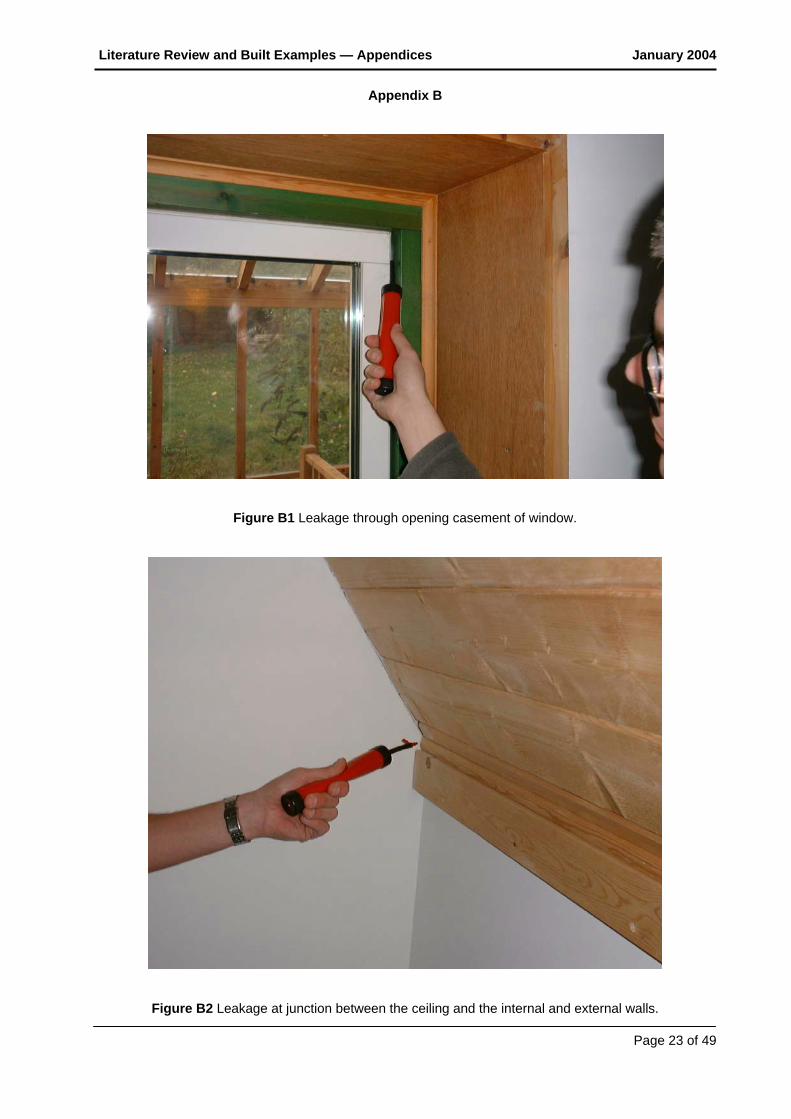
• At the opening casements of the windows (see Figure B1).
• At the junction between the ceiling and the internal and external walls (see Figure B2).
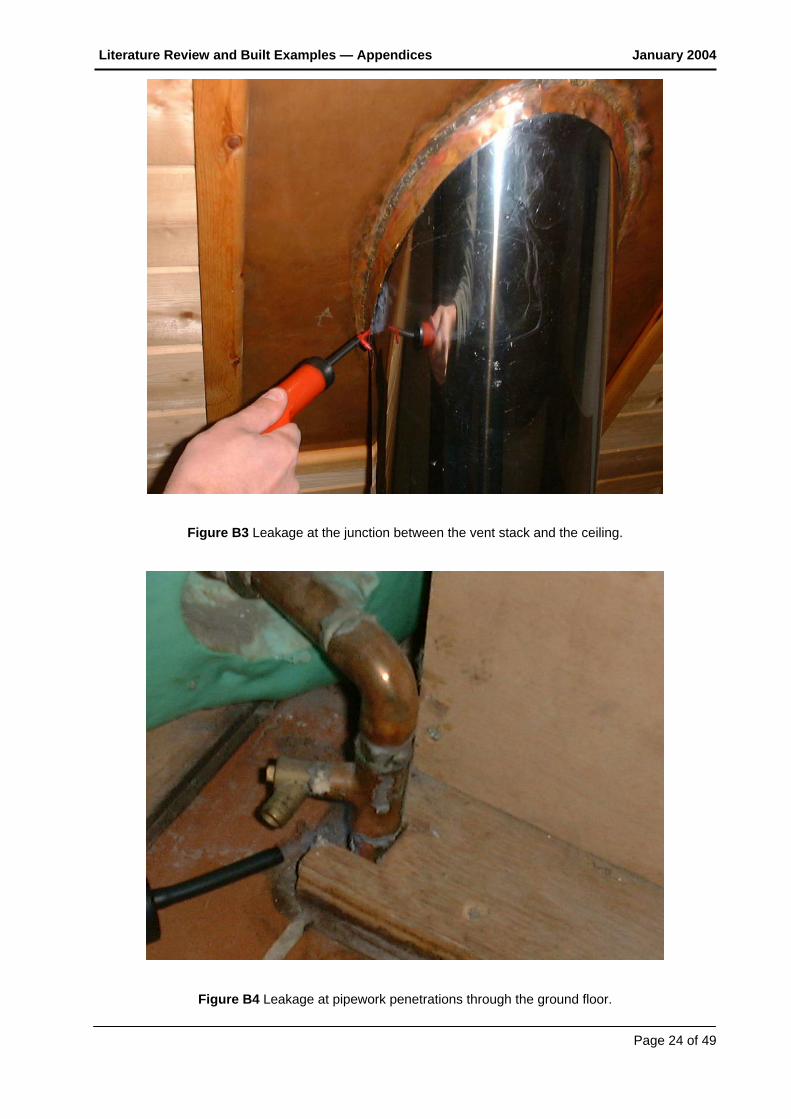
• Where the vent stack for the composting toilet penetrates the ceiling (see Figure B3).
• At pipework penetrations through the ground floor (see Figure B4).
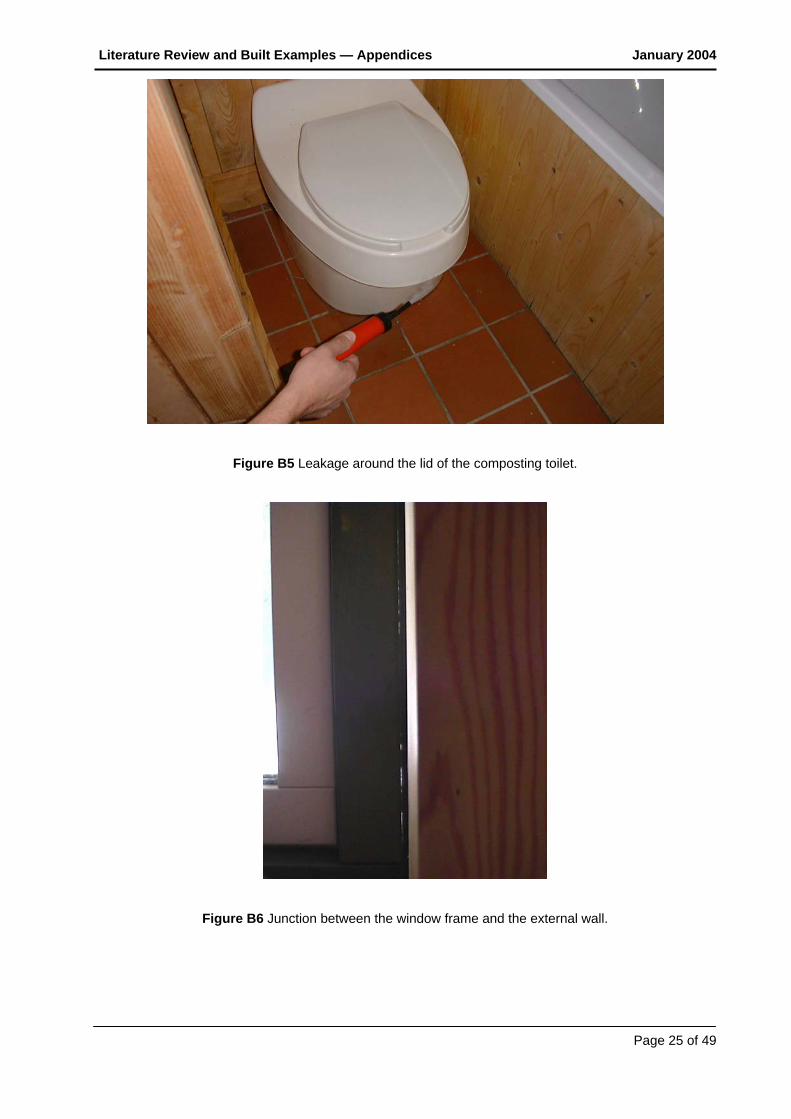
• Around the lid of the composting toilet (see Figure B5).
• In one instance, at the junction between the window frame and the external wall (see Figure B6).
References
CIBSE (2000) Testing Buildings for Air Leakage: CIBSE Technical Memoranda TM23: 2000. London, The Chartered Institute of Building Services Engineers.
ODPM (2001) The Building Regulations 2000 Approved Document Part L1: Conservation of Fuel and Power in Dwellings. 2002 Edition. Office of the Deputy Prime Minister, London, HMSO.
STEPHEN, R. (2000) Airtightness in UK Dwellings. BRE Information Paper IP 1/00, January 2000. Garston, Watford, Building Research Establishment.
Report Status
The information contained within this report has been produced for the purpose of a research project undertaken by Leeds Metropolitan University for Communities and Local Government. A copy of this report has been provided to the owners of the Autonomous Urban House for their own use. The information in this report may be used in material published by the owners of the Autonomous Urban House with appropriate acknowledgement and reference.
Disclaimer
Whilst all reasonable care and attention has been taken in compiling this report, the author and Building Sciences Ltd do not accept any responsibility or liability for any statements contained within it that may be used or relied upon by any other party.
Literature Review and Built Examples — Appendices January 2004
Page 22 of 49
Appendix A
0
0.1
0.2
0.3
0.4
0.5
0.6
0 10 20 30 40 50 60 70
Delta P Pressure Difference (Pa)
Air
Volu
me
Flow
Rat
e (m
³/s)
Figure A1 Dwelling during pressurisation.
0
0.1
0.2
0.3
0.4
0.5
0.6
0 20 40 60 80
Delta P Pressure Difference (Pa)
Air
Volu
me
Flow
Rat
e (m
³/s)
Figure A2 Dwelling during depressurisation.
Literature Review and Built Examples — Appendices January 2004
Page 23 of 49
Appendix B
Figure B1 Leakage through opening casement of window.
Figure B2 Leakage at junction between the ceiling and the internal and external walls.
Literature Review and Built Examples — Appendices January 2004
Page 24 of 49
Figure B3 Leakage at the junction between the vent stack and the ceiling.
Figure B4 Leakage at pipework penetrations through the ground floor.
Literature Review and Built Examples — Appendices January 2004
Page 25 of 49
Figure B5 Leakage around the lid of the composting toilet.
Figure B6 Junction between the window frame and the external wall.
Literature Review and Built Examples — Appendices January 2004
Page 26 of 49
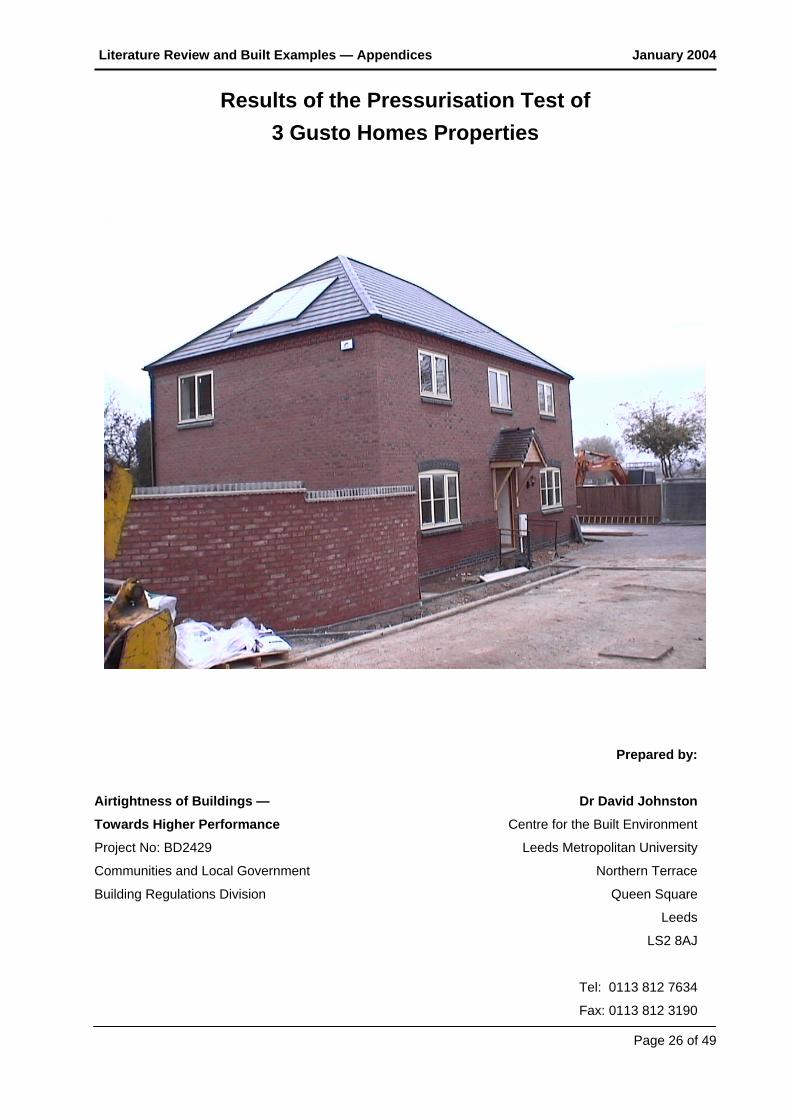
Results of the Pressurisation Test of 3 Gusto Homes Properties
Prepared by:
Airtightness of Buildings — Dr David Johnston
Towards Higher Performance Centre for the Built Environment
Project No: BD2429 Leeds Metropolitan University
Communities and Local Government Northern Terrace
Building Regulations Division Queen Square
Leeds
LS2 8AJ
Tel: 0113 812 7634
Fax: 0113 812 3190
Literature Review and Built Examples — Appendices January 2004
Page 27 of 49
1 Introduction
This report presents the results of the pressure tests carried out on the Gusto Homes Bee Field and Millennium Green sites, on 6 November 2003. The tests were carried out by Neil Prescott of Building Sciences Ltd.
2 Building Description
In total, three Gusto Homes dwellings were pressure tested, two at the Bee Field site (Plots A and B) and one at the Millennium Green site (Plot C). The dwellings at the Bee Field site were 2-storey, 4/5 bedroom detached properties with an internal floor area of 178 m2 (Plot A Saturn house type) and 185 m2 (Plot B Atlas house type). The Millennium Green dwelling was a 2-storey, 2 bedroom terraced property with an internal floor area of 67 m2.
All of the dwellings had been constructed using masonry cavity external walls, which are fully filled with 150 mm of DriTherm insulation and are wet plastered. The ground floors are of pre-cast beam-and-block construction, whilst the upper floors have been constructed using timber I-beams. The roof of Plot B has been constructed using trussed rafters, whilst timber I-beams have been used to construct the room in the roof in Plots A and C. All of the roofs are insulated with 300 mm of cellulose fibre.
3 Air Leakage Standard
A new national standard – TM23 Testing buildings for air leakage (CIBSE, 2000) – has been introduced in the UK, which covers the pressure testing of all buildings. This has been adopted as the test standard for Part L1 of the Building Regulations 2000 (England and Wales), which came into force in April 2002 (ODPM, 2001).
Traditionally, the airtightness of dwellings has been expressed as an air leakage rate in air changes per hour (ac/h). However, the Approved Document Part L1 2002 (England and Wales) is written in terms of air permeability, and compliance can be demonstrated by pressure testing to show that the air permeability does not exceed 10 m3/(h.m2) @ 50Pa (although for dwellings a pressure test is not mandatory).
TM23 (CIBSE, 2000) defines air change rate and air permeability as follows:
Air change rate
This is the volume flow rate per cubic metre of building internal volume (ac/h) at a test pressure of 50Pa.
Air permeability
This is the leakage rate per square metre of building envelope (m3/(h.m2)) at a test pressure of 50Pa. The envelope area taken into account in calculating air permeability is the internal surface area of the external façade, and includes the walls, roofs and the total ground floor area. No deductions are made for partitions or the separating walls with adjacent buildings or garages.
Literature Review and Built Examples — Appendices January 2004
Page 28 of 49
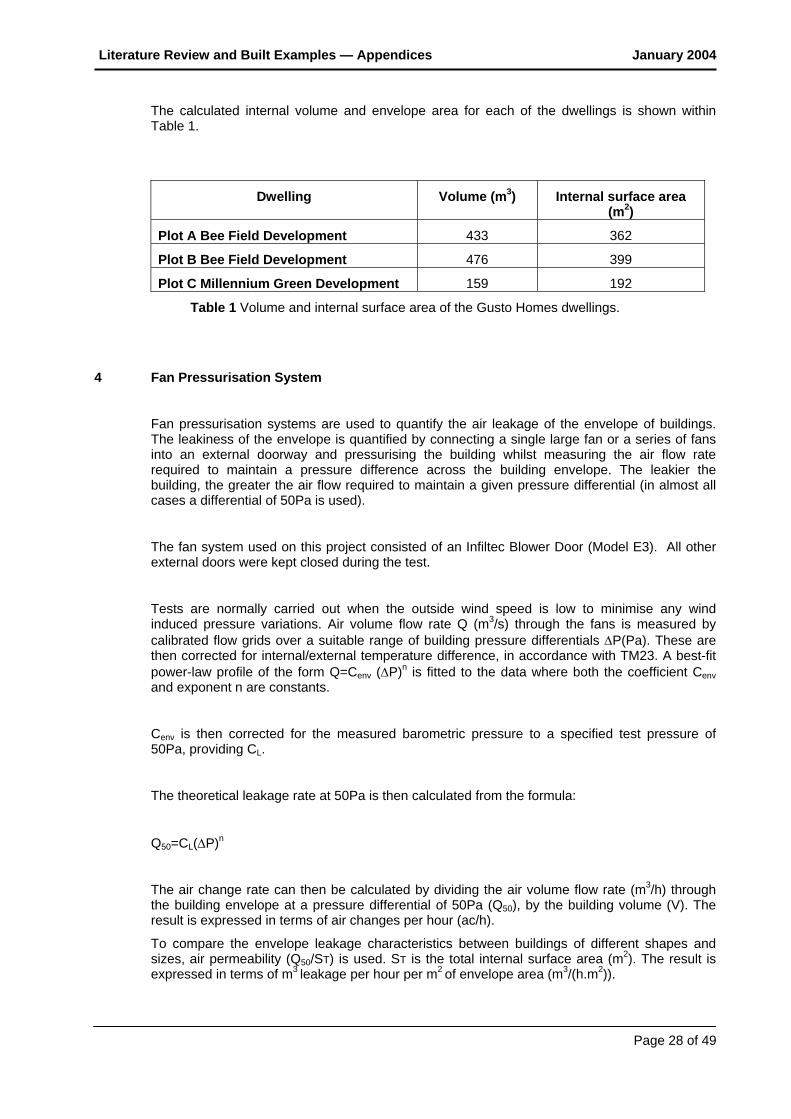
The calculated internal volume and envelope area for each of the dwellings is shown within Table 1.
Dwelling Volume (m3) Internal surface area (m2)
Plot A Bee Field Development 433 362
Plot B Bee Field Development 476 399
Plot C Millennium Green Development 159 192
Table 1 Volume and internal surface area of the Gusto Homes dwellings.
4 Fan Pressurisation System
Fan pressurisation systems are used to quantify the air leakage of the envelope of buildings. The leakiness of the envelope is quantified by connecting a single large fan or a series of fans into an external doorway and pressurising the building whilst measuring the air flow rate required to maintain a pressure difference across the building envelope. The leakier the building, the greater the air flow required to maintain a given pressure differential (in almost all cases a differential of 50Pa is used).
The fan system used on this project consisted of an Infiltec Blower Door (Model E3). All other external doors were kept closed during the test.
Tests are normally carried out when the outside wind speed is low to minimise any wind induced pressure variations. Air volume flow rate Q (m3/s) through the fans is measured by calibrated flow grids over a suitable range of building pressure differentials ΔP(Pa). These are then corrected for internal/external temperature difference, in accordance with TM23. A best-fit power-law profile of the form Q=Cenv (ΔP)n is fitted to the data where both the coefficient Cenv and exponent n are constants.
Cenv is then corrected for the measured barometric pressure to a specified test pressure of 50Pa, providing CL.
The theoretical leakage rate at 50Pa is then calculated from the formula:
Q50=CL(ΔP)n
The air change rate can then be calculated by dividing the air volume flow rate (m3/h) through the building envelope at a pressure differential of 50Pa (Q50), by the building volume (V). The result is expressed in terms of air changes per hour (ac/h).
To compare the envelope leakage characteristics between buildings of different shapes and sizes, air permeability (Q50/ST) is used. ST is the total internal surface area (m2). The result is expressed in terms of m3 leakage per hour per m2 of envelope area (m3/(h.m2)).
Literature Review and Built Examples — Appendices January 2004
Page 29 of 49
5 Test Procedure
The mean internal and external temperatures were measured and recorded during the tests. The temperature values recorded were used to standardise the air flow rate through the fan systems to commonly agreed conditions. A further parameter measured was wind speed. If the measured wind speed had been too high (i.e. > 3 m/s) the test would not have been carried out.
The test procedure consisted of pressurising each dwelling to approximately 50Pa then taking a set of measurements of the building pressure differential and flow rate through the fans. The fan speeds were then reduced in several steps and the readings repeated at each of the speed settings. Each dwelling was then depressurised, and the test procedure repeated. The result is two sets of measurements; one for pressurisation and one for depressurisation.
The following temporary seals were in place at the time of the tests:
• The supply and extract ducts of the MVHR system were sealed using duct tape.
In addition, all of the trickle vents were adjusted to the closed position.
6 Results
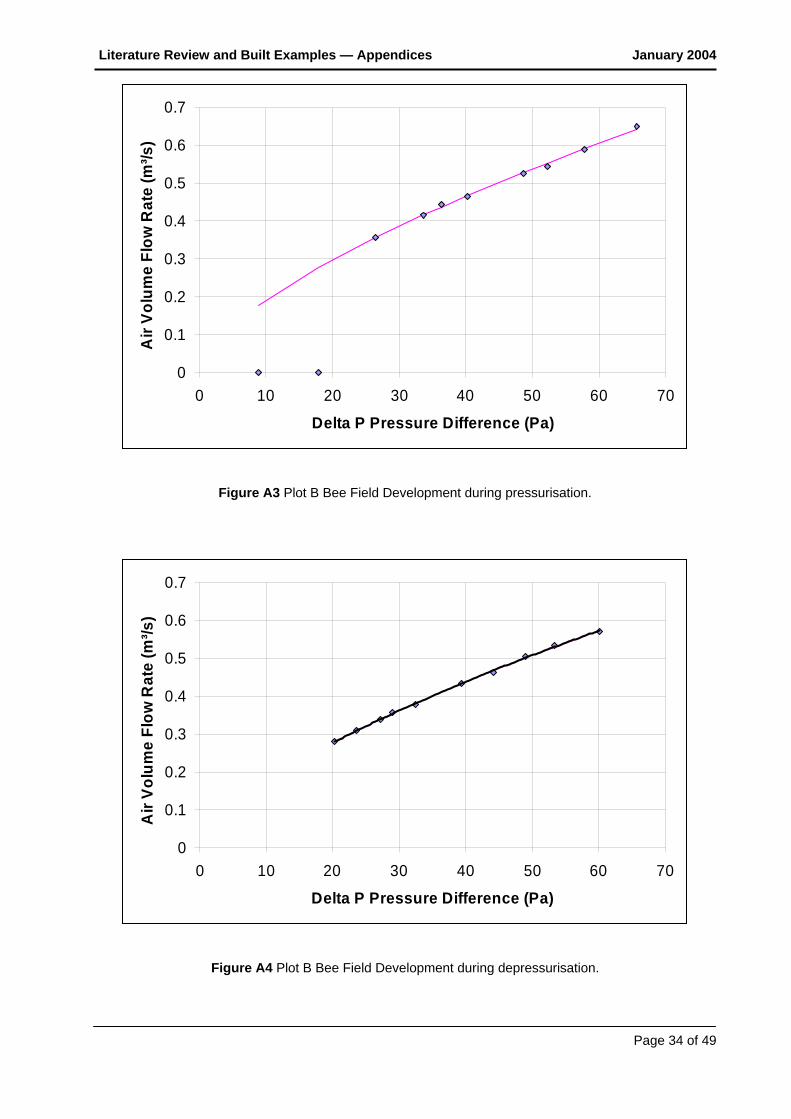
Each set of measurements of pressure difference and air volume flow rate was averaged and a best-fit power-law profile of the form Q= Cenv (ΔP)n was fitted to the data. The graphs showing the test results are included in Appendix A.
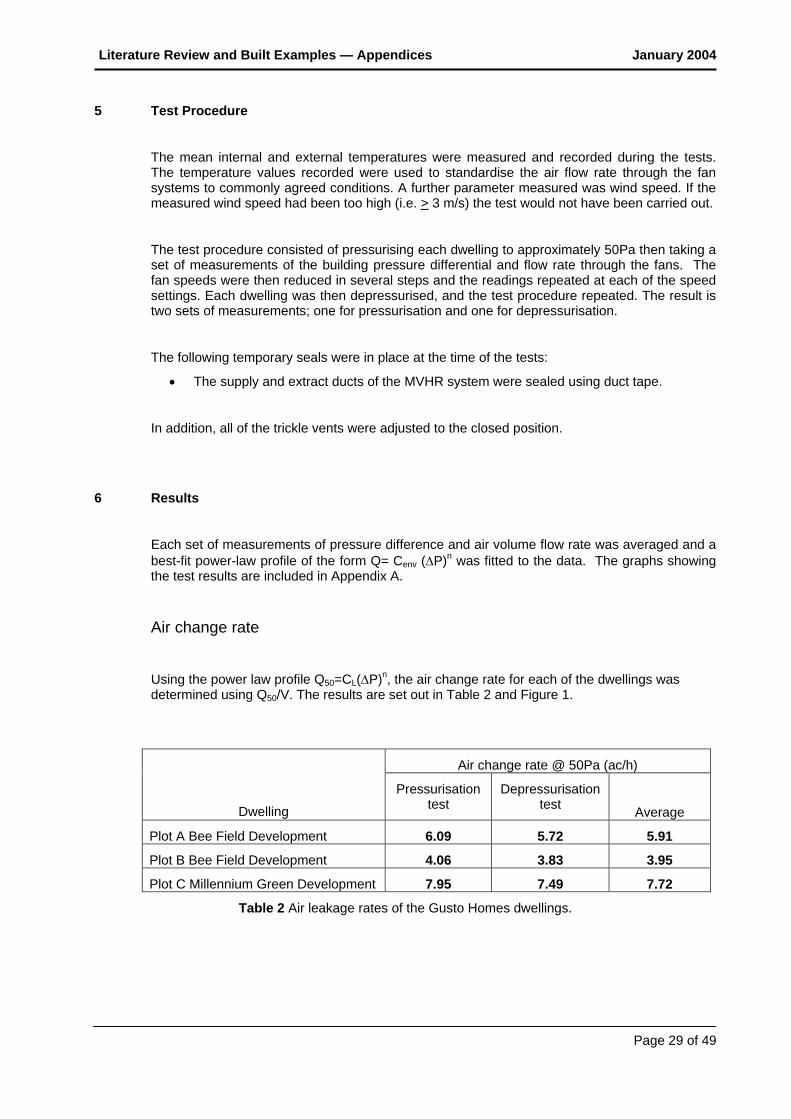
Air change rate Using the power law profile Q50=CL(ΔP)n, the air change rate for each of the dwellings was determined using Q50/V. The results are set out in Table 2 and Figure 1.
Air change rate @ 50Pa (ac/h)
Dwelling
Pressurisation test
Depressurisation test
Average
Plot A Bee Field Development 6.09 5.72 5.91
Plot B Bee Field Development 4.06 3.83 3.95
Plot C Millennium Green Development 7.95 7.49 7.72
Table 2 Air leakage rates of the Gusto Homes dwellings.
Literature Review and Built Examples — Appendices January 2004
Page 30 of 49
0
2
4
6
8
10
12
14
UK mean [Source: Stephen,2000]
Plot A Bee Field Plot B Bee Field Plot C M illenium Green
Dwelling
Air
chan
ge ra
te @
50P
a (a
c/h)
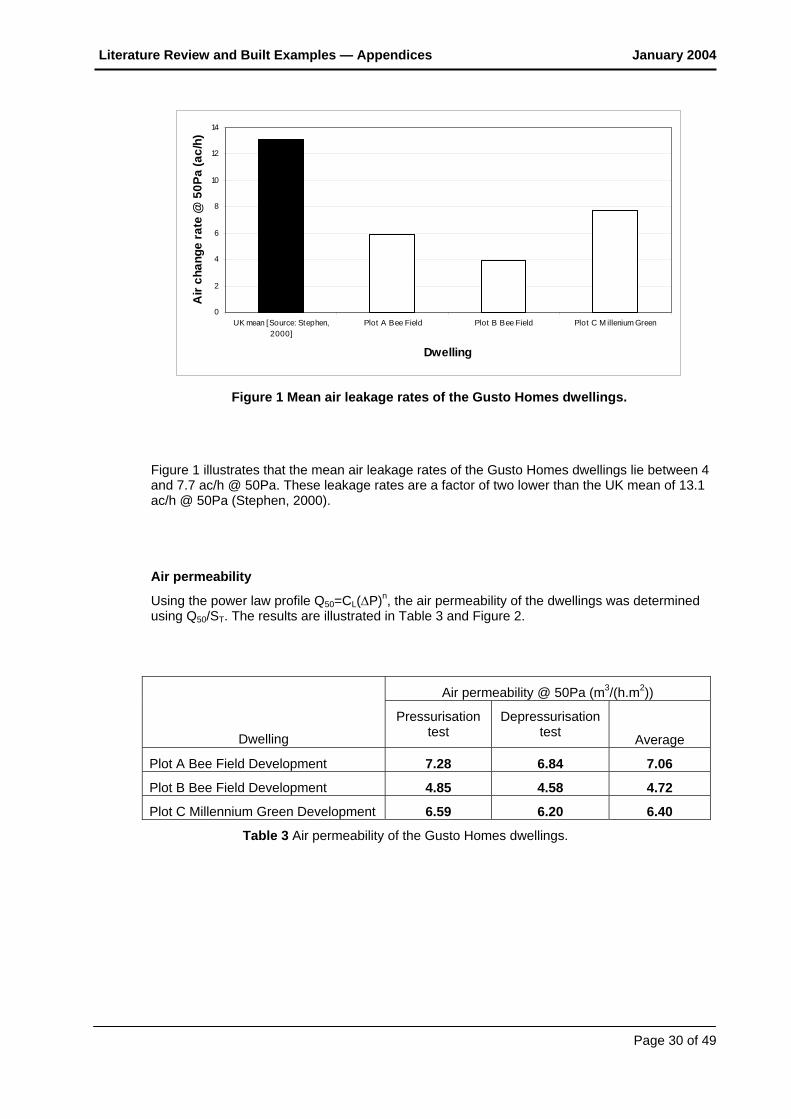
Figure 1 Mean air leakage rates of the Gusto Homes dwellings.
Figure 1 illustrates that the mean air leakage rates of the Gusto Homes dwellings lie between 4 and 7.7 ac/h @ 50Pa. These leakage rates are a factor of two lower than the UK mean of 13.1 ac/h @ 50Pa (Stephen, 2000).
Air permeability
Using the power law profile Q50=CL(ΔP)n, the air permeability of the dwellings was determined using Q50/ST. The results are illustrated in Table 3 and Figure 2.
Air permeability @ 50Pa (m3/(h.m2))
Dwelling
Pressurisation test
Depressurisation test
Average
Plot A Bee Field Development 7.28 6.84 7.06
Plot B Bee Field Development 4.85 4.58 4.72
Plot C Millennium Green Development 6.59 6.20 6.40
Table 3 Air permeability of the Gusto Homes dwellings.
Literature Review and Built Examples — Appendices January 2004
Page 31 of 49
0
2
4
6
8
10
12
14
Approved DocumentPart L1 (2002)
UK mean [Source:Stephen, 2000]
Plot 5 Bee Field Plot 8 Bee Field Plot 23 M illeniumGreen
Dwelling
Air
perm
eabi
lity
@ 5
0Pa
(m3 /h
/m2 )
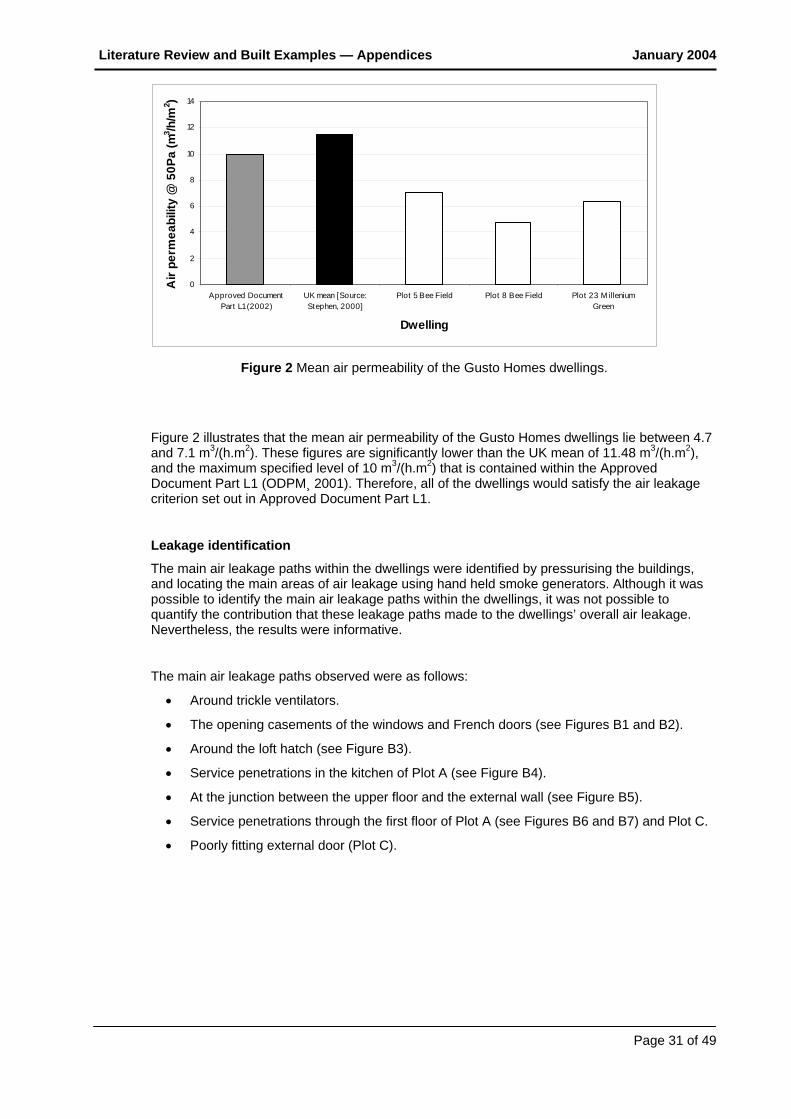
Figure 2 Mean air permeability of the Gusto Homes dwellings.
Figure 2 illustrates that the mean air permeability of the Gusto Homes dwellings lie between 4.7 and 7.1 m3/(h.m2). These figures are significantly lower than the UK mean of 11.48 m3/(h.m2), and the maximum specified level of 10 m3/(h.m2) that is contained within the Approved Document Part L1 (ODPM¸ 2001). Therefore, all of the dwellings would satisfy the air leakage criterion set out in Approved Document Part L1.
Leakage identification
The main air leakage paths within the dwellings were identified by pressurising the buildings, and locating the main areas of air leakage using hand held smoke generators. Although it was possible to identify the main air leakage paths within the dwellings, it was not possible to quantify the contribution that these leakage paths made to the dwellings’ overall air leakage. Nevertheless, the results were informative.
The main air leakage paths observed were as follows:
• Around trickle ventilators.
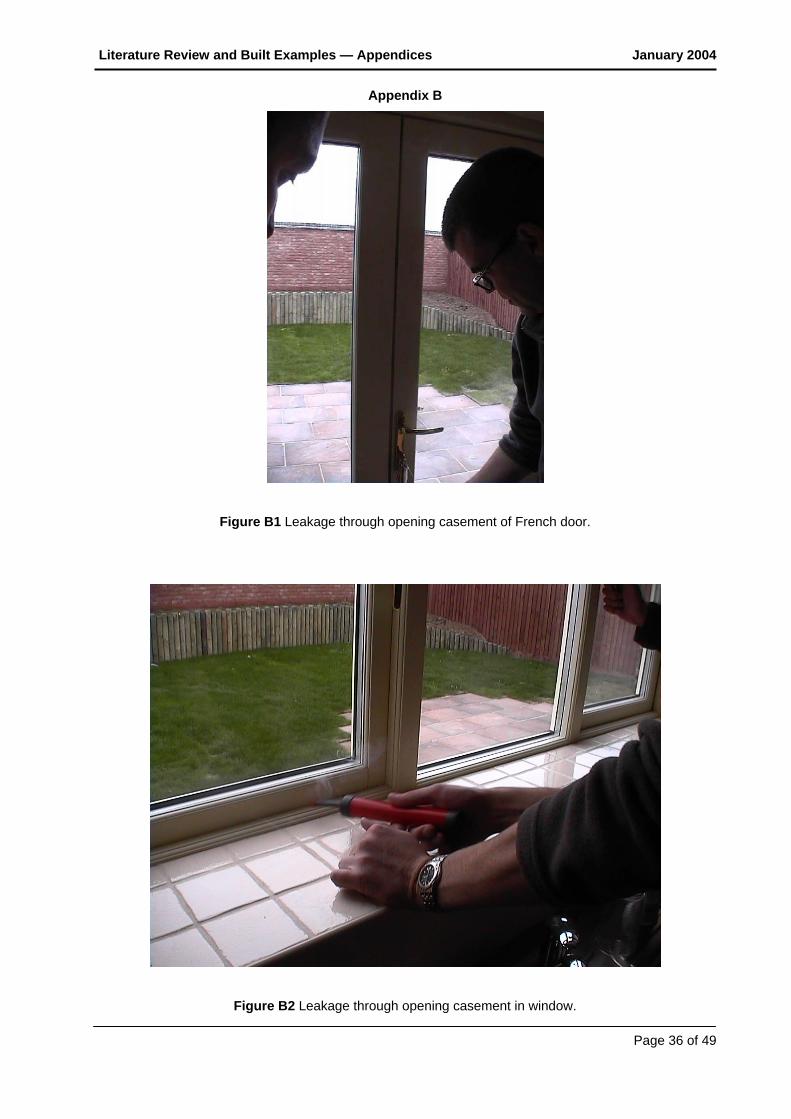
• The opening casements of the windows and French doors (see Figures B1 and B2).
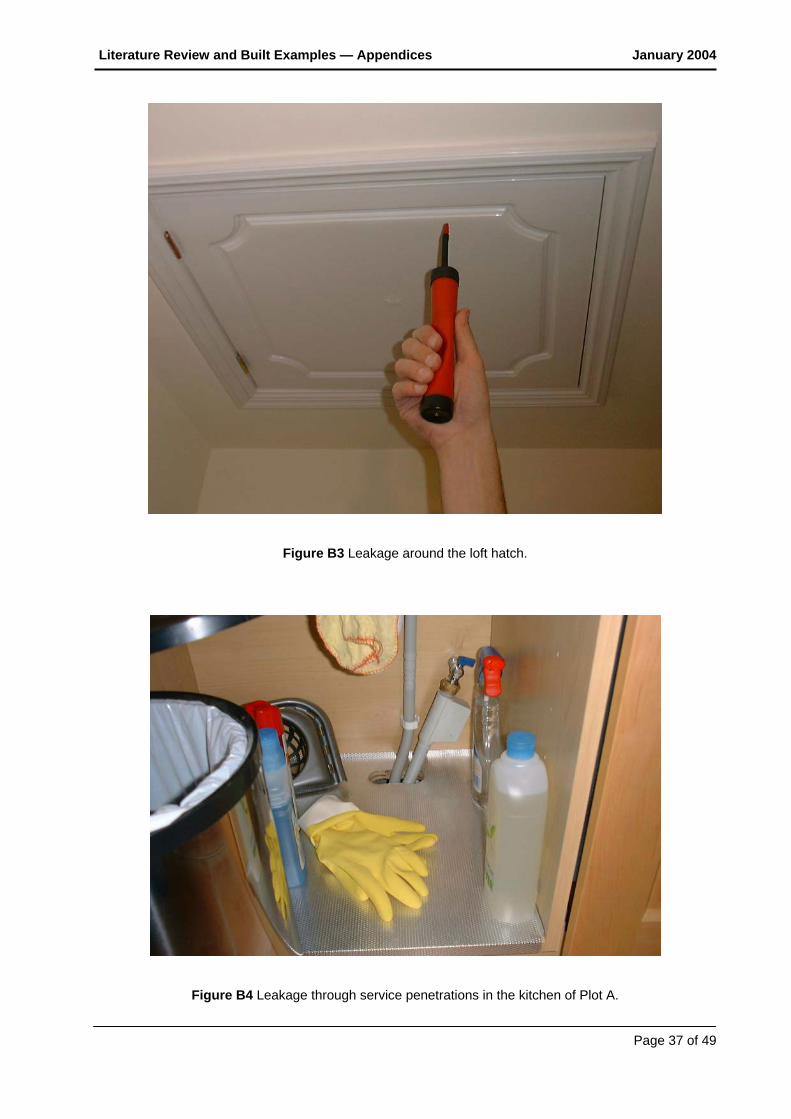
• Around the loft hatch (see Figure B3).
• Service penetrations in the kitchen of Plot A (see Figure B4).
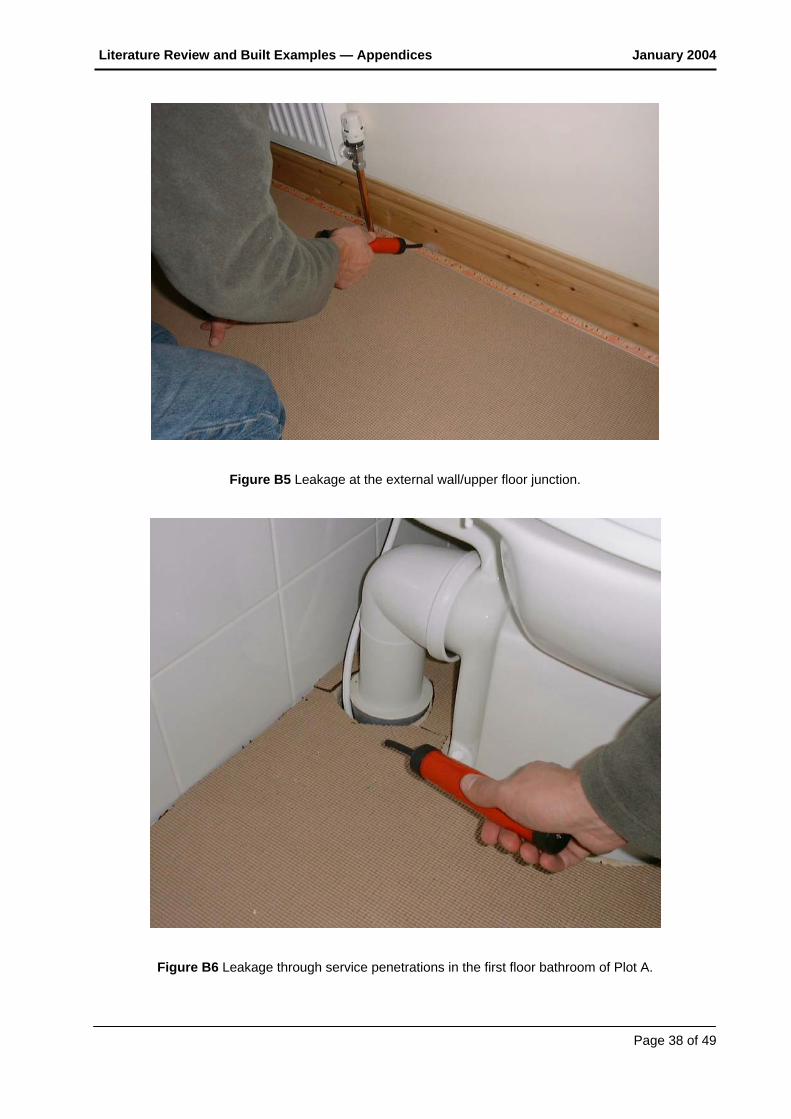
• At the junction between the upper floor and the external wall (see Figure B5).
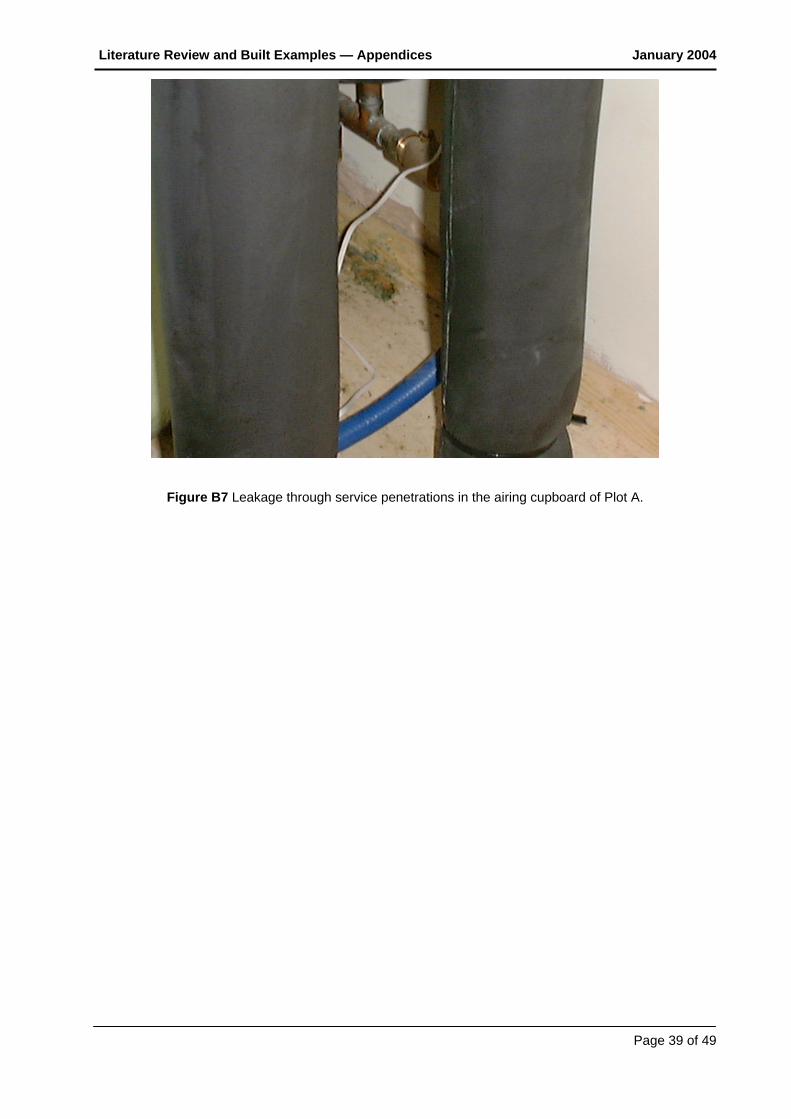
• Service penetrations through the first floor of Plot A (see Figures B6 and B7) and Plot C.
• Poorly fitting external door (Plot C).
Literature Review and Built Examples — Appendices January 2004
Page 32 of 49
References
CIBSE (2000) Testing Buildings for Air Leakage: CIBSE Technical Memoranda TM23: 2000. London, The Chartered Institute of Building Services Engineers.
ODPM (2001) The Building Regulations 2000 Approved Document Part L1: Conservation of Fuel and Power in Dwellings. 2002 Edition. Office of the Deputy Prime Minister, London, HMSO.
STEPHEN, R. (2000) Airtightness in UK Dwellings. BRE Information Paper IP 1/00, January 2000. Garston, Watford, Building Research Establishment.
Report Status
The information contained within this report has been produced for the purpose of a research project undertaken by Leeds Metropolitan University for Communities and Local Government. A copy of this report has been provided to Gusto Homes for their own use. The information in this report may be used in material published by Gusto Homes with appropriate acknowledgement and reference.
Disclaimer
Whilst all reasonable care and attention has been taken in compiling this report, the author and Building Sciences Ltd do not accept any responsibility or liability for any statements contained within it that may be used or relied upon by any other party.
Literature Review and Built Examples — Appendices January 2004
Page 33 of 49
Appendix A
0
0.1
0.2
0.3
0.4
0.5
0.6
0.7
0.8
0 10 20 30 40 50 60
Delta P Pressure Difference (Pa)
Air
Volu
me
Flow
Rat
e (m
³/s)
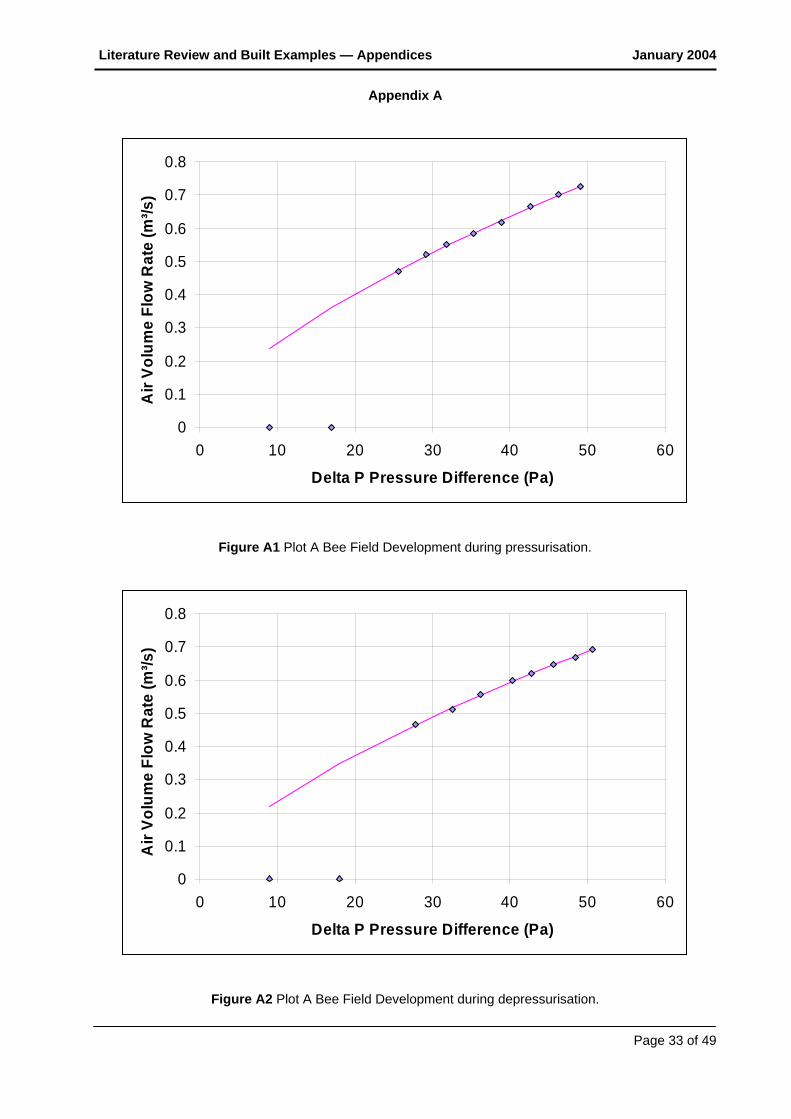
Figure A1 Plot A Bee Field Development during pressurisation.
0
0.1
0.2
0.3
0.4
0.5
0.6
0.7
0.8
0 10 20 30 40 50 60
Delta P Pressure Difference (Pa)
Air
Volu
me
Flow
Rat
e (m
³/s)
Figure A2 Plot A Bee Field Development during depressurisation.
Literature Review and Built Examples — Appendices January 2004
Page 34 of 49
0
0.1
0.2
0.3
0.4
0.5
0.6
0.7
0 10 20 30 40 50 60 70
Delta P Pressure Difference (Pa)
Air
Volu
me
Flow
Rat
e (m
³/s)
Figure A3 Plot B Bee Field Development during pressurisation.
0
0.1
0.2
0.3
0.4
0.5
0.6
0.7
0 10 20 30 40 50 60 70
Delta P Pressure Difference (Pa)
Air
Volu
me
Flow
Rat
e (m
³/s)
Figure A4 Plot B Bee Field Development during depressurisation.

Literature Review and Built Examples — Appendices January 2004
Page 35 of 49
0
0.05
0.1
0.15
0.2
0.25
0.3
0.35
0.4
0 10 20 30 40 50 60
Delta P Pressure Difference (Pa)
Air
Volu
me
Flow
Rat
e (m
³/s)
Figure A5 Plot C Millennium Green Development during pressurisation.
0
0.05
0.1
0.15
0.2
0.25
0.3
0.35
0.4
0 10 20 30 40 50 60
Delta P Pressure Difference (Pa)
Air
Volu
me
Flow
Rat
e (m
³/s)
Figure A6 Plot C Millennium Green Development during depressurisation.
Literature Review and Built Examples — Appendices January 2004
Page 36 of 49
Appendix B
Figure B1 Leakage through opening casement of French door.
Figure B2 Leakage through opening casement in window.
Literature Review and Built Examples — Appendices January 2004
Page 37 of 49
Figure B3 Leakage around the loft hatch.
Figure B4 Leakage through service penetrations in the kitchen of Plot A.
Literature Review and Built Examples — Appendices January 2004
Page 38 of 49
Figure B5 Leakage at the external wall/upper floor junction.
Figure B6 Leakage through service penetrations in the first floor bathroom of Plot A.
Literature Review and Built Examples — Appendices January 2004
Page 39 of 49
Figure B7 Leakage through service penetrations in the airing cupboard of Plot A.
Literature Review and Built Examples — Appendices January 2004
Page 40 of 49
Appendix 2
Questionnaires
Literature Review and Built Examples — Appendices January 2004
Page 41 of 49
November 2003
Airtightness of Buildings — Towards Higher
Performance
Occupant questionnaire
Literature Review and Built Examples — Appendices January 2004
Page 42 of 49
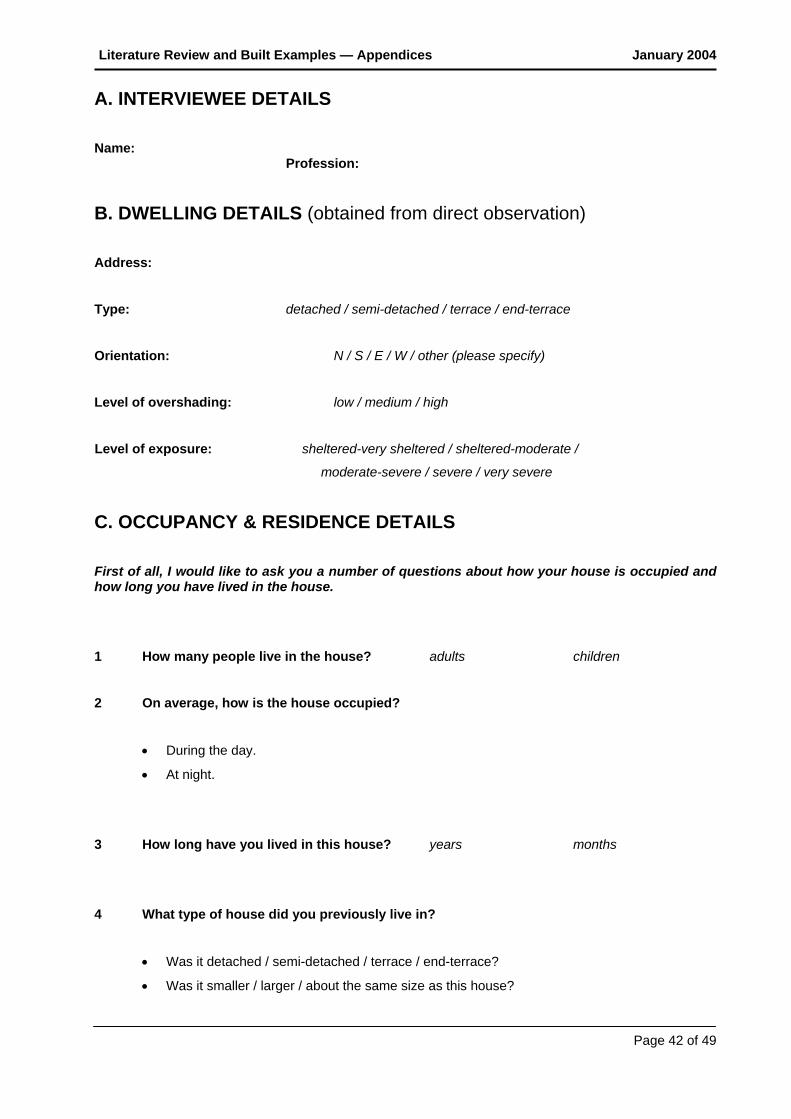
A. INTERVIEWEE DETAILS
Name: Profession:
B. DWELLING DETAILS (obtained from direct observation)
Address:
Type: detached / semi-detached / terrace / end-terrace
Orientation: N / S / E / W / other (please specify)
Level of overshading: low / medium / high
Level of exposure: sheltered-very sheltered / sheltered-moderate /
moderate-severe / severe / very severe
C. OCCUPANCY & RESIDENCE DETAILS
First of all, I would like to ask you a number of questions about how your house is occupied and how long you have lived in the house.
1 How many people live in the house? adults children
2 On average, how is the house occupied?
• During the day.
• At night.
3 How long have you lived in this house? years months
4 What type of house did you previously live in?
• Was it detached / semi-detached / terrace / end-terrace?
• Was it smaller / larger / about the same size as this house?
Literature Review and Built Examples — Appendices January 2004
Page 43 of 49
D. OCCUPANT EXPERIENCE OF THE DWELLING
I would now like to ask you some questions about your experience of living within this house.
5 Could you tell me what your experience has been of ventilation within the house?
In general:
• Has the house ever felt too hot? If so, which parts of the house and when?
• Has the house ever felt too cold? If so, which parts of the house and when?
• Has the house ever felt stuffy? If so, which parts of the house and when?
• Do smells tend to linger or do they dissipate quickly?
• Have you ever experienced any draughts? If so, which parts of the house and when?
6 Could you tell me if you have ever experienced any condensation within the dwelling?
• If yes, could you describe where, when and how often it has occurred?
• Did you take any measures to deal with the condensation?
• If yes, what measures did you undertake?
• Do you feel that these measures were effective?
7 Could you tell me what are the fuel bills like in comparison to other houses that you have lived in?
• Are they higher, lower or about the same?
• What do you think is likely to be the reason for this difference?
Literature Review and Built Examples — Appendices January 2004
Page 44 of 49
E. VENTILATION SYSTEM
Finally, I would like to ask you some questions about how you ventilate your house.
8 How is your house ventilated?
• By opening and closing the windows?
• By operating the trickle ventilators?
• By a mechanical ventilation and heat recovery system?
• By extract fans in the kitchen and bathrooms?
• By a passive stack ventilation system?
9 How do you ventilate the house in the summer / winter?
10 How much control do you feel that you have over ventilation?
• Very little control?
• A reasonable degree of control?
• A lot of control?
11 Do you feel that the ventilation system installed within the house is effective?
Yes No
• If yes, why do you feel that it is effective?
• If no, why do you feel that it is not effective?
12 Have you ever experienced any problems in ventilating the house?
Yes No
• If yes, could you describe the sorts of problems that you have encountered?
Thank you for completing this questionnaire.
Literature Review and Built Examples — Appendices January 2004
Page 45 of 49
November 2003
Airtightness of Buildings — Towards Higher
Performance
Designer and builders questionnaire
Literature Review and Built Examples — Appendices January 2004
Page 46 of 49
A. INTERVIEWEE DETAILS Name: Profession:
Company:
Number of units constructed per year:
B. DWELLING DETAILS (obtained from direct observation)
Dwelling:
Type of ground floor construction:
solid slab on ground suspended timber suspended solid
Type of intermediate floor construction:
timber joists built into wall timber joists on hangers concrete
Type of external wall construction:
concrete cavity masonry timber-frame other (please specify)
Type of roof construction:
trussed rafter timber I beam concrete other (please specify)
Internal wall finish:
plasterboard dry-lining wet plaster
Position of airtight barrier within dwelling:
Design air leakage rate:
Has the dwelling previously been pressure tested: Yes No
• If yes, what was the result?
Literature Review and Built Examples — Appendices January 2004
Page 47 of 49
C. EXPERIENCE OF DESIGNING THE DWELLING(S)
First of all, I would like to ask you a number of questions about the experienced that you gained when designing the dwelling(s).
1 How did you tackle the problem of ensuring that the dwellings(s) were airtight?
Did you undertake any special measures in terms of:
• Detailed design.
• Site supervision.
• Workmanship.
• Training.
• Education.
2 How would you rate the level of difficulty when designing the dwelling(s) for airtightness?
Was it:
• Very difficult.
• Difficult.
• Not at all difficult.
Why was it:
• Very difficult.
• Difficult.
• Not at all difficult.
3 If you had the opportunity to design the dwelling(s) again, is there anything that you would do differently, during the design phase?
Yes No
• If yes, what sort of things would you do differently?
Literature Review and Built Examples — Appendices January 2004
Page 48 of 49
D. EXPERIENCE OF CONSTRUCTING THE DWELLING(S)
I would now like to ask you some questions about the experience that you gained when designing the dwelling(s).
4 How did you ensure that airtightness was achieved on-site?
5 How would you rate the level of difficulty when constructing the dwelling(s) for airtightness?
Was it:
• Very difficult.
• Difficult.
• Not at all difficult.
Why was it:
• Very difficult.
• Difficult.
• Not at all difficult.
6 If you had the opportunity to construct the dwelling(s) again, is there anything that you would do differently, during the construction phase?
Yes No
• If yes, what sort of things would you do differently?
Literature Review and Built Examples — Appendices January 2004
Page 49 of 49
E. VENTILATION SYSTEM
Finally, I would like to ask you some questions about how the dwelling(s) are ventilated.
7 How are the dwelling(s) intended to be ventilated?
• By opening and closing the windows?
• By operating the trickle ventilators?
• By a mechanical ventilation and heat recovery system?
• By extract fans in the kitchen and bathrooms?
• By a passive stack ventilation system?
8 How are the dwelling(s) intended to be ventilated in the summer / winter?
9 How much control do you feel that the occupants have over ventilation?
• Very little control?
• A reasonable degree of control?
• A lot of control?
10 Why did you adopt this particular type of ventilation system?
Thank you for completing this questionnaire.