appendix 2b
TRANSCRIPT

Electrolysis in the EU
53
Appendices
Appendix 1
Stakeholder organisations and academics who responded to our contact requests
Industry and utilities Technology focus
Fundación Hidrógeno Aragón -
Acta AEM
AREVA PEM
Diamond Lite PEM
E.ON Gas Storage -
Haldor Topsoe SOE
Hydrogenics Alkaline & PEM
IHT Alkaline
ITM Power PEM & AEM
MyPhy Alkaline
NEL Alkaline
Proton OnSite PEM
Siemens PEM
Vattenfall Europe Innovation -
Academics Technology focus
Ulrich Stimming Technische Universität München
-
Nigel Brandon Imperial College London
SOE
Marcello Carmo Forschungszentrum Juelich
PEM
Ulrich Fischer Technische Universität Cottbus
Alkaline
Mogens Mogensen Danmarks Tekniske Universitet (DTU)
SOE
Gerda Reiter Johannes Kepler Universität Linz
-
Robert Slade Surrey University
AEM
Magnus Thomassen SINTEF Norway
PEM

Electrolysis in the EU
54
Appendix 2
List of electrolyser suppliers (not exhaustive)
The following list contains electrolyser manufacturers and a selection of key performance indicators
of their products collected ‘as is’ from technical data sheets. System boundaries for efficiency data
are not harmonised and may differ among different manufacturers. The authors take no
responsibility for the accuracy of the data, and it should be noted that the list of companies is not
exhaustive.
Co
mp
any
Co
un
try
Tech
no
logy
Pro
du
ct
Cap
acit
y (N
m3
/hr)
H2
ou
tpu
t p
ress
ure
(b
arg)
H2
pu
rity
(%
)
Ele
ctri
city
co
nsu
mp
tio
n
(kW
h/k
g)
Ele
ctri
c LH
V
eff
icie
ncy
(%
)
Acta Italy AEM EL1000 1 29 99.94 53.2 63%
AREVA France PEM Development 20 35 99.9995 55.6 60%
CETH2 France PEM E60 cluster 240 14 99.9 54.5 61%
ELT Elektrolyse Technik
Germany Alkaline Customised 330 Atmos-pheric
99.85 51 65%
Erredue s.r.l Italy Alkaline G256 170 30 99.5 59.5 56%
H2 Nitidor Italy Alkaline 200Nm3/hr 200 30 99.9 52.3 64%
H-TEC SYSTEMS Germany PEM EL30/144 3.6 29 N/A 55.6 60%
Hydrogenics Belgium, Canada
Alkaline (PEM in
dev.) HyStat60 60 10 99.998 57.8 58%
Idroenergy Italy Alkaline Model120 80 5 99.5 52.4 64%
IHT Industrie Haute Technologie
Switzerland
Alkaline Customised 760 (20)
31 N/A 51.2 65%
ITM Power UK PEM
(AEM in dev.)
HPac40 2.4 15 99.99 53.4 62%
NEL Hydrogen Norway Alkaline Customised 485 Atmos-pheric
>99.8 50 67%
McPhy Germany Alkaline 60Nm3/h container
60 10 >99.3 57.8 58%
Proton OnSite USA PEM Hogen C30 30 30 99.9998 64.5 52%
Siemens Germany PEM SILYZER200(21)
~250 N/A N/A ~60 ~55%
Teledyne Energy Systems
USA Alkaline SLM 1000 56 10 99.9998 N/A N/A
Wasserelektrolyse Hydrotechnik
Germany Alkaline EV150 225 Atmos-pheric
99.9 58.7 57%
20
Systems are currently not available on the market. IHT is planning to commercialise products with new membrane designs. 21
Delivery of first systems scheduled for beginning of 2015. For more information see www.siemens.com/hydrogen-electrolyzer

Electrolysis in the EU
55
Appendix 3
Draft call for a demonstration project
Topic SP1-JTI-FCH.2014.A.B: Topic Title
Specific challenge:
Recent analysis by the FCHJU22 has demonstrated the potential of electrolysers to play an important
role in meeting the demands for hydrogen from the transport and industrial sectors.
However, in order for electrolysers to play this role, it is important that the cost of hydrogen
produced competes with alternative sources. While some policy support may be directed at
electrolysers in terms of their “green” credentials, in the longer term they must compete in
unsubsidised markets.
The cost and performance of electrolysers is developing through time and this will help to reduce the
cost of electrolytic hydrogen. However, cost modelling suggests that in addition to the effects
achieved at the electrolyser level, competitive hydrogen will also require a combination of low cost
input electricity as well as revenues from the provision of additional services to the electricity grid.
The additional services which electrolysers may provide to the grid include:
Balancing services – where electrolysers are available for short term and rapid control by grid
operators to balance supply and demand and hence keep electrical grids stable – these
services are valued at a Transmission and increasingly at a Distribution level on grid systems
Price arbitrage – where the electrolyser is modulated to take advantage of different
electricity prices at different times of the day
Avoiding grid connection or reinforcement – where electrolysers are installed instead of new
electrical connections (either for a new generator connection, or for a constrained network
in a zone of high generation).
Other benefits – for example the ability to absorb reactive power.
The provision of these grid services by electrolysers has been demonstrated in numerous theoretical
studies and a few small scale demonstration projects. However, there have been very few
demonstrations of electrolysers operating in the actual provision of these services, and on a scale
which would be relevant to grid operators. Furthermore, little evidence has been gathered of the
way electrolysers could operate to maximise their benefits to the grid (and revenues to their
operators) across European member states and their electricity markets.
This demonstration call seeks proposals which demonstrate state of the art electrolyser technologies
providing and receiving revenue by providing these balancing services, whilst satisfying (and
receiving revenues from) an end use for the hydrogen generated.
22
Study on development of water electrolysis in the EU, FCHJU 2014 (E4tech and Element Energy)

Electrolysis in the EU
56
Scope: The overall objectives of the call include an essential element of information gathering and
dissemination, enabling the development of electrolyser systems capable of providing such services.
While electrolysers themselves have a high TRL, the complexity and immaturity of this proposed
integrated system leads to a TRL closer to 5, which could be elevated to TRL7.
The scope of the project is hence to deploy and monitor state of the art electrolyser systems,
configured to attract revenues from grid services in addition to providing hydrogen for an end user,
in at least two member states. A European consortium will develop the project, including partners
able to provide:
the necessary contractual and commercial expertise to access revenues from the grid
services
technical expertise for the design and operation of the electrolyser and associated balance
of plant
representatives of the downstream users of hydrogen generated
To maximise the impact of the study, consortia are encouraged to look to partner with already
funded demonstration projects involving electrolyser deployment, who would be able to provide
additional data and reference sites for the operation of electrolysers in these grid services modes.
Balancing services
Electrolyser system operators will demonstrate that they are able to benefit from at least
one of the grid services revenue streams discussed above. Here, the consortium will
demonstrate that they are able to obtain these revenues by entering into commercial
contracts with the grid operators or utilities who value these services
Electrolyser and balance of system requirements
State of the art electrolysers will be installed and operated for a minimum period of two
years
Electrolysers and their balance of plant will be designed to access these services whilst
meeting the need of their end users
Electrolysers systems will demonstrate a sufficient level of responsiveness to meet the
requirements of the grid services they will seek to offer (e.g. rapid modulation, rapid start, as
required by the services offered to the grid)
The size of the electrolysers demonstrated will be clearly sufficient to access revenues from
the grid services identified for each demonstration site – if appropriate, aggregation of
electrolyser demand with other electrolysers (or other demands) can be considered, if this
allows access to higher value grid services. It is anticipated that electrolysers will have a
minimum size of 1MW, but smaller systems can be considered if their ability to access grid
services can be demonstrated.
The balance of plant to store and process hydrogen from the electrolyser is within the scope
of this call
Electrolysis in the EU
57
Hydrogen end users
A plausible end use for hydrogen will be defined for each demonstration site.
Consortia will provide evidence that this demand is in place and that the electrolyser
operators will achieve meaningful revenues from selling hydrogen to this end use during the
project. All energy (transport, heat, electrical) and industrial end uses for the hydrogen are
within scope, but consortia should demonstrate that a profitable business case for the
proposed electrolyser-end use combination can be achieved in the medium term.
The end uses themselves should be identified, but will not be funded by the FCHJU under this
call. Proposers may wish to consider integrating applications under this call with other call
topics involving end uses for hydrogen.
Business models
Consortia will demonstrate an organisational structure for the ownership of the electrolyser
and the associated arrangements with grid operators/utilities and end users
In their proposals, consortia will outline the conditions under which this configuration could
lead to a profitable business case for all actors in the medium term. During the project,
consortia are expected to carry out techno-economic work to assess the long term business
case for the electrolyser, grid services, end use combination considered in the demonstration
projects.
Expected impact:
The project will lead to deployment of at least two large electrolysers, operating on a continuous
basis in an energy services mode for a minimum period of two years. Electrolysers should achieve the
following technical targets:
Electrolysers
o Capital cost for the conventional parts of the system should be below 1,000 €/kW
(Alkaline) and 1,500 €/kW (PEM)
o Electrolyser manufacturers should demonstrate a clear pathway to further reductions in
costs towards any FCHJU 2030 targets
o Electrolyser system efficiency (including system balance of plant, power electronics,
cooling, drying, purification) should be <53kWhAC/kg
o Degradation consistent with 60,000 hours life (in the targeted operating mode) before
the stack efficiency is reduced by 10% from the design efficiency
Balance of plant
o Appropriate compression, storage and dispensing equipment for the end use and
electrolyser operating mode (or modes) identified. Given that a number of end uses are
possible, the consortium should demonstrate that the balance of plant is provided at a

Electrolysis in the EU
58
cost and performance level consistent with best in class applications serving the same
end use
o Balance of plant should be designed for at least 60,000 hours of continuous operation
Controls, grid interface
o An appropriate control system will be designed to allow the full electrolyser system to
optimise its operation against the (potentially competing) requirements to satisfy the
end use and the grid services commitments
o Appropriate communications to receive signals from the grid relating to the grid services
(e.g. response signals, or frequency monitoring devices) will be installed. Where
possible, these should be based on industry standard protocols.
A monitoring program will establish data on the performance of the electrolyser systems and their
balance of plant on a suitably short timestep against these metrics, as well as providing data on the
evolution of the commercial arrangements on an appropriate timestep (e.g. half hourly if the
electrolysers are interacting with half-hourly electricity markets). An aggregated version of this
dataset will be made available to the FCHJU for their program evaluation activities.
The consortium will ensure that cross cutting studies are included in the project, in order to generate
learning from across the demonstration sites, on topics including:
Technical lessons learnt in the design and operation of these electrolyser systems
The environmental performance of the system – with a particular attention to the CO2
intensity of the hydrogen produced, which should include an understanding of the CO2
impact of the grid services mode selected
Techno-economic analysis of the performance of these systems
Projections of the value and size of the markets addressed by the project across Europe
Assessment of the contractual arrangements required to access the balancing services and
operate the electrolyser systems
Assessment of the RCS implications of these systems and any issues identified in obtaining
consents to operate the system
Recommendations for policy makers and regulators on measures required to stimulate the
market for these systems
Public-facing versions of these ‘lessons learnt’ reports should be prepared and disseminated across
Europe and potentially wider.
The consortium should include outreach and dissemination activities to share the results of the
project with European decision makers in this sector, including regulators, grid operators, utilities
and policy makers.

Electrolysis in the EU
59
Budget: Indicative total cost could approach €20 million. However, the budget should be defined by
the FCHJU in the context of the total programme
Consortium: Consortia should include the complete value chain relevant to this business case,
including: Electrolyser developers, Network operators, Electrolyser system operators, Utilities (i.e.
market participants) and Hydrogen und users. In addition, the consortia may benefit from the
inclusion of research partners to carry out cross cutting studies and national electricity system
regulators
Type of action: Innovation

Electrolysis in the EU
60
Appendix 4
KPI data and trend lines
This appendix section provides detailed data on key performance indicators (KPIs) collected during
Task 1 and the central case trend lines as well as ranges set in this project. It is worth noting that due
to the small number of actors working on AEM and SOE, fewer data are available on these
technologies than on alkaline and PEM.
System and stack size
System and stack size data are provided in electrical load at nominal capacity, as this unit is seen as
more approachable in view of integration into the electricity grid. For data sources that only provide
an output in hydrogen production per unit of time (typically Nm3/hr), the hydrogen production rate
was converted into electrical load using the nominal electrical input (typically given in kWh/Nm3 or
kWh/kg).
The collected data on system size show that alkaline electrolysers are currently the only technology
available at beyond one MW system size. However, between 2015 and 2020 PEM systems are
expected to catch up. Data points on more novel technologies like AEM and SOE are rare. AEM is
currently only available at sub 10 kW sizes and the outlook on the scale-up of system size relies on
the views of a very limited number of actors active in this technology. SOE has been demonstrated at
lab scale in the form of short stacks23, and views on system scale development are scarce, given the
large uncertainty due to the early stage of technology development. Should SOE technology mature,
system sizes comparable to or bigger than today’s alkaline systems are forecast in the long term.
23
A stack consisting of a few cells only (typically 5 to 50 stacked cells). Short stacks are often used for testing and demonstration at lab scale.
1
10
100
1,000
10,000
100,000
2010 2015 2020 2025 2030
Max
. sys
tem
siz
e [k
W]
System size (electrical capacity)
AEM (all data) SOE (all data)
PEM (all data) Alkaline (all data)

Electrolysis in the EU
61
An expected typical range of maximal system sizes offered by manufacturers of alkaline and PEM
electrolysers has been developed in consultation with stakeholders. In the Central case, it is expected
that commercial PEM systems around 2020 will be comparable to alkaline systems in terms of size.
The difference in the range of system sizes from 2020 onwards for the two chemistries is due to a
single manufacturer with a targeted system size close to 100 MW in PEM technology.
The largest PEM systems available today consist of several stacks, and some alkaline manufacturers
also combine several smaller stacks into their systems rather than designing single (multi-MW)
stacks. Stack size is another indicator that characterises the status of scale development, since the
strategies to achieve large system size differ among manufacturers. The data set on stack sizes is
considerably smaller than that for system size, simply because stack size data are often not made
public by the manufacturers.
Electrical energy input and electric efficiency (LHV)
Data on electrical energy input in kWh/kgH2 and related electrical efficiency based on the lower
heating value (LHV) of hydrogen has been collected from literature, technical data sheets and
communication with manufacturers. These values refer to a system boundary that includes losses for
AC-DC conversion, other typical balance of plant, gas purification and drying to achieve at least 99.4%
Today 2015 2020 2025 2030
Central 3,200 3,600 5,500 6,100 6,700
Range (1) 1,100 - 5,300 1,600 - 5,600 5,000 - 6,000 5,000 - 7,300 4,900 - 8,600
Central 180 2,100 5,400 5,900 6,400
Range (1) 100 - 1,200 1,300 - 10,000 1,600 - 90,000 1,800 - 90,000 2,100 - 90,000
System size
kW
Alkaline
PEM
(1) range indicates the largest systems offered for use in energy related applications. Smaller systems do exist.
0
2,000
4,000
6,000
8,000
10,000
2010 2015 2020 2025 2030
Max
. sta
ck s
ize
[kW
]
PEM stack size
PEM (all data)
Expected trend
Expected range
0
2,000
4,000
6,000
8,000
10,000
2010 2015 2020 2025 2030
Max
. sta
ck s
ize
[kW
]
Alkaline stack size
Alkaline (all data)
Expected trend (central case)
Expected range
Today 2015 2020 2025 2030
Central 2,400 2,600 2,900 3,500 4,100
Range (1) 200 - 4,500 200 - 4,900 300 - 5,500 300 - 6,700 400 - 7,800
Central 50 200 1,100 1,500 1,900
Range (1) 40 - 100 100 - 1,300 100 - 10,000 500 - 10,000 1,000 - 10,000
Stack size
kW
Alkaline
PEM
(1) range indicates the largest stacks offered for use in energy related applications. Smaller stacks do exist.
Electrolysis in the EU
62
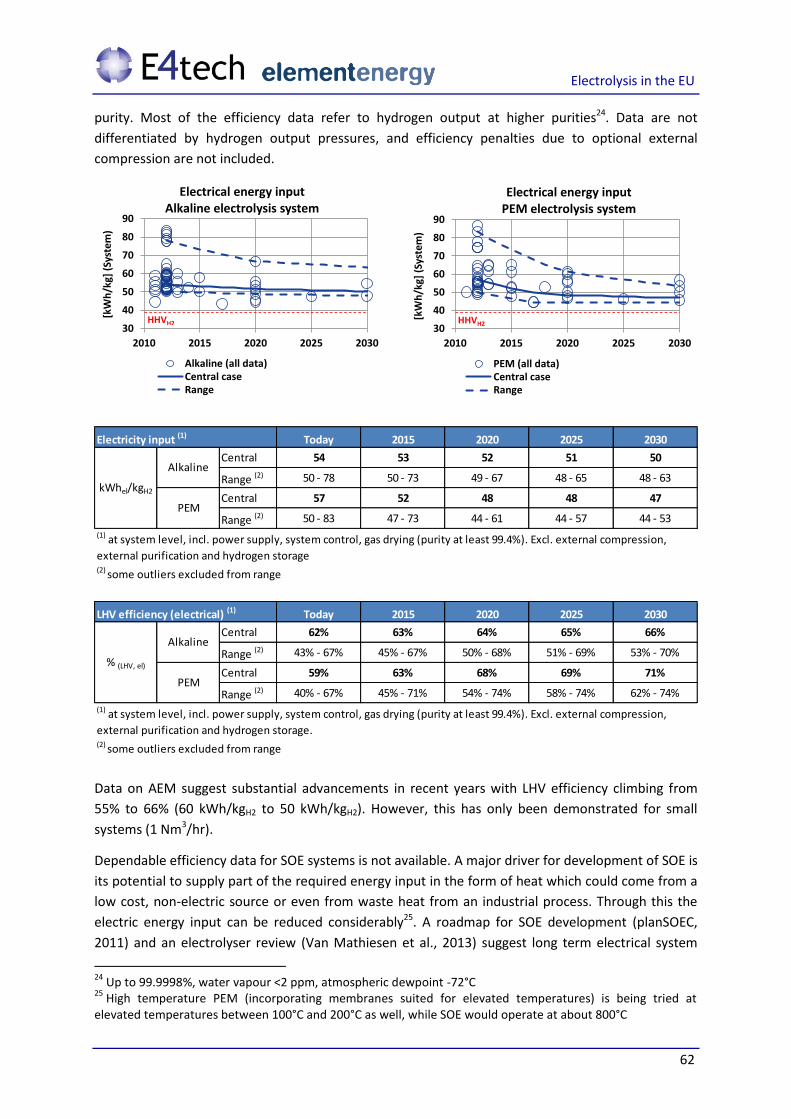
purity. Most of the efficiency data refer to hydrogen output at higher purities24. Data are not
differentiated by hydrogen output pressures, and efficiency penalties due to optional external
compression are not included.
Data on AEM suggest substantial advancements in recent years with LHV efficiency climbing from
55% to 66% (60 kWh/kgH2 to 50 kWh/kgH2). However, this has only been demonstrated for small
systems (1 Nm3/hr).
Dependable efficiency data for SOE systems is not available. A major driver for development of SOE is
its potential to supply part of the required energy input in the form of heat which could come from a
low cost, non-electric source or even from waste heat from an industrial process. Through this the
electric energy input can be reduced considerably25. A roadmap for SOE development (planSOEC,
2011) and an electrolyser review (Van Mathiesen et al., 2013) suggest long term electrical system
24
Up to 99.9998%, water vapour <2 ppm, atmospheric dewpoint -72°C 25
High temperature PEM (incorporating membranes suited for elevated temperatures) is being tried at elevated temperatures between 100°C and 200°C as well, while SOE would operate at about 800°C
30
40
50
60
70
80
90
2010 2015 2020 2025 2030
[kW
h/k
g] (
Syst
em)
Electrical energy input Alkaline electrolysis system
Alkaline (all data)Central caseRange
HHVH230
40
50
60
70
80
90
2010 2015 2020 2025 2030
[kW
h/k
g] (
Syst
em)
Electrical energy input PEM electrolysis system
PEM (all data)Central caseRange
HHVH2
Today 2015 2020 2025 2030
Central 54 53 52 51 50
Range (2) 50 - 78 50 - 73 49 - 67 48 - 65 48 - 63
Central 57 52 48 48 47
Range (2) 50 - 83 47 - 73 44 - 61 44 - 57 44 - 53
(1) at system level, incl. power supply, system control, gas drying (purity at least 99.4%). Excl. external compression,
external purification and hydrogen storage(2) some outliers excluded from range
kWhel/kgH2
Alkaline
PEM
Electricity input (1)
Today 2015 2020 2025 2030
Central 62% 63% 64% 65% 66%
Range (2) 43% - 67% 45% - 67% 50% - 68% 51% - 69% 53% - 70%
Central 59% 63% 68% 69% 71%
Range (2) 40% - 67% 45% - 71% 54% - 74% 58% - 74% 62% - 74%
LHV efficiency (electrical) (1)
% (LHV, el)
Alkaline
PEM
(1) at system level, incl. power supply, system control, gas drying (purity at least 99.4%). Excl. external compression,
external purification and hydrogen storage. (2) some outliers excluded from range

Electrolysis in the EU
63
efficiency of 75-79% based on LHV (44.5 kWh/kgH2 – 42.5 kWh/kgH2), if water at ambient
temperature is fed into the system. If the system is fed with steam at 125°C temperature, the
electrical system efficiency could reach 85-90% based on LHV (39 kWh/kgH2 – 36.5 kWh/kgH2). Actors
in SOE also emphasise the potential for co-electrolysis of both steam and CO2, producing syngas,
from which hydrocarbons such as liquid fuels can be synthesised. The scope of this study did not
include routes towards hydrocarbons that employ electrolysis. However, this route may have
advantages over an electrolysis plus methanation process, should a hydrocarbon be desired as the
final fuel.
System cost
SOE systems are currently not available, so dependable data on cost do not exist. Literature suggests
a cost at market introduction of about 2,000 €/kW. Long term cost estimates for fully mature SOE
technology are rather uncertain and vary widely from close to 300 €/kW to slightly above
1,000 €/kW.
Operational cost
Operational costs (opex) exclusive of electricity and stack replacement found in literature are
typically 3-4% of the initial capital expenditure (capex) per year, with little difference among different
chemistries. Manufacturers emphasize the fact that this number is very sensitive to location (labour
cost) and size. We therefore used an approach that relates consumables, i.e. material cost for
planned and unplanned maintenance, to the capex (1.5% of initial capex per year)26. On top of the
consumables, we add an estimated labour cost in central Europe for regular checks by the operator
26
NB this excludes the cost of stack replacements at the scheduled end of a stack lifetime, which are included separately in the model.
0
500
1,000
1,500
2,000
2,500
3,000
2010 2015 2020 2025 2030
[EUR/kW] Capital cost for Alkaline systems
Alkaline (all data)Central caseRange
0
500
1,000
1,500
2,000
2,500
3,000
2010 2015 2020 2025 2030
[EUR/kW] Capital cost for PEM systems
PEM (all data)Central caseRange
Today 2015 2020 2025 2030
Central 1,100 930 630 610 580
Range 1,000 - 1,200 760 - 1,100 370 - 900 370 - 850 370 - 800
Central 2,090 1,570 1,000 870 760
Range 1,860 - 2,320 1,200 - 1,940 700 - 1,300 480 - 1,270 250 - 1,270
System cost (1)
(1) incl. power supply, system control, gas drying (purity above 99.4%). Excl. grid connection, external compression,
external purification and hydrogen storage
Alkaline
PEM
EUR/kW

Electrolysis in the EU
64
as well as planned and unplanned maintenance works, which all depend on system scale. For the
different systems modelled in the TEA the estimated operational cost as a percentage of initial capex
is given below.
Translated into annual costs, the operational cost decreases slightly from now till 2030, as material
costs related to initial capex also reduce, as described above.
Availability
The availability of electrolyser systems in hours per year is reduced by scheduled maintenance and
unscheduled interruptions. Only very few manufacturers agreed to provide data here, as availability
is naturally dependent on where a system is installed, which applications it serves (high availability
may or may not be a crucial factor in a given application), and how it is operated (continuous or
dynamically) and serviced. Data on availability can therefore not be generalised. However, the data
points received suggest that both alkaline and PEM can achieve above 95% availability.
The limited data provided below is intended to be indicative only. Minor differences between PEM
and alkaline today should not be taken to suggest that one technology has an advantage. Rather,
these minor differences derive from the different applications in which the two chemistries are
typically operated.
Plant size Opex
[MW] [% of initial capex per year]
1 5.00%
5 2.20%
10 2.20%
20 1.85%
50 1.64%
100 1.61%
250 1.54%
1,000 1.52%
Central
Range
Central
Range
2030Today
System size
dependent
ranges
Operational cost (excl. electricity)
17-51
15-53
32-66
28-70
9-44
6-47
12-46
EUR/kW/
year
Alkaline
PEM4-54
Today 2015 2020 2025 2030
Central 8,585 8,585 8,585 8,585 8,585
Range (1) 8,585 - 8,585 8,585 - 8,585 8,585 - 8,585 8,585 - 8,585 8,585 - 8,585
Central 8,443 8,459 8,586 8,586 8,586
Range (2) 8,585 - 8,300 8,618 - 8,300 8,672 - 8,500 8,672 - 8,500 8,672 - 8,500
Availability
hours/year
Alkaline
PEM
(1) Only one alkaline manufacturer provided availability data(2) Only two PEM manufacturer provided availability data
Electrolysis in the EU
65
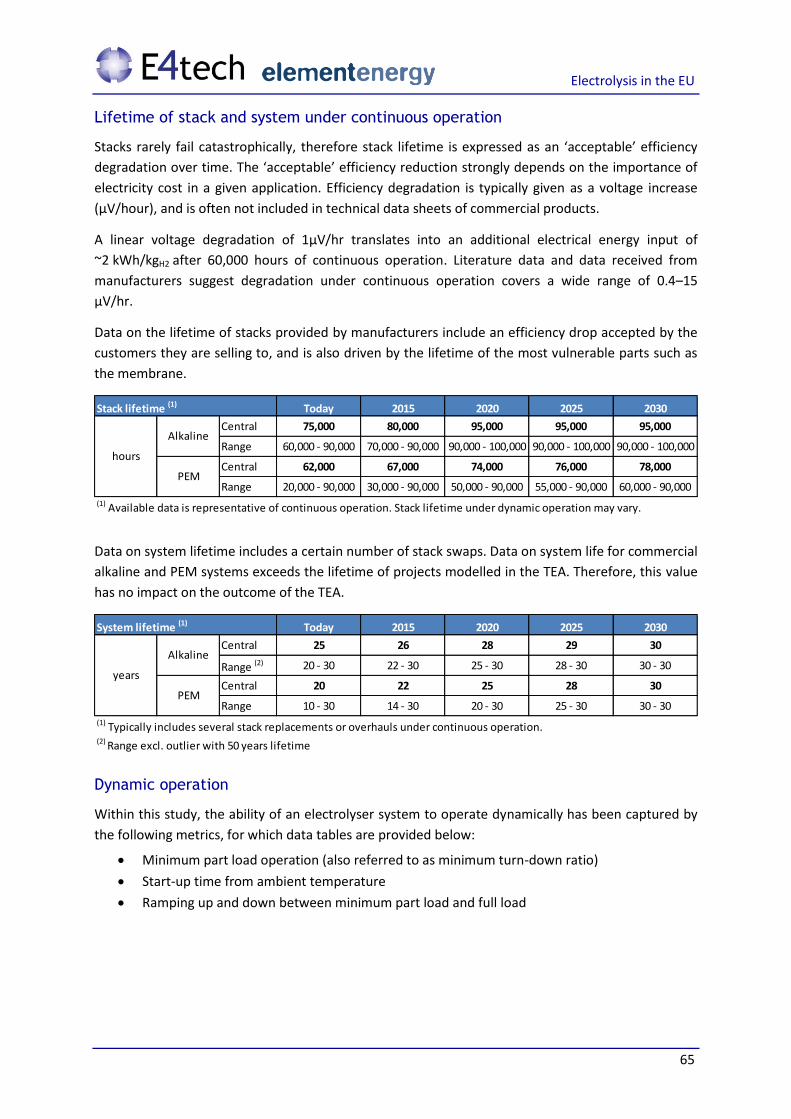
Lifetime of stack and system under continuous operation
Stacks rarely fail catastrophically, therefore stack lifetime is expressed as an ‘acceptable’ efficiency
degradation over time. The ‘acceptable’ efficiency reduction strongly depends on the importance of
electricity cost in a given application. Efficiency degradation is typically given as a voltage increase
(µV/hour), and is often not included in technical data sheets of commercial products.
A linear voltage degradation of 1µV/hr translates into an additional electrical energy input of
~2 kWh/kgH2 after 60,000 hours of continuous operation. Literature data and data received from
manufacturers suggest degradation under continuous operation covers a wide range of 0.4–15
µV/hr.
Data on the lifetime of stacks provided by manufacturers include an efficiency drop accepted by the
customers they are selling to, and is also driven by the lifetime of the most vulnerable parts such as
the membrane.
Data on system lifetime includes a certain number of stack swaps. Data on system life for commercial
alkaline and PEM systems exceeds the lifetime of projects modelled in the TEA. Therefore, this value
has no impact on the outcome of the TEA.
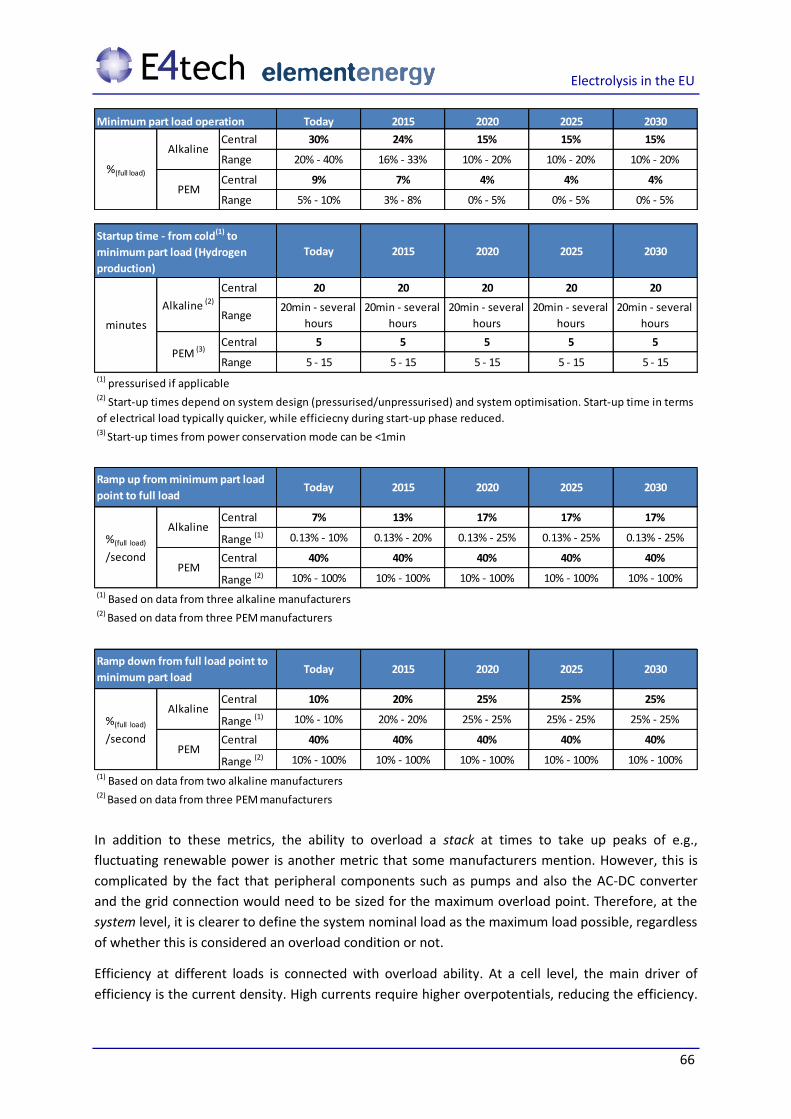
Dynamic operation
Within this study, the ability of an electrolyser system to operate dynamically has been captured by
the following metrics, for which data tables are provided below:
Minimum part load operation (also referred to as minimum turn-down ratio)
Start-up time from ambient temperature
Ramping up and down between minimum part load and full load
Today 2015 2020 2025 2030
Central 75,000 80,000 95,000 95,000 95,000
Range 60,000 - 90,000 70,000 - 90,000 90,000 - 100,000 90,000 - 100,000 90,000 - 100,000
Central 62,000 67,000 74,000 76,000 78,000
Range 20,000 - 90,000 30,000 - 90,000 50,000 - 90,000 55,000 - 90,000 60,000 - 90,000
hours
Alkaline
PEM
(1) Available data is representative of continuous operation. Stack lifetime under dynamic operation may vary.
Stack lifetime (1)
Today 2015 2020 2025 2030
Central 25 26 28 29 30
Range (2) 20 - 30 22 - 30 25 - 30 28 - 30 30 - 30
Central 20 22 25 28 30
Range 10 - 30 14 - 30 20 - 30 25 - 30 30 - 30
years
(1) Typically includes several stack replacements or overhauls under continuous operation.(2) Range excl. outlier with 50 years lifetime
System lifetime (1)
Alkaline
PEM
Electrolysis in the EU
66
In addition to these metrics, the ability to overload a stack at times to take up peaks of e.g.,
fluctuating renewable power is another metric that some manufacturers mention. However, this is
complicated by the fact that peripheral components such as pumps and also the AC-DC converter
and the grid connection would need to be sized for the maximum overload point. Therefore, at the
system level, it is clearer to define the system nominal load as the maximum load possible, regardless
of whether this is considered an overload condition or not.
Efficiency at different loads is connected with overload ability. At a cell level, the main driver of
efficiency is the current density. High currents require higher overpotentials, reducing the efficiency.
Today 2015 2020 2025 2030
Central 30% 24% 15% 15% 15%
Range 20% - 40% 16% - 33% 10% - 20% 10% - 20% 10% - 20%
Central 9% 7% 4% 4% 4%
Range 5% - 10% 3% - 8% 0% - 5% 0% - 5% 0% - 5%
%(full load)
Alkaline
PEM
Minimum part load operation
Today 2015 2020 2025 2030
Central 20 20 20 20 20
Range20min - several
hours
20min - several
hours
20min - several
hours
20min - several
hours
20min - several
hours
Central 5 5 5 5 5
Range 5 - 15 5 - 15 5 - 15 5 - 15 5 - 15
Startup time - from cold(1) to
minimum part load (Hydrogen
production)
minutes
Alkaline (2)
PEM (3)
(1) pressurised if applicable(2) Start-up times depend on system design (pressurised/unpressurised) and system optimisation. Start-up time in terms
of electrical load typically quicker, while efficiecny during start-up phase reduced.(3) Start-up times from power conservation mode can be <1min
Today 2015 2020 2025 2030
Central 7% 13% 17% 17% 17%
Range (1) 0.13% - 10% 0.13% - 20% 0.13% - 25% 0.13% - 25% 0.13% - 25%
Central 40% 40% 40% 40% 40%
Range (2) 10% - 100% 10% - 100% 10% - 100% 10% - 100% 10% - 100%
Ramp up from minimum part load
point to full load
%(full load)
/second
Alkaline
PEM
(1) Based on data from three alkaline manufacturers(2) Based on data from three PEM manufacturers
Today 2015 2020 2025 2030
Central 10% 20% 25% 25% 25%
Range (1) 10% - 10% 20% - 20% 25% - 25% 25% - 25% 25% - 25%
Central 40% 40% 40% 40% 40%
Range (2) 10% - 100% 10% - 100% 10% - 100% 10% - 100% 10% - 100%
(1) Based on data from two alkaline manufacturers(2) Based on data from three PEM manufacturers
Ramp down from full load point to
minimum part load
%(full load)
/second
Alkaline
PEM

Electrolysis in the EU
67
At cell and stack level, best efficiency is therefore achieved at low loads. Whether or not this
efficiency advantage at low loads is realised at the system level depends on whether the peripheral
components within the system have been designed for part load operating conditions.
Since industrial electrolysis applications did not typically require operation at part load, many
manufacturers have not yet optimised their systems for this need, and data on system level part load
efficiency is very limited. A few data points suggest that best efficiencies at system level would be
achieved between 40% and 60% of nominal load, but this is heavily dependent on system
optimisation strategies. These few data points also suggest that for current technology, an efficiency
advantage of about 10 percentage points could be achieved at 50% part load versus full load.
Current densities
Data on current densities at nominal load operation of electrolyser is shown below. The expectation
for both alkaline and PEM, is that current densities can be increased substantially in the future, which
is one of the main approaches to lower specific system cost.
AEM technology currently achieves about 0.5 A/cm² under continuous operation, with a long term
potential seen at about 1.5 A/cm². Lab scale SOE currently achieves between 0.75 and 1 A/cm² and
may reach 2 A/cm² once the technology is mature.
Hydrogen output pressure
Pressurised electrolysis is often discussed as one way to reduce the overall cost and potentially
increase reliability of an electrolyser plant. Different strategies to pressurised operation exist. At the
cell level, thermodynamically pressurising requires slightly more energy (a higher overpotential) than
unpressurised electrolysis, but this can be balanced against fewer, smaller or simpler external
compression stages which often add complexity and unreliability. In practice, some manufacturers
report that they do not observe an efficiency penalty at pressures around 30 bars compared to
operating the system unpressurised. Reduced bubble size (hence higher effective active electrode
area) at elevated pressures is considered as one reason for this observation. Broadly, electrochemical
compression of hydrogen within the stack is principally more energy efficient than external
mechanical compression (provided oxygen is not pressurised in the stack), but system benefits are
more complex to ascertain.
Pressurised operation is therefore linked to manufacturers’ design choice and system philosophy.
The trend is currently towards hydrogen output at greater than atmospheric pressure (30-80 bar),
thus eliminating the first stage of external compression. In certain use cases (e.g., feeding into
distribution gas grids) an electrolyser operating pressure of about 60 bar could completely eliminate
the need for external compression. If a market for such applications arises, 60 bar systems may
become available. Industrial applications often do not require pressurised hydrogen.
Today 2015 2020 2025 2030
Central 0.3 0.4 0.7 0.7 0.8
Range 0.2 - 0.4 0.2 - 0.7 0.3 - 1.0 0.5 - 1.0 0.6 - 1.0
Central 1.7 1.9 2.2 2.4 2.5
Range 1.0 - 2.0 1.2 - 2.2 1.6 - 2.5 1.6 - 2.8 1.6 - 3.0
Current density
A/cm²
Alkaline
PEM

Electrolysis in the EU
68
AEM systems available today operate up to 30 bar, while 50 bar operation has been tested in labs.
SOE short stacks27 are currently not pressurised and future pressure levels are uncertain.
Operating temperature
The required cell potential to split water reduces with increased temperature. This does not reduce
the minimum total energy requirement (39.4 kWh/kgH2) for production of hydrogen from liquid
water, but reduces the required minimum electrical energy input to split water by increasing the
thermal energy input.
Operating at elevated temperatures is therefore one strategy to improve overall electrical efficiency.
Alkaline and PEM electrolysers available today operate between 50°C and 80°C. AEM systems
currently operate at 50°C, but operation at higher temperatures is also being explored.
27
A stack consisting of a few cells only (typically 5 to 50 stacked cells). Short stacks are often used for testing and demonstration at lab scale.
Today 2015 2020 2025 2030
Central 15 20 30 30 30
Range (1) 0.05 - 30 0.05 - 40 0.05 - 60 0.05 - 60 0.05 - 60
Central 20 30 30 30 30
Range (1) 10 - 30 20 - 80 30 - 100 30 - 100 30 - 100
(1) some outliers are excluded from the range (pressures up to 450 bar have been reported for a tubular design)
bar(g)
Alkaline
PEM
Hydrogen output pressure
Today 2015 2020 2025 2030
Central 70 70 70 73 75
Range (1) 60 - 80 60 - 80 60 - 80 60 - 85 60 - 90
Central 60 64 70 70 70
Range (2) 50 - 80 54 - 84 60 - 90 60 - 90 60 - 90
Operating temperature
°C
Alkaline
PEM
(1) excludes outliers of up to 150°C (pressurised)(2) excludes outliers of up to 200°C (pressurised)

Electrolysis in the EU
69
Appendix 5
Detailed techno-economic analysis
Further detail on the techno-economic analysis is provided in the following slides.

Final report: Task 2
Techno-economic modelling of
electrolyser systems
FCH JU
7/2/2014
Ben Madden
Eleanor Standen
Alvin Chan
Element Energy Limited
2
• Introduction to the techno economic model and data
• Results of the techno-economic modelling
• Target setting: sensitivity of the hydrogen price to the key
parameters
• Conclusions
• Appendices
• Energy markets and data
• Electrolyser operating modes

3
A techno-economic model of the electrolyser system has been
constructed
Time series of electricity spot
price
Potential additional revenue – balancing services or avoided grid reinforcement
Core techno-economic model
Controls include: • electricity price strategy for
electrolyser e.g. electricity price minimisation, accessing balancing services
• Location of electrolyser – on grid, or connected to a renewable generator
• System sizing • Technology selection e.g.
alkaline, PEM • Country selection • Year selection
Amount of H2 produced
Network charges and
taxes
Electrolyser system costs and characteristics (from Task 1)
Grid CO2 emissions
Use case characteristics
Internal rate of return
Cash flow analysis
H2 price
Embedded CO2
Costs of counterfactual
Competitiveness of electrolysers in the
use case market
Use case costs
The model is fed by the input data from Task 1, along with a number of other data sources and assumptions, which are detailed in the appendix

4
There were 3 aims to the country selection:
1/ To select countries which spanned the range of industrial electricity prices1:
Five countries are selected for analysis: Germany, Spain, the UK,
Poland and Finland
1 – Source: Eurostat, Band IC : 500 MWh < Consumption < 2 000 MWh. Data is not available for all Member States
for higher consumption bands. 2 – Project estimates based on country specific data sources see appendix.
0
50
100
150
200
250
Industrial electricity
price €/MWh
BG AT CY DK IT MT DE SK IE BE ES LV HU CZ LT EL UK NL PL SI PT LU RO SE FI EE FR
125136
166
8172
44
DE ES UK
Project estimate
Eurostat
Data comparison of the electricity price accessible to a 10 MW electrolyser 1, 2
Electricity price €/MWh
However, based on detailed analysis of three of the selected countries, the electricity price which electrolysers can access can be lower than the industrial prices quoted by Eurostat:
Comparison of industrial electricity prices across the EU in 2011 1. Countries selected for further analysis are highlighted in red.
5
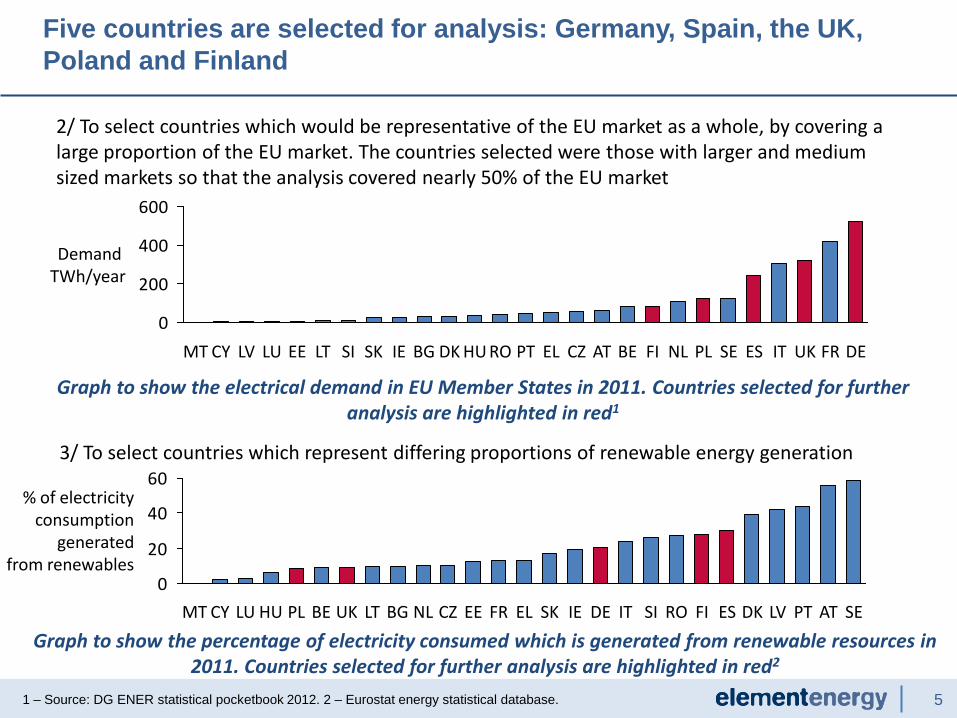
2/ To select countries which would be representative of the EU market as a whole, by covering a large proportion of the EU market. The countries selected were those with larger and medium sized markets so that the analysis covered nearly 50% of the EU market
1 – Source: DG ENER statistical pocketbook 2012. 2 – Eurostat energy statistical database.
0
200
400
600
Demand TWh/year
DE FR UK IT ES SE PL NL FI BE AT CZ EL RO HU DK BG IE SK SI LT EE LU LV CY MT PT
Graph to show the electrical demand in EU Member States in 2011. Countries selected for further analysis are highlighted in red1
3/ To select countries which represent differing proportions of renewable energy generation
0
20
40
60
SI IT DE ES FI RO LT IE SK EL FR
% of electricity consumption
generated from renewables
SE AT PT LV DK BG EE CZ NL UK BE PL HU LU CY MT
Graph to show the percentage of electricity consumed which is generated from renewable resources in 2011. Countries selected for further analysis are highlighted in red2
Five countries are selected for analysis: Germany, Spain, the UK,
Poland and Finland

6
Three use cases are specified for the end use of the
hydrogen:
3a: Re-electrification • 100 MW electrolyser • Geological storage • Hydrogen turbines • H2 produced at low
elec prices, and burnt at high elec prices
3b: Domestic heating • 10 MW electrolyser • Injected into gas grid
via a network entry plant
• Storage in the high pressure gas grid
3c: Transport
• 1 GW electrolyser • Geological storage • Distributed to HRS as
per use case 1 x
Use case 3: Energy storage
2a • 10 MW electrolyser • 1 day’s storage plus
pipeline
2b • 100 MW electrolyser • 1 day’s storage plus
pipeline
2c • 250 MW electrolyser • 1 day’s storage plus
pipeline
Use case 2: Industrial hydrogen
1a: Small car HRS
• 1 MW onsite 400 kg/day
• 700 bar refuelling
• 1 day’s storage
Use case 1: Transport
1b: Large car HRS • 5 MW onsite • 2000 kg/day • 700 bar
refuelling • 1 day’s storage
1c: large bus depot
• 10 MW onsite • 4000 kg/day • 350 bar
refuelling • 1 day’s storage
1d: distribution from central electrolyser
• 20 MW • tube trailer
deliveries • Serves 20 x
400kg/day car HRS

7
Three categories of system size, and end use for the hydrogen, are
considered to explore the markets which water electrolysers could serve
The use case is needed to determine the steps, and associated costs required to take the hydrogen out of the electrolyser system, and deliver it to the end user. Three broad categories are explored, which vary by both the size of the electrolyser systems, and the end use for the hydrogen. The three use cases are as follows: 1. Small systems for transport applications. This use case explores the steps and
associated costs required to use electrolytic hydrogen in hydrogen refuelling stations (HRS) for fuel cell vehicles and buses. A range of system sizes is explored, serving car HRS or bus depots. The relative merits of on-site electrolysis compared to delivery from a large centralised electrolyser is also explored.
2. Medium systems for industrial applications. This use case explores the steps
and associated costs required to use electrolytic hydrogen in industrial applications, such as ammonia production. A range of system sizes is explored, and it is assumed that an electrolyser produces hydrogen for an industrial park, and the hydrogen is transported to individual sites by pipeline.
3. Large systems for energy storage applications. This use case explores the steps
and associated costs required to use electrolytic hydrogen as an energy storage medium, by considering large scale systems which could take advantage of excess renewables or other cheap electricity. The end uses considered are re-electrification, or for use as heating by injection into the gas grid, or for use as a transport fuel.

8
Use case scenarios and assumptions
1. Small use case – transport applications
Use case Sizing Compression requirement
Storage Other requirements Data sources
Small use case <25 MW System is sized by demand as per the assumptions below. The electrolyser systems are sized according to demand, with limited redundancy included in case of failure of one or more of the electrolyser units. Storage provides 24 hours worth of hydrogen in case of short periods of down-time. In the case of longer periods of downtime, hydrogen would be delivered from an alternative source. MW equivalents are given on the basis of efficiencies of 60 kWh/kg
1a Small Car HRS
100 cars @ 4 kg 400 kg/day
1 MW 700 bar
1 day’s worth
Dispenser costs and HRS additional engineering
costs
US H2A, plus Element Energy
aggregated deployment
project dataset
1b Large Car HRS
500 cars @ 4 kg 2000 kg/day
5 MW 700 bar
Dispenser costs and HRS additional engineering
costs
1c Large bus depot
200 buses @ 20 kg 4000 kg/day
10 MW 350 bar
Dispenser costs and HRS additional engineering
costs
1d 20 MW electrolyser distributes to 20 small car HRS
20 small HRS: Each 100 cars @ 4kg/day
20 MW 700 bar
Transport (tube trailer) costs, dispenser & HRS costs
Counterfactual: These use cases for electrolytic hydrogen are then compared to using Steam Methane Reformer (SMR) derived hydrogen, produced in a 100 tonne/day centralised facility , which is then delivered to the hydrogen refuelling station by tube trailer.

9
Use case scenarios and assumptions
1. Small use case – transport applications
Small use case <25 MW The electrolyser systems are sized according to demand, with limited redundancy included in case of failure of one or more of the electrolyser units. Storage provides 24 hours worth of hydrogen in case of short periods of down-time. In the case of longer periods of downtime, hydrogen would be delivered from an alternative source.
Use Case Pre HRS
Compression and Distribution (€/kg)
HRS (€/kg)
Use Case Electricity Annual Demand
(MWh)
1a Small Car HRS
- 1.59 692
1b Large Car HRS
- 1.20 3,334
1c Large bus depot
- 1.00 4,620
1d 20 MW electrolyser
distributes to 20 small car HRS
0.81 1.59 13,830
Counterfactual: These use cases for electrolytic hydrogen are then compared to using Steam Methane Reformer (SMR) derived hydrogen, produced in a 100 tonne/day centralised facility , which is then delivered to the hydrogen refuelling station by tube trailer.

10
Use case Sizing Compression requirement
Storage requirement
Other requirement
Data sources
Medium use case 10 to 250 MW System is not sized according to demand, but instead according to a range of possible electrolyser system sizes.
2a 10 MW 170 bar for extra storage required
under intermittent electrolyser
operation. Pipeline pressure requires
hydrogen at 75 bar.
1 day’s worth in addition to storage
within the pipelines
Trunk pipeline to industrial site,
then distribution pipelines to
individual sites within the
industrial site
US H2A
2b 100 MW
2c
250 MW
Use case scenarios and assumptions
2. Medium use case – Industrial use of hydrogen
Counterfactual: These use cases for electrolytic hydrogen are then compared to using SMR hydrogen, produced on site, and delivered to the industrial; facilities using the same pipeline configuration and costs as set out for the use cases above.

11
Use case scenarios and assumptions
1. Small use case – transport applications
Medium use case 10 to 250 MW System is not sized according to demand, but instead according to a range of possible electrolyser system sizes.
Use Case Size Pipeline Cost
(€/kg)
Compression Cost
(€/kg)
Storage Cost (€/kg)
Use Case Electricity
Annual Demand (MWh)
2a 10 MW 1.33 0.14 0.27 1,414
2b 100 MW 0.44 0.09 0.27 14,143
2c
250 MW 0.19 0.06 0.27 35,358
Counterfactual: These use cases for electrolytic hydrogen are then compared to using Steam Methane Reformer (SMR) derived hydrogen, produced in a 100 tonne/day centralised facility , which is then delivered to the hydrogen refuelling station by tube trailer.
12
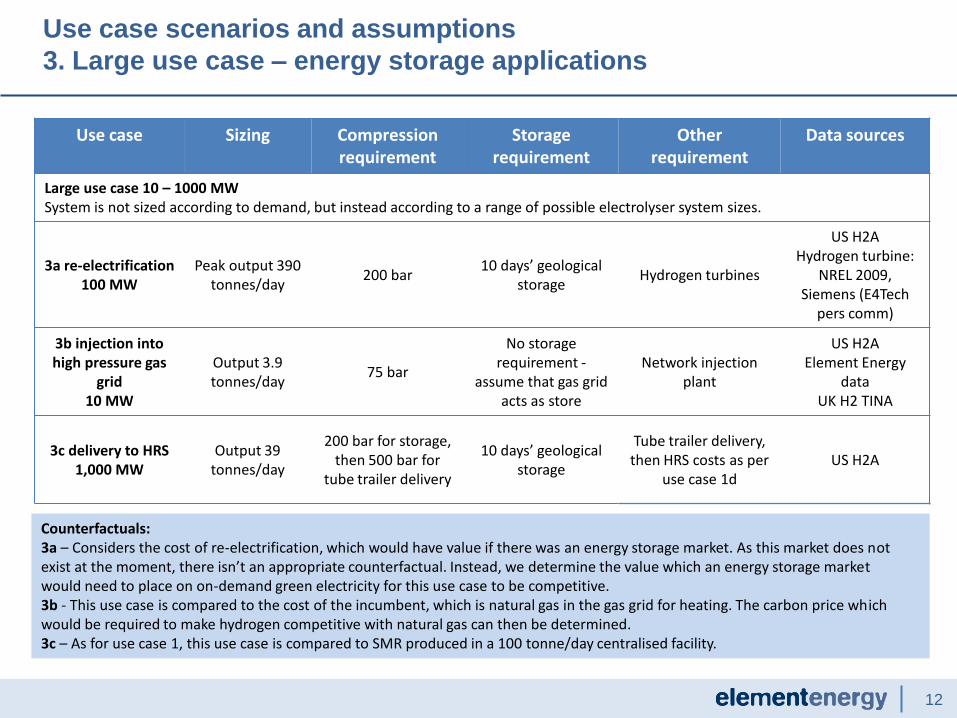
Counterfactuals: 3a – Considers the cost of re-electrification, which would have value if there was an energy storage market. As this market does not exist at the moment, there isn’t an appropriate counterfactual. Instead, we determine the value which an energy storage market would need to place on on-demand green electricity for this use case to be competitive. 3b - This use case is compared to the cost of the incumbent, which is natural gas in the gas grid for heating. The carbon price which would be required to make hydrogen competitive with natural gas can then be determined. 3c – As for use case 1, this use case is compared to SMR produced in a 100 tonne/day centralised facility.
Use case Sizing Compression requirement
Storage requirement
Other requirement
Data sources
Large use case 10 – 1000 MW System is not sized according to demand, but instead according to a range of possible electrolyser system sizes.
3a re-electrification 100 MW
Peak output 390 tonnes/day
200 bar 10 days’ geological
storage Hydrogen turbines
US H2A Hydrogen turbine:
NREL 2009, Siemens (E4Tech
pers comm)
3b injection into high pressure gas
grid 10 MW
Output 3.9 tonnes/day
75 bar
No storage requirement -
assume that gas grid acts as store
Network injection plant
US H2A Element Energy
data UK H2 TINA
3c delivery to HRS 1,000 MW
Output 39 tonnes/day
200 bar for storage, then 500 bar for
tube trailer delivery
10 days’ geological storage
Tube trailer delivery, then HRS costs as per
use case 1d US H2A
Use case scenarios and assumptions
3. Large use case – energy storage applications

13
Use case scenarios and assumptions
1. Small use case – transport applications
Large use case 10 – 1000 MW System is not sized according to demand, but instead according to a range of possible electrolyser system sizes.
Use Case Size
Pre HRS Compression
and Distribution
(€/kg)
HRS (€/kg)
Geological Storage and Compression
(€/kg)
Gas injection plant and
compression (€/kg)
Gas Turbine (€/kW)
Use Case Electricity
Annual Demand (MWh)
3a re-electrificatio
n 100MW
100 MW - - 0.16 - 550 8,802
3b injection into high
pressure gas grid
10 MW
10 MW - - - 0.27 - 836
3c delivery to HRS
1000 MW 1,000 MW 0.81 1.59 0.09 - - 181,558
Counterfactual: these use cases for electrolytic hydrogen are then compared to using Steam Methane Reformer (SMR) derived hydrogen, produced in a 100 tonne/day centralised facility , which is then delivered to the hydrogen refuelling station by tube trailer.
14
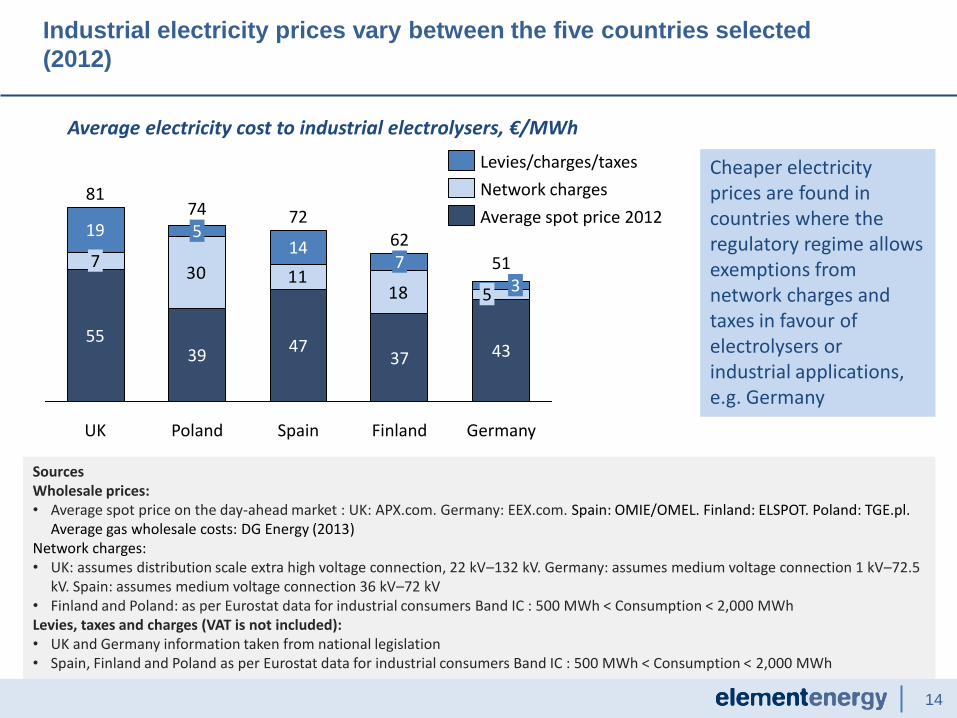
Industrial electricity prices vary between the five countries selected
(2012)
30 1118
Germany
51
43
5 3
Finland
62
37
7
Spain
72
47
14
Poland
74
39
5
UK
81
55
7
19
Network charges
Levies/charges/taxes
Average spot price 2012
Sources Wholesale prices: • Average spot price on the day-ahead market : UK: APX.com. Germany: EEX.com. Spain: OMIE/OMEL. Finland: ELSPOT. Poland: TGE.pl.
Average gas wholesale costs: DG Energy (2013) Network charges: • UK: assumes distribution scale extra high voltage connection, 22 kV–132 kV. Germany: assumes medium voltage connection 1 kV–72.5
kV. Spain: assumes medium voltage connection 36 kV–72 kV • Finland and Poland: as per Eurostat data for industrial consumers Band IC : 500 MWh < Consumption < 2,000 MWh Levies, taxes and charges (VAT is not included): • UK and Germany information taken from national legislation • Spain, Finland and Poland as per Eurostat data for industrial consumers Band IC : 500 MWh < Consumption < 2,000 MWh
Average electricity cost to industrial electrolysers, €/MWh
Cheaper electricity prices are found in countries where the regulatory regime allows exemptions from network charges and taxes in favour of electrolysers or industrial applications, e.g. Germany
15
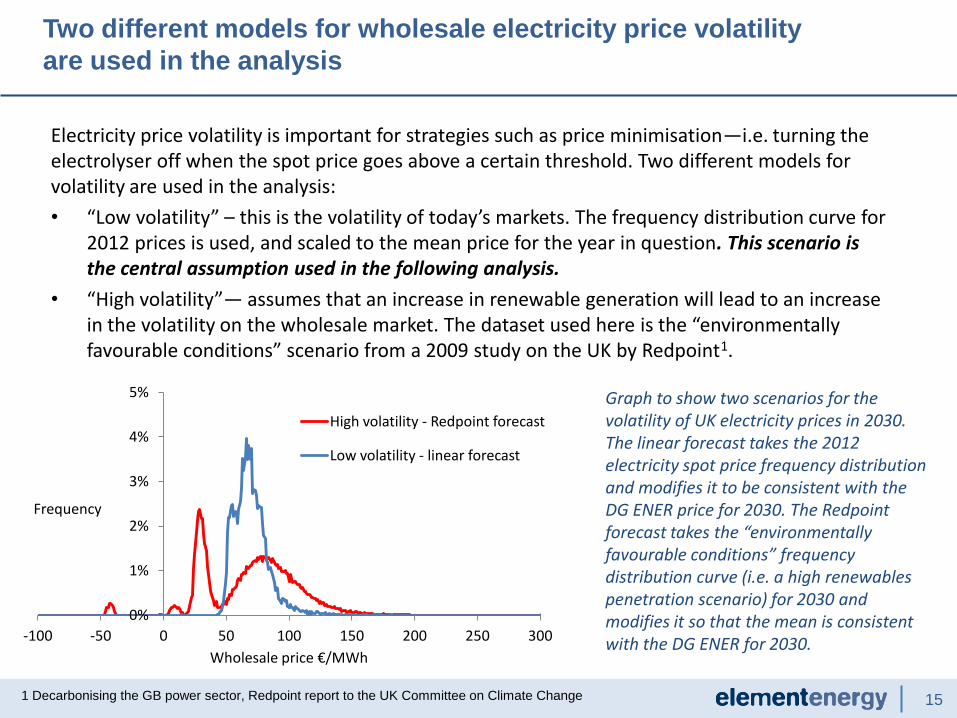
Electricity price volatility is important for strategies such as price minimisation—i.e. turning the electrolyser off when the spot price goes above a certain threshold. Two different models for volatility are used in the analysis:
• “Low volatility” – this is the volatility of today’s markets. The frequency distribution curve for 2012 prices is used, and scaled to the mean price for the year in question. This scenario is the central assumption used in the following analysis.
• “High volatility”— assumes that an increase in renewable generation will lead to an increase in the volatility on the wholesale market. The dataset used here is the “environmentally favourable conditions” scenario from a 2009 study on the UK by Redpoint1.
Two different models for wholesale electricity price volatility
are used in the analysis
1 Decarbonising the GB power sector, Redpoint report to the UK Committee on Climate Change
Graph to show two scenarios for the volatility of UK electricity prices in 2030. The linear forecast takes the 2012 electricity spot price frequency distribution and modifies it to be consistent with the DG ENER price for 2030. The Redpoint forecast takes the “environmentally favourable conditions” frequency distribution curve (i.e. a high renewables penetration scenario) for 2030 and modifies it so that the mean is consistent with the DG ENER for 2030.
0%
1%
2%
3%
4%
5%
-100 -50 0 50 100 150 200 250 300
Frequency
Wholesale price €/MWh
High volatility - Redpoint forecast
Low volatility - linear forecast

16
The model uses the following input data from Task 1, for alkaline and PEM systems:
• Capital costs: Central and upper and lower bounds for capital costs (€/kW) are used. Note that the Task 1 results suggest no clear evidence to justify a large variation in the specific capital cost by size of the system, so the same trend line, lower and upper bounds apply to all sizes of system in the modelling.
• Non-electricity operation costs: comprised of material costs and labour costs. The material costs do not vary with scale, and are set as 1.5% of the capital costs. The labour costs do scale. Note that stack replacement is considered separately from these costs.
• Electrolyser efficiency: Central and upper and lower bounds for peak load efficiency (kWh/kg) is used. A dynamic efficiency curve is also modelled.
• System and stack lifetime: The system lifetime is measured in years and is independent of the hours of use of the electrolyser. In contrast, the stack lifetime is measured in hours of operation, and if the electrolyser operates beyond the lifetime of the stack, stack replacement costs are accounted for, as well as the residual value of the stack at the end of the project lifetime.
• Minimum turn-down ratio: This is the minimum proportion of the total rated power the electrolyser can operate at.
• Start-up time: This is the time taken for the electrolyser to go from being fully shut down to get to the minimum turn-down point.
• Ramp-up and ramp-down rates: This is the speed at which the electrolyser can respond to signals to turn up or turn down.
• System pressure: The use cases assume that hydrogen is produced at 20 bar. However the sensitivity to different pressures is explored (see later slides).
A range of KPIs are adapted from Task 1 for use in the techno-
economic modelling

17
Summary of the electrolyser KPIs from Task 1 used in the
modelling (1/2)
Alkaline Water Electrolysers, 2012 PEM Water Electrolysers, 2012
Lower Central Upper Lower Central Upper
Capex (€/kW) 1,000 1,100 1,200 1,856 2,088 2,320
Opex (€/kW/yr)
- scale
dependent)
15–50 17–51 18–53 28–63 32–66 35–70
Energy input
(kWh/kg) 50 54 78 50 57 83
Stack Lifetime
(hours) 90,000 75,000 60,000 90,000 62,000 20,000
Minimum turn-
down ratio (%) 20 30 40 5 9 10
Start-up time
(minutes) 20 20 Several hours 5 10 15
Ramp-up rate
(%/sec) 10 6.7 0.1 100 40.6 10
Ramp-down
rate (%/sec) 10 10 10 100 40.6 10
System
pressure
(bar(g))
30 15 0.05 30 20 10
2012

18
Summary of the electrolyser KPIs from Task 1 used in the
modelling (2/2)
Alkaline Water Electrolysers, 2030 PEM Water Electrolysers, 2030
Lower Central Upper Lower Central Upper
Capex (€/kW) 367 583 800 250 760 1270
Opex (€/kW/yr)
- scale
dependent)
6–41 9–44 12–47 4–39 12–46 19–54
Energy input
(kWh/kg) 48 50 63 44 47 53
Stack Lifetime
(hours) 100,000 95,000 90,000 90,000 78,000 60,000
Minimum turn-
down ratio (%) 10 15 20 0 4 5
Start-up time
(minutes) 20 20 Several hours 5 10 15
Ramp-up rate
(%/sec) 25 16.8 0.1 100 40.6 10
Ramp-down
rate (%/sec) 25 25 25 100 40.6 10
System
pressure
(bar(g))
60 30 0.05 100 30 30
2030
19
• Although the data from certain individual manufacturers did suggest that specific capex for larger scale systems would be lower than for smaller scale systems, taken collectively, the data from all the manufacturers did not show a trend that depends on system scale
– i.e., some of the data ‘best case’ capex KPI trendline is for small systems and some is for large systems
• We believe that there are a number of factors that contribute to this:
– Very large electrolysers (say > 50 MW) are largely conceptual at this point, so cost reductions for such systems have yet to be demonstrated
– Different manufacturers have adopted different strategies for electrolyser deployment, with some pursuing large scale systems whilst others are not
– There is considerable uncertainty in longer term KPI forecasts
• The specific capex KPI trendlines capture the full range of data from manufacturers and the literature and, we believe, are a reasonable representation of what is feasible regardless of individual system scale
• Given the uncertainties around the effects of scale, the current modelling does not account for effects of scale on specific capex. The effect on opex is include through reductions in labour costs for larger plants.
• Because of their very wide variation by country and region, neither civil works and installation nor land-use related costs are included in the analysis. It is entirely possible that these factors could affect the electrolysis systems and counterfactuals differently.
Dependence of specific capex on system scale

20
• Introduction to the techno economic model and data
• Results of the techno-economic modelling
• Target setting: sensitivity of the hydrogen price to the key
parameters
• Conclusions
• Appendices
• Energy markets and data
• Electrolyser operating modes

21
Summary results for hydrogen production costs at the
production site for all 5 countries (1)
Hydrogen costs (€/kg) in 2012 for best case KPIs for Alkaline and PEM electrolysers in a variety of electricity market scenarios described in the Appendix. Only UK and Germany publish load balancing data. ‘RG only’ refers to an off-grid scenario, connected by private wire to a 31% capacity factor wind farm only.
Key points:
Finland 2012 Poland 2012 Spain 2012 UK 2012 Germany 2012
5.0
4.1
5.0
4.2
PEM
Alkaline
2.7
4.1
3.2
4.1
3.2
7.6
5.0
3.5
5.6
4.8
4.7
5.6 5.5
5.5
4.7
4.7
RG only 8.6
5.9
Balancing services 5.4
4.6
Price minimisation 5.1
100% load factor 6.0
5.2
6.0
Excluding end-use
Hydrogen production cost (€/kg)
2012, Best Case KPIs
• Germany exhibits the lowest hydrogen production costs as the WE can access a combination of low wholesale electricity prices and very low electricity transmission and distribution fees
• Conversely, the UK exhibits the higher hydrogen costs due to high transmission and distribution charges • PEM is systematically more expensive than Alkaline WEs due to the lower maturity level of the technology in 2012 • The renewable generation (RG) only scenarios include renewable subsidy (UK: ROC at € 51/MWh; Germany: EEG: at € 48/MWh as base
support for 20 years plus a premium of € 88/MWh for first 5 years)
N/A
N/A
N/A
N/A
N/A
N/A
N/A
N/A
N/A
N/A
N/A
N/A
SMR marginal 1.6
SMR w/Capex and Opex 1.9
1.6
1.8
1.6
1.8
1.6
1.8
1.6
1.8

22
Hydrogen costs (€/kg) in 2030 for best case KPIs for Alkaline and PEM electrolysers in a variety of electricity market scenarios described in the Appendix. Electricity price volatility as per 2012. RG only refers to an off-grid scenario, connected by private wire to a 31% capacity factor wind farm only.
Key points:
3.5 4.0
3.7 4.1
PEM
Alkaline
2.7
3.3
2.3 2.6
2.6
3.1
2.9
3.2
4.6
4.3 4.7
4.2
4.6
4.6
4.0
4.2
RG only 2.8
3.5
Balancing services 3.8
4.3
Price minimisation
100% load factor
5.0
4.4
4.6
5.0
Finland 2030 Poland 2030 Spain 2030 UK 2030 Germany 2030
Hydrogen production cost (€/kg)
Excluding end-use
2030, Best Case KPIs
• PEM can be more competitive than alkaline by 2030 thanks to a greater cost reduction and efficiency improvement potential over time • Germany exhibits the lowest H2 production costs thanks to low wholesale electricity prices and transmission/distribution fees. As a consequence,
the best operating strategy for WEs is to source grid electricity and provide grid balancing services • The situation reverses in the UK where high electricity prices and transmission/distribution fees implies that the best operating strategy for WE is to
be powered by off-grid renewable generators (e.g. wind turbines) • The RG hydrogen sharp cost reduction from the 2012 levels is driven by the WE Capex/Opex reduction and efficiency improvement. The renewable
subsidy level in the UK is assumed constant at the 2012 level, whilst this is tapered in Germany (reduction: 1.5% p.a.)
N/A
N/A
N/A
N/A
N/A
N/A
N/A
N/A
N/A
N/A
N/A
N/A
Summary results for hydrogen production costs at the
production site for all 5 countries (2)
SMR marginal 2.2
SMR w/Capex and Opex 2.5
2.2
2.4 2.4
2.2
2.5
2.2
2.4
2.2

23
Two countries are then selected as case studies for detailed
analysis of the hydrogen costs with the use case costs included
Germany is selected for further analysis for the following reasons: • Cheapest industrial electricity prices, allowing electrolysers to be close to
competitive • Electrolysers can participate in the balancing services market, allowing
additional revenues to be accessed to reduce the production cost of hydrogen
The UK has the highest grid electricity prices of all of the five countries. The UK is selected for further analysis in order to:
• Demonstrate that low cost electricity can be accessed in certain situations – in this example by connecting directly to a renewable generator and accessing renewable certificates.
24
Germany case study – electrolyser operating mode
2012 2030
Hydrogen production cost (€/kg)
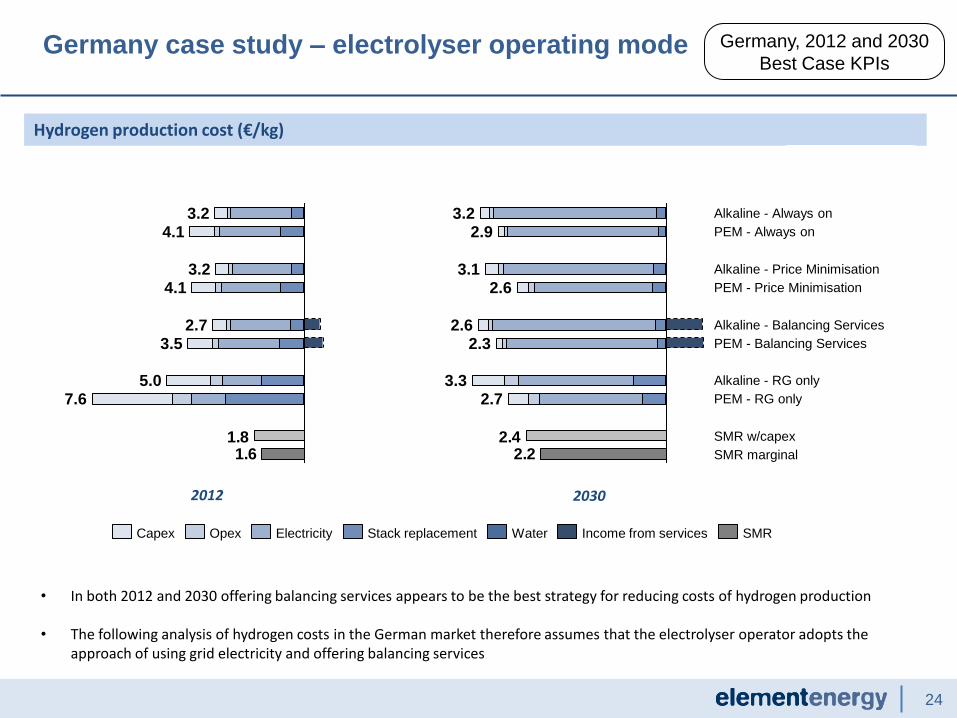
• In both 2012 and 2030 offering balancing services appears to be the best strategy for reducing costs of hydrogen production • The following analysis of hydrogen costs in the German market therefore assumes that the electrolyser operator adopts the
approach of using grid electricity and offering balancing services
1.61.8
7.6 5.0
3.5 2.7
4.1 3.2
4.1 3.2
2.22.4
SMR marginal
SMR w/capex
PEM - RG only
Alkaline - RG only
PEM - Balancing Services
Alkaline - Balancing Services
PEM - Price Minimisation
2.9 3.2
2.6
Alkaline - Price Minimisation 3.1
PEM - Always on
Alkaline - Always on
2.3 2.6
2.7 3.3
SMR Water Income from services Stack replacement Electricity Opex Capex
Germany, 2012 and 2030
Best Case KPIs

25
In addition to the cost of hydrogen, the model adds
additional downstream costs for each end use (example)
US DOE H2A model, projected average electricity and gas
price prices (DG Energy),
Comments: • Compressor cost and electricity requirement based on US H2A model • Compressor electricity cost based on average price paid by electrolyser in Germany, 2030 • Storage and other HRS costs (dispenser plus additional engineering cost) based on US H2A model • Learning rate is applied to 2012 HRS costs to get to 2030 costs • Distribution cost: assumes tube trailer delivery – HRS located 100 km from the centralised SMR plant. Tube trailers operate within a
delivery network to reduce costs.
Hydrogen cost at the nozzle
Germany, 2030
2.43.1
1.6 1.6
0.8
0.2
Central SMR
5.2
0.4
On-site 1MW WE
4.2
-0.6
Case 1a – Small HRS 400kg/day Case 1d – distribution to 20 small car HRS
(PEM technology, CO2 price excluded)
Income from balancing services
Production cost
Compression and distribution
HRS (capex and Opex)
Use Case electricity (HRS, comp.&distr.)
2.4 2.9
0.80.8
1.61.6
Off-site
20MW WE
4.9
-0.6
0.2
Central SMR
5.2
0.4
€/kg €/kg

26 1 Average PEM and Alkaline values. Electricity price strategy: response services
• The analysis suggests that WE technology (both on-site and offsite) can compete with SMR-derived hydrogen on all transport scenarios (1a to 1d) by 2030 in Germany
• On-site WE appears to offer a marginally cheaper solution than centralised WE plants as in the modelled scenarios 1) on-site plants of the MW scale can access to the same electricity prices and low network charges as for centralised WE plants, 2) the system Capex (€/MW installed) do not scale with size and 3) there are no distribution costs
• Results vary little with the WE technology choice. In the central KPIs case the difference between PEM and Alkaline is marginal (e.g. below 5 Euro cents per kg of hydrogen dispensed). The model returns a greater difference in the Best Case KPIs scenarios as a greater Capex difference per MW installed favours PEM (circa €0.35/kg cheaper than Alkaline technology)
• A carbon price of ~€55/tCO2 would be sufficient to bridge the gap with central KPIs for all of these cases.
Hydrogen cost at the nozzle1, €/Kg
Discussion
(CO2 price excluded)
5.2 5.0 4.8 4.5 4.1 5.2 5.7 5.13.63.94.4 4.5
WE, Best Case KPIs
WE, Central
KPIs
SMR WE, Best Case KPIs
WE, Central
KPIs
SMR WE, Best Case KPIs
WE, Central
KPIs
SMR WE, Best Case KPIs
WE, Central
KPIs
SMR
Use case results: 1 – small systems (<20MW WE)
providing hydrogen for transport
Germany, 2030
1c (on-site 10MW WE)
Large bus depot
4000kg/day
1a (on-site 1MW WE)
Small car HRS
400kg/day
1b (on-site 5MW WE)
Large car HRS
2000kg/day
1d (off-site 20MW WE)
8000 kg/day electrolyser distributes to 20 small HRS
All costs including compression, distribution (for SMR and cases 1d only) and HRS costs. Error bars reflect difference between PEM and Alkaline technology.

27 1 Average PEM and Alkaline values. Electricity price strategy: response services 2 Based on UK Short Term Operating Reserve market, scaled for the German market
• Medium scale WE units (~100MW) struggle to compete with SMR-derived hydrogen by 2030, even if the WE technologies achieve the cost and efficiency improvements implied by the Best Case KPIs scenario
• Large scale water electrolysers (>100 MW) may have difficulty competing with SMR-derived hydrogen for large scale industrial applications.
• This is because whilst the hydrogen pipeline impact per kgH2 decreases with the increasing dimension of the system, large WE plants have access to lower relative balancing revenues as the model only allows up to 60MW of their installed capacity to offer grid balancing services ( threshold based on the largest capacity currently present in the balancing market2).
• As for the previous application case, results vary little with the WE technology choice. PEM overall performs marginally better than Alkaline solutions (circa up to €0.08/kg of hydrogen cheaper in the Central case and circa €0.35/ kg cheaper in the Best Case scenario)
Hydrogen cost1, €/Kg
Discussion
(CO2 price excluded)
2a
10 MW electrolyser
Use case results: 2 – systems producing
industrial hydrogen
Germany, 2030
2b
100 MW electrolyser
2c
250 MW electrolyser
WE are assumed to replace large on-site SMR units to produce industrial hydrogen. No HRS costs included. Scenarios include cost for a hydrogen pipeline connecting plants with the industrial end-use. Scenarios only reflects different WE sizes (from 10MW to 250MW).
4.3 4.83.3 4.1 3.1 4.0 3.43.54.2
WE, Central KPIs
WE, Best Case KPIs
SMR WE, Best Case KPIs
WE, Central KPIs
SMR WE, Best Case KPIs
WE, Central KPIs
SMR
28
Hydrogen cost at the nozzle2, €/Kg
1 Average PEM and Alkaline values. Electricity price strategy: response services 2 All costs including compression, distribution and HRS costs
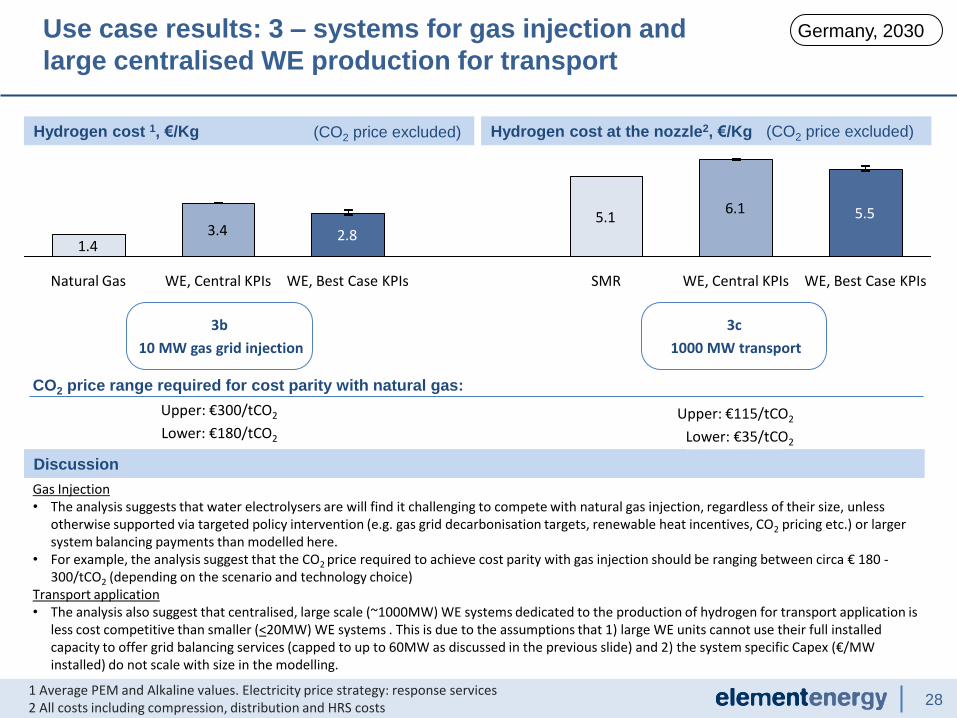
Gas Injection • The analysis suggests that water electrolysers are will find it challenging to compete with natural gas injection, regardless of their size, unless
otherwise supported via targeted policy intervention (e.g. gas grid decarbonisation targets, renewable heat incentives, CO2 pricing etc.) or larger system balancing payments than modelled here.
• For example, the analysis suggest that the CO2 price required to achieve cost parity with gas injection should be ranging between circa € 180 -300/tCO2 (depending on the scenario and technology choice)
Transport application • The analysis also suggest that centralised, large scale (~1000MW) WE systems dedicated to the production of hydrogen for transport application is
less cost competitive than smaller (<20MW) WE systems . This is due to the assumptions that 1) large WE units cannot use their full installed capacity to offer grid balancing services (capped to up to 60MW as discussed in the previous slide) and 2) the system specific Capex (€/MW installed) do not scale with size in the modelling.
Hydrogen cost 1, €/Kg
Discussion
(CO2 price excluded)
Use case results: 3 – systems for gas injection and
large centralised WE production for transport
Germany, 2030
1.43.4
5.16.1 5.5
2.8
WE, Best Case KPIs WE, Central KPIs SMR WE, Best Case KPIs WE, Central KPIs Natural Gas
3b
10 MW gas grid injection
3c
1000 MW transport
CO2 price range required for cost parity with natural gas:
Upper: €300/tCO2
Lower: €180/tCO2
Upper: €115/tCO2
Lower: €35/tCO2
(CO2 price excluded)

29 1 PEM Water Electrolysers. Electricity price strategy: response services
Hydrogen cost at the nozzle1, €/Kg (CO2 price excluded)
Use case results: 1 – small systems (<20MW WE)
providing hydrogen for transport – costs breakdown
Germany, 2030
Small car HRS (1MW) Large car HRS (5MW) Large bus depot (10MW) Off-site WE, Delivery to Small car HRS (20MW)
SMR Central
KPIs Best KPIs
SMR Central
KPIs Best KPIs
SMR Central
KPIs Best KPIs
SMR Central
KPIs Best KPIs
Water
2.41
0.02 0.02
2.41
0.02 0.02
2.41
0.02 0.02
2.41
0.02 0.02
Electricity 2.74 2.61 2.74 2.61 2.74 2.61 2.74 2.61
Opex 0.27 0.21 0.11 0.06 0.11 0.06 0.09 0.04
Capex 0.35 0.11 0.35 0.11 0.35 0.11 0.35 0.11
Stack replacement 0.50 0.13 0.50 0.13 0.50 0.13 0.50 0.13
Use Case 2.76 1.81 1.80 2.36 1.42 1.40 2.08 1.15 1.14 2.76 2.63 2.61
Balancing Services - - 0.64 - 0.63 - 0.64 - 0.63 - - 0.64 - 0.63 - - 0.64 - 0.63

30 1 PEM Water Electrolysers. Electricity price strategy: response services
Hydrogen cost at the nozzle1, €/Kg (CO2 price excluded)
Use case results: 2 – systems producing industrial
hydrogen – costs breakdown
Germany, 2030
10 MW 100 MW 250 MW
SMR Central
KPIs Best KPIs SMR
Central KPIs
Best KPIs SMR Central
KPIs Best KPIs
Water
2.41
0.02 0.02
2.41
0.02 0.02
2.41
0.02 0.02
Electricity 2.74 2.61 2.74 2.61 2.74 2.61
Opex 0.11 0.06 0.07 0.03 0.07 0.02
Capex 0.35 0.11 0.34 0.11 0.34 0.10
Stack replacement 0.50 0.13 0.49 0.12 0.48 0.12
Use Case 1.86 1.78 1.77 0.93 0.84 0.84 0.64 0.56 0.55
Balancing Services - - 0.64 - 0.63 - - 0.39 - 0.37 - - 0.15 - 0.15
31 1 PEM Water Electrolysers. Electricity price strategy: response services
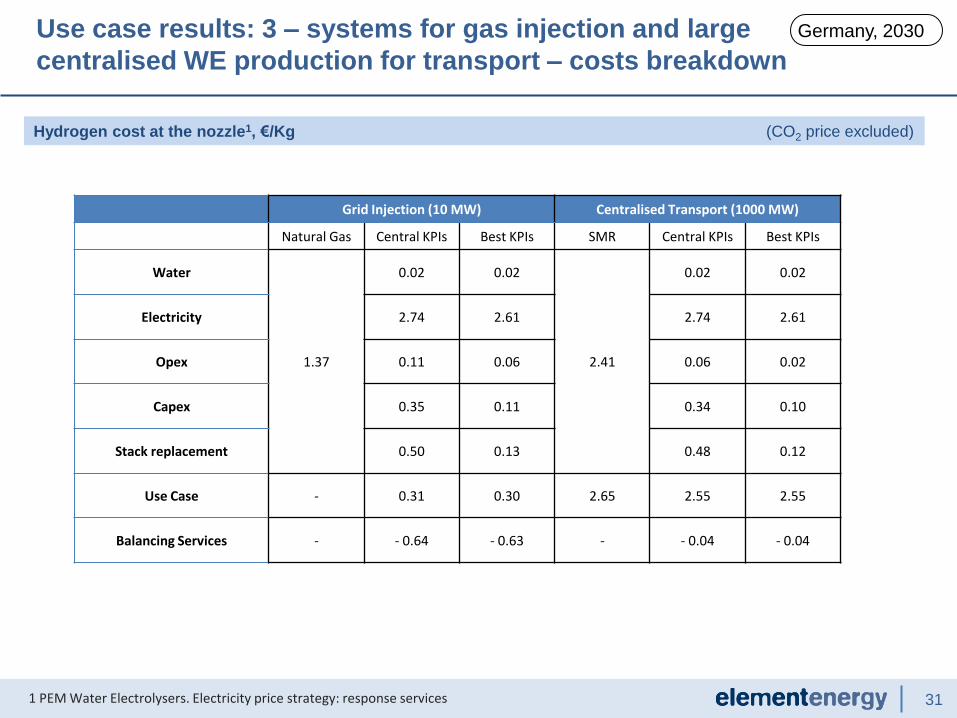
Hydrogen cost at the nozzle1, €/Kg (CO2 price excluded)
Use case results: 3 – systems for gas injection and large
centralised WE production for transport – costs breakdown
Germany, 2030
Grid Injection (10 MW) Centralised Transport (1000 MW)
Natural Gas Central KPIs Best KPIs SMR Central KPIs Best KPIs
Water
1.37
0.02 0.02
2.41
0.02 0.02
Electricity 2.74 2.61 2.74 2.61
Opex 0.11 0.06 0.06 0.02
Capex 0.35 0.11 0.34 0.10
Stack replacement 0.50 0.13 0.48 0.12
Use Case - 0.31 0.30 2.65 2.55 2.55
Balancing Services - - 0.64 - 0.63 - - 0.04 - 0.04

32
Re-electrification is unlikely to be viable in electricity markets with
current volatility
Discussion
• In markets with current electricity price volatility, re-electrification using hydrogen as a storage medium is not financially viable, as the spread between high and low electricity prices cannot compensate for the efficiency losses in the system.
Electricity Price/Cost 1, €/MWh
Germany, 2030
€/MWhelec PEM & Best Case KPIs
1 Redpoint Energy (2009) – Decarbonising the GB Power Sector
Electricity Wholesale Price: Low Volatility, €/MWh
0.00%
0.50%
1.00%
1.50%
2.00%
2.50%
3.00%
3.50%
-50 0 50 100 150 200
No
rmal
ise
d F
req
ue
ncy
(%
)
Forecast Electricity Wholesale Price (€/MWh)
Hydrogen Production
Re-electrification
232925
6122
6658
Average Spot Price
206
Average Price For Exported Electricity
Cost of Generation
Stack Replacement
Electricity
OPEX
CAPEX Use Case
Cost of Water

33
Re-electrification is only likely to be viable in volatile electricity
markets and still requires support for provision of energy storage
Discussion
• In markets with highly volatile electricity prices (an example is shown above for Germany, using a graph adapted from an industry forecast for the UK’s volatility1), re-electrification using hydrogen as a storage medium has value, by producing inexpensive hydrogen during periods with low electricity price, and generating electricity (via a turbine) during periods of high electricity price.
• The cost of electricity from re-electrification, using an optimised strategy, is €41/MWh greater than the average spot price received for
the exported electricity . The value of energy storage in the electricity network by 2030 is uncertain, and there is potential for re-electrification use cases via hydrogen in highly volatile electricity markets should these services become valuable. Stored electricity would need a value of at least €41/MWh to make this scenario viable.
Electricity Price/Cost 1, €/MWh
Germany, 2030
€/MWhelec PEM & Best Case KPIs
1 Redpoint Energy (2009) – Decarbonising the GB Power Sector
0.00%
0.50%
1.00%
1.50%
2.00%
2.50%
3.00%
-100 -50 0 50 100 150 200
No
rmal
ise
d F
req
ue
ncy
(%
)
Forecast Electricity Wholesale Price (€/MWh)
Hydrogen Production
Re-electrification
Electricity Wholesale Price: High Volatility, €/MWh
30
29256
4696
58
Average Spot Price Average Price For Exported Electricity
Cost of Generation
137
OPEX
CAPEX Electricity
Cost of Water Stack Replacement
Use Case
34
Germany – overarching conclusions
Transport • The analysis performed for the German market suggests that the most competitive use case for water electrolysis
(WE) is hydrogen production for the transport sector
• Smaller WE units (< 20MW) using grid electricity can be competitive with SMR-derived hydrogen by 2030 in Germany regardless of the WE technology, although PEM could offer a more cost effective solution thanks to a greater scope in their cost reduction and efficiency improvement by 2030
• Distributed (on-site) WE units appears to offer a marginally cheaper solution than large (> 50 MW) centralised (off-site) WE plants as in the modelled scenarios 1) on-site plants (above 1MW) can access to the same electricity prices and low network charges as for centralised WE plants, 2) the system specific Capex (€/MW installed) does not scale with size, 3) there are no distribution costs for distributed WE and 4) very large MW units are unlikely to use their full installed capacity to offer grid balancing services, as this market is limited in scale.
Other applications
• WE will find it challenging to compete against natural gas-based solutions in the other applications analysed in this study by 2030 (hydrogen for industrial consumption and gas injection) unless the best case KPIs are achieved or the sectors is supported by a targeted policy intervention (e.g. gas grid / industrial decarbonisation targets / mandate, renewable heat incentives, CO2 pricing, etc.) or very high balancing benefits are paid (see below).
• For example, the analysis for the gas injection case suggests that the CO2 price required to achieve cost parity with gas injection should range between circa € 180-300/tCO2 (depending on the scenario and technology choice)

35
UK case study – electrolyser operating mode
Hydrogen production cost (€/kg)
UK, 2012 and 2030
2012 2030
• In the UK, the best strategy in 2012 is for the electrolyser operator to be connected to the electricity grid and to offer balancing services. However, by 2030, the increasing electricity price makes strategies where the electrolyser is instead connected to a dedicated generator more attractive (in this case a 31% load factor wind turbine). Further details of these strategies are given in the appendix.
• The following analysis of hydrogen costs in the 2030 UK market therefore assumes that the electrolyser operator adopts the approach connecting directly and only to a renewable generator via a private wire arrangement
1.61.9
5.1
8.6 5.9
5.4 4.6
6.0
6.0 5.2
2.22.5
Alkaline - Price Minimisation
4.4
PEM - Always on 4.6 Alkaline - Always on 5.0
PEM - RG only
SMR marginal
2.8
SMR w/capex
PEM - Balancing Services
Alkaline - RG only 3.5
3.8 Alkaline - Balancing Services
PEM - Price Minimisation
4.3
5.0
Water SMR Capex Stack replacement Opex Income from services Electricity

36 1 Average PEM and Alkaline values. Electricity price strategy: off-grid renewable electricity only (wind farm, 31% load factor), no provision of grid balancing services
Hydrogen cost at the nozzle1, €/Kg. Off-Grid System connected to wind farm.
Discussion
(CO2 price excluded)
5.5 7.15.2 6.2 4.7 5.9 5.5
7.35.74.34.55.4
SMR WE, Best Case KPIs
WE, Central
KPIs
SMR WE, Best Case KPIs
WE, Central
KPIs
SMR WE, Best Case KPIs
WE, Central
KPIs
SMR WE, Best Case KPIs
WE, Central
KPIs
Use case results: 1 – small systems (<20MW WE)
providing hydrogen for transport
UK, 2030
• The analysis suggests that WE technology (both on-site and offsite) powered with off-grid electricity (e.g. WE directly connected to a local renewable generator such as a wind farm) can compete with SMR-derived hydrogen by 2030 in the UK should the WE technology achieve the cost and efficiency improvements implied by the Best Case KPIs scenario.
• Under these assumptions, on-site WE offer a cheaper solution than centralised WE plants as 1) the system specific capex (€/MW installed) does not scale with size; 2) there are no distribution costs and 3) subsidies for wind farms (ROCs) remain at 2012 levels.
• Results also suggest that PEM technology could provide a better proposition than Alkaline technology (circa up to €0.5/kgH2 for both the Central and Best Case scenarios). This is because as modelled PEM technology is assumed to offer a wider operational range, via lower minimum load factors, which is better suited to capture volatile renewable generation, therefore increasing annual hydrogen production of the WE plant.
• Carbon price of ~€55/tCO2 is sufficient for best case KPIs across Use Case 1. For central KPIs, a price between €75-230/tCO2 is needed
All costs including compression, distribution (for SMR and cases 1d only) and HRS costs. Error bars reflect difference between PEM and Alkaline technology.
1c (on-site 10MW WE)
Large bus depot
4000kg/day
1a (on-site 1MW WE)
Small car HRS
400kg/day
1b (on-site 5MW WE)
Large car HRS
2000kg/day
1d (off-site 20MW WE)
8000 kg/day electrolyser distributes to 20 small HRS

37
Hydrogen cost at the nozzle1, €/Kg. Off-Grid System connected to wind farm.
Discussion
(CO2 price excluded)
2a
10 MW electrolyser
Use case results: 2 – systems producing
industrial hydrogen
UK, 2030
4.46.6
3.55.5
3.25.2
3.63.94.9
WE, Best Case KPIs
WE, Central KPIs
SMR WE, Best Case KPIs
WE, Central KPIs
SMR WE, Best Case KPIs
WE, Central KPIs
SMR
2b
100 MW electrolyser
2c
250 MW electrolyser
1 Average PEM and Alkaline values. Electricity price strategy: off-grid renewable electricity only (wind farm, 31% load factor), no provision of grid balancing services
WE are assumed to replace large on-site SMR units to produce industrial hydrogen. No HRS costs included. Scenarios include cost for a hydrogen pipeline connecting plants with the industrial end-use. Scenarios only reflects different WE sizes (from 10MW to 250MW).
• The analysis suggests that WE operated in this mode may find it challenging to compete against SMR for industrial hydrogen applications even in the Best Case KPIs scenario in the UK by 2030
• Results suggests that 1) the WE economic performance increases with the WE installed capacity and 2) systems with a lower turn down level perform considerably better in these stand alone cases. In other words, as modelled, large PEM systems (with a 0% turn-down level) are better suited to capture volatile renewable generation than alkaline (modelled at 10%), therefore benefitting from a higher average load factor
• The analysis suggests that the minimum cost gap with SMR is of the order of circa €0.50/kgH2 (Best Case KPIs, 250 MW PEM electrolyser), meaning that WE would need additional support from the regulatory framework (e.g. balancing payments, electricity tariffs) or direct policy support top compete in these markets.
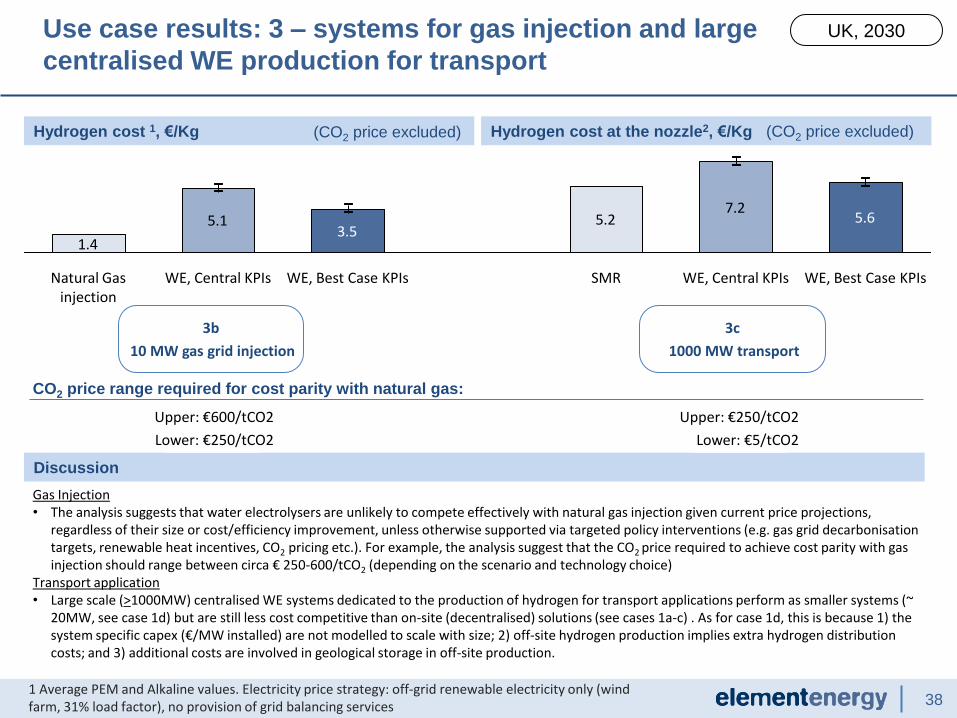
38
Discussion
Use case results: 3 – systems for gas injection and large
centralised WE production for transport
UK, 2030
1.4
5.1 5.27.2
5.63.5
WE, Best Case KPIs WE, Best Case KPIs SMR WE, Central KPIs WE, Central KPIs Natural Gas injection
3b
10 MW gas grid injection
3c
1000 MW transport
Upper: €600/tCO2
Lower: €250/tCO2
Upper: €250/tCO2
Lower: €5/tCO2
CO2 price range required for cost parity with natural gas:
1 Average PEM and Alkaline values. Electricity price strategy: off-grid renewable electricity only (wind farm, 31% load factor), no provision of grid balancing services
Gas Injection • The analysis suggests that water electrolysers are unlikely to compete effectively with natural gas injection given current price projections,
regardless of their size or cost/efficiency improvement, unless otherwise supported via targeted policy interventions (e.g. gas grid decarbonisation targets, renewable heat incentives, CO2 pricing etc.). For example, the analysis suggest that the CO2 price required to achieve cost parity with gas injection should range between circa € 250-600/tCO2 (depending on the scenario and technology choice)
Transport application • Large scale (>1000MW) centralised WE systems dedicated to the production of hydrogen for transport applications perform as smaller systems (~
20MW, see case 1d) but are still less cost competitive than on-site (decentralised) solutions (see cases 1a-c) . As for case 1d, this is because 1) the system specific capex (€/MW installed) are not modelled to scale with size; 2) off-site hydrogen production implies extra hydrogen distribution costs; and 3) additional costs are involved in geological storage in off-site production.
Hydrogen cost at the nozzle2, €/Kg Hydrogen cost 1, €/Kg (CO2 price excluded) (CO2 price excluded)
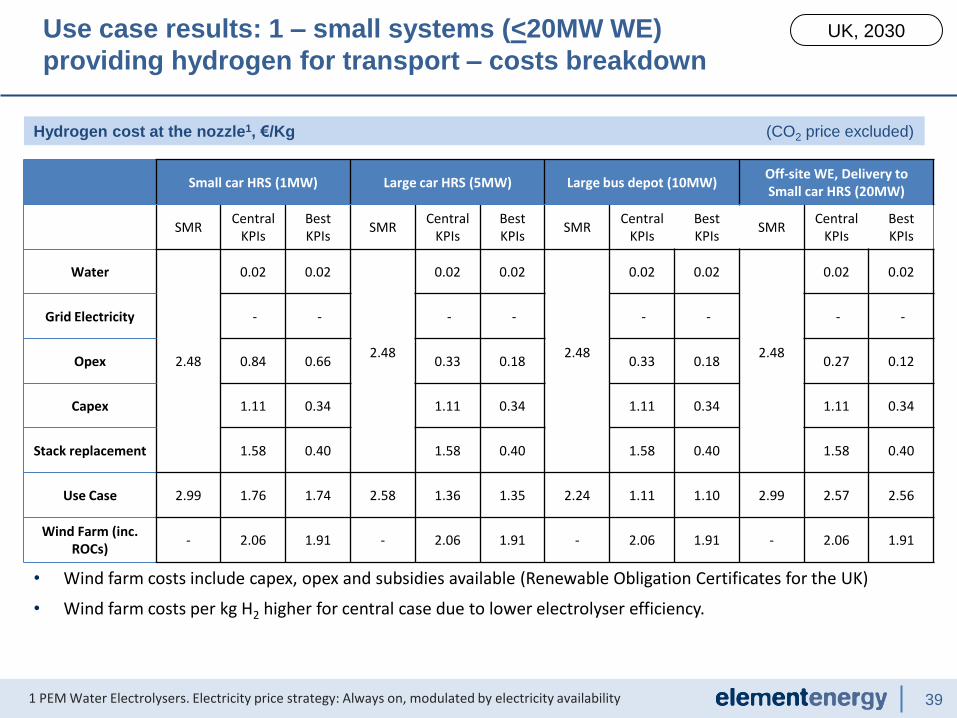
39 1 PEM Water Electrolysers. Electricity price strategy: Always on, modulated by electricity availability
Hydrogen cost at the nozzle1, €/Kg (CO2 price excluded)
Use case results: 1 – small systems (<20MW WE)
providing hydrogen for transport – costs breakdown
UK, 2030
Small car HRS (1MW) Large car HRS (5MW) Large bus depot (10MW) Off-site WE, Delivery to Small car HRS (20MW)
SMR Central
KPIs Best KPIs
SMR Central
KPIs Best KPIs
SMR Central
KPIs Best KPIs
SMR Central
KPIs Best KPIs
Water
2.48
0.02 0.02
2.48
0.02 0.02
2.48
0.02 0.02
2.48
0.02 0.02
Grid Electricity - - - - - - - -
Opex 0.84 0.66 0.33 0.18 0.33 0.18 0.27 0.12
Capex 1.11 0.34 1.11 0.34 1.11 0.34 1.11 0.34
Stack replacement 1.58 0.40 1.58 0.40 1.58 0.40 1.58 0.40
Use Case 2.99 1.76 1.74 2.58 1.36 1.35 2.24 1.11 1.10 2.99 2.57 2.56
Wind Farm (inc. ROCs)
- 2.06 1.91 - 2.06 1.91 - 2.06 1.91 - 2.06 1.91
• Wind farm costs include capex, opex and subsidies available (Renewable Obligation Certificates for the UK)
• Wind farm costs per kg H2 higher for central case due to lower electrolyser efficiency.

40
Hydrogen cost at the nozzle1, €/Kg (CO2 price excluded)
Use case results: 2 – systems producing industrial
hydrogen – costs breakdown
UK, 2030
10 MW 100 MW 250 MW
SMR Central
KPIs Best KPIs SMR
Central KPIs
Best KPIs SMR Central
KPIs Best KPIs
Water
2.48
0.02 0.02
2.48
0.02 0.02
2.48
0.02 0.02
Grid Electricity - - - - - -
Opex 0.33 0.18 0.23 0.08 0.21 0.07
Capex 1.11 0.34 1.11 0.34 1.11 0.34
Stack replacement 1.58 0.40 1.58 0.40 1.58 0.40
Use Case 1.95 1.76 1.76 1.01 0.83 0.83 0.73 0.54 0.54
Wind Farm (inc. ROCs)
- 2.06 1.91 - 2.06 1.91 - 2.06 1.91
1 PEM Water Electrolysers. Electricity price strategy: Always on, modulated by electricity availability
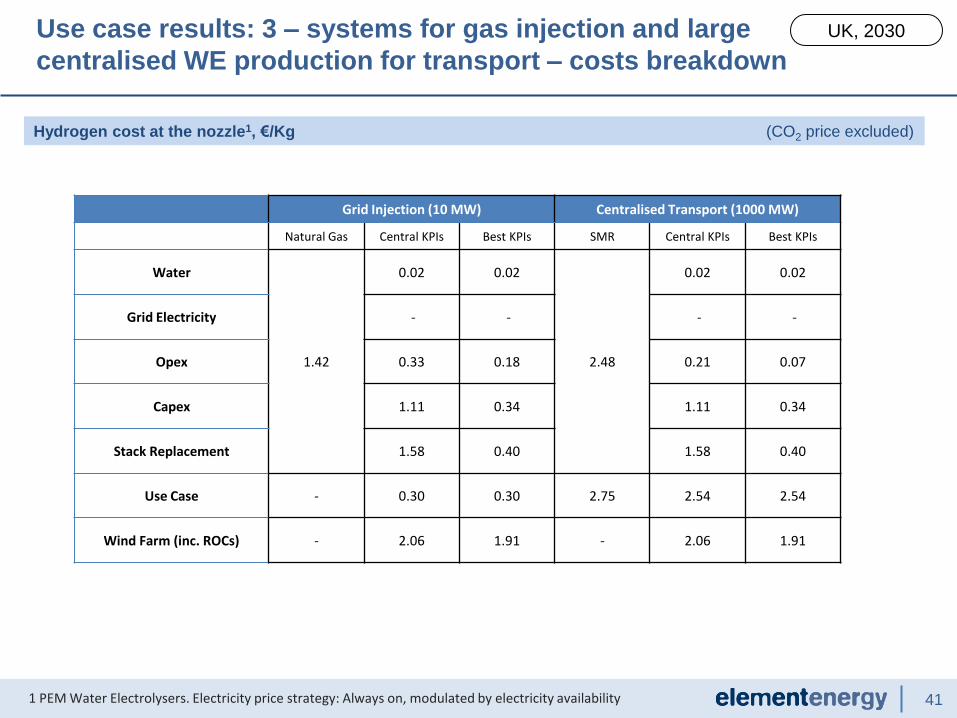
41
Hydrogen cost at the nozzle1, €/Kg (CO2 price excluded)
Use case results: 3 – systems for gas injection and large
centralised WE production for transport – costs breakdown
UK, 2030
Grid Injection (10 MW) Centralised Transport (1000 MW)
Natural Gas Central KPIs Best KPIs SMR Central KPIs Best KPIs
Water
1.42
0.02 0.02
2.48
0.02 0.02
Grid Electricity - - - -
Opex 0.33 0.18 0.21 0.07
Capex 1.11 0.34 1.11 0.34
Stack Replacement 1.58 0.40 1.58 0.40
Use Case - 0.30 0.30 2.75 2.54 2.54
Wind Farm (inc. ROCs) - 2.06 1.91 - 2.06 1.91
1 PEM Water Electrolysers. Electricity price strategy: Always on, modulated by electricity availability

42
UK – overarching conclusions
Transport • As with Germany, the analysis suggests that the best application for water electrolysis (WE) in the UK is hydrogen
production for the transport sector (Use case 1a-1d)
• Due to the higher wholesale electricity prices and electricity transmission/distribution charges (see Appendix) water electrolysers are likely to be cost competitive compared to centralised SMR production when
1. Technologies achieve the cost and efficiency improvements implied by the Best Case KPIs scenario
2. Powered with low cost electricity close to the point of generation (e.g. WE directly connected to a local renewable generator such as a wind farm)
3. With larger policy or regulatory support to lower the effective price of electricity to grid connected electrolysers
• Water electrolyser technologies that offer a wider operational range via lower minimum load factors appear better suited to capture volatile renewable generation in off-grid scenarios, and therefore ensure a higher annual load factor.
Other applications
• WEs are unlikely to compete against natural gas-based solutions (Use case 2a-2c, 3b) in the other applications analysed in this study by 2030 (hydrogen for industrial consumption and gas injection) unless supported by a targeted policy intervention (e.g. gas grid / industrial decarbonisation targets / mandate, renewable heat incentives, CO2 pricing, etc.)
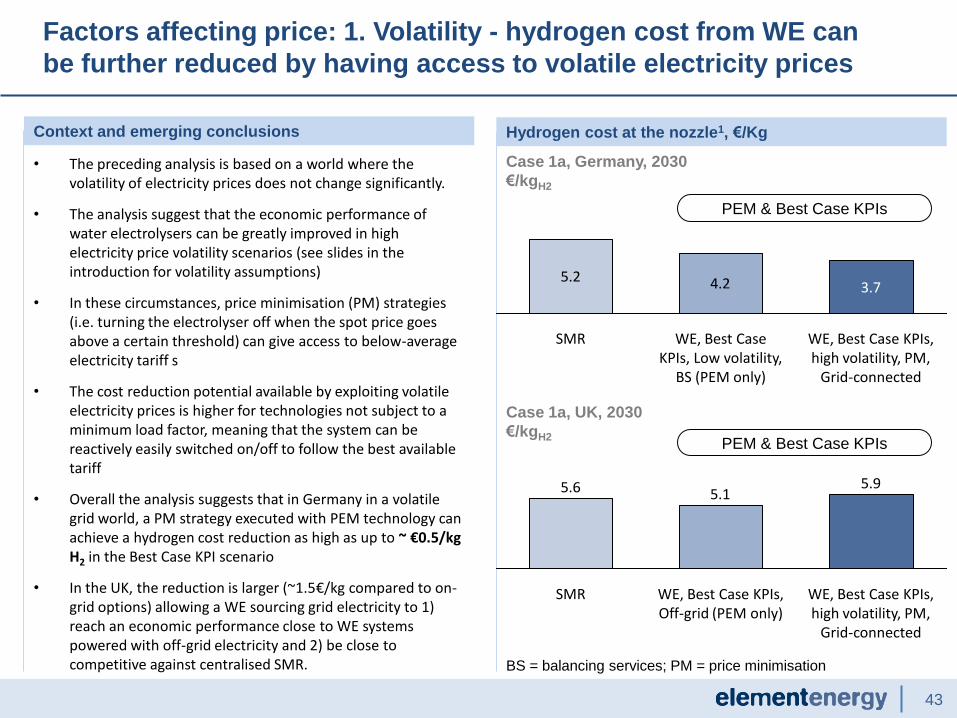
43
Factors affecting price: 1. Volatility - hydrogen cost from WE can
be further reduced by having access to volatile electricity prices
Context and emerging conclusions
• The preceding analysis is based on a world where the volatility of electricity prices does not change significantly.
• The analysis suggest that the economic performance of water electrolysers can be greatly improved in high electricity price volatility scenarios (see slides in the introduction for volatility assumptions)
• In these circumstances, price minimisation (PM) strategies (i.e. turning the electrolyser off when the spot price goes above a certain threshold) can give access to below-average electricity tariff s
• The cost reduction potential available by exploiting volatile electricity prices is higher for technologies not subject to a minimum load factor, meaning that the system can be reactively easily switched on/off to follow the best available tariff
• Overall the analysis suggests that in Germany in a volatile grid world, a PM strategy executed with PEM technology can achieve a hydrogen cost reduction as high as up to ~ €0.5/kg H2 in the Best Case KPI scenario
• In the UK, the reduction is larger (~1.5€/kg compared to on-grid options) allowing a WE sourcing grid electricity to 1) reach an economic performance close to WE systems powered with off-grid electricity and 2) be close to competitive against centralised SMR.
Hydrogen cost at the nozzle1, €/Kg
5.23.74.2
WE, Best Case KPIs, high volatility, PM,
Grid-connected
WE, Best Case KPIs, Low volatility,
BS (PEM only)
SMR
Case 1a, Germany, 2030
€/kgH2
5.6 5.95.1
WE, Best Case KPIs, high volatility, PM,
Grid-connected
WE, Best Case KPIs, Off-grid (PEM only)
SMR
Case 1a, UK, 2030
€/kgH2 PEM & Best Case KPIs
PEM & Best Case KPIs
BS = balancing services; PM = price minimisation

44
Factors affecting price: 2. outlet pressure - Increasing WE outlet
pressure leads to relatively small reductions in hydrogen costs
Context and emerging conclusions
• Data gathered for PEM electrolysers suggest that future systems could produce hydrogen at a higher pressures with little efficiency penalty (self pressurised systems).
• In these circumstances, less electrical energy is required in the first compression step up to the on-site bulk storage pressure.
• Depending on the electrolyser output pressure, some cost reduction can be expected from compressor capex/opex, though it would still be necessary to procure a compressor of some form even at the highest output pressure.
• Savings in compression costs are likely to be in the order of ~€0.20/kgH2
when moving from 1 to 30 bar, and an further reduction of ~€0.05/kgH2 when moving from 30 to 100 bar pressures.
Compression and Distribution Costs, €/kgH2
Production
at 30 bar
Production
at 100 bar
Compression step:140 bar
Compression step:70 bar
On-site bulk
storage
(170bar),
compression
step to 500bar,
truck delivery to
HRS
B
C
Pathway investigated: delivery via gaseous truck (1d)
1st compression step
Source: H2A
Production
at 1 bar
Compression
step:4 bar A
0.16 0.16 0.16
0.590.43 0.43
0.180.180.18
0.08
0.130.85
1 bar 30 bar
0.04 0.81
1.06
100 bar
Distribution: Diesel
Compression Capex and Opex
Distribution: Truck
Compression Electricity Usage
Compression
step:25 bar Compression
step:140 bar

45
PEM - Hydrogen cost at the nozzle, €/Kg
Pathway investigated: delivery via gaseous truck (1d)
Note: Compression and distribution costs derived from DOE H2A model
2.78 2.89 2.93
-0.64-0.63-0.61
0.180.180.18
0.160.160.16
0.430.430.59
0.040.080.13
1 bar
42.77kWh/kg
5.02
1.80 1.79
100 bar
45.1kWh/kg
4.90
1.80
30 bar
44.5kWh/kg
4.91
Balancing Services
Production Costs
Dispensing (HRS)
Distribution: Diesel
Distribution: Truck
Compression Capex and Opex
Compression Electricity Usage
Discussion
• By increasing output pressure from 1 bar to 100 bar, ~€0.25/kgH2 in compressor capex/opex and electricity consumption costs can be avoided.
• However, internal electrochemical compression in the electrolyser results in a higher specific electricity input required (higher voltage required) compared to unpressurised operation, indicated on the graph label for each pressure.
• Reduction in compressor cost is partially offset by higher energy input required per kg H2, leading to an increase in production costs. • Modest reductions in hydrogen cost at the nozzle, on the order of €0.10/kgH2 can be expected by moving from systems with 1 bar to
100 bar output pressure.
0.16 0.16 0.16
0.08
0.18
0.43
1 bar
1.06
0.18
0.85
100 bar
0.81
0.18
0.43
0.04
30 bar
0.59
0.13
Distribution: Diesel
Distribution: Truck
Compression Electricity Usage
Compression Capex and Opex
Compression and Distribution Costs
€/kgH2
Factors affecting price: 2. outlet pressure - Increasing WE outlet
pressure leads to relatively small reductions in hydrogen costs
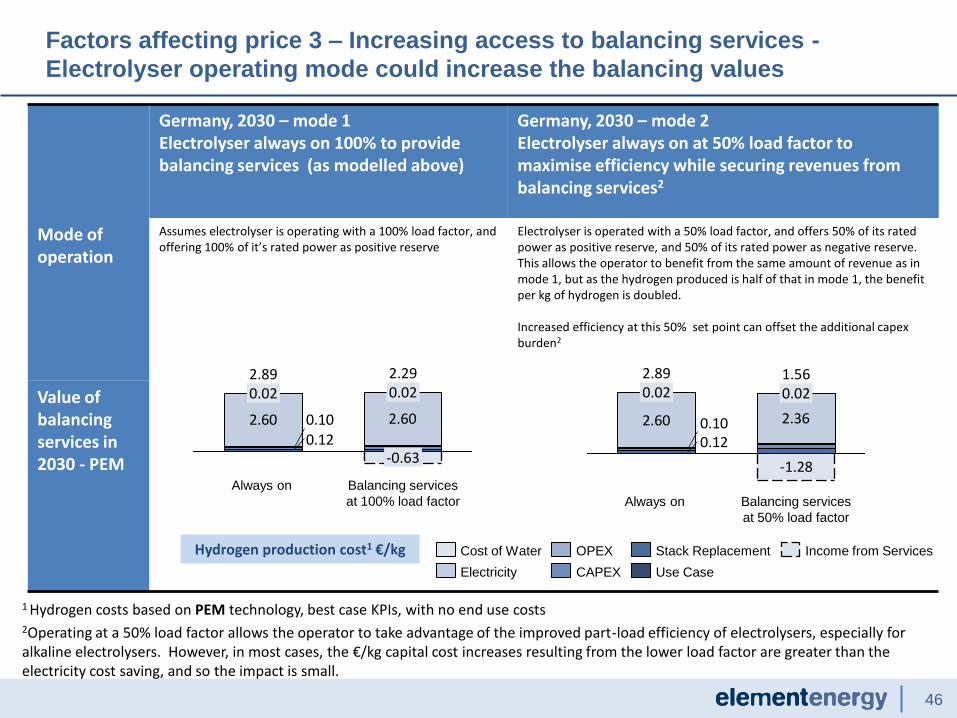
46
Factors affecting price 3 – Increasing access to balancing services -
Electrolyser operating mode could increase the balancing values
1 Hydrogen costs based on PEM technology, best case KPIs, with no end use costs
2Operating at a 50% load factor allows the operator to take advantage of the improved part-load efficiency of electrolysers, especially for alkaline electrolysers. However, in most cases, the €/kg capital cost increases resulting from the lower load factor are greater than the electricity cost saving, and so the impact is small.
Germany, 2030 – mode 1 Electrolyser always on 100% to provide balancing services (as modelled above)
Germany, 2030 – mode 2 Electrolyser always on at 50% load factor to maximise efficiency while securing revenues from balancing services2
Mode of operation
Assumes electrolyser is operating with a 100% load factor, and offering 100% of it’s rated power as positive reserve
Electrolyser is operated with a 50% load factor, and offers 50% of its rated power as positive reserve, and 50% of its rated power as negative reserve. This allows the operator to benefit from the same amount of revenue as in mode 1, but as the hydrogen produced is half of that in mode 1, the benefit per kg of hydrogen is doubled. Increased efficiency at this 50% set point can offset the additional capex burden2
Value of balancing services in 2030 - PEM
2.60 2.60
0.120.10
-0.63
Always on
2.29 0.02
Balancing services
at 100% load factor
2.89 0.02
Hydrogen production cost1 €/kg
2.60
-1.28
0.120.10 2.36
0.02 1.56 2.89
Balancing services
at 50% load factor
Always on
0.02
Income from Services
Use Case
Stack Replacement
CAPEX
OPEX
Electricity
Cost of Water

47
Factors affecting price 3 – Electrolyser operating mode could
increase the balancing values considerably for the transport case
Context and emerging conclusions
• The following analysis is based on a PEM water electrolyser with 10% lower energy input requirement at 50% load factor.
• The system is sized to satisfy all demand required by the use case, accounting for 50% load factor.
• With 2012 performance and costs, no benefits are expected from operating at part load, even if lower energy input at part load is witnessed.
• Given 2030 performance and costs (reduced energy input per kg hydrogen at rated power, lower capex), the cost of hydrogen can be reduced by up to €0.9/kgH2.
• A combination of reduction in capex, improved energy input per kg of hydrogen and an optimised operating strategy is likely to far outweigh the forecast increases in electricity price.
• Balancing services provides benefits of €1.3/kgH2 and €0.6/kgH2 at 50% and 100% target load factors, respectively.
Hydrogen cost at the nozzle1, €/Kg
4.56.1
Balancing Services, 50%
Target LF, 40MW
6.4
Balancing Services, 100%
Target LF, 20MW
SMR
Case 1d, Germany, 2012
€/kgH2
PEM & Best Case KPIs
PEM & Best Case KPIs
Balancing services limited to a maximum of 60MW per Water
Electrolyser.
Case 1d, Germany, 2030
€/kgH2
5.2 4.9
Balancing Services, 50%
Target LF, 40MW
4.1
Balancing Services, 100%
Target LF, 20MW
SMR

48
Carbon intensity of hydrogen can be reduced by
decarbonising the grid or using renewable electricity sources
0.3
4.5
7.68.59.2
21.0
18.4
UK 2030,
Off-grid
31% Wind
Farm
UK 2030,
CCC
Forecast
UK 2030,
DG
Energy
Forecast
Germany
2030, DG
Energy
Forecast
SMR 2030 Germany
2012, Grid-
Connected
UK 2012,
Grid-
Connected
Embedded CO2 per kg H2 (kg CO2 / kg H2) Discussion
• Today’s grid intensity figures imply a higher CO2 intensity for grid connected electrolysers than SMR (approx 100% higher)
• However, this may overstate the case, as if electrolysers are providing grid services, they are offsetting other potentially more carbon intensive ways of providing the same services.
• Further work is required to quantify the benefits of electrolysers to the grid in this case.
• Even in 2012, it is possible to source 100% green electricity and hence decarbonise the hydrogen generated.
• With projected decarbonisation targets in both the UK and Germany, this conclusion is reversed by 2030 and grid connected water electrolysers can offer significant carbon benefits per unit of hydrogen (depending on which CO2 intensity projection is used)
• Alternatively, electrolysers which are directly linked to renewable generators, and import little/no electricity from the grid can produce hydrogen with very little embedded CO2 per kg.
Assumptions: • PEM & Best Case KPIs, with Response Services, Grid-connected
unless stated • Germany 2030, DG Energy Forecast1 – Grid CO2 intensity:
190g/kWh • UK 2030, DG Energy Forecast1 – Grid CO2 intensity: 170g/kWh • UK 2030, Committee for Climate Change Forecast – Grid CO2
intensity: 100g/kWh • UK 2030, Off-grid 31% wind farm – Generator CO2 intensity:
7g/kWh
1 European Commission – Directorate General of Energy, “EU Energy Trends to 2030”, Update 2009
49
• Introduction to the techno economic model and data
• Results of the techno-economic modelling
• Target setting: sensitivity of the hydrogen price to the key
parameters
• Conclusions
• Appendices
• Energy markets and data
• Electrolyser operating modes

50
10
20
30
40
50
60
70
80
90
100
110
10
20
30
40
50
60
70
80
90
10
0
11
0
Nat
ura
l Gas
Pri
ce (
€/M
Wh
)
Wholesale Electricity Price (€/MWh)
4-6
2-4
0-2
-2-0
-4--2
-6--4
10
20
30
40
50
60
70
80
90
100
110
10
20
30
40
50
60
70
80
90
10
0
11
0
Nat
ura
l Gas
Pri
ce (
€/M
Wh
)
Wholesale Electricity Price (€/MWh)
2-4
0-2
-2-0
-4--2
-6--4
-8--6
Competitiveness of electrolysers is fundamentally affected by the
costs of natural gas and electricity (transport case)
Discussion
1 DG Ener – REF 2 Department of Energy and Climate Change – REF
Different in H2 cost between WE and SMR, €/kg
Use Case 1a, UK, 2030, Grid Connected
Different in H2 cost between WE and SMR, €/kg
Use Case 1a, Germany, 2030, Grid Connected
WE H2 Cost –
SMR H2 Cost
PEM & Best Case KPIs, with
Response Services
PEM & Best Case KPIs, with
Response Services
• Grid-connected water electrolysers are sensitive to both natural gas price (for counterfactual SMR production) and wholesale electricity cost. In this grid-connected scenario, some barriers to cost parity with SMR remain in the UK, in the form of high network charges. With moderate support or revisions to the regulatory regime as in Germany , distributed grid-connected systems can challenge SMR on cost terms in transport applications. In the UK, transmission and distribution network charges add substantially to the total electricity cost, hence a lower wholesale electricity price is required to achieve parity than in Germany.
• Two projections for electricity and natural gas prices from DG Energy1 and DECC2 are plotted for the UK and Germany– DECC does not publish projections for Germany.
UK – DG Energy
UK – DECC Central
DE – DG Energy
WE H2 Cost –
SMR H2 Cost

51
10
20
30
40
50
60
70
80
90
100
110
10
20
30
40
50
60
70
80
90
10
0
11
0
Nat
ura
l Gas
Pri
ce (
€/M
Wh
)
Wholesale Electricity Price (€/MWh)
4-6
2-4
0-2
-2-0
-4--2
-6--4
10
20
30
40
50
60
70
80
90
100
110
10
20
30
40
50
60
70
80
90
10
0
11
0
Nat
ura
l Gas
Pri
ce (
€/M
Wh
)
Wholesale Electricity Price (€/MWh)
2-4
0-2
-2-0
-4--2
-6--4
The use of electrolyser for industrial hydrogen is similarly affected
Discussion
Different in H2 cost between WE and SMR, €/kg
Use Case 2a, UK, 2030, Grid Connected
Different in H2 cost between WE and SMR, €/kg
Use Case 2a, Germany, 2030, Grid Connected
WE H2 Cost –
SMR H2 Cost
PEM & Best Case KPIs, with
Response Services
PEM & Best Case KPIs, with
Response Services
• In the UK, grid-connected water electrolysers appear far from bring competitive with SMR in provision of industrial heat, due in part to high network charges when connected to the grid.
• In Germany, targets in line with Task 1 or small changes in the electricity or natural gas price could lead to such systems being viable.
WE H2 Cost –
SMR H2 Cost
DE – DG Energy
UK – DG Energy
UK – DECC Central
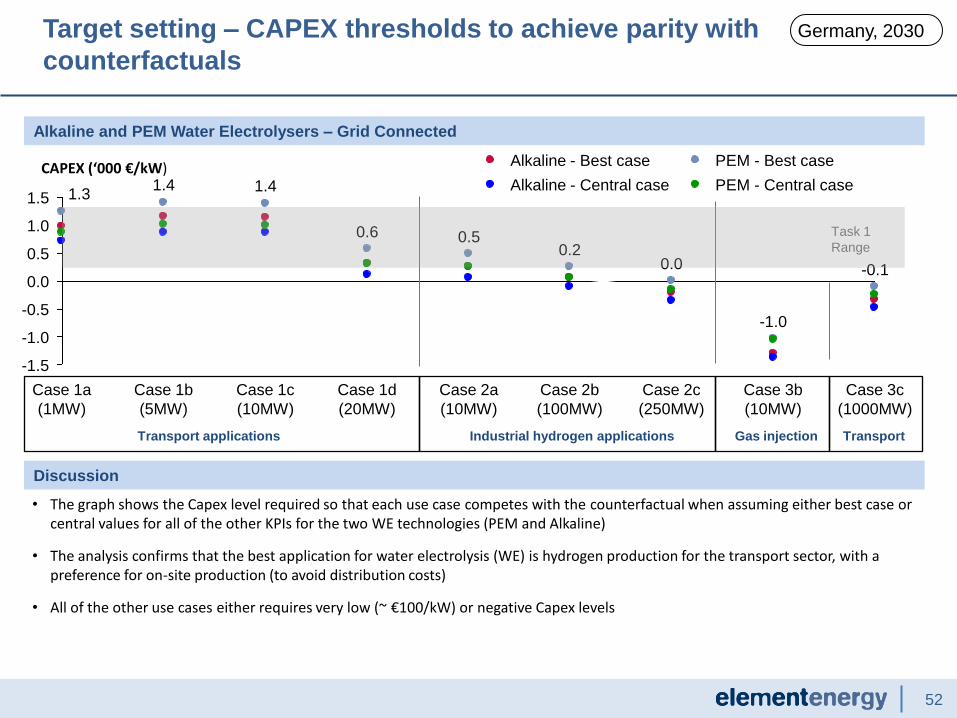
52
Target setting – CAPEX thresholds to achieve parity with
counterfactuals
• The graph shows the Capex level required so that each use case competes with the counterfactual when assuming either best case or central values for all of the other KPIs for the two WE technologies (PEM and Alkaline)
• The analysis confirms that the best application for water electrolysis (WE) is hydrogen production for the transport sector, with a preference for on-site production (to avoid distribution costs)
• All of the other use cases either requires very low (~ €100/kW) or negative Capex levels
Germany, 2030
1.5
-0.5
0.0
0.5
1.0
-1.0
-1.5
Case 3c
(1000MW)
Case 2b
(100MW)
1.4
Case 2a
(10MW)
0.0
0.6
Case 1c
(10MW)
-0.1
0.2
Case 1d
(20MW)
0.5
Case 2c
(250MW)
Case 3b
(10MW)
Case 1b
(5MW)
1.4
Case 1a
(1MW)
1.3
-1.0
Alkaline and PEM Water Electrolysers – Grid Connected
Discussion
PEM - Central case
PEM - Best case Alkaline - Best case
Alkaline - Central case
Transport applications Industrial hydrogen applications Gas injection Transport
CAPEX (‘000 €/kW)
Task 1
Range
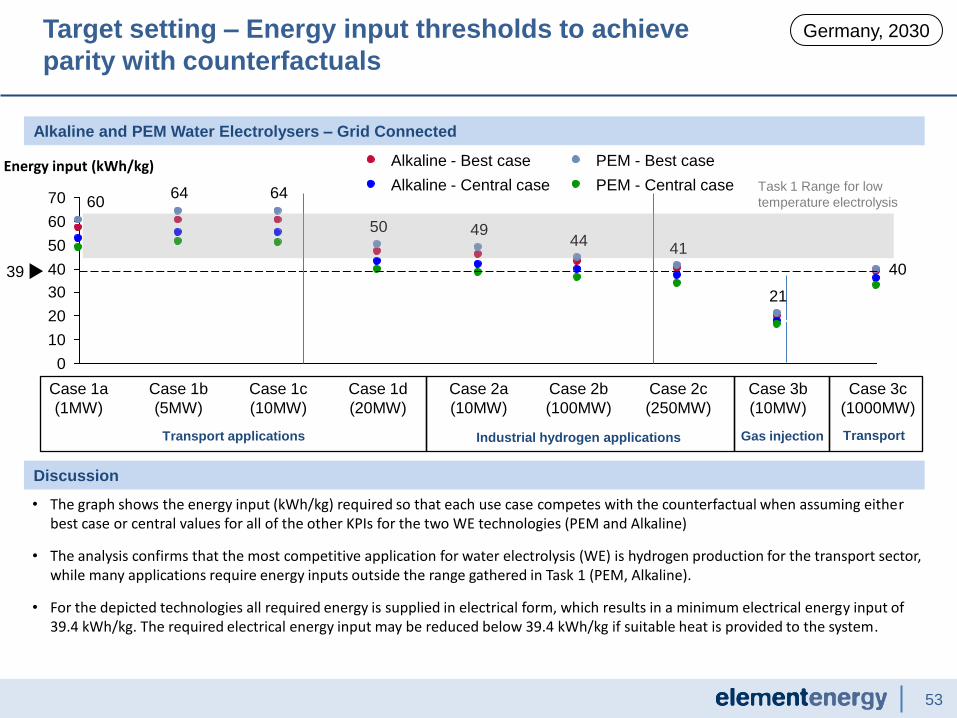
53
Target setting – Energy input thresholds to achieve
parity with counterfactuals
Germany, 2030
40
21
4144
4950
646460
0
10
20
30
40
50
60
70
Energy input (kWh/kg)
39
Case 3c
(1000MW)
Case 3b
(10MW)
Case 2c
(250MW)
Case 2b
(100MW)
Case 2a
(10MW)
Case 1d
(20MW)
Case 1c
(10MW)
Case 1b
(5MW)
Case 1a
(1MW)
Alkaline and PEM Water Electrolysers – Grid Connected
PEM - Central case
PEM - Best case
Alkaline - Central case
Alkaline - Best case
• The graph shows the energy input (kWh/kg) required so that each use case competes with the counterfactual when assuming either best case or central values for all of the other KPIs for the two WE technologies (PEM and Alkaline)
• The analysis confirms that the most competitive application for water electrolysis (WE) is hydrogen production for the transport sector, while many applications require energy inputs outside the range gathered in Task 1 (PEM, Alkaline).
• For the depicted technologies all required energy is supplied in electrical form, which results in a minimum electrical energy input of 39.4 kWh/kg. The required electrical energy input may be reduced below 39.4 kWh/kg if suitable heat is provided to the system.
Transport applications Industrial hydrogen applications Gas injection Transport
Discussion
Task 1 Range for low
temperature electrolysis

54
Target setting – Carbon price to achieve parity with
counterfactuals
-200
-100
0
100
200
300
CO2 price required to compete (€/t CO2)
44
Case 3c
(1000MW)
Case 3b
(10MW)
Case 2c
(250MW)
Case 2b
(100MW)
Case 2a
(10MW)
Case 1d
(20MW)
Case 1c
(10MW)
Case 1b
(5MW)
Case 1a
(1MW)
Alkaline and PEM Water Electrolysers – Grid Connected
Discussion
PEM - Best case
PEM - Central case Alkaline - Central case
Alkaline - Best case
Germany, 2030
Transport applications Industrial hydrogen applications Gas injection Transport
• The graph shows the CO2 price required so that each use case competes with the counterfactual when assuming either best case or central values for all of the other KPIs for the two WE technologies (PEM and Alkaline)
• With best case KPIs the industrial use cases are within the range of the expected carbon price in Germany in 2030 – suggesting that they are within reach of policy intervention.
• A similar conclusion applies to large scale transport applications, though for these applications, the central KPIs are some way from a plausible carbon price.
• Gas injection applications do not appear competitive with the counterfactual due to the relatively small increase in gas price by 2030, and the low embedded CO2 content of natural gas.
2030 Carbon price projection

55
Target setting – CAPEX thresholds to achieve parity with
counterfactuals
UK, 2030
0.6
0.4
0.2
0.0
-0.2
-0.6
-0.4
Case 3c
(1000MW)
0.2
Case 3b
(10MW)
-0.3
Case 2c
(250MW)
0.2
Case 2b
(100MW)
0.2
Case 2a
(10MW)
0.2
Case 1d
(20MW)
0.3
Case 1c
(10MW)
0.5
Case 1b
(5MW)
0.6
Case 1a
(1MW)
0.4
Alkaline and PEM Water Electrolysers – Off-grid, 31% Wind Farm Connection
Discussion
Alkaline - Central case PEM - Central case
PEM - Best case Alkaline - Best case
Transport applications Industrial hydrogen applications Gas injection Transport
CAPEX (‘000 €/kW)
• The graph shows the Capex level required so that each use case competes with the counterfactual when assuming either best case or central values for all of the other KPIs for the two WE technologies (PEM and Alkaline)
• The analysis confirms that the best application for water electrolysis (WE) is hydrogen production for the transport sector, with a preference for on-site systems as for the German case
• All of the other use cases either requires very low (~ €100/kW) or negative Capex levels
Task 1
Range

56
Target setting – Energy input thresholds to achieve parity
with counterfactuals
44
18
44434246
5659
51
0
10
20
30
40
50
60
Energy input (kWh/kg)
39
Case 3c
(1000MW)
Case 3b
(10MW)
Case 2c
(250MW)
Case 2b
(100MW)
Case 2a
(10MW)
Case 1d
(20MW)
Case 1c
(10MW)
Case 1b
(5MW)
Case 1a
(1MW)
Alkaline and PEM Water Electrolysers – Off-grid, 31% Wind Farm Connection
Discussion
PEM - Best case
PEM - Central case Alkaline - Central case
Alkaline - Best case
UK, 2030
Transport applications Industrial hydrogen applications Gas injection Transport
• The graph shows the energy input (kWh/kg) required so that each use case competes with the counterfactual when assuming either best case or central values for all of the other KPIs for the two WE technologies (PEM and Alkaline)
• The analysis confirms that the best application for water electrolysis (WE) is hydrogen production for the transport sector
• Industrial hydrogen applications and large off-site WE for transport applications could become more economically viable should the efficiency of the WEs achieve best case KPIs an energy input of less than 40 kWh/kg (e.g. close to 100% efficiency) . All of the other use cases requires unphysical (greater than 100%) efficiencies (this assuming the H2 energy content ~ 39.4 kWh/kg HHV)
Task 1 Range for low
temperature electrolysis
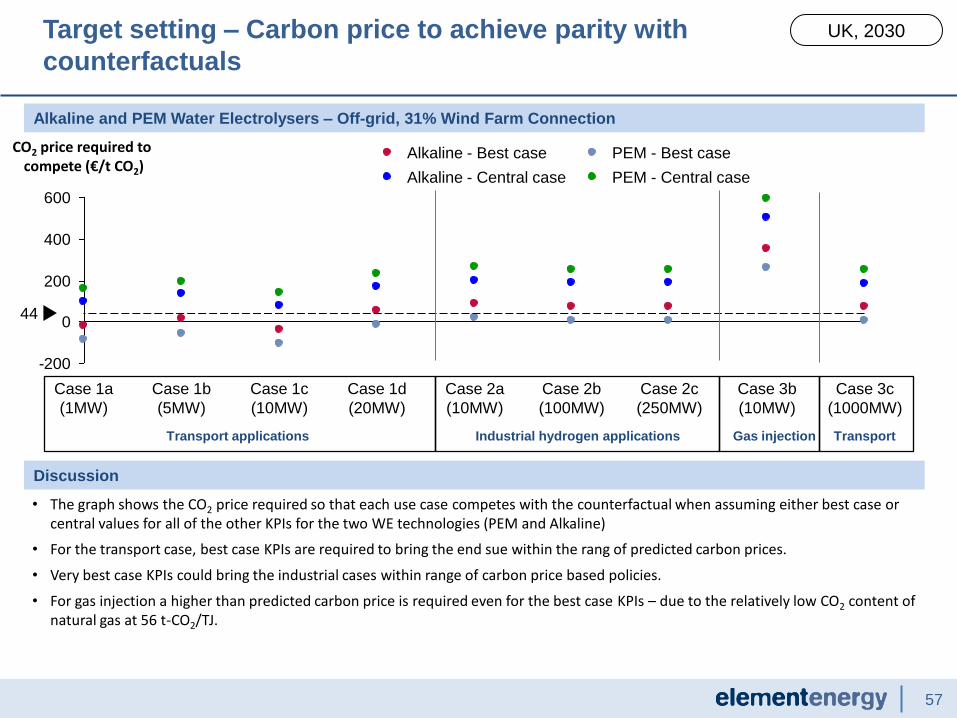
57
Target setting – Carbon price to achieve parity with
counterfactuals
-200
0
200
400
600
CO2 price required to compete (€/t CO2)
44
Case 3c
(1000MW)
Case 3b
(10MW)
Case 2c
(250MW)
Case 2b
(100MW)
Case 2a
(10MW)
Case 1d
(20MW)
Case 1c
(10MW)
Case 1b
(5MW)
Case 1a
(1MW)
Alkaline and PEM Water Electrolysers – Off-grid, 31% Wind Farm Connection
Discussion
PEM - Best case
PEM - Central case Alkaline - Central case
Alkaline - Best case
UK, 2030
Transport applications Industrial hydrogen applications Gas injection Transport
• The graph shows the CO2 price required so that each use case competes with the counterfactual when assuming either best case or central values for all of the other KPIs for the two WE technologies (PEM and Alkaline)
• For the transport case, best case KPIs are required to bring the end sue within the rang of predicted carbon prices.
• Very best case KPIs could bring the industrial cases within range of carbon price based policies.
• For gas injection a higher than predicted carbon price is required even for the best case KPIs – due to the relatively low CO2 content of natural gas at 56 t-CO2/TJ.
58
• Introduction to the techno economic model and data
• Results of the techno-economic modelling
• Target setting: sensitivity of the hydrogen price to the key
parameters
• Conclusions
• Appendices
• Energy markets and data
• Electrolyser operating modes

59
• The techno-economic modelling reveals the sensitivity of any conclusions on the viability of different electrolyser uses to the assumptions about industrial electricity and gas prices in different markets.
• The price of these commodities is a regulatory issue, particularly for electricity. For example, the exemptions from taxes and network charges that can be available to an electrolyser operator in Germany can lead to an input electricity cost approximately 50% lower than the equivalent operator in the UK.
• The cost of balancing services will affect the strategy adopted for generating hydrogen and this again is affected by regulation. In 2012, the best strategy for operating electrolysers appears to be operating at high load factor to provide balancing services – this mode allows a high load factor for the electrolyser (which ensures good utilisation of a capital intensive asset), whilst reducing the effective price of electricity for the system. This conclusion only applies in markets where balancing services apply for demand response. In markets such as Poland, this is not possible and hence electrolysers will struggle to compete without a change in the regulatory regime.
• Unless the price of electricity becomes more volatile, it is likely that in Germany (for example), the strategy of continued reliance on providing balancing services will remain valid until 2030. There may be strategies to increase the value of balancing services as the cost of electrolyser decrease, which allows operation at lower load factors (e.g. 50%). At this point, the efficiency of the system is increased and it may be possible to access both positive and negative balancing benefits (by turning the electrolyser up or down), which increases the overall value of balancing services per kg of hydrogen produced.
Conclusions (1/4) – the effectiveness of electrolysers is linked to
the price of electricity, network services and gas
60
• In markets with higher industrial electricity prices due to higher network charges and taxes, a search for cheaper electricity is required. Here, as the cost of electrolysers decrease, options to generate hydrogen at the point of electricity generation (effectively offering a different market for the electricity generator)using responsive electrolysers operated at lower load factors appear most viable.
• In each case, there appears to be a trend towards electrolysers operating at lower load factors and away from their set point input, suggesting a need to be able to modulate inputs over a wide range. Furthermore, the analysis suggests that a low turn-down ratio is particularly important for electrolysers connected to very volatile sources of electricity (e.g. a wind farm) .
Transport End Use
• The analysis of use cases suggests that electrolysers will enjoy the most favourable markets in the transport sector, where the energy value of their products is higher.
• Here, in Germany using 2030 projections and even with central KPIs electrolysers appear able to compete with the incumbent option of generating hydrogen in large central SMR plants and distributing to filling stations.
• In other markets with more expensive electricity, the best case KPIs for electrolyser capex and efficiency appear to be required to ensure competition with SMR (in the absence of any supportive policies targeting the sector).
• The modelling also suggests that there is a preference for generating on-site hydrogen rather than pushing for larger centralised production facilities. This is because the high cost of distributing hydrogen is higher than the assumed benefits of operating at scale. This is a sensitive conclusion and depends on the scale advantages expected in the capital costs of large electrolyser projects (for which there is a lack of reliable data) and electricity price advantages at scale. Small changes in these assumptions affect the conclusion on the relative merit of on-site vs. large centralised electrolysers. What is clear is that there are no clear advantage for large scale electrolysis over small on-site plant once they reach beyond the 1MW+ scale.
Conclusions (2/4) – as electrolyser capital costs decrease, the
value of an ability to modulate across the power range increases

61
Non-transport uses
• The non-transport use cases (gas injection and industrial hydrogen replacement) suffer from a much lower cost counterfactual, which is dominated by the cost of natural gas. As a result, the electrolyser options struggle to compete for all but the best case KPIs for capital cost and efficiency.
• In many cases, even with best case costs and efficiencies a considerable carbon price is required to bridge the gap between the electrolyser derived hydrogen and the counterfactual.
• Only in the low electricity price regimes with favourable balancing systems (especially Germany) are these carbon prices below the projected 2030 carbon price, suggesting that electrolysers could begin to compete in these markets in 2030 if the technology develops to its lowest cost and highest performance points.
• In other markets, changes in the electricity market regulatory regime and/or a high carbon price will be needed alongside best case KPIs for the electrolysers to compete for non-transport uses.
Upsides for hydrogen price from electrolysers
• There are two plausible cases where electrolytic hydrogen costs could drop considerably below those modelled here. Hydrogen price reductions over 20% could be achieved, which are sufficient to make the non-transport cases viable with best case KPIs (and even with central KPIs in Germany):
1) increased balancing services – operating either side of nominal 50% load factors (for low cost electrolysers) could double balancing services per kg of hydrogen generated and in so doing considerably reduce the effective cost of hydrogen
2) Increased volatility of electricity prices increases the value of a strategy of controlling electrolyser output to take advantage of periods of low cost electricity
Both scenarios merit further analysis.
Conclusions (3/4) – the non-transport end uses will require best
case electrolysers KPIs and a supportive regulatory environment

62
Electricity to electricity storage
• Using hydrogen to store and then regenerate electricity incurs a high round trip efficiency penalty.
• These losses are such that in a world with today’s electricity price volatility, it is not possible to envisage a competitive scenario for using hydrogen to store electricity on a grid scale (note the analysis does not include off-grid applications for storage)
• Even in a highly volatile world with large swings in electricity price, it still appears that an additional value would be required to incentivise the storage and regeneration of electricity using hydrogen. I.e. arbitraging the market volatility using hydrogen as an electricity store is not enough on its own and a new “storage” tariff would be needed.
CO2 considerations
• At today’s grid mix carbon intensities, the carbon intensity of electrolytic hydrogen is considerably higher than that derived from SMR derived hydrogen.
• As grids decarbonise, this conclusion is reversed so that by 2030 (according to national projections), electrolysers using grid mix electricity have a lower carbon intensity than hydrogen from natural gas.
• Before then, mechanisms to justify a lower carbon status for electrolytic hydrogen will be required. These would benefit from further analysis and development of appropriate certification systems. They include:
– Use of green certificates to create a contractual link between electricity generated at a low carbon source and the electrolyser
– Direct coupling of renewable generators to electrolysers
– Better accounting for the CO2 benefits of providing grid balancing services using electrolysers instead of other more carbon intensive mechanisms (such as operating a thermal plant away from its peak efficiency).
Conclusions (4/4) – Electricity to electricity storage as a stand
alone use case appears challenging given the system efficiency
63
• Introduction to the techno economic model and data
• Results of the techno-economic modelling
• Target setting: sensitivity of the hydrogen price to the key
parameters
• Conclusions
• Appendices
• Energy markets and data
• Electrolyser operating modes

64
• Energy markets and data
• Country choice
• Data sources
• 2012 industrial electricity and gas prices
• Energy price projections
• Impact of projections on electricity and gas prices – 2030
• Carbon prices
Appendix I - Energy markets and data - subtopics
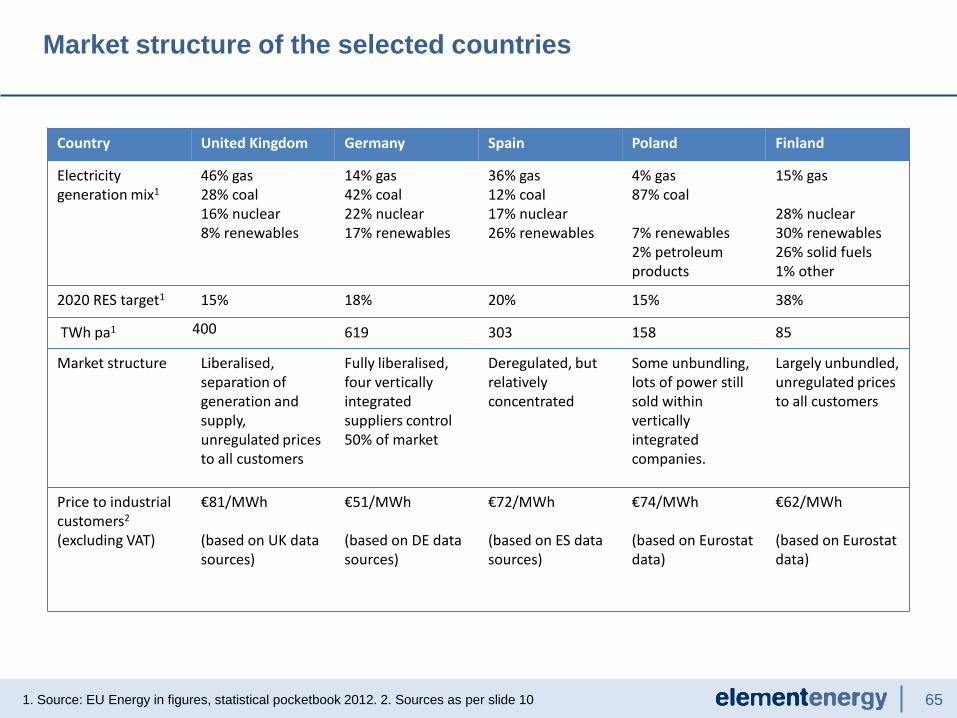
65
Country United Kingdom Germany Spain Poland Finland
Electricity generation mix1
46% gas 28% coal 16% nuclear 8% renewables
14% gas 42% coal 22% nuclear 17% renewables
36% gas 12% coal 17% nuclear 26% renewables
4% gas 87% coal 7% renewables 2% petroleum products
15% gas 28% nuclear 30% renewables 26% solid fuels 1% other
2020 RES target1 15% 18% 20% 15% 38%
TWh pa1 400 619 303 158 85
Market structure Liberalised, separation of generation and supply, unregulated prices to all customers
Fully liberalised, four vertically integrated suppliers control 50% of market
Deregulated, but relatively concentrated
Some unbundling, lots of power still sold within vertically integrated companies.
Largely unbundled, unregulated prices to all customers
Price to industrial customers2 (excluding VAT)
€81/MWh (based on UK data sources)
€51/MWh (based on DE data sources)
€72/MWh (based on ES data sources)
€74/MWh (based on Eurostat data)
€62/MWh (based on Eurostat data)
Market structure of the selected countries
1. Source: EU Energy in figures, statistical pocketbook 2012. 2. Sources as per slide 10

66
Data sources
United Kingdom Germany Spain Poland Finland
2012 spot market data APX EEX OMIE/OMEL TGE Elspot
Tariff structure for large consumers
Network charges: UK DNOs Levies/taxes: DECC Other charges: confidential project data
Network charges: Eurostat. Taxes and levies: BDEW, Exemptions/reductions: national legislation
Network charges: national data Taxes: Eurostat
Network charges and taxes from Eurostat
Network charges and taxes from Eurostat
Projections for future prices
DG ENER Energy Roadmap to 2050, Impact Assessment, 2011. Current policy initiatives scenario
Projection of future volatility
Decarbonising the GB power sector, Redpoint report to the UK Committee on Climate Change, 2009
No public price duration or frequency duration information found
Current demand and prices for balancing services
National Grid
Ampiron, Tennet TSO, 50 Hertz, Transnet BW, and Regelleistung
N/A N/A N/A
Future demand and prices for balancing services
National Grid Operating the Networks in 2020
No public projections found
N/A N/A N/A
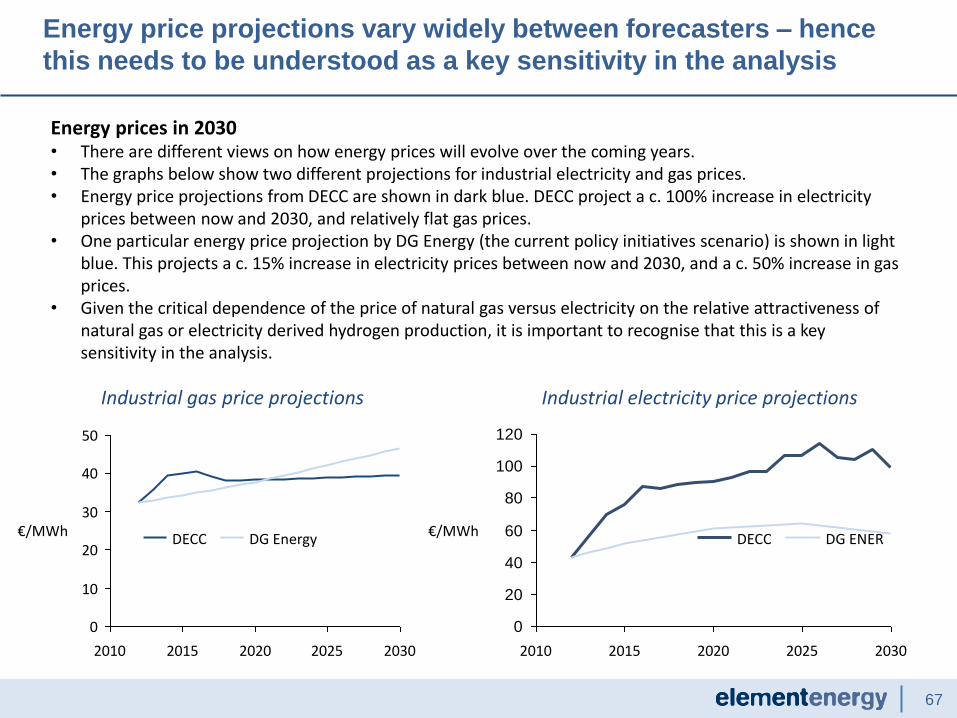
67
Energy price projections vary widely between forecasters – hence
this needs to be understood as a key sensitivity in the analysis
Energy prices in 2030 • There are different views on how energy prices will evolve over the coming years. • The graphs below show two different projections for industrial electricity and gas prices. • Energy price projections from DECC are shown in dark blue. DECC project a c. 100% increase in electricity
prices between now and 2030, and relatively flat gas prices. • One particular energy price projection by DG Energy (the current policy initiatives scenario) is shown in light
blue. This projects a c. 15% increase in electricity prices between now and 2030, and a c. 50% increase in gas prices.
• Given the critical dependence of the price of natural gas versus electricity on the relative attractiveness of natural gas or electricity derived hydrogen production, it is important to recognise that this is a key sensitivity in the analysis.
0
10
20
30
40
50
2010 2015 2020 2025 2030
€/MWh
0
20
40
60
80
100
120
2010 2015 2020 2025 2030
€/MWh DG ENER DECC DECC DG Energy
Industrial gas price projections Industrial electricity price projections

68
Energy price assumptions used are based on DG ENER forecasts
for all countries
Energy prices in 2030 • In order to ensure consistency across the analysis, we have used DG ENER forecasts of electricity and gas
price in each market to scale today’s energy prices in each market (based on spot market data). 2012 values for network costs, taxes, levies and any other charges are then added in.
• The resulting energy price forecasts for larger industrial customers are illustrated below.
96
81
4330
UK - 2012 UK - 2030
Gas price €/MWh
Electricity price €/MWh
89
74
4229
Poland - 2012 Poland - 2030
87
72
4129
Spain - 2030 Spain - 2012 77
62
42
29
Finland - 2030 Finland - 2012
66
5142
29
Germany - 2030 Germany - 2012
Electricity and gas prices in 2012 and forecasts for 2030, €/MWh
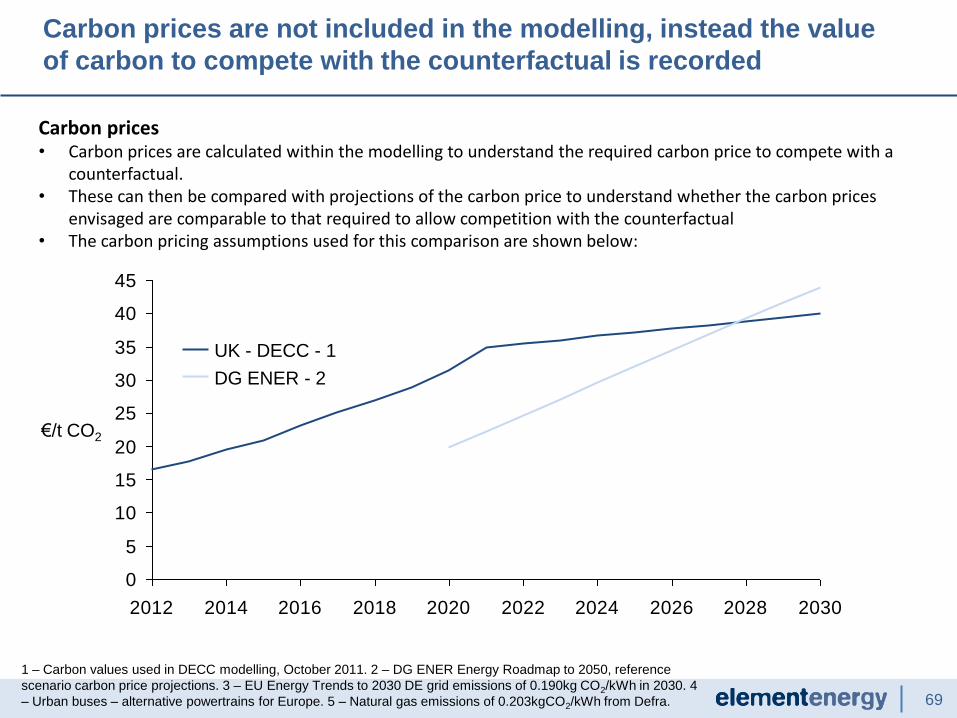
69
Carbon prices are not included in the modelling, instead the value
of carbon to compete with the counterfactual is recorded
1 – Carbon values used in DECC modelling, October 2011. 2 – DG ENER Energy Roadmap to 2050, reference
scenario carbon price projections. 3 – EU Energy Trends to 2030 DE grid emissions of 0.190kg CO2/kWh in 2030. 4
– Urban buses – alternative powertrains for Europe. 5 – Natural gas emissions of 0.203kgCO2/kWh from Defra.
Carbon prices • Carbon prices are calculated within the modelling to understand the required carbon price to compete with a
counterfactual. • These can then be compared with projections of the carbon price to understand whether the carbon prices
envisaged are comparable to that required to allow competition with the counterfactual • The carbon pricing assumptions used for this comparison are shown below:
0
5
10
15
20
25
30
35
40
45
2012 2014 2016 2018 2020 2022 2024 2026 2028 2030
€/t CO2
UK - DECC - 1
DG ENER - 2

70
• Electrolyser operating modes
• 100% load factor
• Price minimisation
• Balancing services
• Accessing low cost electricity via a renewable generator
Appendix II - Electrolyser operating modes - subtopics

71
The simplest electrolyser operating mode is to maximise use of the
system by achieving a 100% load factor
2.6
4.32.52.4
0.1 0.1
Germany SMR, 2030 UK SMR, 2030
0.1
2.9
0.1
UK, Grid Connected, 2030
4.6
0.1 0.1
Germany, Grid Connected, 2030
Stack Replacement
CAPEX
OPEX
Electricity
SMR
PEM & Best Case KPIs
2030
Hydrogen cost at the electrolyser, €/Kg
Even though this strategy aims to maximum use of the equipment, and hence reduce the capital cost per unit of hydrogen produced, the electricity costs dominate.
This highlights the value of looking to reduce electricity prices or gain additional revenue by offering services to the grid.

72
It is clear that electrolysers need to access low cost electricity in order to become close to competitive with SMR produced hydrogen. We have therefore investigated a number of strategies for reducing electricity costs/increasing revenues:
We have also considered combinations of the first three strategies above
Strategies to access low cost electricity
Price minimisation - A threshold electricity price is set, above which the electrolyser will be switched off. This aims to keep costs to a minimum.
Response and reserve - Electrolyser is operated to access additional revenues by providing response and reserve services. In this scenario the electrolyser is always on, unless the system operator requests it to be turned off.
Grid reinforcement - Electrolysers located in strategic places for the electricity network can avoid the need for expensive, and underutilised transmission and distribution upgrades required to accommodate peak output of intermittent generation.
Access to low cost electricity which would not otherwise be able to connect to the grid – e.g. where transmission capacity means they would face constraints, or specific locations where the connection costs could be high, and timescales for connection could be long.
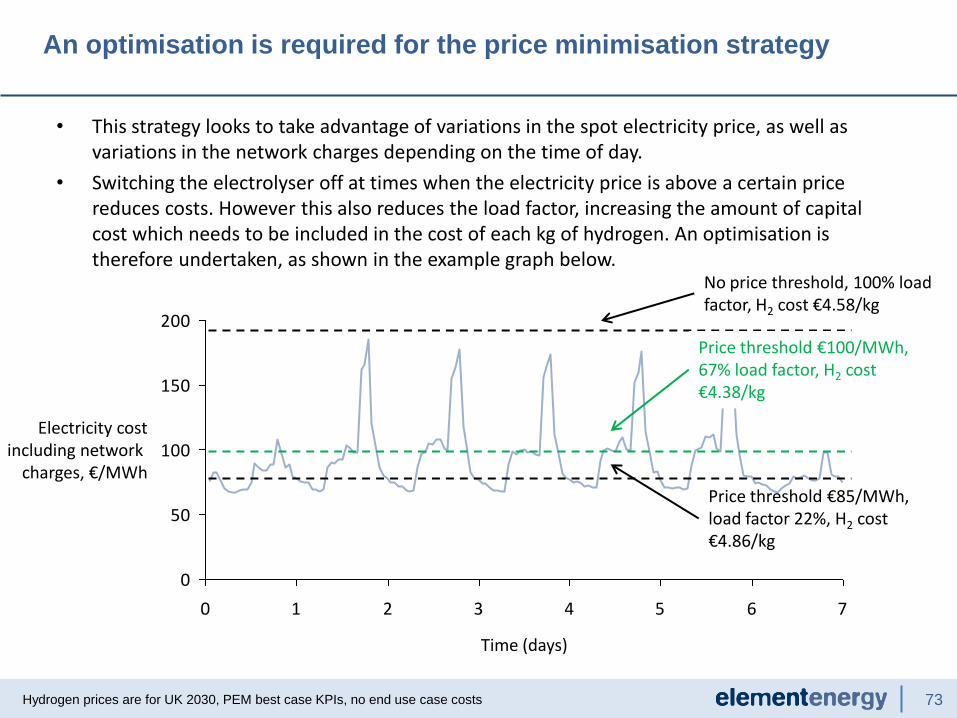
73
• This strategy looks to take advantage of variations in the spot electricity price, as well as variations in the network charges depending on the time of day.
• Switching the electrolyser off at times when the electricity price is above a certain price reduces costs. However this also reduces the load factor, increasing the amount of capital cost which needs to be included in the cost of each kg of hydrogen. An optimisation is therefore undertaken, as shown in the example graph below.
An optimisation is required for the price minimisation strategy
Hydrogen prices are for UK 2030, PEM best case KPIs, no end use case costs
0
50
100
150
200
0 1 2 3 4 5 6 7
Electricity cost including network
charges, €/MWh
Time (days)
No price threshold, 100% load factor, H2 cost €4.58/kg
Price threshold €100/MWh, 67% load factor, H2 cost €4.38/kg
Price threshold €85/MWh, load factor 22%, H2 cost €4.86/kg

74
Electrolysers can access additional revenues by offering
balancing services
• Changes in supply and demand before “gate closure” for the delivery hour in question are managed
by the system operator and result in the price for the hour in question.
• Balancing services are the services procured by the system operator to manage changes in supply
and demand following gate closure. The services vary by the timescale of response , and by
duration. Terminology varies between UK and the rest of Europe, and therefore we define common
timescales and terminology below – response and reserve services.
MW
generation
Gate closure
Price for relevant
time period is fixed
at gate closure.
Value depends on
supply and demand
at that point
t = 0
Sudden
event, e.g.
drop in
generation
Response
services fill gap
within 30 secs
t = 15 minutes t = 4 hours
Reserve services
fill gap over longer
timescales
Schematic of timescales over which reserve and response services help to balance supply and demand
following gate closure
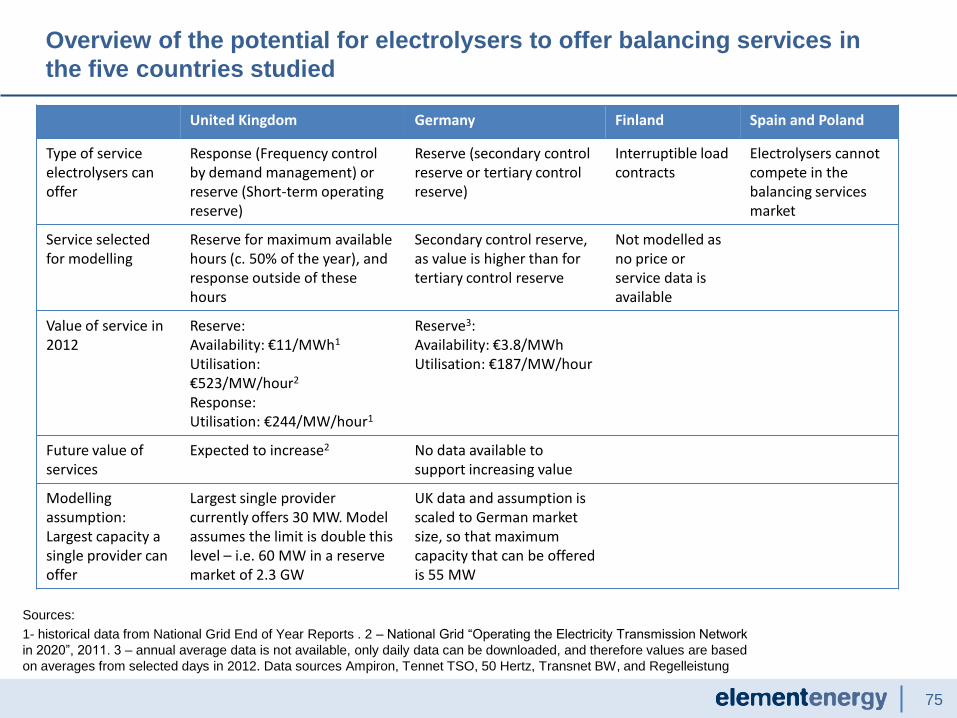
75
United Kingdom Germany Finland Spain and Poland
Type of service electrolysers can offer
Response (Frequency control by demand management) or reserve (Short-term operating reserve)
Reserve (secondary control reserve or tertiary control reserve)
Interruptible load contracts
Electrolysers cannot compete in the balancing services market
Service selected for modelling
Reserve for maximum available hours (c. 50% of the year), and response outside of these hours
Secondary control reserve, as value is higher than for tertiary control reserve
Not modelled as no price or service data is available
Value of service in 2012
Reserve: Availability: €11/MWh1
Utilisation: €523/MW/hour2
Response: Utilisation: €244/MW/hour1
Reserve3: Availability: €3.8/MWh Utilisation: €187/MW/hour
Future value of services
Expected to increase2 No data available to support increasing value
Modelling assumption: Largest capacity a single provider can offer
Largest single provider currently offers 30 MW. Model assumes the limit is double this level – i.e. 60 MW in a reserve market of 2.3 GW
UK data and assumption is scaled to German market size, so that maximum capacity that can be offered is 55 MW
Overview of the potential for electrolysers to offer balancing services in
the five countries studied
Sources:
1- historical data from National Grid End of Year Reports . 2 – National Grid “Operating the Electricity Transmission Network
in 2020”, 2011. 3 – annual average data is not available, only daily data can be downloaded, and therefore values are based
on averages from selected days in 2012. Data sources Ampiron, Tennet TSO, 50 Hertz, Transnet BW, and Regelleistung
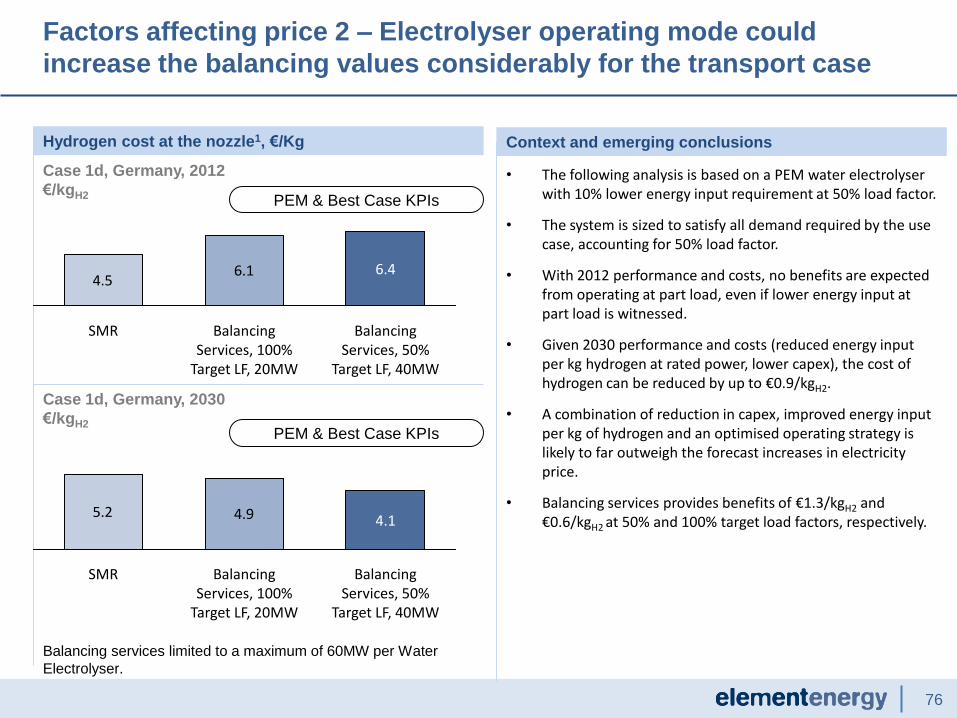
76
Factors affecting price 2 – Electrolyser operating mode could
increase the balancing values considerably for the transport case
Context and emerging conclusions
• The following analysis is based on a PEM water electrolyser with 10% lower energy input requirement at 50% load factor.
• The system is sized to satisfy all demand required by the use case, accounting for 50% load factor.
• With 2012 performance and costs, no benefits are expected from operating at part load, even if lower energy input at part load is witnessed.
• Given 2030 performance and costs (reduced energy input per kg hydrogen at rated power, lower capex), the cost of hydrogen can be reduced by up to €0.9/kgH2.
• A combination of reduction in capex, improved energy input per kg of hydrogen and an optimised operating strategy is likely to far outweigh the forecast increases in electricity price.
• Balancing services provides benefits of €1.3/kgH2 and €0.6/kgH2 at 50% and 100% target load factors, respectively.
Hydrogen cost at the nozzle1, €/Kg
4.56.1
Balancing Services, 50%
Target LF, 40MW
6.4
Balancing Services, 100%
Target LF, 20MW
SMR
Case 1d, Germany, 2012
€/kgH2
PEM & Best Case KPIs
PEM & Best Case KPIs
Balancing services limited to a maximum of 60MW per Water
Electrolyser.
Case 1d, Germany, 2030
€/kgH2
5.2 4.9
Balancing Services, 50%
Target LF, 40MW
4.1
Balancing Services, 100%
Target LF, 20MW
SMR
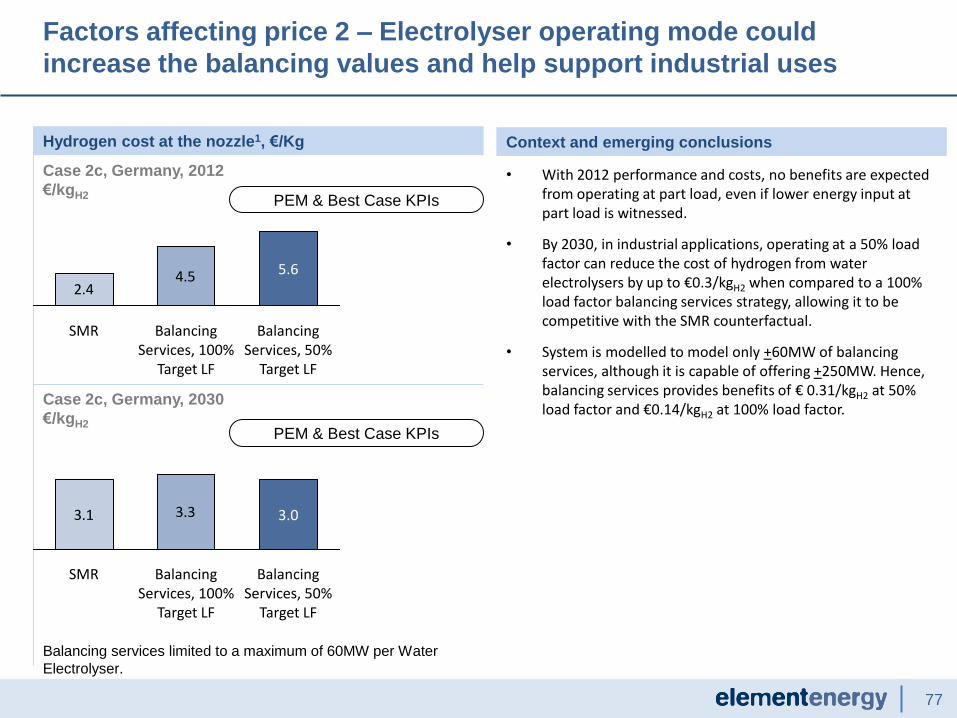
77
Factors affecting price 2 – Electrolyser operating mode could
increase the balancing values and help support industrial uses
Hydrogen cost at the nozzle1, €/Kg
2.44.5
Balancing Services, 50%
Target LF
5.6
Balancing Services, 100%
Target LF
SMR
Case 2c, Germany, 2012
€/kgH2
PEM & Best Case KPIs
PEM & Best Case KPIs
Case 2c, Germany, 2030
€/kgH2
3.1 3.3
Balancing Services, 50%
Target LF
3.0
Balancing Services, 100%
Target LF
SMR
Context and emerging conclusions
• With 2012 performance and costs, no benefits are expected from operating at part load, even if lower energy input at part load is witnessed.
• By 2030, in industrial applications, operating at a 50% load factor can reduce the cost of hydrogen from water electrolysers by up to €0.3/kgH2 when compared to a 100% load factor balancing services strategy, allowing it to be competitive with the SMR counterfactual.
• System is modelled to model only +60MW of balancing services, although it is capable of offering +250MW. Hence, balancing services provides benefits of € 0.31/kgH2 at 50% load factor and €0.14/kgH2 at 100% load factor.
Balancing services limited to a maximum of 60MW per Water
Electrolyser.

78
Factors affecting price 2 – Electrolyser operating mode could
increase the balancing values
Hydrogen cost at the nozzle1, €/Kg
4.46.6
Balancing Services, 50%
Target LF
Balancing Services, 100%
Target LF
SMR
7.8
Case 3c, Germany, 2012
€/kgH2
PEM & Best Case KPIs
PEM & Best Case KPIs
Case 3c, Germany, 2030
€/kgH2
5.1 5.4 5.3
SMR Balancing Services, 100%
Target LF
Balancing Services, 50%
Target LF
Context and emerging conclusions
• Given 2030 performance and costs (reduced energy input per kg hydrogen at rated power, lower capex), operating at 50% load factor can reduce the cost of hydrogen from water electrolysers by up to €0.08/kgH2.
• This is not sufficient to alter the competition with SMR derived hydrogen for this application.
• The benefits of operating at 50% load factor is significantly limited by the amount of balancing services offered by a single water electrolyser unit: only +60MW, although it is capable of offering +1000MW. This reduces the benefits of balancing services per kg of H2 produced to a relatively small €0.08/kgH2.
Balancing services limited to a maximum of 60MW per Water
Electrolyser.
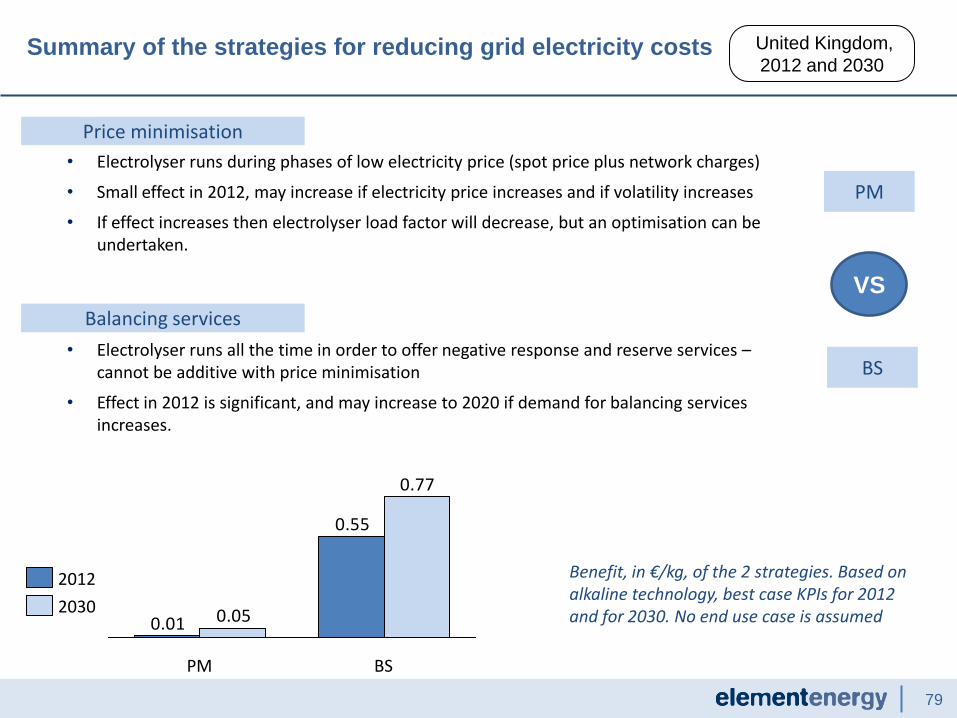
79
Summary of the strategies for reducing grid electricity costs
• Electrolyser runs during phases of low electricity price (spot price plus network charges)
• Small effect in 2012, may increase if electricity price increases and if volatility increases
• If effect increases then electrolyser load factor will decrease, but an optimisation can be undertaken.
Price minimisation
Balancing services
• Electrolyser runs all the time in order to offer negative response and reserve services – cannot be additive with price minimisation
• Effect in 2012 is significant, and may increase to 2020 if demand for balancing services increases.
0.55
0.01
0.77
0.05
BS PM
2030
2012 Benefit, in €/kg, of the 2 strategies. Based on alkaline technology, best case KPIs for 2012 and for 2030. No end use case is assumed
PM
BS
VS
United Kingdom,
2012 and 2030

80
• Many countries are facing significant constraints in terms of transmission and distribution capacity. As an example, in the UK, the bulk of generation is in the north, and the bulk of demand in the south. Hence there is a transmission constraint, and it is more difficult, and expensive, to connect new generation in the north than in the south.
• Renewable generators are one form of generation affected by this situation. Connections in the north, in Scotland in particular, are expensive, and new assets built to connect renewable generation have low utilisation factors.
• Renewable generators therefore face constraints, and this section of the analysis considers whether electrolysers can help by using the energy, reducing connection costs and/or use of system costs for generators.
• Wind farms are also experiencing curtailment, when peak wind output plus inflexible generation is greater than demand. This analysis does not consider the impact of using electrolysers to reduce curtailments.
It may be possible to access low cost electricity which would not
otherwise be able to connect to the grid
Map of the UK showing transmission constraints, from the National Grid ELSI model. Figures are for the value of firm access to the national market, £/kW/year – the larger the number, the higher the transmission constraint.

81
We have modelled whether an electrolyser can offer a service in three key scenarios:
System diagram of the three scenarios considered – electrolyser
connected to renewables and to grid
Source: 1 based on Element Energy modelled data for a wind farm in Scotland, with 48% load factor, and wholesale
prices as of 2012
Grid
Water
Electrolyser Renewable
Generator
Grid
Water
Electrolyser
Renewable
Generator
Grid
Water
Electrolyser Renewable
Generator
1. Unconstrained Wind Farm 2. Constrained Wind Farm 3. Single Entity Off-grid
Scenario 1 2 3
Distribution Line Capacity (MW) 10 5 0
Renewable Generator Size (MW) 10 10 10
Water Electrolyser Size (MW) 1 5 10
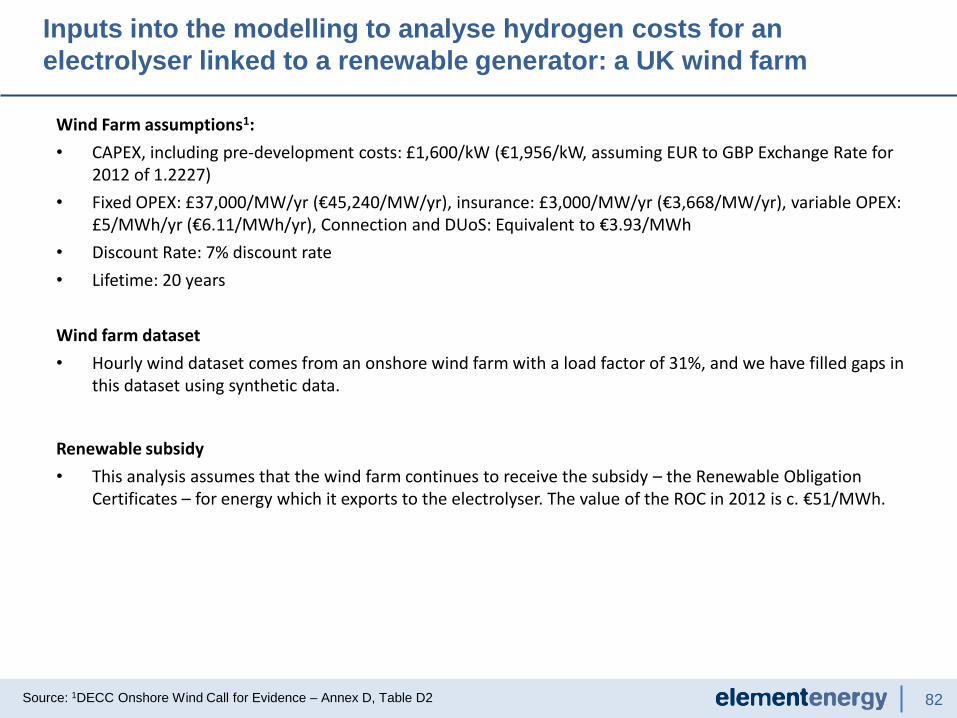
82
Inputs into the modelling to analyse hydrogen costs for an
electrolyser linked to a renewable generator: a UK wind farm
Wind Farm assumptions1:
• CAPEX, including pre-development costs: £1,600/kW (€1,956/kW, assuming EUR to GBP Exchange Rate for 2012 of 1.2227)
• Fixed OPEX: £37,000/MW/yr (€45,240/MW/yr), insurance: £3,000/MW/yr (€3,668/MW/yr), variable OPEX: £5/MWh/yr (€6.11/MWh/yr), Connection and DUoS: Equivalent to €3.93/MWh
• Discount Rate: 7% discount rate
• Lifetime: 20 years
Wind farm dataset
• Hourly wind dataset comes from an onshore wind farm with a load factor of 31%, and we have filled gaps in this dataset using synthetic data.
Renewable subsidy
• This analysis assumes that the wind farm continues to receive the subsidy – the Renewable Obligation Certificates – for energy which it exports to the electrolyser. The value of the ROC in 2012 is c. €51/MWh.
Source: 1DECC Onshore Wind Call for Evidence – Annex D, Table D2

83
-2.57
1.520.30 0.13
1.28
3.62
0.00
Scenario 3 - Single Entity Off-grid
5.87
1.58
0.43
Scenario 2 - Constrained Wind Farm
4.18
0.48
3.09
Scenario 1 - Unconstrained
Wind Farm
4.12
0.49
2.85
0.46 0.47
Scenario 1 2 3
Distribution Line Capacity
10MW 5MW 0 MW
Renewable Generator Size
10MW 10MW 10MW
Water Electrolyser Size
1MW 5MW 10MW
Load Factor 97% 98% 31%
Connecting to a grid and an unconstrained wind farm will result in a lower hydrogen cost than being only on the grid. The water electrolyser benefits by negotiating a electricity price slightly above the spot price (but without incurring DUoS and TUoS charges). The wind farm benefits by gaining a slightly higher electricity price, avoiding some use of system charges, and retaining the renewable subsidy – the ROCs. All 3 scenarios are heavily dependent on this subsidy remaining in place, and being applicable to the energy exported to the electrolyser.
Graph to show the total hydrogen cost (€/kg), and components for hydrogen cost
ROCs
WE CAPEX
WE OPEX
Electricity
RG OPEX
RG CAPEX
Stack replacement
United Kingdom,
2012,
31% load factor on wind farm
Hydrogen costs are the lowest when the water electrolyser
is connected to an unconstrained wind farm, and can
negotiate cheaper energy from that wind farm
Alkaline, best case KPIs