appendix 4.0-a socioeconomic assessment
TRANSCRIPT

~~ ~VVWCENGINEERING
Mr. Eric Holm Natural Resources Engineer III Minerals and Mining Program
1849 Terra Avenue - Sheridan, WY 8280 I - (307) 6 72-0761
Fax (307) 674-4265 - Email: [email protected]
August 29, 2013
South Dakota Department of Environment & Natural Resources 523 East Capitol A venue Joe Foss Building Pierre, SD 57501-3182
Re: Dewey-Burdock Project Large Scale Mine Permit Application Revised Appendix 4.0-A Socioeconomic Assessment
Dear Mr. Holm:
On behalf ofPowertech (USA) Inc., please find enclosed an updated Appendix 4.0-A, Socioeconomic Assessment, for the Dewey-Burdock Project. The primary updates to the appendix are as follows:
1) Section 2.0 Baseline Socioeconomics has been updated to include Census 2010 data, the 2011 U.S. Census Bureau American Community Survey data, and 2012 U.S. Census Bureau population estimates.
2) Section 3.0 Potential Socioeconomic Impacts has been updated to reflect current project employment and state and local tax revenue estimates.
Please find enclosed the following: • Updated Appendix 4.0-A, Socioeconomic Assessment (3 hard copies) • Change index (3 hard copies) • CD containing electronic copies of the updated appendix, change index, and cover letter
in Adobe PDF format.
Please let me know if you have any questions or need additional information.
Sincerely,
tjaA(_,1~ Jack Fritz, P.E. WWC Project Manager
K:\Powertech\13142\Corres\LSM revised Appendix 4.0-A.docx

August 2013 4.0-A-i Appendix 4.0-A
APPENDIX 4.0-A
Socioeconomic Assessment

Mr. Eric Holm August 29, 2013 Page 2 of2
cc: Dennis Zellner Custer County Register of Deeds 420 Mt. Rushmore Road Custer, SD 57730
Stan Michals Department of Game, Fish & Parks 4130 Adventure Trail Rapid City, SD 57702
Michael Fosha Department of Tourism Archeological Research Center 2425 E. St. Charles Street Rapid City, SD 57702-8098
Jim Hughes, Chairman Custer County Conservation District 44 7 Crook Street Custer, SD 57730
Marian Atkins BLM Eastern Montana/Dakotas District 31 0 Roundup St Belle Fourche, SD 57717
Valois Shea U.S. EPA Region 8 Mail Code: 8P-W-UIC 1595 Wynkoop St Denver, CO 80202-1129
Richard Blubaugh Vice President EH&S Resources Powertech (USA) Inc. 5575 DTC Parkway, Suite 140 Greenwood Village, CO 80111
Mark Hollenbeck Project Manager Powertech (USA) Inc. 310 2nd Ave Edgemont, SD 57735
Encl: as noted
Melody Engebretson Fall River County Register of Deeds 906 N. River Street Hot Springs, SD 57747
Raymond Sowers Division of Resource Conservation & Forestry Department of Agriculture 523 E. Capitol Ave Joe Foss Building Pierre, SD 57501-3181
Julie Tomlinson, District Manager Fall River County Conservation District 341 South Chicago Street Hot Springs, SD 57747-2323
Clark Hepper Department of Health 600 E. Capitol Ave Pierre, SD 57501-2536
Ronald Burrows U.S. NRC Office of Federal and State Materials
and Environmental Management Programs 11545 Rockville Pike Rockville, MD 20852
Max Main Bennett, Main & Gubbrud, P.C. 618 State Street Belle Fourche, SD 57717
John Mays Vice President Engineering Powertech (USA) Inc. 5575 DTC Parkway, Suite 140 Greenwood Village, CO 80111

This page intentionally left blank
August 2013 Appendix 4.0-A

August 2013 4.0-A-ii Appendix 4.0-A
Dewey-Burdock Project
Socioeconomic Assessment
August 2013
Prepared for:
Powertech (USA) Inc. P.O. Box 812
Edgemont, SD 57735
Originally Prepared by:
Barbara Filas
Knight Piésold and Co.
Updated by: Doyl Fritz
WWC Engineering

This page intentionally left blank
August 2013 Appendix 4.0-A

August 2013 4.0-A-iii Appendix 4.0-A
TABLE OF CONTENTS
1.0 INTRODUCTION .................................................................................................... 4.0-A-1
2.0 BASELINE SOCIOECONOMICS ........................................................................... 4.0-A-1 2.1 Population .......................................................................................................... 4.0-A-1 2.2 Demography ...................................................................................................... 4.0-A-5
2.2.1 Population Projections .............................................................................. 4.0-A-10 2.2.2 Schools ..................................................................................................... 4.0-A-15
2.3 Local Socioeconomic Baseline Conditions ..................................................... 4.0-A-16 2.3.1 Major Economic Sectors .......................................................................... 4.0-A-16 2.3.2 Unemployment Trends ............................................................................. 4.0-A-18 2.3.3 Employment ............................................................................................. 4.0-A-18 2.3.4 Income Levels .......................................................................................... 4.0-A-24 2.3.5 Tax Base ................................................................................................... 4.0-A-24 2.3.6 Housing ..................................................................................................... 4.0-A-34 2.3.7 Dwelling Types ........................................................................................ 4.0-A-34
3.0 POTENTIAL SOCIOECONOMIC IMPACTS ...................................................... 4.0-A-36 3.1 Economic Impact Analysis .............................................................................. 4.0-A-36
3.1.1 Introduction .............................................................................................. 4.0-A-36 3.1.2 Key Assumptions ...................................................................................... 4.0-A-36
3.1.2.1 Operating Life of the Project ................................................... 4.0-A-36 3.1.2.2 Zone of Influence ..................................................................... 4.0-A-37
3.1.3 Potential Benefits and Impacts ................................................................. 4.0-A-37 3.1.3.1 Input Data ................................................................................ 4.0-A-38 3.1.3.2 Employment Effects ................................................................ 4.0-A-38 3.1.3.3 State and Local Tax Revenues ................................................. 4.0-A-42 3.1.3.4 State and Local Value Added Benefits .................................... 4.0-A-42 3.1.3.5 Benefits of Environmental Research and Monitoring ............. 4.0-A-42 3.1.3.6 Potential Effects to Housing .................................................... 4.0-A-42 3.1.3.7 Potential Impacts to Services ................................................... 4.0-A-44
3.1.4 Economic Impact Summary ..................................................................... 4.0-A-45
4.0 REFERENCES ....................................................................................................... 4.0-A-46
LIST OF TABLES Table 1: Population within a Given Distance from Project Center ............................. 4.0-A-4
Table 2: Distance to Nearest Residents from Center of the Permit Area.................... 4.0-A-6
Table 3: Custer County, Fall River County and South Dakota Demographic Data ... 4.0-A-7
Table 4: Niobrara County, Weston County and Wyoming Demographic Data ......... 4.0-A-9

TABLE OF CONTENTS (Continued)
August 2013 4.0-A-iv Appendix 4.0-A
Table 5: Population Change, Custer and Fall River Counties, 2010-2012 ............... 4.0-A-12
Table 6: Population Data for Other Areas of Interest, 2010-2012 ............................ 4.0-A-14
Table 7: Percent of Population Attending School, 2007-2011 ................................. 4.0-A-17
Table 8: Area Labor Statistics, June 2013 ................................................................ 4.0-A-19
Table 9: Labor Force Educational Attainment (25+ Years of Age), 2011................ 4.0-A-20
Table 10: Covered Worker Employment by Sector, 2012 .......................................... 4.0-A-22
Table 11: Major Employers, Custer and Fall River Counties ..................................... 4.0-A-25
Table 12: Income Levels ............................................................................................. 4.0-A-26
Table 13: Municipal Tax Rates - 2012 ........................................................................ 4.0-A-28
Table 14: Total Taxable Sales for Nearby Towns - FY2012 ...................................... 4.0-A-29
Table 15: Property Tax Base - 2012 ........................................................................... 4.0-A-32
Table 16: Housing Unit Statistics - 2011 .................................................................... 4.0-A-35
Table 17: Basic Input Data for the Dewey-Burdock Project Economic Analysis ...... 4.0-A-39
Table 18: Estimated Employment Effects of the Project ............................................ 4.0-A-40
Table 19: Example United States Industry Employment Multipliers ......................... 4.0-A-41
Table 20: State and Local Tax Revenues .................................................................... 4.0-A-43
LIST OF FIGURES
Figure 1: Population Sector-Block Analysis ................................................................ 4.0-A-3
Figure 2: Racial Makeup Comparison .......................................................................... 4.0-A-8
Figure 3: Population by County ................................................................................. 4.0-A-11
Figure 4: Estimated Population Change 2010-2012, Fall River and Custer County Towns .......................................................................................................... 4.0-A-13
Figure 5: Unemployment Rates, 2003-2012 .............................................................. 4.0-A-21
Figure 6: Covered Worker Employment by Sector, 2012 .......................................... 4.0-A-23
Figure 7: Sales and Use Tax for Custer and Fall River County Seats, 2012 .............. 4.0-A-30
Figure 8: South Dakota Property Tax Distribution - 2012 ......................................... 4.0-A-33

August 2013 4.0-A-1 Appendix 4.0-A
1.0 INTRODUCTION The following socioeconomic assessment was prepared in 2008 by Barbara Filas of Knight Piésold and Co. using 2000 census data, population and demographic estimates from 2006, and revenue estimates from 2007. This report was updated in 2012 by Doyl Fritz of WWC Engineering to make the analysis of potential socioeconomic impacts consistent with the April 2012 Preliminary Economic Assessment of the Dewey-Burdock Project (SRK, 2012) and in 2013 to incorporate current census and economic data.
2.0 BASELINE SOCIOECONOMICS
2.1 Population The study area for the socioeconomic baseline study includes population centers within a 50-mile radius of the project’s approximate geographic center (latitude 43° 28' 50.071" N, longitude 103° 59' 34.559" W), considered to represent the likely maximum commuting distance for employees of the project (taking into account that actual road miles traveled from communities within the defined radius to the project may be in excess of the straight-line distance).
A project’s direct zone of social influence may be defined as the area within which the proposed project’s socioeconomic impacts and benefits are reasonably anticipated to be concentrated, including the population areas most likely to contribute to the project’s local workforce and to provide ongoing sources of supplies and services during construction and operations. The direct social zone of influence adopted for the project socioeconomic baseline report primarily includes the townships, towns, and unincorporated areas within the two South Dakota counties hosting the deposits, Custer and Fall River. Approximately 1 mile of the project’s western border follows the Wyoming/South Dakota state line west of Dewey, South Dakota. Therefore, the Wyoming locations of Newcastle and Osage1 in Weston County are also included in the project’s direct social zone of influence. These locations are within a 50-mile radius of the permit area’s approximate center and are thus close enough to reasonably supply workers or supplies to the project on a regular basis. No areas of appreciable population size were located within the same radius from the project in other Wyoming counties or to the south in Nebraska.
1 Osage is not an incorporated town but is defined as a “CDP” or census-designated place by the USCB in
partnership with State agencies. CDPs are areas of significant population outside of any incorporated municipality that are locally identified by a name.

August 2013 4.0-A-2 Appendix 4.0-A
Within the direct social zone of influence, this baseline study report focuses on Custer and Fall River counties as being the host counties for the project and thus the most likely to benefit directly from project implementation, including receipt of tax revenues. Towns within these two counties include:
• Custer County:
– Buffalo Gap, Custer City, Fairburn, Hermosa, and Pringle
• Fall River County:
– Edgemont, Hot Springs, and Oelrichs
Rapid City, South Dakota, the closest urban area to the project, is approximately 100 miles via road northeast of the permit area, in Pennington County, and may serve as a regional source of workers and supplies for the project as well. Because of its greater distance from the project, Rapid City is considered to be part of the project’s indirect zone of social influence. Two other towns in Pennington County also fall within the project’s indirect social zone of influence: Hill City and Keystone.
The majority of population and demographic information contained in this baseline report was obtained from Census 2010 data, the 2011 American Community Survey (ACS), the most recent Federal demographic survey available at the time this report was updated, and 2012 U.S. Census Bureau population estimates. Other sources of demographic information include the U.S. Department of Commerce’s Bureau of Economic Analysis (BEA), South Dakota Governor’s Office of Economic Development (SD GOED), the University of South Dakota’s Business Research Bureau, and county and city websites.
Figure 1 provides population by sector within a 50-mile radius from the project’s approximate center.
Detailed information on population distribution and demographics is only provided for the towns within the proposed project’s direct zone of social influence, as defined in the preceding section, with emphasis on the two South Dakota counties in which the proposed project is located, Custer and Fall River. For some datasets (such as population), estimations based on data trends are cited to provide more updated information; these estimations are acknowledged as projections rather than defined data where used. Population by sector and cumulative population by sector shown on Figure 1 are presented in Table 1.

Sioux
PenningtonCounty
CusterCounty
Fall River County
Weston County
DawesNiobrara County
W
WSW
ENE
SW
NE
SSW
NNE
S
N
SSE
NNW
SE
NW
E
ESE
WNW
2050708013510304060
LegendPermit BoundaryCountiesSectors/Buffers
Block Population1 - 3435 - 130131 - 450451 - 1100
based on 2010 Census data
Sector Ring Population1 - 100101 - 500501 - 10001001 - 25002501 - 4500
FILENAME
DATE
DRAWN BYDewey-Burdock Project
PopSectBlkAnalysis2010.mxd
16-Aug-2013S. Hetrick
App. 4.0-A Fig. 1Population Sector-Block Analysis
0 5 10 15 20Miles
0 10 20 30Kilometers
August 2013 4.0-A-3 Appendix 4.0-A

August 2013 4.0-A-4 Appendix 4.0-A
Table 1: Population within a Given Distance from Project Center
Sector Distance from Project Center, km
0 - 10 10 - 20 20 - 30 30 - 40 40 - 50 50 - 60 60 - 70 70 - 80 N 0 29 171 61 4 29 49 83
N, cumulative 0 29 200 261 265 294 343 426
NNE 4 0 10 96 82 316 626 567
NNE, cumulative 4 4 14 110 192 508 1,134 1,701
NE 0 7 13 631 3,980 475 2,162 3,788
NE, cumulative 0 7 20 651 4,631 5,106 7,268 11,056 ENE 0 21 279 270 33 87 624 675
ENE, cumulative 0 21 300 570 603 690 1,314 1,989
E 0 9 50 302 4,378 263 61 62
E, cumulative 0 9 59 361 4,739 5,002 5,063 5,125
ESE 0 16 23 316 325 244 176 115
ESE, cumulative 0 16 39 355 680 924 1,100 1,215
SE 0 10 274 28 16 14 19 25
SE, cumulative 0 10 284 312 328 342 361 386
SSE 2 20 583 42 15 14 21 38
SSE, cumulative 2 22 605 647 662 676 697 735
S 17 4 4 0 29 4 27 44
S, cumulative 17 21 25 25 54 58 85 129 SSW 3 7 0 2 8 6 17 40
SSW, cumulative 3 10 10 12 20 26 43 83
SW 3 0 0 20 15 23 18 53
SW, cumulative 3 3 3 23 38 61 79 132
WSW 2 10 15 9 9 30 11 16
WSW, cumulative 2 12 27 36 45 75 86 102
W 0 0 3 2 13 6 16 10
W, cumulative 0 0 3 5 18 24 40 50
WNW 1 0 1 2 9 25 41 33
WNW, cumulative 1 1 2 4 13 38 79 112
NW 5 3 5 9 8 23 41 76
NW, cumulative 5 8 13 22 30 53 94 170 NNW 2 0 21 335 4,380 179 294 71
NNW, cumulative 2 2 23 358 4,738 4,917 5,211 5,282 Ring Population, all Sectors 39 136 1,452 2,125 13,304 1,738 4,203 5,696
Data from U.S. Census Bureau, 2010 Census.

August 2013 4.0-A-5 Appendix 4.0-A
The distance to the nearest resident within each sector was calculated from querying the geographic data in Figure 1 and is presented in Table 2.
2.2 Demography Demographic data for Custer and Fall River counties collected for this baseline study include population breakdown by sex, age, race, and household size. These data are summarized and compared to similar data for the State of South Dakota in Table 3. Demographic data were collected from the Census 2010 statistical pool at both the county and state levels to provide a descriptive picture of the populations within the two counties in comparison to that of the State of South Dakota.
Review of the tabulated data indicates that the populations of Custer and Fall River counties are older than the state average, with older median ages, lower percentages of households with children, and higher percentages of households with persons 65 years of age or older. Additionally, family and household sizes for both counties were slightly smaller than the State averages.
Female-headed households with no husband present accounted for 5.5 percent and 8.9 percent of the total households during the 2010 Census for Custer and Fall River counties, respectively, somewhat lower than the State average of 9.7 percent. In Custer County, 62 percent (3.4 out of 5.5) and in Fall River County 51 percent (4.5 out of 8.9) of these households included children under the age of 18 years; this is lower than the State average of 64 percent (6.2 out of 9.7 in the State of South Dakota) of female-headed households.
Racial data for the two counties show that the local population is predominantly white, with American Indian/Alaskan Native the predominant minority group. At 7.1 percent, the percentage of American Indians in Fall River County is roughly twice that of Custer County but still below the State average of 8.8 percent. A graphic depiction of the area’s racial makeup is shown in Figure 2, again compared to the State average.
Similar data were tabulated for the two Wyoming counties bordering the project, Niobrara and Weston, as shown in Table 4, compared against Wyoming state-wide data. As with the South Dakota counties hosting the project, the populations of Niobrara and Weston counties are older than the State average, with smaller household and family sizes, lower proportions of children in the home, and higher percentages of senior citizens. The percentage of female-headed households was also similar to the permit-area counties and lower than the State-wide average.

August 2013 4.0-A-6 Appendix 4.0-A
Table 2: Distance to Nearest Residents from Center of the Permit Area
Sector Number of Residents Distance from Project Center Miles Km
N 29 8.7 14.0 NNE 4 3.9 6.3 NE 7 7.5 12.1
ENE 4 7.3 11.7 E 2 6.9 11.1
ESE 14 10.5 16.9 SE 1 8.8 14.2
SSE 2 5.7 9.2 S 1 0.9 1.4
SSW 3 3.2 5.1 SW 3 2.2 3.5
WSW 2 1.5 2.4 W 3 13 20.9
WNW 1 3.0 4.8 NW 1 3.8 6.1
NNW 1 4.1 6.6 Data from U.S. Census Bureau, 2010 Census.

August 2013 4.0-A-7 Appendix 4.0-A
Table 3: Custer County, Fall River County and South Dakota Demographic Data
Data Type Custer County
Fall River County South Dakota
Male / female ratio, % 50.5 / 49.5 50.8 / 49.2 50.0 / 50.0 Median age, years 50.3 50.9 36.9 Average household size, people 2.19 2.1 2.42 Average family size, people 2.65 2.74 3.00 Households with individuals under 18 years, % 21.7 20.4 31.1 Households with individuals 65 years and over, % 33.5 36.4 24.9 Female householder with no husband present, % 5.5 8.9 9.7 Above, with own children under 18 years, % 3.4 4.5 6.2 Race, % White 94.2 88.6 85.9 Black / African American 0.2 0.7 1.3 American Indian / Alaskan Native 2.9 7.1 8.8 Asian 0.4 0.4 0.9 Native Hawaiian / Pacific Islander 0.0 0.0 0.0 Other or two or more races 2.4 3.2 3.0 Hispanic / Latino (of any race) 2.2 2.2 2.7
Data from U.S. Census Bureau, 2010 Census.

August 2013 4.0-A-8 Appendix 4.0-A
Data from U.S. Census Bureau, 2010 Census. Figure 2: Racial Makeup Comparison
State of South Dakota = outer ring Fall River County = middle ring
Custer County = inner ring
White Black/African American
American Indian/Alaskan Native Asian
Native Hawaiian/Pacific Islander Other or two or more races
Hispanic/Latine (of any race)

August 2013 4.0-A-9 Appendix 4.0-A
Table 4: Niobrara County, Weston County and Wyoming Demographic Data
Data Type Niobrara County
Weston County Wyoming
Male / female ratio, % 46.7 / 53.3 52.6 / 47.4 51.0 / 49.0
Median age, years 46.1 42.3 37.7
Average household size, people 2.12 2.28 2.42
Average family size, people 2.71 2.81 2.96
Households with individuals under 18 years, % 23.2 26.1 30.9
Households with individuals 65 years and over, % 34.4 26.5 22.0
Female householder with no husband present, % 7.4 6.9 8.9
Above, with own children under 18 years, % 4.2 4.0 5.6
Race, %
White 96.5 95.5 90.7
Black / African American 0.2 0.3 0.8
American Indian / Alaskan Native 0.8 1.3 2.4
Asian 0.4 0.3 0.8
Native Hawaiian / Pacific Islander 0.0 0.0 0.1
Other or two or more races 2.1 2.6 5.2
Hispanic / Latino (of any race) 2.1 3.0 8.9 Data from U.S. Census Bureau, Census 2010.

August 2013 4.0-A-10 Appendix 4.0-A
Both Wyoming counties also have lower percentages of Native American populations than the State average, and substantially lower than either Custer or Fall River counties.
2.2.1 Population Projections The most recent verifiable population data for Fall River and Custer counties at the time of this update was the 2010 Federal census. Estimations of population changes for South Dakota counties were calculated by the U.S. Census Bureau (USCB) for 2012 and by the SD Department of Labor and Regulation for the years 2010-2035. As Figure 3 shows, Fall River County is estimated to have lost 1.7 percent of its population between 2010 and 2012, in comparison to a 1.5 percent gain in population in Custer County over the same time period.
Projections for the 2020 county populations show a 4.2 percent gain for Fall River County and a 9.9 percent gain for Custer County, both over the 2010 populations.
A breakdown of population per town within each county is shown in Table 5, based again on Census 2010 data and 2012 USCB population estimates. Custer City and Hot Springs, the county seats of Custer and Fall River counties, respectively, are the largest towns in each county.
General population trends shown in Table 5 and Figure 4 indicate that while Custer County overall was estimated to gain population, the small towns in the county (Buffalo Gap, Fairburn, Hermosa, and Pringle) were basically estimated to maintain their populations from 2010 to 2012. The two larger towns, Hermosa and Custer City were estimated to lose population over the same time period. All three towns in Fall River County show estimated population decreases from 2010 to 2012, with the highest percent decrease in Hot Springs, at 3.8 percent.
Rapid City, the urban area nearest to the project, had a 2010 population of 67,956, estimated to have increased by 2.8 percent to 69,854 by 2012.
Estimated 2012 population densities for both Custer and Fall River counties were quite low, at approximately 5.3 and 4.0 people per mi2, respectively. In comparison, the state average population density estimate for 2012 was approximately 10.8 people per mi2.
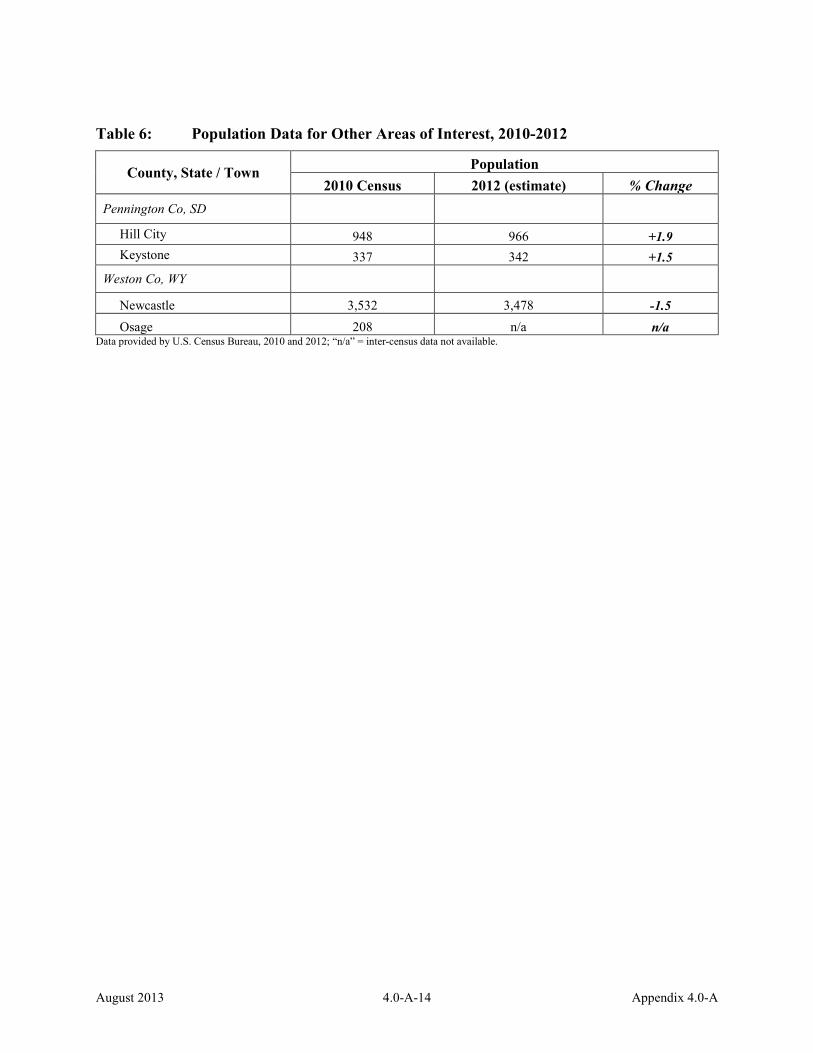
Population data for some other areas of interest to the project are shown in Table 6 and include population statistics for two towns in Pennington County (which includes Rapid City) – Hill City and Keystone, and two locations in Weston County, Wyoming – Newcastle and Osage, all considered close enough to the project to be within in its direct zone of social influence.

August 2013 4.0-A-11 Appendix 4.0-A
Figure 3: Population by County
7,094
6,971
7,394
8,216
8,339
9,028
0 2,000 4,000 6,000 8,000 10,000
2010 Census
2012 Estimate
2020 Estimate
Population
Population by County
Custer Co.
Fall River Co.

August 2013 4.0-A-12 Appendix 4.0-A
Table 5: Population Change, Custer and Fall River Counties, 2010-2012
County / Town Population 2010 Census 2012 (estimate)
Custer Buffalo Gap 126 126 Custer City 2,067 1,988 Fairburn 85 85 Hermosa 398 397 Pringle 112 114 Fall River Edgemont 774 753 Hot Springs 3,711 3,570 Oelrichs 126 125
Data provided by U.S. Census Bureau, 2010 and 2012 (est.).

August 2013 4.0-A-13 Appendix 4.0-A
Figure 4: Estimated Population Change 2010-2012, Fall River and Custer County
Towns
Buffalo Gap
Custer City
Fairburn
Hermosa
Pringle
Edgemont
Hot Springs
Oelrichs
-5.0%
-4.0%
-3.0%
-2.0%
-1.0%
0.0%
1.0%
2.0%
3.0%
Popu
latio
n Ch
ange
, Per
cent
Town
Estimated Population Change 2010-2012 Fall River and Custer County Towns
Custer Co. Fall River Co.
August 2013 4.0-A-14 Appendix 4.0-A
Table 6: Population Data for Other Areas of Interest, 2010-2012
County, State / Town Population 2010 Census 2012 (estimate) % Change
Pennington Co, SD Hill City 948 966 +1.9 Keystone 337 342 +1.5 Weston Co, WY Newcastle 3,532 3,478 -1.5 Osage 208 n/a n/a
Data provided by U.S. Census Bureau, 2010 and 2012; “n/a” = inter-census data not available.

August 2013 4.0-A-15 Appendix 4.0-A
2.2.2 Schools Public schools (kindergarten through 12th grade) in South Dakota are generally organized at the county or sub-county level by school district. The five public school districts in and around the permit area and their attendant schools and age levels are:
• Custer School District:
– Custer Elementary, Pre-Kindergarten (PK) - 5th
– Custer Middle, 6th - 8th
– Custer High, 9th - 12th
– Hermosa Elementary, PK - 8th
– Fairburn Elementary, Kindergarten (K) - 8th
– Spring Creek Elementary, K - 8th
• Elk Mountain School District:
– Elk Mountain Elementary, K - 6th
• Hot Springs School District:
– Hot Springs Elementary, PK - 5th
– Hot Springs Middle, 6th - 8th
– Hot Springs High, 9th - 12th
• Edgemont School District:
– Edgemont Elementary, K - 6th
– Edgemont Junior High, 7th - 8th
– Edgemont High, 9th - 12th
• Oelrichs School District:
– Oelrichs Elementary, K - 6th
– Oelrichs Junior High, 7th - 8th
– Oelrichs High, 9th - 12th
There are no private or charter primary or secondary schools in Custer County. Bethesda Lutheran School in Hot Springs is the only private school in Fall River County and serves grades PK - 5th.

August 2013 4.0-A-16 Appendix 4.0-A
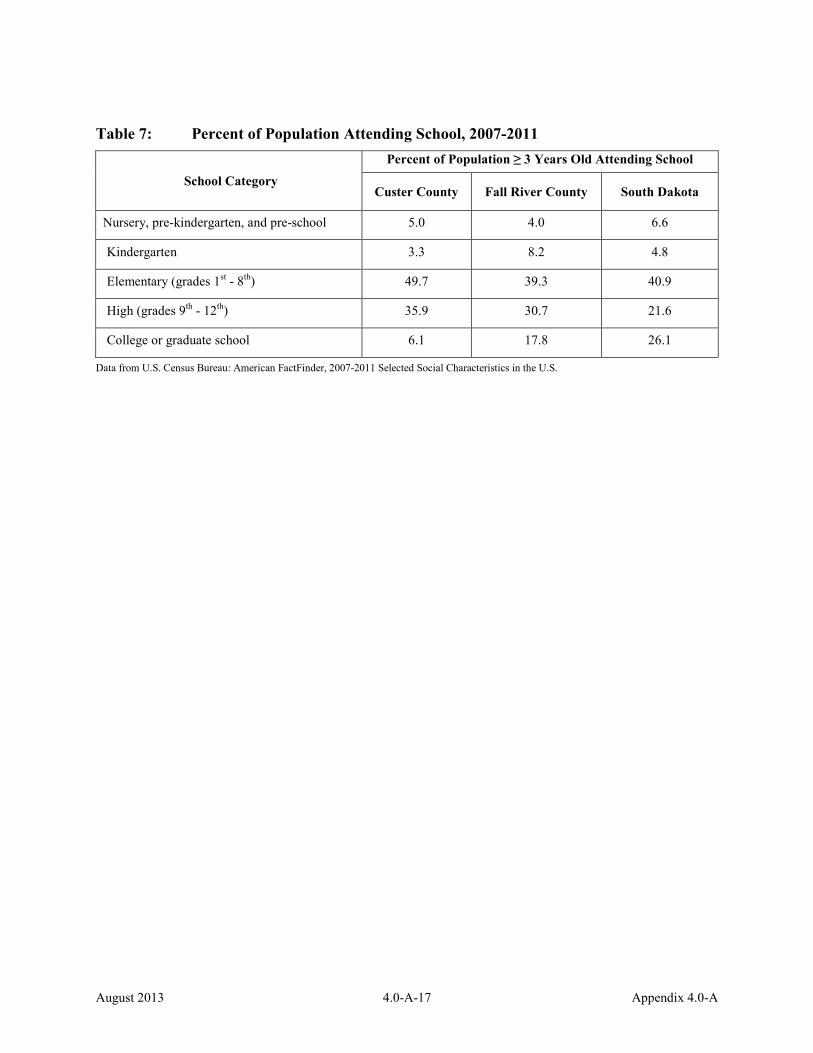
Kindergarten and younger school attendance rates in Custer County are below the State average, while in Fall River County kindergarten attendance rates are above the state average and pre-school attendance rates are below (Table 7). Custer County is above the state average in percent of population attending elementary and high school, while Fall River County is below the state average for elementary but higher for high school. Both counties have a smaller percentage of population attending college than does the state as a whole.
The closest post-secondary schools to the project are in Rapid City, approximately 100 miles northeast via road, and include the Western Dakota Technical Institute (WDTI), the South Dakota School of Mines and Technology (SDSMT), and the Rapid City Campus of the National American University (NAU).
WDTI is one of four State-run technical institutes in South Dakota and offers more than 25 career programs leading to the Associate of Applied Science degree, as well as many non-credit classes, workshops, short-term training programs, and online courses. Approximately 1,092 full-time students were enrolled in the spring 2013 semester, with over 4,000 students participating in full-, part-time, or non-credit courses annually.
SDSMT is one of the six public universities governed by the South Dakota Board of Regents and offers undergraduate (Associate of Arts, Bachelor of Science) and graduate degrees (Master and Doctor of Science) in various science and engineering fields. Fall 2012 enrollment was 2,424 students. Of those, 2,101 were undergraduate students and 323 were graduate students.
The Rapid City campus is one of NAU’s 20 campuses in eleven states, including an online campus also based in Rapid City. NAU is a private institute of higher learning, offering regionally accredited and degree programs in a variety of fields, both at its campuses and on-line. Typical fall enrollment at NAU’s Rapid City campus is about 430 full-time students and over 1,000 part-time students.
2.3 Local Socioeconomic Baseline Conditions
2.3.1 Major Economic Sectors The South Dakota Department of Labor (SD DOL) defines “labor force” as all civilians not in institutions, 16 years of age and older, who are employed or unemployed and actively seeking employment. SD DOL develops its labor force estimates in cooperation with the U.S. Bureau of Labor Statistics. “Labor supply” is defined by the SD DOL as the number of persons who would
August 2013 4.0-A-17 Appendix 4.0-A
Table 7: Percent of Population Attending School, 2007-2011
School Category Percent of Population ≥ 3 Years Old Attending School
Custer County Fall River County South Dakota
Nursery, pre-kindergarten, and pre-school 5.0 4.0 6.6
Kindergarten 3.3 8.2 4.8
Elementary (grades 1st - 8th) 49.7 39.3 40.9
High (grades 9th - 12th) 35.9 30.7 21.6
College or graduate school 6.1 17.8 26.1
Data from U.S. Census Bureau: American FactFinder, 2007-2011 Selected Social Characteristics in the U.S.

August 2013 4.0-A-18 Appendix 4.0-A
be available to staff a new or expanding business in the area of interest and includes people who are currently employed but are seeking to change jobs and people who are unemployed but actively seeking jobs. Labor supply also considers workers who would commute into the area to work. Labor supply statistics developed by SD DOL are provided in Table 8.
The percentage of the total county populations represented by their labor forces is higher for Custer County than for Fall River County, and both are higher than the State-wide rate, potentially due to the older populations in the area as noted in Section 2.2. Annual unemployment rates in June 2013 in both counties were at or below the State-wide rate of 3.9 percent, with unemployment higher in Fall River County.
About 35 percent of the population over age 25 in Custer County and 43.6 percent in Fall River County have 12 years or less of formal education (high-school level), as shown in Table 9.
2.3.2 Unemployment Trends Unemployment trends for Custer and Fall River counties and South Dakota’s state-wide rate over the last decade are shown in Figure 5, which plots the average unemployment rate for each year determined from monthly county and state data from the SD DOL’s Labor Market Information Center.
As the chart shows, both counties closely track the state’s unemployment rate, although Fall River County’s rate is consistently higher.
2.3.3 Employment Employment data from 2012 for major sectors of employment including private sector enterprises and local, state, and federal government for Custer and Fall River counties are shown in Table 10 and illustrated in Figure 6. “Covered workers” are defined by the SD DOL as workers at firms for whom unemployment insurance is provided. Workers excluded from the “covered” category include the self-employed, unpaid family workers, elected government officials, railroad employees, election officials, work-study students, some religious and non-profit organization employees, smaller business employees, and part-time or seasonal workers.
Government (local, state, or federal) was a much larger employment sector for both Custer and Fall River counties than for the State. In 2012, over 40 percent of all covered workers in Fall River County were employed by some form of government, in comparison to 30 percent of the covered workforce in Custer County and 18 percent of the workforce State-wide. Major private

August 2013 4.0-A-19 Appendix 4.0-A
Table 8: Area Labor Statistics, June 2013 Custer
County Fall River
County South
Dakota* Labor force, persons 5,490 3,905 449,510
Labor force, % of total population 65.8 56.0 53.9
Employed, persons 5,310 3,755 431,800
Unemployed, persons 180 150 17,710
Unemployment rate, annual % 3.3 3.9 3.9
Labor supply, persons 575 890 81,225
Labor supply, % of labor force 10.5 22.8 18.1
Data from Labor Market Information Center, SD DOL *State-wide data are seasonally adjusted

August 2013 4.0-A-20 Appendix 4.0-A
Table 9: Labor Force Educational Attainment (25+ Years of Age), 2011
Custer County, % Fall River County, % South Dakota
Less than 12 years of school 7.5 10.0 9.4
High school graduate 27.6 33.6 31.4
Some college (no degree) 25.4 26.2 23.1
Associate’s degree 9.1 9.2 9.7
Bachelor’s degree 21.7 15.0 26.3
Graduate or professional degree 8.7 5.9 8.1 Data from U.S. Census Bureau, American FactFinder, 2007-2011 American Community Survey 5-Year Estimates

August 2013 4.0-A-21 Appendix 4.0-A
Figure 5: Unemployment Rates, 2003-2012
0%
1%
2%
3%
4%
5%
6%
7%
2003 2004 2005 2006 2007 2008 2009 2010 2011 2012
Une
mpl
oym
ent R
ate
Unemployment Rates, 2003-2012
Statewide Custer County Fall River County

August 2013 4.0-A-22 Appendix 4.0-A
Table 10: Covered Worker Employment by Sector, 2012
Employment Sector Custer County, % Employed
Fall River County, % Employed
South Dakota, % Employed
Construction 4.8 3.7 5.0 Education / Health Services 11.3 13.2 15.5 Financial Activities / Insurance 3.2 2.5 7.0 Information 0.8 1.1 1.5 Leisure / Hospitality 25.7 16.6 11.1 Manufacturing 0.7 2.0 10.3 Natural Resources / Mining 2.0 2.5 1.4 Other Services 2.5 1.9 2.6 Professional / Business Services 4.5 2.5 7.3 Trade / Transportation / Utilities 14.1 11.7 20.5
% Total, Private Ownership 69.7 57.8 82.2 Local government 11.8 15.9 11.3 State government 10.1 6.0 3.6 Federal government 8.5 20.3 2.9
% Total, Government 30.3 42.2 17.8 Total Covered Workers: 2,488 2,448 400,473
Data from SD GOED and SD DOL Labor Market Information Center, 2012.

August 2013 4.0-A-23 Appendix 4.0-A
Data from SD DOL, Labor Market Information Center, 2012. Figure 6: Covered Worker Employment by Sector, 2012
Statewide = outer ringFall River County = middle ring
Custer County = inner ring
Construction Education/Health Services
Financial Activities Information
Leisure/Hospitality Services Manufacturing
Natural Resources/Mining Other Services
Professional/Business Services Trade/Transportation/Utilities
Federal Government State Government
Local Government

August 2013 4.0-A-24 Appendix 4.0-A
enterprise sectors of employment for both counties were leisure/hospitality (including arts, entertainment, recreation, food service, and accommodations), trade/transportation/utilities (including retail, wholesale, transportation, warehousing, and utilities), and education/health services, see Figure 6.
A more detailed breakdown of private and public sector employers for both counties is provided in Table 11, based on data collected by the SD GOED from local development corporations. Major employers in Custer County include the USFS (whose Black Hills National Forest headquarters are in Custer City), local school districts, and various health care providers. Major employers in Fall River County include the U.S. Department of Veteran’s Affairs (which operates a VA Medical Center in Hot Springs) and the National Park Service, in addition to local school districts and health care providers. The BNSF railroad is believed to be a major private-sector employer in Fall River County, but railroad employment data were not available from the SD GOED. Railroad employees are likely included in the Trade/Transportation/Utilities figures in Table 10 and Figure 6.
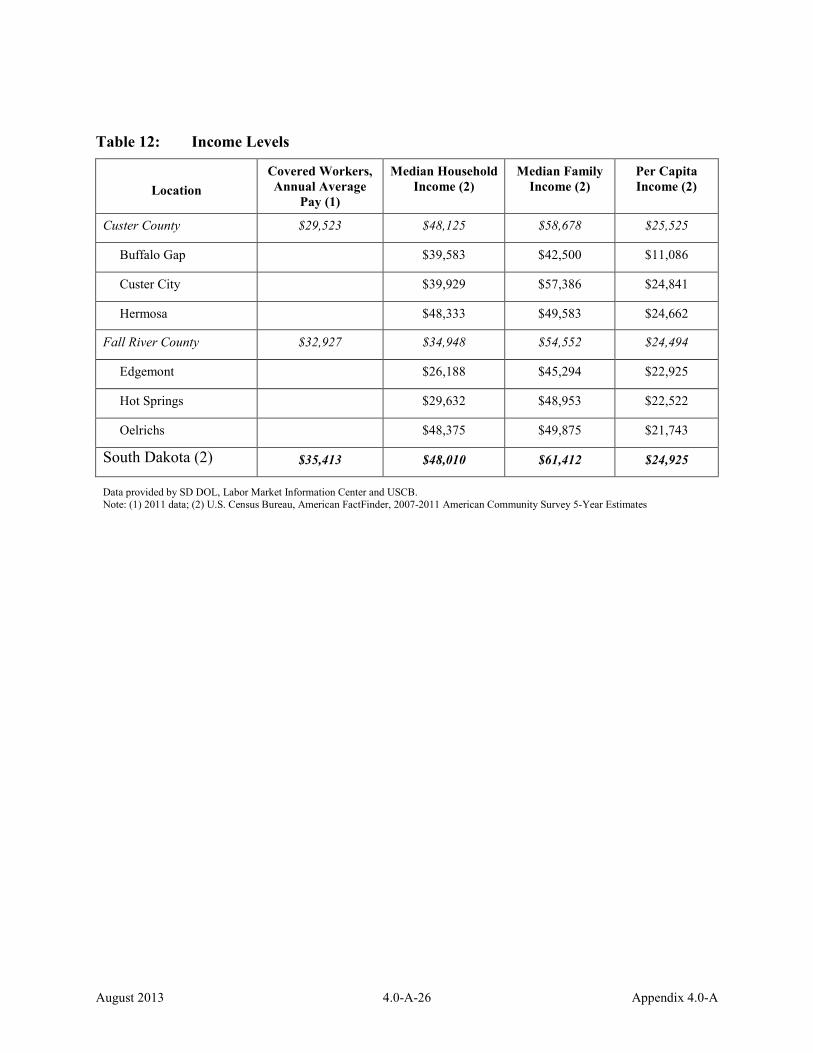
2.3.4 Income Levels Information regarding median and per capita incomes and poverty statistics for Custer and Fall River counties is only available from the decennial federal census; state-level information is updated during the USCB’s annual American Community Survey. Information in Table 12 is presented in 2011 dollars, the latest information available.
Median incomes at the household and family level were higher for both Custer and Fall River counties than for most individual towns within each county, indicating that unincorporated county residents contribute substantially to the area’s gross income. Income values for both counties were at or lower than the comparable State-wide values.
2.3.5 Tax Base South Dakota imposes an Energy Minerals tax for the privilege of severing said minerals (authority: SDCL 10-39A). The tax rate is 4.5 percent of taxable value. The energy minerals tax is distributed 50 percent to the State General Fund and 50 percent to the county in which the minerals are severed. There is also a State-imposed conservation tax (authority: SDCL 10-39B). The rate base is 2.4 mills of taxable value, and 100 percent of the tax is placed in the Environment and Natural Resources fee fund. In FY2012 the state-wide energy mineral tax amounted to about $5.3 million (SD Department of Revenue, 2012 Annual Report).

August 2013 4.0-A-25 Appendix 4.0-A
Table 11: Major Employers, Custer and Fall River Counties
Employment Sector
Total Employed in 2010
Major Employers Custer County Fall River County
Custer / Fall River # Employed – Town # Employed – Town
Construction 122 / 85 Jorgenson Log Homes 34 - Custer City
Barker Concrete Construction 11 - Edgemont
Education / Health Services 277 / 300
Custer Regional Senior Care 100 - Custer City Custer School District 183 - Custer City
Custer Regional Hospital 116 - Custer City Cactus Hills Retirement
Community (Closed) 0 - Edgemont
Edgemont School District 47 - Edgemont Fall River Health Services/
Castle Manor Nursing Home 140 - Hot Springs
Hot Springs School District 125 - Hot Springs Financial Activities 78 / 69 Battle Creek Agency 4 - Hermosa
Leisure / Hospitality 602 / 406
Cuny Table Café 4 - Buffalo Gap Crazy Horse Memorial 60 - Custer City
Trails West 5 - Hermosa Waterhole Restaurant & Bar 10 - Hermosa
Super 8 Motel 15 - Hot Springs State Line Club 3 - Oelrichs
Horsehead 2 - Oelrichs Natural Resources /
Mining 68 / 53 Pacer Corporation 33 - Custer City
Other Services 49 / 45 Black Hills Special Services 36 - Hot Springs
Trade / Transportation / Utilities 394 / 326
Black Hills Electric Cooperative 30 - Custer City Buffalo Gap Repair 2 - Buffalo Gap
Rancher Feed & Seed 2 - Buffalo Gap Lynn’s Dakotamart 35 - Custer City 43 - Hot Springs
Fresh Start 15 - Hermosa Nelson’s Oil & Gas 4 - Edgemont Maverick Junction 33 - Hot Springs
Pamida 35 - Hot Springs
Local Government2 - / - Custer County 74 - Custer City
City of Edgemont 7 - Edgemont
State Government2 - / - Custer State Park 30 - Custer City
State Veterans’ Home 106 - Hot Springs
Federal Government2 - / -
Black Hills National Forest 583 - Custer City VA Medical Center 402 - Hot Springs
Wind Cave National Park 100 - Hot Springs U.S. Post Office 2 - Oelrichs
1 Data from SD GOED, 2013 2 Report lists 808 government employees in Custer County and 1,107 in Fall River County in 2010 but does not break the number down into
local, state and federal government employees.
August 2013 4.0-A-26 Appendix 4.0-A
Table 12: Income Levels
Location
Covered Workers, Annual Average
Pay (1)
Median Household Income (2)
Median Family Income (2)
Per Capita Income (2)
Custer County $29,523 $48,125 $58,678 $25,525
Buffalo Gap $39,583 $42,500 $11,086
Custer City $39,929 $57,386 $24,841
Hermosa $48,333 $49,583 $24,662
Fall River County $32,927 $34,948 $54,552 $24,494
Edgemont $26,188 $45,294 $22,925
Hot Springs $29,632 $48,953 $22,522
Oelrichs $48,375 $49,875 $21,743
South Dakota (2) $35,413 $48,010 $61,412 $24,925
Data provided by SD DOL, Labor Market Information Center and USCB. Note: (1) 2011 data; (2) U.S. Census Bureau, American FactFinder, 2007-2011 American Community Survey 5-Year Estimates

August 2013 4.0-A-27 Appendix 4.0-A
South Dakota does not impose a state income tax on its citizens or businesses and abolished its estate tax in 2001. Nearly half (46.7 percent) of State revenue was generated from the 4 percent State-wide sales and use (services) tax in 2012, with other sales and use taxes levied by many municipalities, typically an additional 1-2 percent. The South Dakota Department of Revenue and Regulation (SD DRR) is the entity responsible for collection and regulation of various taxes at the State level, including:
• Non-income business taxes – including sales and use, contractor’s excise, and municipal (city) and special jurisdiction (tribal) taxes;
• Special taxes – including tobacco excise, bank franchise, ore and energy mineral severance, gaming excise, coin-operated laundromat licensing, and various alcohol taxes; and
• Motor vehicles taxes – including titles, licensing, motor fuel, and dealer licensing.
Towns with a municipal sales and use tax also may impose a gross receipts tax on various sales, including lodging, restaurants, alcoholic beverage sales, and admissions to places of amusement and cultural and sports events. SD DRR is responsible for collection of municipal taxes. Towns in the vicinity of the permit area imposing a municipal sales and use tax are listed in Table 13.
Local governments are solely responsible for collection of property taxes, which are the primary source of funding for school systems, counties, municipalities, and other local government units.
Table 14 presents the total taxable amounts for fiscal year 2012 on sales and services for the larger towns in Custer and Fall River counties and shows the amounts as a percent of South Dakota’s total taxable sales over the same time period.
Figure 7 shows the percentage various business sectors contributed to the total taxable sales and use revenue for Custer City and Hot Springs, the respective county seats for Custer and Fall River counties and the largest cities in each county. Businesses are grouped by standard industrial classification (SIC) as defined by SD DRR, and data reflect 2012 fiscal year totals from SD DRR’s annual report. The chart shows that sales and use taxes for both cities come mostly from the retail trade and service sectors. These two sectors generated about 80 percent and 90 percent of the sales and use tax revenues in Custer City and Hot Springs, respectively. No other sector generated more than 5 percent of the taxable sales in either county except for the

August 2013 4.0-A-28 Appendix 4.0-A
Table 13: Municipal Tax Rates - 2012
Location Municipal Tax Rate Gross Receipts Tax Rate
Custer County
Custer City 2% 1%
Hermosa 2% No
Pringle 2% No
Fall River County
Edgemont 2% 1%
Hot Springs 2% 1% Data from SD DRR, 2013.

August 2013 4.0-A-29 Appendix 4.0-A
Table 14: Total Taxable Sales for Nearby Towns - FY2012
Location Total Taxable Sales % of State Taxable Sales
Custer County $103,332,460 0.57
Buffalo Gap $462,258 0.002
Custer City $92,757,443 0.51
Fairburn $231,905 nil
Hermosa $6,840,577 0.038
Pringle $724,344 0.004
Other cities $2,320,933 0.013
Fall River County $65,366,064 0.36
Edgemont $7,178,047 0.039
Hot Springs $56,936,810 0.31
Oelrichs $779,828 0.004
Other cities $471,378 0.003
Data from SD DRR, South Dakota Sales and Use Tax Report, Fiscal Years 2011 and 2012, County Statistics by City.

August 2013 4.0-A-30 Appendix 4.0-A
Figure 7: Sales and Use Tax for Custer and Fall River County Seats, 2012
0%
10%
20%
30%
40%
50%
60%
70%
80%Ag
/For
estr
y/Fi
shin
g
Min
ing
Cons
truc
tion
Man
ufac
turin
g
Tran
spor
tatio
n/Pu
blic
Util
ities
Who
lesa
le T
rade
Reta
il Tr
ade
Fina
ncia
l/In
sura
nce/
Real
Est
ate
Serv
ices
% T
axab
le S
ales
2012 Sales and Use Tax,
Custer and Fall River County Seats
Custer City Hot Springs

August 2013 4.0-A-31 Appendix 4.0-A
transportation and public utilities sector, which generated about 19 percent of the taxable sales in Custer City in 2012.
SIC categories generating the most taxable sales for Custer City in 2012 were services ($35,805,618), retail trade ($35,765,858), and transportation and public utilities ($17,884,998), accounting for 96.8 percent of the city’s total taxable sales. SIC categories generating the most taxable sales for Hot Springs in 2012 were retail trade ($82,990,136) and services ($16,354,474), generating 90 percent of the city’s total taxable sales.
Property taxes are the primary source of funding for school systems, counties, municipalities and other units of local government. The state does not collect or spend any property tax money. Each county administers its own property tax system; the authority of the Department of Revenue is limited to assisting local governments in making property tax assessments that are fair and in compliance with the law.
Property tax categories include agricultural land, owner-occupied property, and other valuations (such as residential property not occupied by the owner, commercial property, and utility property). Table 15 lists the property tax base for Custer and Fall River counties in 2012 and compares them to the State-wide totals. In 2012, agricultural land accounted for only 13 percent of the property tax base in Custer County, in comparison to 21 percent of the property tax base in Fall River County and 37 percent State-wide. Owner-occupied housing accounted for 49 percent of Custer County’s tax base, compared to 38 percent in Fall River County and 38 percent State-wide. Other non-agricultural real valuation percentages were 33 percent for Custer County, 25 percent for Fall River County, and 23 percent for the state.
Figure 8 shows that the majority (55.7 percent) of property taxes collected in South Dakota were used to fund local school districts in 2012. Another 40.8 percent of property tax revenue was used to fund county (27.3 percent) and municipality (13.5 percent) governments, with the remaining 3.5 percent used for funding townships and for special assessment purposes, generally for use by improvement districts for infrastructure (road, bridge, water, sewer, etc.) improvements (Goldman et al., 2001). The Sales or Property Tax Refund Program is a method of returning to senior or disabled citizens, with certain income guidelines, some of the dollars they pay each year in sales and property taxes. The program has been in effect since 1974 and has returned over $29 million to qualified South Dakotans. About $2.6 million were refunded in FY2012 (SD DOR 2012 Annual Report).

August 2013 4.0-A-32 Appendix 4.0-A
Table 15: Property Tax Base - 2012
Property Tax Category Custer County Fall River County South Dakota Ag Real Valuation $ 96,136,931 $ 99,807,160 $23,006,747,960 Owner-Occupied Valuation $ 364,720,437 $ 178,680,850 $23,737,026,828 Manufactured Homes "Other" $ 4,888,703 $ 5,141,670 $112,272,969 Manufactured Homes Owner-Occupied $ 22,149,370 $ 11,614,270 $399,867,062 Other Non-Ag Real Valuation $ 242,921,621 $ 117,263,630 $14,162,176,859 Total Real Valuation $ 730,817,062 $ 412,507,580 $61,418,091,678 Railroad Valuation $ 7,169,097 $ 45,803,128 $214,157,415 Electric, Light etc. Valuation $ 9,435,138 $ 12,195,887 $1,155,530,630 Telephone within Corp. Valuation $ 121 - $23,293,749 Total Utility Valuation $ 16,604,356 $ 57,999,015 $1,392,981,794 Total Real and Utility Valuation $ 747,421,418 $ 470,506,595 $62,811,073,472 2012 valuations for taxes payable 2013 Data from SD Department of Revenue, dor.sd.gov/taxes/property

August 2013 4.0-A-33 Appendix 4.0-A
Figure 8: South Dakota Property Tax Distribution - 2012
County
Municipalities
Schools
TownshipsSpecial
Assessments
South Dakota Property Tax Distribution - 2012
Data from SD DOR, FY2012 Annual Report

August 2013 4.0-A-34 Appendix 4.0-A
2.3.6 Housing Housing data were obtained from the USCB, which compiles various housing statistics from the most recent census on a state-wide or county-wide basis. Data available for this baseline study included information about the number and type of housing units, home ownership rates, and median home values. USCB also updates certain municipal data on an annual basis via the American Community Survey (ACS), including building permits issued and number of housing units present, so that these data reflect more current trends and can be used in economic forecasting. Housing data for Niobrara and Weston County, Wyoming are also provided as these locations could also serve as potential host communities for project employees.
2.3.7 Dwelling Types Census Bureau data were collected for various types of housing units, including single-family detached and attached homes, multi-unit dwellings (apartments), mobile homes, and rooms or groups of rooms designed as separate living quarters with direct occupant access. American Community Survey data are subdivided by single unit (detached and attached) and specific housing unit type; the USCB provides the information on housing units in multi-unit structures as a percentage of total housing units. Table 16 summarizes the 2011 American Community Survey housing data for the vicinity of the permit area, including owner-occupied (generally equivalent to for sale) and rental unit vacancy rates. Fall River County has the highest rental unit vacancy rate (more than double Custer County and the two adjacent Wyoming counties).
At the time of the 2011 community survey, the majority of residences in all four counties were single-family owner-occupied homes.
Periodic estimations are made by the USCB to update the total number of housing units available within a given geography, based on building permits issued, mobile home shipments, and estimates of housing unit loss since the last census. The most recent housing unit estimation at the county level in South Dakota at the time of this writing was in 2011. Fall River County had an estimated 4,176 housing units in 2011 (USCB), a decrease of 15 units or 0.3 percent over Census 2010 data. Similarly, Custer County posted a 1.3 percent decline in housing units between 2010 and 2011, with a total of 4,566 units in 2011.
Weston County, Wyoming had 3,533 housing units according to the 2010 Census, and this had declined to 3,506 units in 2011. Housing units in Niobrara County increased from 1,338 in 2010 to 1,395 in 2011, an increase of 4.2 percent.

August 2013 4.0-A-35 Appendix 4.0-A
Table 16: Housing Unit Statistics - 2011
Housing Unit Type
Custer County, SD
Fall River County, SD
Niobrara County, WY
Weston County, WY
Units % of Total Units
% of Total Units
% of Total Units
% of Total
Total housing units 4,566 100% 4,176 100% 1,395 100% 3,506 100% Occupied housing units 3,737 81.8% 3,200 76.6% 1,041 74.6% 2,944 84.0% Vacant housing units 829 18.2% 976 23.4% 354 25.4% 562 16.0% Homeowner vacancy rate 3.7
-
1.7
2.8
Rental vacancy rate 5.2
12.9
3.7
- Single-unit housing 3,574 78.3% 2,742 65.7% 1,149 82.4% 2,460 70.2%
Multi-unit housing 278 6.1% 717 17.2% 87 6.2% 250 7.1% Mobil homes 714 15.6% 704 16.9% 159 11.4% 784 22.4% Boat, RV, van, etc. - 0.0% 13 0.3% - 0.0% - 0.0% Owner-occupied units 2,922 78.2% 2,191 68.5% 700 67.2% 2,304 78.3% Renter-occupied units 815 21.8% 1,009 31.5% 341 32.8% 640 21.7%
Occupied units lacking complete plumbing 31 0.8% 72 2.3% 5 0.5% - 0.0%
Occupied units lacking complete kitchen facilities 26 0.7% 61 1.9% - 0.0% 17 0.6% No telephone service available 103 2.8% 100 3.1% 10 1.0% 7 0.2% Data from U.S. Census Bureau, 2007-2011 American Community Survey 5-Year Estimates

August 2013 4.0-A-36 Appendix 4.0-A
3.0 POTENTIAL SOCIOECONOMIC IMPACTS
3.1 Economic Impact Analysis
3.1.1 Introduction This analysis was updated in September 2012 to be consistent with the NI 43-101 Preliminary Economic Assessment for the Dewey-Burdock Project (SRK, 2012). It was updated again in August 2013 to incorporate data from the 2010 Census and the most recent U.S. Census Bureau American Community Survey.
The results of the economic impact analysis presented in this section establish that the proposed project will provide a positive economic benefit to the direct zone of social influence and the State of South Dakota.
3.1.2 Key Assumptions Key assumptions involved in the economic analysis of the proposed project include the operating life of the proposed project and the zone of influence. These assumptions are described in more detail below.
3.1.2.1 Operating Life of the Project A key input into the economic impact analysis is the operating life of the proposed project. The proposed project is considered as a single unit of analysis including the sequentially developed well fields, a CPP, Satellite Facility and other ancillary facilities. For this analysis, the total operating life of the proposed project is assumed to be 14 years. There are three phases of operation analyzed as separate units:
• 1 year of site development and facility construction (designated Year 1) • 8 years of well field and CPP operations – includes contemporaneous well field
construction, mineral production and initiation of groundwater restoration and decommissioning (designated Years 2-9)
• 5 years of site reclamation and decommissioning of well fields and ancillary facilities (designated Years 10-14)
The economic impact analysis assumes that the Dewey and Burdock portions of the permit area would be developed simultaneously. This would begin with construction of the CPP, Satellite Facility, and initial well field in each area. Subsequent well fields would be developed

August 2013 4.0-A-37 Appendix 4.0-A
sequentially in both the Dewey and Burdock portions of the permit area. As an alternative to this development scenario, Powertech (USA) is considering developing the Satellite Facility and Dewey-area well fields initially, followed by the CPP and Burdock-area well fields.
3.1.2.2 Zone of Influence This analysis has been limited to the proposed project’s direct zone of influence that is defined as the area within which the proposed project’s impacts and benefits are reasonably anticipated to be concentrated, including the population areas most likely to contribute to the proposed project’s local workforce and to provide ongoing sources of supplies and commodities during construction and operations.
As described in Section 2.1, the direct zone of influence includes areas within a radius of 50 miles from the center of the permit area and includes the townships, towns, and unincorporated areas within Fall River and Custer counties. It also includes the Wyoming towns of Newcastle and Osage in Weston County; however, because the proposed project is located entirely within Custer and Fall River counties the economic analysis evaluates the proposed project’s economic impact only within Custer and Fall River counties and considers only the South Dakota taxes that will be levied. The 50-mile radius includes areas considered close enough to reasonably supply workers or supplies to the proposed project on a regular basis. No areas of appreciable population were located within this radius (50 miles) in other Wyoming counties or to the south in Nebraska.
Rapid City may serve as a regional hub and source of workers and supplies for the proposed project as well. Because of its greater distance from the proposed project, Rapid City is considered to be part of the proposed project’s indirect zone of influence. Two other communities in Pennington County also fall within the proposed project’s indirect zone of influence: Hill City and Keystone.
3.1.3 Potential Benefits and Impacts This section evaluates the economic benefits and potential socioeconomic impacts of construction and operation-related activities over the life of the proposed project. Economic benefits created from the proposed project include the number of jobs created and local and state tax revenues generated and other activities that have the potential to favorably affect the local economy.

August 2013 4.0-A-38 Appendix 4.0-A
The counties of Custer and Fall River, South Dakota were analyzed using the two industry sectors most closely associated with the stages of development of the proposed project: construction and support activities for mining.
3.1.3.1 Input Data Pre-production capital costs for the project have been estimated at $51 million (SRK, 2012). Most of the initial capital cost is for the CPP and facilities (about $30,216,000). About $8,760,000 is for the initial well fields. The remainder of the initial capital cost is for capital labor (about $1,558,000), general administrative costs (about $1,979,000), and a 20-percent contingency (about $8,502,000).
The total recoverable reserve is currently estimated at 8.4 million pounds. For the purposes of the PEA, it was assumed that the yellowcake will be sold under a long-term contract at a price of $65 per pound. The severance tax rate for uranium is 4.5 percent of the selling price, and this is split evenly between the state and the county from which the mineral is severed. It is assumed that about half the production will come from Custer County and about half from Fall River County. The 0.24 percent conservation tax and the 2 percent contractor’s excise tax will all go to the State of South Dakota. Table 17 summarizes the input data.
Employment has been estimated to vary by project phase. Construction of facilities is expected to require 57 employees for a 1-year duration. Construction of well fields is expected to require 42 workers in Years 1 through 8. Production is expected to require 60 employees in years 2 through 9. Groundwater restoration is expected to begin in Year 4, after the initial well field has been depleted, and will require 6 workers in years 4 through 9. The initial year of decommissioning will be Year 7, when the first well fields will have been restored and stabilized. Decommissioning is projected to require 15 workers for 8 years (Years 7-14). Total direct employment by year based on these projections is shown in Table 18.
3.1.3.2 Employment Effects Economists use a job multiplier to estimate the total employment effect from adding new jobs to an area. Table 19 shows some typical jobs multipliers, based on data from the U.S. Bureau of Economic Analysis. Mining jobs are generally considered “primary” jobs and carry high multipliers. For example, coal mining jobs in Table 19 might have a multiplier of 4.4. This means that for every job in the coal mining industry other local business and industries add 3.4 jobs. Regional variations and economic conditions can affect the jobs multiplier, so a very

August 2013 4.0-A-39 Appendix 4.0-A
Table 17: Basic Input Data for the Dewey-Burdock Project Economic Analysis
Item Description Quantity of U3O8 produced 8.4 million pounds, half from each county
Assumed selling price of U3O8 $65 per pound, long-term contract price
Severance tax rate 4.5%, split between state and counties where production occurs Conservation tax rate 0.24%, paid only to the state Contractor's excise tax 2% imposed on the gross receipts of all prime
contractors on construction projects Initial capital construction cost $51 million (includes 20% contingency)

August 2013 4.0-A-40 Appendix 4.0-A
Table 18: Estimated Employment Effects of the Project
Description Number of Workers by Year
1 2 3 4 5 6 7 8 9 10 11 12 13 14 Direct employees
Construction - facilities 57 57 Construction - well fields 42 42 42 42 42 42 42 42
Production
60 60 60 60 60 60 60 60 Groundwater restoration
6 6 6 6 6 6
Decommissioning
15 15 15 15 15 15 15 15 Total direct employees 99 159 102 108 108 108 123 123 81 15 15 15 15 15 Indirect employees (0.7 multiplier) 69 111 71 76 76 76 86 86 57 11 11 11 11 11 Total employees 168 270 173 184 184 184 209 209 138 26 26 26 26 26

August 2013 4.0-A-41 Appendix 4.0-A
Table 19: Example United States Industry Employment Multipliers
Industry Employment
Multiplier Farm products and agricultural, forestry, and fishing services 1.5 Forestry and fishing products 5.6 Coal mining 4.4 Oil and gas extraction 6.9 Metal mining and nonmetallic minerals, except fuels 2.3 Construction 1.6 Food and kindred products and tobacco products 5.5 Printing and publishing 1.7 Chemicals and allied products and petroleum and coal products 6.3 Lumber and wood products and furniture and fixtures 2.3 Stone, clay, and glass products 2.4 Fabricated metal products 2.2 Wholesale trade 1.9 Retail trade 0.8
Examples from U.S. Bureau of Economic Analysis

August 2013 4.0-A-42 Appendix 4.0-A
conservative multiplier of 1.7 was used in this analysis. According to Table 19, a jobs multiplier of 1.7 would be more typical of the construction, printing, and wholesale trade industries than mining. However, even with this conservatively small multiplier, the effects of adding up to 159 direct employees can be appreciable, as shown in Table 18.
These conservative estimates indicate that the proposed project has the potential to create a total of 270 (including 159 direct) jobs during Year 2 and an average of 191 (including 112 direct) jobs during construction and production (Years 1 through 9, Table 18.)
3.1.3.3 State and Local Tax Revenues Potential state and local tax revenues associated with the proposed project are presented in Table 20. Only direct taxes, which include severance taxes, conservation tax, contractor’s excise tax and property taxes are included in the table.
There would be other tax revenues, including sales and use taxes, and others, that would add to the overall project benefits but are difficult to quantify at this time.
3.1.3.4 State and Local Value Added Benefits Value added is a measure of wealth created by an economy. In other words, as an industry buys goods and services and remanufactures those goods to create a product of greater value, this increase in value represents the value added. Examples of value that the Dewey-Burdock Project could add to the local economy include indirect employee wages, sales and use taxes, and increased use of local businesses, including banks and other service establishments. While recognized as economic benefits, these factors are difficult to predict and were not estimated for this report.
3.1.3.5 Benefits of Environmental Research and Monitoring Due to the remoteness and low population of the permit area, the ongoing environmental baseline studies and monitoring have greatly increased the information available on the area’s natural resources. Required operational monitoring as presented in Section 5.5 of the report accompanying the LSM permit application will continue to provide beneficial scientific data about the area.
3.1.3.6 Potential Effects to Housing Because of the project’s close proximity to the communities of Edgemont, Custer City and Hot Springs, South Dakota and Newcastle, Wyoming, with a combined population greater than

August 2013 4.0-A-43 Appendix 4.0-A
Table 20: State and Local Tax Revenues
Item State of South
Dakota Custer County Fall River
County Severance tax (4.5%) $12,285,000 $6,142,500 $6,142,500 Conservation tax (0.24%) $1,310,000
Contractor’s excise tax (2%) $1,020,000 Property tax 1
$716,000 $2,130,000
Total $14,615,000 $6,858,500 $8,272,500 Average per year (9 years) $1,623,900 $762,100 $919,200 1 Property taxes in Fall River County will not be assessed for the first 5 years; property taxes in Custer County will be assessed at full value after 5 years, incrementing by 20% per year beginning in Year 1. Property tax rates are estimated at 9.7 mills for Custer County and 13 mills for Fall River County (source: http://www.tax-rates.org/south_dakota/property-tax). Over a 9-year producing life the effective mill levy for Fall River County is 5.8 mills and the effective mill levy for Custer County is 7.8 mills. Ore reserves are not included in the property tax valuation. Because property valuation will be performed by the counties, any estimate of property taxes is preliminary.

August 2013 4.0-A-44 Appendix 4.0-A
9,000 people, it can be assumed that most of the workforce would come from these localities. The remaining workforce likely would relocate from the surrounding area (e.g., South Dakota, Nebraska and Wyoming) and from other Powertech (USA) offices. Some supervisory and technical people likely will be new hires from outside the area. During Year 2 the project has the potential to create 270 new jobs for one year. During Years 1 through 9, the period that includes construction and operation, the average direct employment is estimated to be 112 and the average total employment is estimated to be 191 (Table 18).
In the unlikely event that the entire direct payroll and non-payroll workforce relocated to Custer and Fall River counties, the maximum population increase during the initial year of production would be 656, based on the average family size in South Dakota of 2.43 as of 2011. This increase in population would account for an increase of up to 4.3 percent (total 2010 population 15,310) in the total population of Custer and Fall River counties. This is a very conservatively high estimate because it is likely that a large percentage of the workforce will be sourced from the existing workforce, thereby limiting the total population increase substantially. The impacts associated with an increase in population are expected to be dispersed because of the remoteness of the project site and the phased nature of construction, production and reclamation. Also, some of the construction workforce will be hired for the production phase and will not represent new employees. The project would potentially create a small to moderate increase in the local population, and any influx of immigration will be partially mitigated by implementing a preferential hiring scheme and using regional educational/training institutions to help train workers and to thereby hire as many of the employees as possible from the local workforce.
3.1.3.7 Potential Impacts to Services There are several schools located within Custer and Fall River counties as described in Section 2.2.2. Total enrollment for the Custer School District is about 910 students with a student to teacher ratio of about 12.1 to 1. Total enrollment for the Hot Springs School District is about 868 students with a student to teacher ratio of 14.2 to 1. The Edgemont School District has a total enrollment of 150 students and a student to teacher ratio of about 10.3 to 1 (World Media Group, LLC, 2013).
Families moving into the aforementioned school districts near the project site as a result of the project are not expected to strain the current school system because they are presently under-capacity as shown by the combined student teacher ratio for the three school districts of 11.9:1 as compared to the State-wide student teacher ratio of 13.26:1 and the national average of 15.97:1 (National Center for Education Statistics, http://NCES.ed.gov).

August 2013 4.0-A-45 Appendix 4.0-A
The costs associated with increased demand of public facilities and services are expected to be minimal. The need for additional water supply and waste disposal facilities is expected to be minimal based on adequate existing capacity. Existing emergency response and medical treatment facilities are capable of responding to any possible incident at the project site; therefore the basic services required to support the project already exist. Since the majority of the workforce will be local there are no significant changes or stresses anticipated for other public services, such as police, health care, or utilities.
3.1.4 Economic Impact Summary According to the economic impact analysis, the most significant benefits are the potential to create up to 270 (direct and indirect) new jobs during construction, an average of 191 (direct and indirect) jobs during an estimated 9 years of construction and operation, and 26 jobs (direct and indirect) during the final 5 years of reclamation, all of which will have direct and indirect effects on the local economies. In addition, an estimated $51 million could be spent on initial construction expenditures, and direct tax benefits could total over $14.6 million to the State of South Dakota, $6.9 million to Custer County and $8.3 million to Fall River County. Severance taxes could be $24.6 million or more depending upon market prices and the availability of additional reserves proven during future exploration and delineation.
Impacts to the regional housing market should be minimal because of the large percentage of local workers. Impacts to schools and public facilities should be negligible because of their present ability to absorb any associated regional influx.
This economic impact analysis indicates that the construction and operation costs including capital costs of this project will result in positive economic benefits to the local and regional economy by the creation of hundreds of jobs and millions of dollars in tax revenue over the life of the project.
The development the ISR project should present Custer and Fall River counties with net positive gain.

August 2013 4.0-A-46 Appendix 4.0-A
4.0 REFERENCES ACS (U.S. Census Bureau, American Community Survey), 2011, annual census estimate for
2011, available from the Internet on August 12, 2013: http://factfinder.census.gov/servlet/DatasetMainPageServlet?_program=ACS&_submenuId=population_0&_lang=en&_ts=.
Goldman, T., S. Corbett, and M. Wachs, 2001, Local Option Transportation Taxes in the United States, Appendix for South Dakota, Research Report UCB-ITS-RR-2001-3, Institute of Transportation Studies, University of California at Berkeley, available from the Internet on March 12, 2008: http://www.its.berkeley.edu/publications/UCB/2001/RR/UCB-ITS-RR-2001-3.pdf.
National Center for Education Statistics, available from the Internet on August 12, 2013: http://NCES.ed.gov.
SD Department of Revenue, 2012, Annual Report, FY2012, available from the Internet as of August 12, 2013: http://www.state.sd.us/drr2/publicat.htm.
SD DOL (South Dakota Department of Labor and Regulation), 2012, Annual Labor Market Report for South Dakota, 2012, available from the Internet as of August 2013: http://dlr.sd.gov/pubs.
SD GOED (South Dakota Governor’s Office of Economic Development), 2013, County Summary Reports for Custer and Fall River Counties. Available from the Internet in August 2013 from: http://www.sdreadytowork.com/location-Tools---Data-Locate-Your-Business.aspx.
SRK (SRK Consulting (U.S.), Inc.), 2012, NI 43-101 Technical Report, Preliminary Economic Assessment, Dewey-Burdock Project, April 17, 2012. Available from the SEDAR filing system as of June 2012: http://www.sedar.com.
USCB (U.S. Census Bureau), 2010, Dicennial Census 2010, available from the Internet as of August 12, 2013: http://factfinder2.census.gov.
World Media Group, LLC, 2013, Your Local USA Guide, available from the Internet on August 12, 2013: http://usa.com.