appendix 5 phosphate rock requirement for …
TRANSCRIPT
APPENDIX 5
PHOSPHATE ROCK REQUIREMENT FOR BOOMERANG LAKE - LABORATORY EXPERIMENTS
BOOMERANG LAKE PHYTOPLANKTON, 1995
1995 NATURE PAPER CONTROLLED REVERSAL OF LAKE ACIDIFICATION
BY TREATMENT WITH PHOSPHATE FERTILIZER
FINAL REPORT 1995
NOVEMBER, 1995
TALISMAN SOUTH BAY
PHOSPHATE ROCK REQUIREMENT FOR
BOOMERANG LAKE
Laboratory Experiments to Determine
Best Rock Type and Application Rates
May 19, 1995
A. Fyson and M.P. Smith
TABLE OF CONTENTS
1.0 Introduction . . . . . . . . . . . . . . . . . . . . . . . . . . . . . . . . . . . . . . . . . . . . . . . 1 2.0 Experiment 1 . pH and Chemistry of Phosphate Rock Treated
Boomerang Lake Water . . . . . . . . . . . . . . . . . . . . . . . . . . . . . . . . . . . . . . . 1 2.1 Method . . . . . . . . . . . . . . . . . . . . . . . . . . . . . . . . . . . . . . . . . . . . . 2 2.2 Results and Discussion . . . . . . . . . . . . . . . . . . . . . . . . . . . . . . . . . 2 Experiment 2 - Phosphate Rock Type and Change in pH . . . . . . . . . . . . . 4 3.1 Methods . . . . . . . . . . . . . . . . . . . . . . . . . . . . . . . . . . . . . . . . . . . . 4 3.2 Results and Discussion . . . . . . . . . . . . . . . . . . . . . . . . . . . . . . . . . 5
4.0 Experiment 3 - Boomerang Lake Water Column . . . . . . . . . . . . . . . . . . . . 6 4.1 Methods . . . . . . . . . . . . . . . . . . . . . . . . . . . . . . . . . . . . . . . . . . . . 6 4.2 Results . . . . . . . . . . . . . . . . . . . . . . . . . . . . . . . . . . . . . . . . . . . . . 7 Experiment 4 - Boomerang Lake Water Column with Sediment . . . . . . . . . 8 5.1 Methods . . . . . . . . . . . . . . . . . . . . . . . . . . . . . . . . . . . . . . . . . . . . 8 5.2 Results . . . . . . . . . . . . . . . . . . . . . . . . . . . . . . . . . . . . . . . . . . . . . 9
6.0 Summary and General Discussion . . . . . . . . . . . . . . . . . . . . . . . . . . . . . 10 7.0 Recommendation . . . . . . . . . . . . . . . . . . . . . . . . . . . . . . . . . . . . . . . . . 11
LIST OF TABLES
Table 1 . . . . . . . . . . . . . . . . . . . . . . . . . . . . . . . . . . . . . . . . . . . . . . . . . . . . . 12 Table 2 . . . . . . . . . . . . . . . . . . . . . . . . . . . . . . . . . . . . . . . . . . . . . . . . . . . . . J2 Table 3 . . . . . . . . . . . . . . . . . . . . . . . . . . . . . . . . . . . . . . . . . . . . . . . . . . . . . 13
LIST OF FIGURES
3.0
5.0
Figure l a . . . . . . . . . . . . . . . . . . . . . . . . . . . . . . . . . . . . . . . . . . . . . . . . . . . . 14 Figure I b . . . . . . . . . . . . . . . . . . . . . . . . . . . . . . . . . . . . . . . . . . . . . . . . . . . . 14 Figure2a . . . . . . . . . . . . . . . . . . . . . . . . . . . . . . . . . . . . . . . . . . . . . . . . . . . . 15 Figure2b . . . . . . . . . . . . . . . . . . . . . . . . . . . . . . . . . . . . . . . . . . . . . . . . . . . . 15 Figure 3a . . . . . . . . . . . . . . . . . . . . . . . . . . . . . . . . . . . . . . . . . . . . . . . . . . . . 16 Figure 3b . . . . . . . . . . . . . . . . . . . . . . . . . . . . . . . . . . . . . . . . . . . . . . . . . . . . 16 Figure 3c . . . . . . . . . . . . . . . . . . . . . . . . . . . . . . . . . . . . . . . . . . . . . . . . . . . . 17 Figure4 . . . . . . . . . . . . . . . . . . . . . . . . . . . . . . . . . . . . . . . . . . . . . . . . . . . . . 17 Figure 5a . . . . . . . . . . . . . . . . . . . . . . . . . . . . . . . . . . . . . . . . . . . . . . . . . . . . 18 Figure 5b . . . . . . . . . . . . . . . . . . . . . . . . . . . . . . . . . . . . . . . . . . . . . . . . . . . . 18 Figure 6a . . . . . . . . . . . . . . . . . . . . . . . . . . . . . . . . . . . . . . . . . . . . . . . . . . . . 19 Figure 6b . . . . . . . . . . . . . . . . . . . . . . . . . . . . . . . . . . . . . . . . . . . . . . . . . . . . 19 Figure 7 . . . . . . . . . . . . . . . . . . . . . . . . . . . . . . . . . . . . . . . . . . . . . . . . . . . . . . 20
LIST OF SCHEMATICS
Schematic 1 . . . . . . . . . . . . . . . . . . . . . . . . . . . . . . . . . . . . . . . . . . . . . . . . . . 21
i
1 .O Introduction
Phosphate rock has been tested over the past three years as an experimental
treatment for removal of dissolved metals and acidity from Boomerang Lake. Natural
phosphate rock contains calcium phosphates which, upon addition to acid mine
drainage, form iron phosphate precipitates at relatively low pH.
To scale up and optimize the addition in terms of economics and efficacy, laboratory
experiments are required.
In 1992, 1993 and 1994, tests have been performed in the lab and field. In the
laboratory, it has been clearly shown that addition of natural phosphate rock to acid
mine drainage induces the precipitation of iron, aluminum, zinc and copper, raises the
pH and overall neutralizes acidity.
Unfortunately, applications of natural phosphate rock in Boomerang Lake (1,000,000
m3) have not resulted in appreciable water quality changes. Presently, it appears that
an insufficient quantity of phosphate rock was added, andlor dissolution of the type of
natural phosphate rock was too slow as it settled to the sediments.
The results of four laboratory experiments, petformed in series, are described below.
For these experiments, Boomerang Lake water (8-8) was collected on February 28,
1995.
2.0 Experiment 1 pH and Chemistry of Phosphate Rock-Treated
Boomerang Lake Water
Objective: To examine the effect of phosphate rock additions (Code 31) on pH, the time
course of pH changes and the chemistry of the water at different pHs. This will help
decide the dosage of phosphate rock and provide a target pH.
1
2.1 Method
A glass jar containing 2 L of Boomerang Lake water was set up in the laboratory, and
stirred using a magnetic stirrer. A dose of 0.4 g of Code 31 phosphate rock was added
to the surface of the vigorously stirring water. The phosphate rock was rapidly mixed
into the sample. The water pH was monitored continuously. When the pH value
reached a plateau, another 0.4 g code 31 was added. This processes was continued
until 2.4 g had been added. During this monitoring period, water samples were
extracted from the 2 L system when the pH reached 4.0, 4.5, 5.0, 5.5, 6.0 and 6.5.
After the final Code 31 phosphate rock addition, pH was monitored periodically over a
9 day period to determine long term pH changes. The jar was kept covered between
measurements to minimize evaporatory water loss.
2.2 Results and Discussion
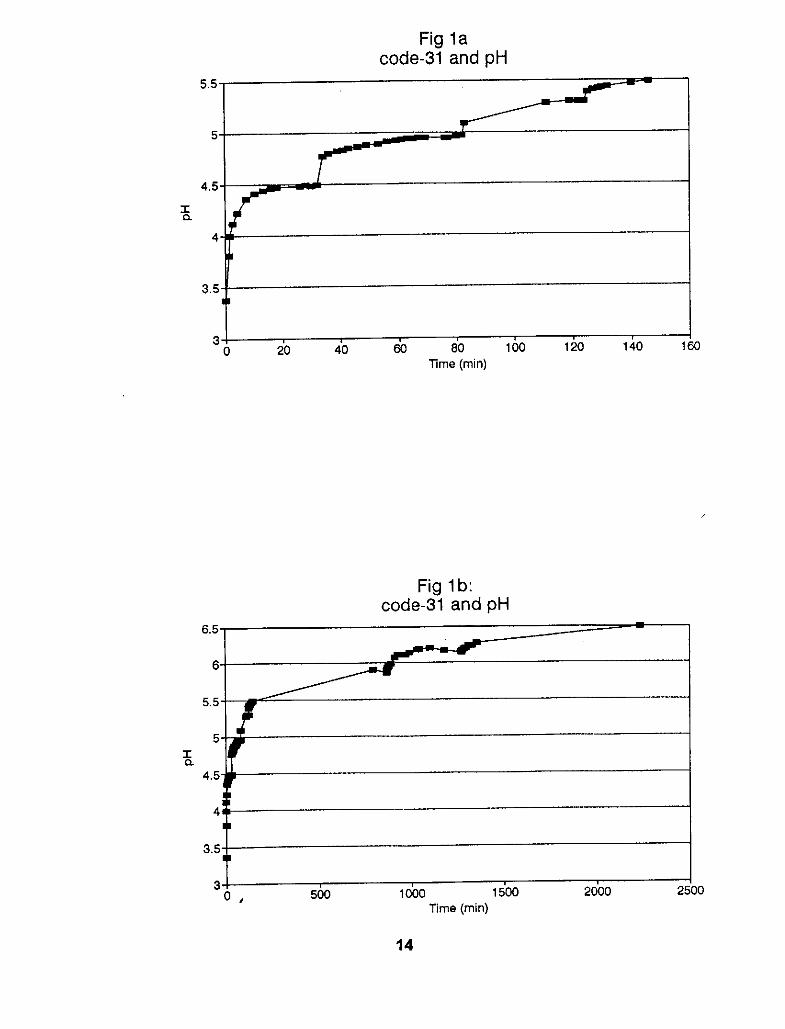
Code 31 Addition and pH
The stirring of water provided optimum conditions for interaction between the code31
phosphate rock and the Boomerang Lake water sample. The time course of pH in
relation to additions of code 1 are shown in Fig l a (0-146 min) and Fig I b (0-2236
min). Following the first addition of code 31 (0.2g.L-’), pH rose from 3.37 to 3.81 in 75
seconds, and nearly 4.5 within 20 minutes after which pH remained relatively stable
(Fig la) .
Following addition of another 0.2 g.L-’ of code 31 (cumulative concentration, 0.4 g.L-’),
there was a rapid rise in pH within 2 minutes (Fig la). Thereafter, pH rose gradually
and stabilized at approximately pH 5, at which point a further 0.2 g.L-’ dose of code 31
was added. This elevated the pH to 5.3. Another dose of code 31 was added bringing
the total to 0.8 g.L-’ and left overnight. The pH rose to 5.91. Further additions of
phosphate rock were made. With each addition, the change in pH was smaller (Fig
1 b). After the final addition (total 1.2 g.L-’), the jar was stirred for several days and the
pH periodically monitored. There was a very slow rise in pH to 6.5 (Fig Ib ) and,
2

eventually, to 7.1 after 8 days (data not shown). Clearly, dissolution of phosphate rock
is continued over the final days, albeit at a slower rate than in the first hours of the
experiment in conditions of lower pH.
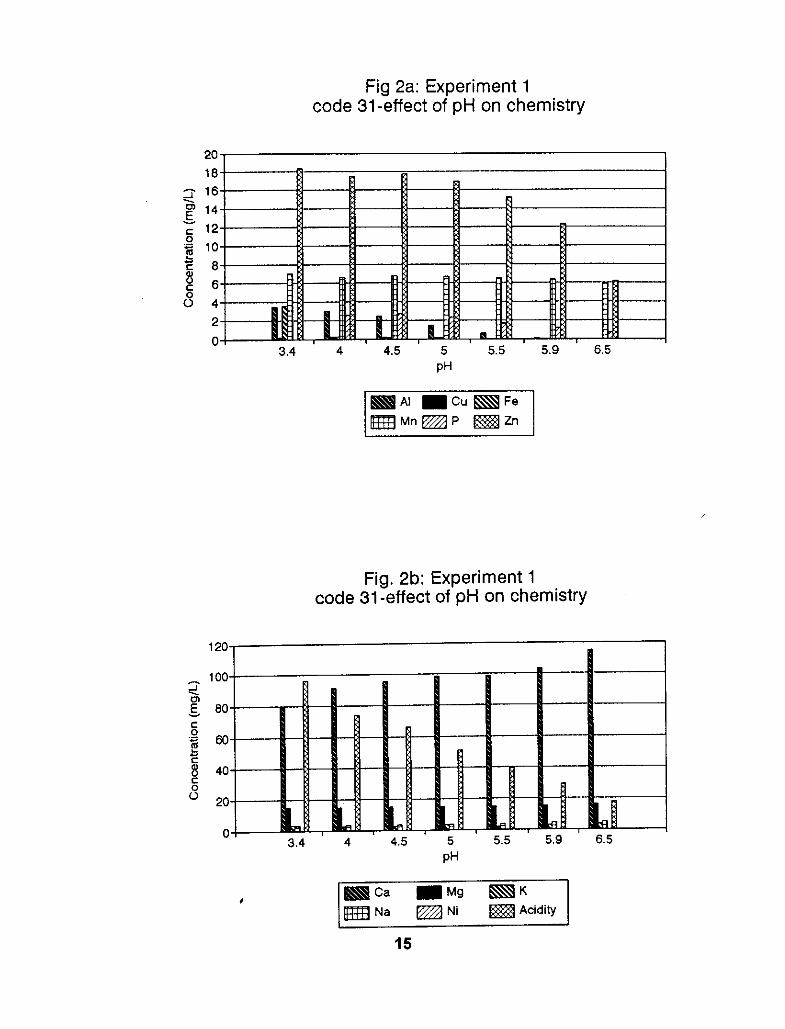
Water Chemistry and pH
Each addition of code 31 increased pH. Overall, this experiment provided a pH ranging
from 3.37 (no code 31) to higher than 6.5 (1.2 9.L“ code 31). Analysis of water through
this pH range can provide an insight into what processes are occurring. Water samples
100 mL in volume were collected prior to addition of each dosage of code 31. These
samples were filtered and acidified and submitted for elemental analysis by CAP.
Acidity of samples was determined by titration with NaOH in a Metrohm, Titrino
Autotitrator.
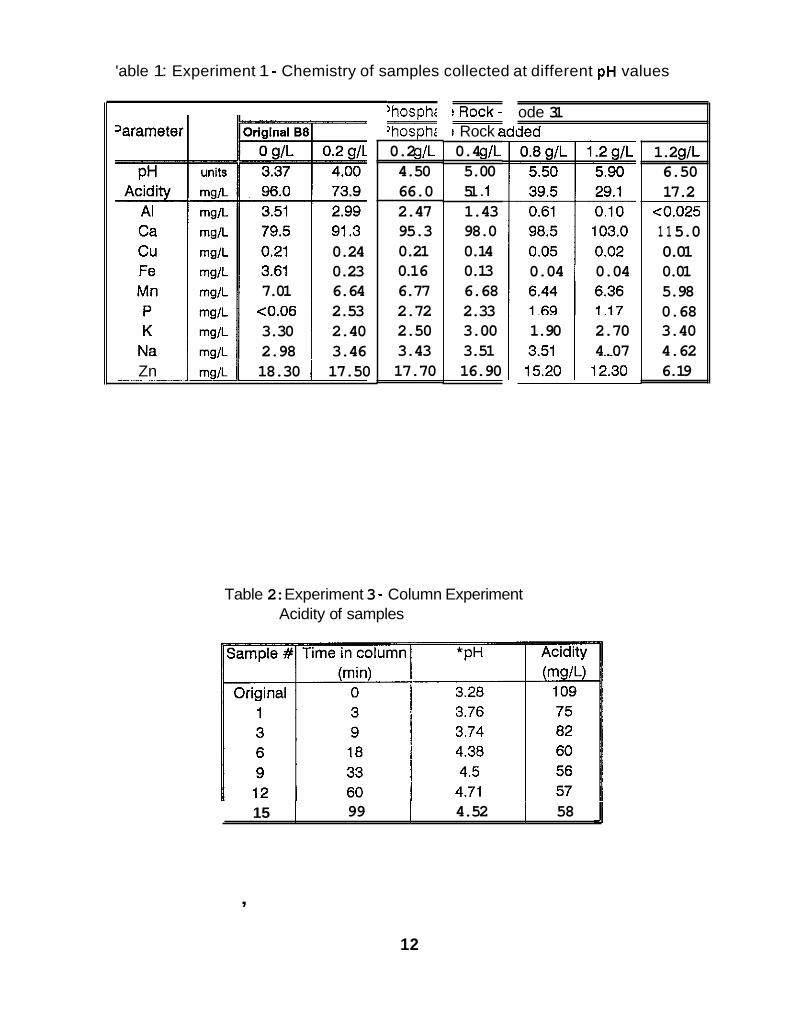
The ICAP data for the most abundant elements is summarised together with acidity
data in relation to pH of the sample in Table 1 and Figures 2a and 2b.
Following addition of the first 0.2 g.L-’ code 31 and an increase of pH to 4, there was
an increase in dissolved Ca and P. This is due to dissolution of these most abundant
elements present in phosphate rock.
With further code 31 additions and increase in pH, Ca concentrations continued to rise
to 115 mg.L:’. In contrast, at pHs greater than 4.5, P concentrations declined.
Presumably, removal of dissolved phosphate by precipitation consumed some of the
dissolved phosphate liberated from the phosphate rock.
The dissolution of phosphate rock and increase in pH was associated with a decline
in acidity from the original 96 mg.L-’ equiv. CaCO, (no code 31 addition) to 17.2 mg.L-’
following addition of a total of 1.2 g.L-’ and an increase in pH to 6.5.
There was a steady decline in Al concentration with increase in pH. Initially, the
3
Boomerang Lake water sample contained 3.5 mg.L-’ Al at pH 3.37 (no phosphate rock
addition). At pH 6.5, the Al concentration was below the detection limit (0.025 mg.L”).
Copper showed a similar pattern of decline.
Following the addition of the first 0.2 g.L-’ of code 31, most of the Fe had dropped out
of solution by the time pH had reached 4 (declining from 3.6 mg.L” to 0.234 mg.L-’).
The Fe concentration declined further as the pH rose. The Fe is precipitating as either
phosphate or hydroxide.
Zinc concentration showed little change as pH was increasing to pH 5 (around 17-18
mg.L-‘). As the pH rose higher than pH 5, Zn dropped out of solution. At pH 6.5, only
6.2 mg.L-’ remained.
Mn, Mg, K and Na exhibited no clear change in concentration over the course of the
experiment.
3.0 Experiment 2 - Phosphate Rock Type and Change in pH
Obiective: To determine the reactivity of different types of phosphate rock with
Boomerang Lake water.
3.1 Methods
Stirred Svstem: One litre of Boomerang Lake was stirred vigorously with 0.2 g of
one of three types of phosphate rock and pH change with time was monitored. The 3
types of phosphate rock used were code 31, a very fine formulation; code 132, a small
particle size, calcined phosphate rock; and phosphate Byproduct, a very coarse
4
material. The latter was ground fine ( 4 mm particle size using mortar and pestle) for
this experiment. Grinding was performed since it is not possible to add representative
samples of less than 2 or 3 g of the phosphate Byproduct, due to the coarseness and
heterogeneity of this material. The time course of the pH change with this material may
be expected to be faster than with unground material (not tested) due to exposure of
a greater surface area to the water. Final pH will probably be similar.
Stirred then Static System: A second set of jars was set up and stirred for 30
minutes to emulate the conditions which would be experienced in Boomerang Lake as
the material falls through the water column. Thereafter, the jars were left to stand and
pH monitored at the surface, middle and bottom of the jar. This will mimic conditions
once the phosphate rock has reached the bottom of the lake.
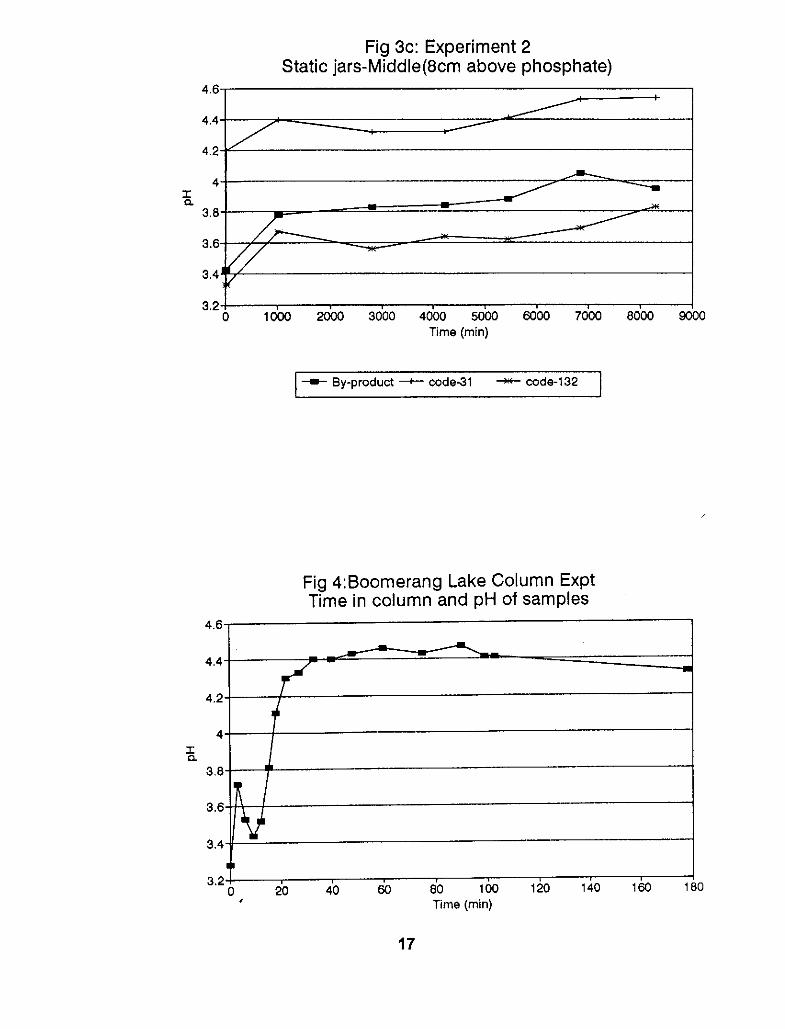
3.2 Results and Discussion
The results are shown in Fig 3a for the early observations (0-97 min) and in Fig 3b for
the long term (0-8000 min) for the stirred systems.
With code 31, pH rose rapidly to pH 4 within 11 minutes, to pH 4.13 in 21 minutes and
to pH 4.23 in 47 minutes. Thereafter, pH increased further to 4.85 within 136 hours of
stirring.
In the system with phosphate Byproduct, there was an initial small decline in pH,
followed by a slow but steady increase. By the end of the observations, pH had
reached 5.13, a value higher than the system with code 31 added. However, the initial
rate of increase was much slower than in the system with code 31.
Upon addition of code 132, the pH declined over the first 10 minutes. The subsequent
rise in pH was extremely slow. By the end of the observation period, a reading of only
4.11 had been achieved.
5
In the unstirred systems, changes in pH were very much less with all three types of
phosphate rock (Fig. 3c). Data for the middle of the jar (8 cm above bottom and below
surface) is presented. Data for the top and bottom samples were generally similar. The
stirring process clearly increases reaction rates by increasing the exposure of the rock
surface to the Boomerang Lake water. These results indicate that once the phosphate
rock has reached thee bottom of Boomerang Lake, reaction with the water and
consequent changes in pH, acidity and ion concentrations will be very slow. Much of
the 'action' occurs within the period of passage through the water column.
4.0 Experiment 3 - Boomerang Lake Water Column
Obiective: To determine time for code 31 phosphate rock to fall through the water
column and the changes in pH occurring during that time period.
4.1 Methods
A vertical plexiglass column of length 2.45 m and internal diameter 6 cm was
constructed. The set up is shown in Schematic 1. The column was filled with 7 L of
Boomerang Lake water. A dose of 1.4 g of code 31 phosphate rock was added as a
slurry to the top of the column. Water was periodically drawn off at the bottom of the
column. Phosphate rock and precipitate particles which had settled to the column
bottom since the previous sample was taken were also collected in the drawn-off
sample by gentle agitation of the settled solids with a magnet. A preliminary test-run
was carried out with distilled water with pH adjusted to that of Boomerang Lake (pH
3.4) with H,SO, (pH will affect CO, gas production, the ascent of bubbles of which will
affect the settling rate of fine particles). This run was performed to test the system and
determine how and when to sample. The experiment itself was run with Boomerang
Lake 88 water in the column. Code 31 phosphate rock was chosen, as previous
experiments determined that it reacts more rapidly than other materials tested and
since it is finer, will likely remain longer in the water column (before settling) and,
therefore, have mo;e effect per unit weight on water chemistry.
6

The pH was determined for each sample collected immediately on collection (the
phosphate rock will continue to react with the water). The sample was filtered as soon
as possible through 0.45 pm pore cellulose acetate filters. The filters were dried in a
drying oven and weighed to determine the total phosphate rock (plus any precipitated
material) in each sample. Some filtered samples were titrated against NaOH to
determine acidity.
4.2 Results
Figure 4 shows the pH of samples against time in the column. After an initial
fluctuation, there was a rapid rise in pH from 3.44 (collected 9 minutes following code
31 addition) to pH 4.3 at 20 minutes. This pH value is similar to that observed following
20 minutes of stirring (Fig l a and 3a).
The titration data (Table 2) shows that from an initial 109 mg.L-’, acidity declined to 60
mg.L-’ for a sample collected 18 minutes after addition of code 31 to the column. After
this time, the acidity remained constant, i.e. there was no further net acidity
consumption.
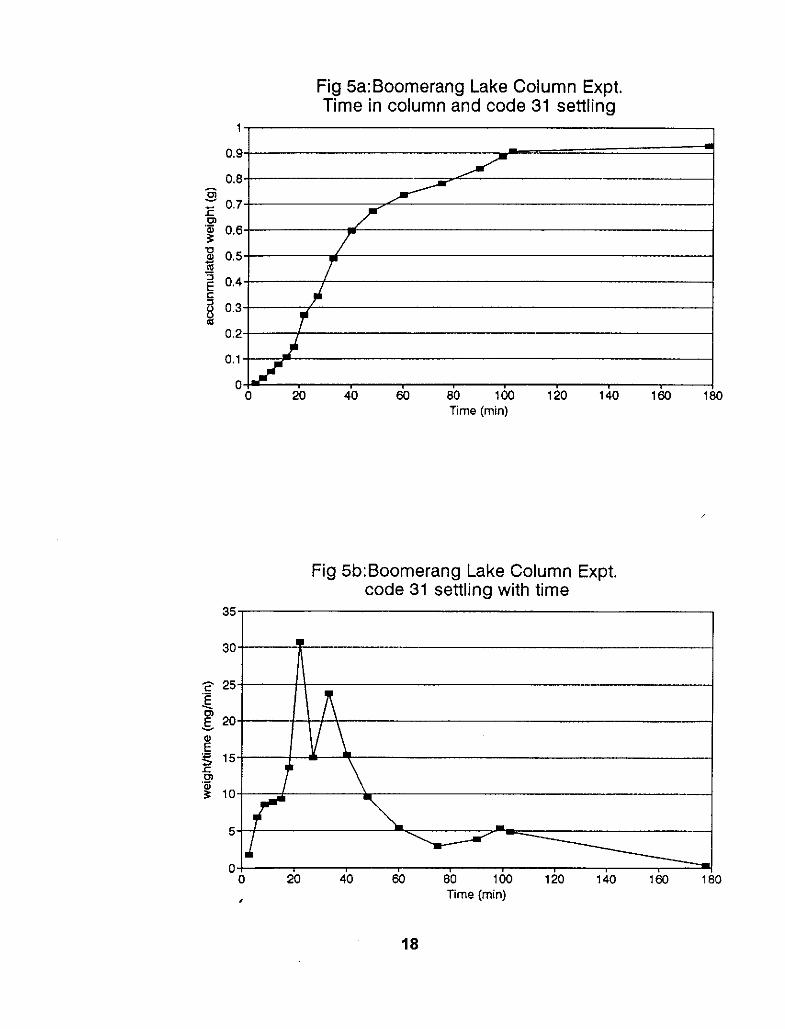
Figure 5 shows the time course of code 31 settling time through the column. Fig 5a
shows the accumulated weight of code 31 taken from the bottom of the column and Fig
5b shows the amount of code 31 collected per unit time. Although settling occurs over
a period in excess of 3 h, most material (> 60 % of collected material) settles out
between 18 and 48 minutes. The pH of samples collected for most of this period (22-
48 minutes) was in the 4.3 to 4.5 range.
In the field, some turbulence undoubtedly occurs which will add to the settling time.
Therefore, it can be anticipated that a pH of 4.3 can be achieved well before the
material settles to the bottom of the lake.
7
5.0
Obiective: To determine the effect code 31 phosphate rock addition on Boomerang
Lake water in the presence of a sediment layer
Experiment 4 - Boomerang Lake Water Column with Sediment
Previous experiments established the time course of Code 31 settling and its
relationship to pH and other aspects of water chemistry. This experiment sought to
determine the consequences of phosphate rock (type and rate as to be applied in the
field) on Boomerang Lake water set up over Boomerang Lake sediment and with
circulation to provide conditions closer to those encountered in the field than employed
previously in the laboratory column tests. Interactions at the interface between the
sediment layer and the water layer will influence the effects of phosphate rock addition
both in the short and long term.
5.1 Methods
The column set up previously as described above. The column was drained and rinsed
out prior to set up of the fourth experiment. Boomerang sediment (depth of 0.4 m) was
place in the column. A slow circulation of the water column was achieved by means of
a peristaltic pump with a flow through of 5 mL.min-'. At this rate, the entire column will
circulate in approximately 24 h. The cycling water entered the water column 10 cm
above the sediment and was withdrawn just below the water surface. This exchange
of water mimics the mixing which occurs in the field. The column was left to establish
equilibrium for a period of 26 days prior to addition of phosphate rock. Within a day of
addition of water to the sediment, an orange precipitate layer, presumably Fe(lll)
hydroxide had formed on the sediment surface. Within 7 days, a darker band began to
appear below the orange layer suggesting reduction of the Fe(lll) hydroxide. Over the
next few days, dark zones, apparently randomly distributed, developed throughout the
sediment profile at the plexiglass-sediment interface. These black zones were in turn
surrounded by a grey-brown zone, which was surrounded by a pale-orange zone. The
general colour of thd interface was orange-brown, suggesting the occurrence of some
8

iron oxidation here
1.6 g of Code 31 phosphate rock was added as a slurry as described previously. Prior
to and following addition of phosphate rock, samples were withdrawn from the top and
bottom (between cycling port and sediment surface) of the column for determination of
pH. Acidity was determined on selected, filtered samples. These have been submitted
for ICAP analysis to determine the effect of the phosphate rock (in the presence of a
sediment layer) on Boomerang Lake (B8) water chemistry.
5.2 Results
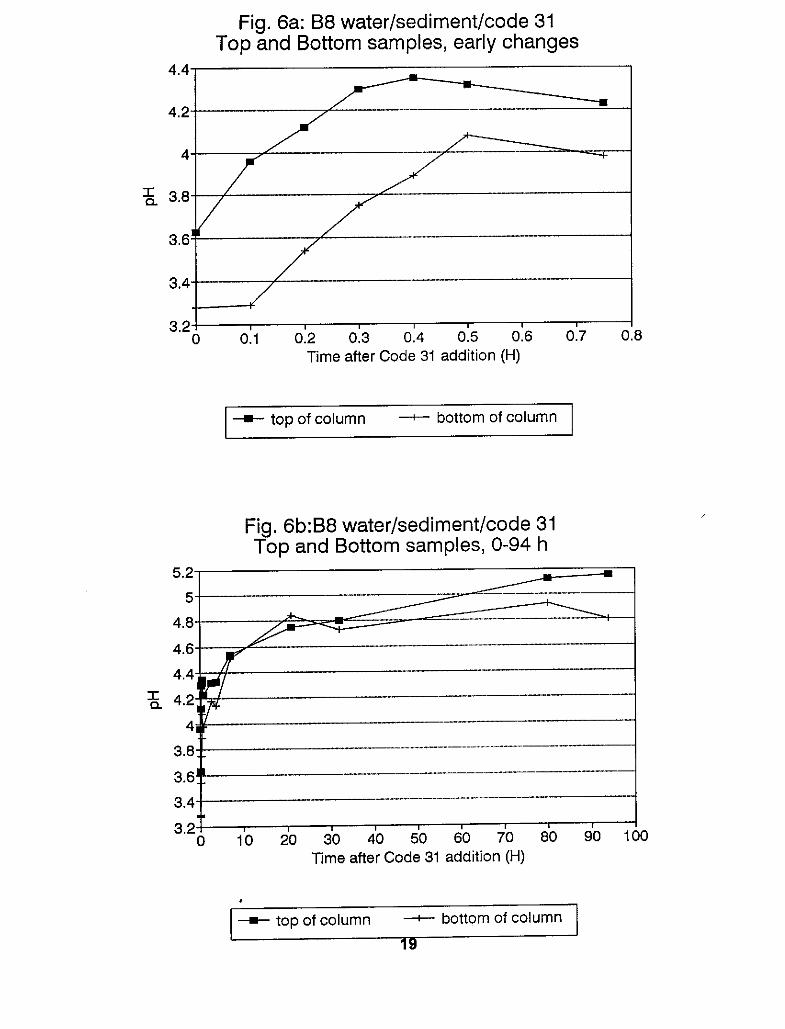
The time course pH at the top and bottom of the column following phosphate rock
addition are shown in Figure 6. The experiment was run one month after the column
was set up. There was little change in pH during this period. The pH of water at the top
of the column was consistently higher than that at the bottom. Following set up of the
column, acidity was higher at the bottom of the column than at the top. Following
addition of code 31 phosphate rock, the rate of pH change and final pH were similar
to those found previously without water circulation and without a sediment. Changes
in pH at the top of the column were observed within 6 minutes at the top of the column
and 12 minutes at the bottom of the column. The pH change occurred in two distinct
phases. The first phase, lasting about 30 minutes and shown in Figure 6a, saw the pH
at the top of the column rise from 3.6 to 4.3 and at the bottom of the column from 3.3
to 4. The second phase, shown in Figure 6b saw a slow and gradual increase in pH to
5.3 at the top and 4.8 at the bottom of the column. This suggests that the phosphate
rock was continuing to change the water chemistry after particulates had settled. Rate
of phosphate rock settling was similar to that noted in previous experiments. The water
column became clear within approximately 5 h suggesting that most of the solid code
31 particles had settled by this time.
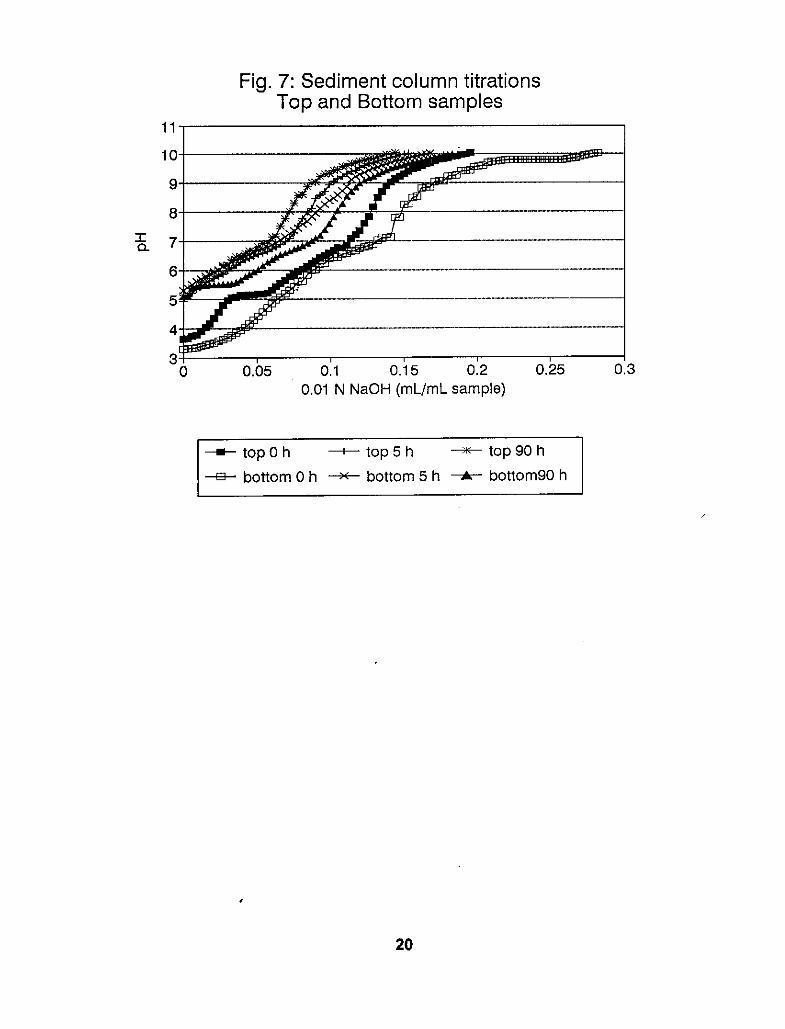
Acidity titrations for the bottom of the column from the time of addition of code 31 to 90
9

h following addition are shown in Figure 7. After column set up, the acidity of the water
column (bottom) declined from about 110 mg.L-’ to 70 mg.L” over a 30 day period prior
to addition of phosphate rock (data not shown). Following phosphate rock addition,
there was a decline in acidity from 70-80 mg.L-’ to 40-50 rng.L-’.
6.0
.
.
.
.
.
Summary and General Discussion
A 0.2 g.L-’ dose of code 31 phosphate rock with stirring in a jar or settling
through a 2.5 m deep water column increases the water pH from 3.4 to pH 4.2 - 4.3 in about 20-25 minutes.
Code 31 can raise pH of Boomerang Lake water to > 7 with continuous
optimised reaction (vigorous stirring) over a week-long period.
Raising the pH of Boomerang Lake water to 4.5 with code 31 phosphate rock
(0.2 g.L-’) results in removal of > 95 % of the Fe and 30 % of the Al.
Raising pH of Boomerang Lake water to 6.5 with code 31 phosphate rock (1.2
g.L-’) results in removal of 99.8 % Fe, 99.3 % Al and 66 % of the Zn.
Code 31 is the best material, as it is finer (longer settling time) and is more
reactive than either Phosphate Byproduct or code 132.
Code 31 has a median settling rate of approximately 10 cm.min-’ in unstirred
conditions.
Stirring, or settling time through a water column, is required for effective
interaction between code 31 and Boomerang Lake water.
In the presence of a sediment layer, pH of Boomerang Lake water rises in two
phases following addition of 0.2 g.L” code 31 phosphate rock, an initial rapid
phase to 4.2 and a slow subsequent rise to 4.8-5.3 by 90 h following the
addition.
Of the materials tested, code 31 is clearly the phosphate rock of choice for addition to
Boomerang Lake. At a rate of 0.2 g L ’ , pH can be raised to pH 4.2-4.5 within half an
hour or within the time it takes the material to settle to the bottom of the lake, sufficient
to remove most of the Fe and some of the Al from the water. Perhaps more important,
10

this pH is much more favourable for algal growth and biopolishing of Zn than the pH
of 3.4 currently found in the lake. Following the settling period, there is continued slow
reaction of the phosphate rock at the sediment surface as indicated by a continued
slow rise in pH. Phosphate rock could be used to remove Zn by raising pH to 6.5 or
7 but the quantities required (at least 1.2 g.L-' or 1200 tonnes for the whole lake) may
be prohibitively expensive and such a pH could not be achieved while the code 31 is
reactive, i.e. before the material settles to the bottom of the lake.
7.0 Recommendation
From the results of these experiments, it is recommended to add 200 metric tonnes of
code 31 to Boomerang Lake using a technique whereby the code 312 material is pre-
slurried.
While the effect of temperature upon reaction rates was not tested, it is likely that the
phosphate rock would best react at higher lake water temperatures in summer, e.g.
2O0C.
11
'able 1: Experiment 1 - Chemistry of samples collected at different pH values
15
0.24 0.23
7.01 6.64 <0.06 2.53 3.30 2.40 2.98 3.46
99 4.52 58 J]
Zn 18.30 I 17.50
'hosph: 'hosph: 0.2 g/L 4.50 66.0 2.47 95.3 0.21 0.1 6 6.77 2.72 2.50 3.43 17.70
- ! Rock - 1 Rock i 0.4 g/L 5.00 51 .I 1.43 98.0 0.1 4 0.1 3 6.68 2.33 3.00 3.51 16.90
ode 31 . I d
0.04 0.04
1.90 2.70 4.07
Table 2: Experiment 3 - Column Experiment Acidity of samples
1.2 g/L 6.50 17.2
~0.025 1 1 5.0 0.01 0.01 5.98 0.68 3.40 4.62 6.1 9
,
12

Table 3: Experiment 3 -Column Experiment
Chemistry of Water vs Time
Element 0 minutes 35 minutes 21 hours
Zn 13.9 13.0 11.6
Fe 0.38 0.07 <0.05
P 0.37 5.36 4.20
Al 2.92 2.64 1.64
Mn 4.72 4.56 4.24
c u 0.12 0.08 0.05
All values are in rnglL.
13