appendix 6 expert advices on groundwater...
TRANSCRIPT

APPENDIX 6 EXPERT ADVICES ON GROUNDWATER AND SUBSIDENCE


1
Mackie Environmental Research Pty. Ltd. ABN 62077235164
193 Plateau Rd.
Bilgola NSW 2107
Telephone: (02) 89190182
NSW Planning and Environment Planning Assessment Commission GPO Box 3415 Sydney NSW 2001
07/03/2016 Att. J. Woodward , P. Forward and A. Stoeckel
Re: Proposed longwall panels at Russell Vale coal mine – Review of groundwater studies Further to instructions, I have completed a review of the reported groundwater impacts associated with the Russell Vale underground mine in the Southern Coalfield. The proponent Wollongong Coal (WC) has prepared a number of assessment documents of which my focus has been on the Preferred Project – Residual Matters Report1 dated June 2014 (PPR-RM), the Response to Planning Assessment Review Report Part 2 Report2 dated September 2015 and the subsequent reports prepared by Geoterra and Groundwater Exploration Services (GES)3 following a revision of the groundwater model in early 2016. These documents provide information relating to the proposed mining operations, design and development of a regional groundwater flow model, simulation of mining operations and quantification of groundwater related impacts. Since the model is the platform from which groundwater related impacts have been assessed, I have essentially overviewed the translation from a conceptual flow model to the numerical model, and undertaken an appraisal of the numerical model and predicted outcomes.
1. Background to groundwater flow modelling
There are essentially two groundwater domains in the Southern Coalfield and in the area of interest:
the surficial (and shallow) systems associated with the unconsolidated regolith and swamp lands. These systems tend to act as water stores and sources of surface runoff during periods of high rainfall;
the underlying rock strata comprising interbeds of sandstone, siltstone and claystone within the Hawkesbury Sandstone, the underlying Narrabeen Group and the deeper Permian coal measures. These strata can exhibit low to moderate groundwater storage depending upon location and facies.
The Hawkesbury Sandstone is the uppermost unit and hosts the steeply incised valleys common throughout much of the Southern Coalfield. It also hosts the water table or phreatic (zero pore pressure) surface in many elevated areas. However along parts of Cataract Creek, the Hawkesbury Sandstone is completely eroded leaving exposures of Bald Hill Claystone and Bulgo Sandstone to host the water table.
The Permian coal measures comprise interbeds of sandstone, siltstone, claystone and laminite, together with the main coal seams including the Bulli, Balgownie and Wongawilli seams. Interburden strata generally exhibit low groundwater storage and transmission characteristics.
1 See Hansen Bailey, June 2014. 2 See Hansen Bailey, June 2015 3 See Geoterra, 2016 and GES 2016a and 2016b
2
The water table within the rock strata typically resides at depths varying from zero adjacent to major drainage channels, to more than 50 m in elevated terrain. The regional geometry of the water table broadly reflects topography.
The water table in the shallow systems is often more variable with perching evident in many areas, particularly in upland swamp systems.
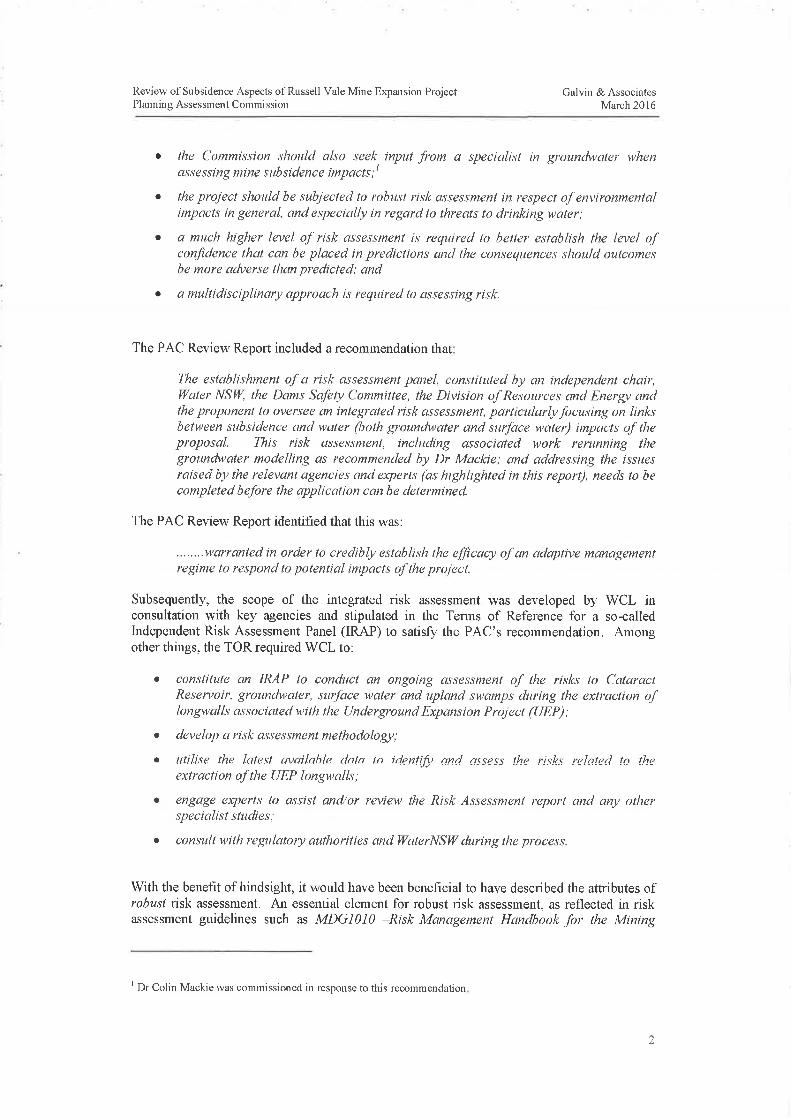
The proposed WC mining operations include eight longwalls as shown on the following Figure 1 - LW1 to LW3, LW6 and LW7, and LW9 to LW11 in the Wongawilli seam (longwalls LW4 and LW5 have already been mined). The longwalls are at depths ranging from 250 to more than 385 m (see Figure 2); Table 1 provides a summary of the depths of cover.
Table 1: Summary of proposed longwall depths of cover4 Longwall Panel Panel Width (m) Depths of cover (m)
1 131 255-320
2 125 255-330
3 150 250-340
4 150 300-360
5 150 265-345
6 150 270-345
7 131 270-340
9 150 330-380
10 150 335-390
11 150 350-385
Mining has historically been undertaken in the overlying Balgownie and Bulli seams as shown on Figure 1. The floors of these overlying old workings are approximately 20 m (Balgownie seam) and 30 m (Bulli seam) above the floor of the Wongawilli seam. Undoubtedly there is a high level of hydraulic connection between the Balgownie and Bulli seams in mined areas which is the product of subsidence above the Balgownie seam. There will also be a highly connected cracked regime above the Bulli seam where full extraction has historically occurred. Within this subsidence regime, vertical drainage will have been enhanced and a phreatic surface5 will have migrated upwards through parts of the overlying Narrabeen Group and feasibly into the Hawkesbury Sandstone. The Bulli seam workings are reported to be relatively dry with localised ponding in places6.
Proposed mining in the lowermost Wongawilli seam will generate a deeper zone of cracking which is expected to yield a highly transmissive connection to the Balgownie seam. In addition, re-activated movement within the overlying subsidence zone is likely to further enhance vertical drainage of the Narrabeen Group and the Hawkesbury Sandstone. Hence the proposed mining operations could be expected to act as a regional groundwater ‘sink’ both during and for some considerable time after mining operations cease.
Some indication of future water make is provided by the measured inflow arising from the mining of longwall panels LW4 and LW5 - reported to be about 1.1 ML/day distributed as follows:
0.3 ML/day from pre LW4 mining development headings (in the Wongawilli Seam);
0.2 ML/day for pre LW4 up dip inflow from up gradient adjacent workings in the Bulli and Balgownie Seams;
0.1 ML/day additional inflow from mining LW4;
0.5 ML/day from mining LW5.
4 see Hansen Bailey 2014, Appendix B (SCT, Update of subsidence assessment) 5 Phreatic surface surface is defined as the interface where pore pressures rapidly change from –ve to +ve (the water table is at zero pore pressure). 6 See Section 8.4, from PPR-RM Appendix C (GeoTerra – GES)

3
Longer term (post mining) recovery of strata pore pressures will be constrained by the ability to isolate workings from the entry adits in each of the three seams. This is because the adit portals are located at elevations well below the regional pre-mining water table.
2. The conceptual flow model
The conceptual model prepared by the Proponent’s groundwater consultants Geoterra and Groundwater Exploration Services (GES), is summarised in Figure 3. Fundamentally, rainfall and runoff provide inflows to the groundwater system by recharging the shallow regolith and swamp systems. These water stores promote both shallow localised flow domains and vertical infiltration downwards through the variably unsaturated vadose zone and ultimately to the fully saturated zone where a permanent water table resides.
Where mining has extracted coal (full extraction and longwall operations), the overlying strata have been subsided. As part of this process, an enhanced fracture flow regime has evolved with strata bed separations providing horizontal conduits for flow, and strain induced sub vertical cracking providing vertical connectivity between bed separations. This complex and tortuous fracture regime promotes downwards drainage of strata with flows reporting to goaves. An upwards migration of a phreatic surface accompanies the drainage.
The enhanced flow regime is often characterised by specific zones including detached roof material at the seam extraction level, an overlying highly connected fracture flow regime, a shallower constrained zone where connectivity is quite low, followed by an elastic zone where connectivity by cracking is largely absent.
Figure 1: Longwall locations and extent of overlying workings7
7 Figure from Hansen Bailey 2014, Appendix B (SCT, Update of subsidence assessment, Figure 11)

4
Figure 2: Depth of cover over longwall panels8
Figure 3: Conceptualisation of surface water and groundwater systems (PPR-RM, Figure 10 9). Red arrows indicate potential surface to adit leakage pathway.
8 Figure from Hansen Bailey 2014, Appendix B (SCT, Update of subsidence assessment, Figure 10) 9 Figure from PPR-RM Appendix C (GeoTerra - GES, Figure 31)

5
Prediction of crack occurrence, crack attributes and crack connectivity within the subsidence zone is especially difficult. Empirically based ‘rule of thumb methods’ are typically based upon longwall width, height and depth of cover while mechanistic methods employ numerical modelling of strata using mechanical properties. In the 2014 reported study10, the Proponent initially utilised an empirical relationship published by Tammetta11 to predict the maximum height of dewatering above the proposed longwall panels. Subsequently the Tammetta method was discarded in favour of piezometric observations and groundwater model calibration against the observed hydraulic gradients (see below).
Important elements of the conceptual model include leakage impacts on surface drainage channels and swamps, and the potential for sustained leakage post mining via the adit portal (shown by red arrows on Figure 3).
3. The groundwater flow model
Numerous variations of the groundwater flow model have been developed prior to and during the review period. The following discussion relates only to the most recent 2016 model because this model includes observations obtaining to numerous piezometers installed since my last review in 2015, together with a number of amendments to model components that contributed to questionable outcomes in that same model. It is noted that the significant amendments underpinning the 2016 model were introduced solely at the discretion of the Proponent and that these amendments have produced profoundly different pressure head distributions in some parts of the model domain when compared to previous models. I have inspected the 2016 model data files and can now confirm that they generate a regional flow system that is plausible.
There are three stages of modelling that have been undertaken by the Proponent. These include:
1. a pre-mining calibrated model on which the mining process has been imposed;
2. a mining process model representing extraction of the longwall panels;
3. a post mining period that examines the period of pore pressure and water table recovery (as an extended simulation of the mining process model).
These models do not include the very shallow and surficial systems associated with the regolith, swamps and any perched systems which are acknowledged to be both very difficult to characterise (hydraulically) and to represent at an appropriate scale in a groundwater flow model.
3.1 Model design and calibration
The model utilises a finite difference scheme known as Modflow-Surfact. The current model mesh simulates an area of some 392 sq.km. and accommodates 19 layers with cells of differing dimensions across the flow domain. Finer mesh discretisation has been adopted in the horizontal plane in areas around and close to the proposed longwall panels where 25 x 25 m cell dimensions have been employed. More distant areas host cells with much larger dimension (250 x 250 m). In the vertical plane, the discretisation varies from about 1m cell thickness where layers pinch out, to more than 300m thickness in the lowermost layer. Each of the three coal seams has been represented by a separate layer. The Modflow-Surfact code has been employed in the variably saturated mode.
The saturated zone hydraulic conductivities have been assessed through local field testing and from reported parameters at other regional coal mines. Tests have included falling/rising head tests, short term pumping tests, packer tests and airlift tests. Laboratory core testing has apparently been assessed (from other mining locations) in order to understand the likely lower bound for strata hydraulic conductivities in the absence of fracture enhancement. The overall database for hydraulic conductivities is reasonable.
Model calibration compares measured water table and potentiometric heads against model predicted values at these same locations. The measured values are based upon observations at some 26 piezometer locations including standpipe piezometers (14) in which the water table depth is physically measured, and vertical arrays of pore pressure sensors (12)12 in which pressure heads are
10 See Hansen Bailey, June 2014 11 see Tammetta, P., 2013. 12 see Appendix B of Geoterra-GES report in Hansen Bailey, June 2015

6
measured. In calibrating the model it is important to include periods in the observation record that contain drawdown responses attributed to mining – if available.
The Proponent states that the model calibration is acceptable. However there are two contributing factors to consider when assessing the suitability of calibration:
1. the calibration statistics of measured versus modelled potentiometric heads are biased to some extent by the shallow standpipe piezometers which only monitor the water table and do not reflect the deeper depressurisation gradients associated with mining unless of course mining has affected the water table;
2. calibration against depressurisation resulting from triple seam extraction (Wongawilli seam longwalls LW4 and LW5 plus overlying Balgownie and Bulli seam mining) is indirect - the only vertical array piezometer discussed in any detail in relation to calibration is GW1 located about 120 m from longwall LW5 and about 100 m from Cataract Creek. This is also the only piezometer that may have captured responses to stresses on the groundwater system associated with mining of longwalls LW4, LW5 and part of LW6. Figure 4 provides observed and simulated responses for pore pressure sensors installed at different depths at GW1. Equivalent model layer numbers have been assigned to the plots of observed data (continuous line) and model simulated responses (dashed line) in order to illustrate the relatively poor fit (also acknowledged by GES13). Differences between observed and predicted heads range from 10 to 30 m. Piezometers installed at other locations after mining of LW4 and LW5 have a very limited duration of baseline data; calibration against measured responses at these other locations is unreported.
Figure 4: Summary calibration at piezometer GW114
13 see GES 2016b, page 4 last paragraph 14 see GES 2016b page 5

7
Groundwater seepage rates measured during mining of longwalls LW4, LW5 and part of LW6 are reasonably replicated in the revised 2016 model.
3.2 Mining process transient model
The mining process simulation model adopts the pre-mining model water table as the starting position. This model utilises a so-called ‘drain’ boundary condition to represent the removal of groundwater from model cells located within the longwall panel areas at a reference elevation which is just above the floor of the Wongawilli seam. Activation times for drain cells representing the panels have been aligned with the planned mining schedule. Simultaneously, the hydraulic conductivities in strata overlying the coal seams have been enhanced to represent cracked strata associated with the subsidence regime thereby promoting accelerated drainage and depressurisation of those strata. This enhancement has been applied from layer 17 up to and including layer 3 of the model.
Mining in the Bulli seam has also utilised drain cells however these cells are activated well before the commencement of mining in the Wongawilli seam and remain activated throughout the period of mining.
Model outputs are provided as a series of drawdown plots and as a number of graphs indicating the predicted groundwater seepage to underground operations.
3.3 Recovery model
The recovery model is an extended transient simulation beyond the end of mining. That is, the model identified in Section 3.2 has been extended for a further 200 years with the drain cells simulating the proposed operations in the Wongawilli seam, removed from the model thereby allowing the phreatic surface associated with mining, to recover.
4. Overview of predicted impacts associated with the shallow groundwater systems
Shallow systems are associated with stream drainage channels and swamp lands. With the exception of baseflow losses to drainage channels (assuming groundwater interactions occur via porous media), impacts on these systems have not been addressed within the groundwater flow model. This is largely due to the perched nature and the scale of these systems which are acknowledged to be difficult to incorporate in a regional scale model. Additionally, flow pathways like discrete fracture networks associated with stream bed cracking and cracking beneath swamps cannot generally be represented in the groundwater flow model. Assessment of impacts on these shallow systems is therefore based largely upon experiences and observations associated with historical mining of the Bulli and Balgownie seams.
4.1 Diversion and loss of stream flows
Potential impacts of mining on drainage channels in the Southern Coalfield relate to diversion of surface water flows into subsurface crack networks that have evolved through strata movements associated with valley closure. While significant diversion and loss of flow under these conditions is known to have occurred at other locations (eg. Waratah Rivulet), recent mining of the Wongawilli seam (LW4 and LW5) has apparently not resulted in measurable loss of flow in Cataract Creek. However some diversion of flow has been inferred from the presence of iron staining observed in tributary channels to Cataract Creek15. Indeed the Proponent notes that ‘Mapping of the stream bed and tributaries indicates that baseflow seepage changes have probably already occurred in Cataract Creek, prior to extraction of longwalls 4 to 6 (340 m) in the Wongawilli Seam, based on the high degree of iron hydroxide seepage and precipitation present in the upper reaches all the way down to the Cataract Reservoir.’16 Given these observations it is conceivable that significant permanent redirection of surface flows could eventuate where seam to surface cracking occurs in close proximity to Cataract Creek and where bedding movements associated with valley closure provide lateral connection to the creek bed. The areas of concern in this regard are the eastern ends of longwall LW6 and LW7.
15 see Hansen Bailey, 2015. Appendix H, page 107 16 see Hansen Bailey, 2015. Appendix H, page 107

8
4.2 Cracking beneath swamps
Potential impacts on upland swamps through partial or complete drainage via subsurface cracking has been recognised by the Proponent with much of the focus on swamp CCUS4. The potential development of seam to surface cracking is acknowledged and offset strategies have been developed in the event that impacts are found to occur. The extent and rapidity to which these shallow groundwater systems will be affected will depend upon the presence and connectivity of the crack regime both laterally and vertically.
4.3 Height of cracking and dewatering above mined panels
There appears to be some confusion regarding the height of dewatering likely to prevail above mined longwall panels, especially where all three coal seams will be extracted. Earlier groundwater modelling (2014) included a zone of enhanced permeability that accelerated vertical drainage above extracted panels in accordance with the Tammetta empirical equation. That equation is based on single seam extraction and predicts the height of complete drainage via a connected crack regime above an extracted longwall panel based on the panel width, mining height and depth of cover.
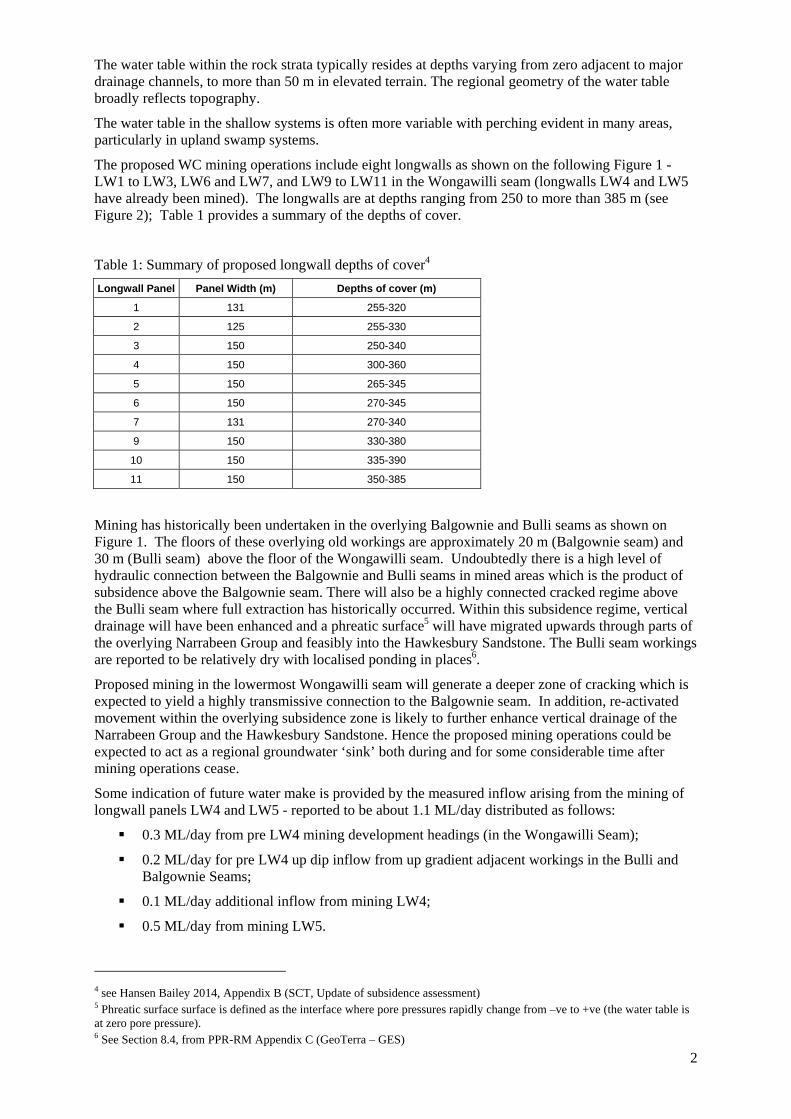
In adapting the equation, the cumulative extraction height of seams was taken to represent the height of mining by the Proponent. Hence in some areas the height is based on double seam extraction while in other areas it is based on triple seam extraction. The results were summarised in the following Figure 517 which shows areas where complete drainage (initiated by cracking) is predicted to extend to surface. I note that areas of particular concern include the western ends of longwalls LW5, LW6 and LW7 which are in close proximity to Cataract creek being less than 100 m from that drainage line and where the depth of cover is the lowest for each panel.
The Proponent notes that the adapted Tammetta method is a conservative assessment of the potential height of dewatering-cracking insofar as swamps that overly mined longwalls LW4 and LW5 have not dewatered in the period since being undermined, nor has any measurable loss of flow been recorded in Cataract Creek. The Proponent also notes that any diverted flow that may have occurred from Cataract Creek would most likely report to the mine workings but ‘the make up component of the inflows from stream flow losses and strata depressurisation is not known.’18.
The current 2016 model discards the Tammetta equation, in favour of calibration against measured pore pressure gradients at a number of piezometer locations. The calibration is based on an imposed enhancement of vertical conductivities simulating connected cracking which extends from layer 17 in the model (Wongawilli seam) upwards to layer 3 in the model (lower Hawkesbury Sandstone). At the western end of longwall LW7 adjacent to Cataract Creek this leaves layers 1 and 2 undisturbed and equates to a maximum height of connected cracking extending from the seam to about 24 m below ground level.
Since the height of cracking has been assessed from model calibration against piezometers equipped with vertical pore pressure sensors, it is instructive to examine the calibration provided in the supporting documentation. In this regard, GW1 is the only piezometer discussed in any detail presumably since this transducer array has the longest history which captures groundwater pressure reductions as a result of mining LW4 and LW5.
GW1 is located near Cataract Creek in an area where Hawkesbury Sandstone and Bald Hill Claystone have been significantly eroded. Figure 5 shows the location of GW1 which is about 130 m from the finish line of longwall LW5 and about 175 m from Cataract Creek. The observed and model predicted responses are plotted on Figure 4. As noted in Section 3.1, the difference between observed and predicted piezometric elevations varies greatly and reflects in my view, a relatively weak correlation when mining related stresses are considered. Indeed the Proponent acknowledges this, noting that ‘The model has been unable to fully simulate these physical changes, resulting in variability of observed pressures and lack of variability within the computed heads’19. These statements suggest the nominated height of cracking (determined by model calibration) is somewhat arbitrary.
17 see Hansen Bailey 2014, page 89 18 see Hansen Bailey 2014, page 90 19 see GES 2016b, page 4
9
Figure 5: Predicted separation between maximum height of complete drainage and ground surface based on Tammetta equation and cumulative mining height – yellow areas indicate crack connection to surface
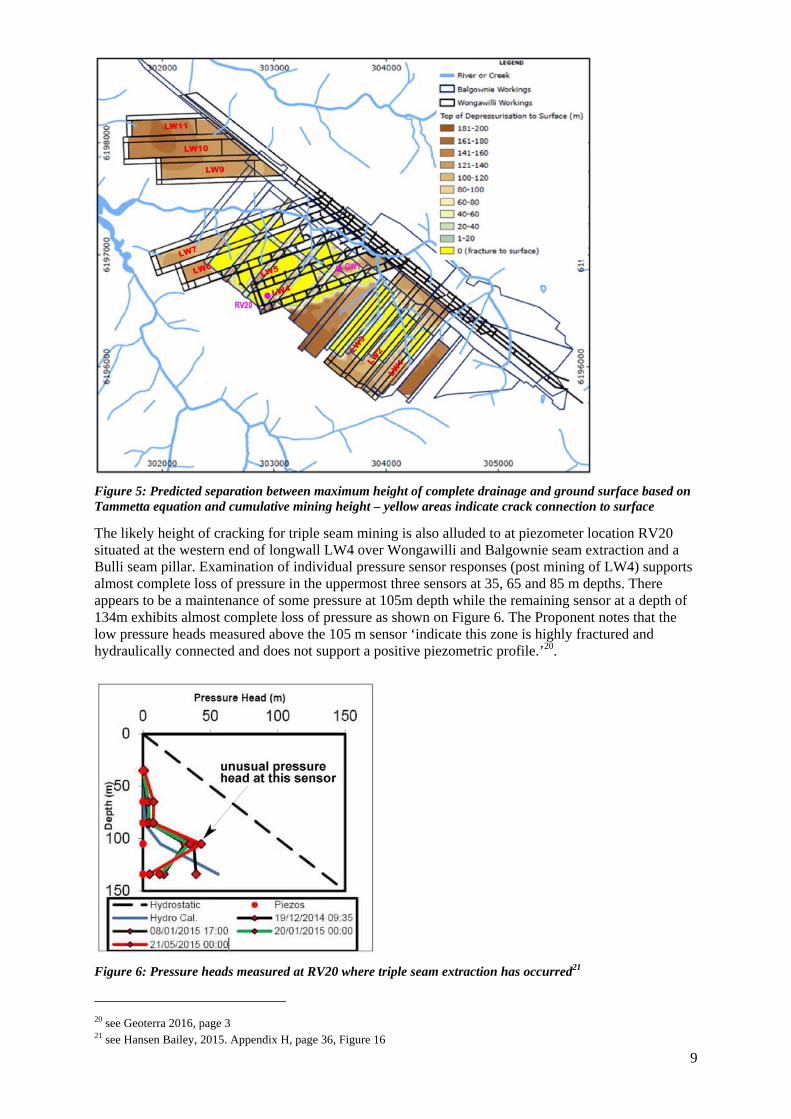
The likely height of cracking for triple seam mining is also alluded to at piezometer location RV20 situated at the western end of longwall LW4 over Wongawilli and Balgownie seam extraction and a Bulli seam pillar. Examination of individual pressure sensor responses (post mining of LW4) supports almost complete loss of pressure in the uppermost three sensors at 35, 65 and 85 m depths. There appears to be a maintenance of some pressure at 105m depth while the remaining sensor at a depth of 134m exhibits almost complete loss of pressure as shown on Figure 6. The Proponent notes that the low pressure heads measured above the 105 m sensor ‘indicate this zone is highly fractured and hydraulically connected and does not support a positive piezometric profile.’20.
Figure 6: Pressure heads measured at RV20 where triple seam extraction has occurred21
20 see Geoterra 2016, page 3 21 see Hansen Bailey, 2015. Appendix H, page 36, Figure 16

10
The 40m pressure head observed at 105 m depth is not clearly explained but a head of this magnitude would reasonably be expected to translate to a 20 m pressure head in the sensor located 20 m above - at 85 m depth. Since the 85 m sensor is effectively depressurised, it could be argued that either the 105 m sensor output is incorrect or there is a lateral connection to a somewhat remote block of strata that is slow to depressurise. If lateral connection is the cause then seam to surface cracking is entirely plausible.
5. Overview of predicted impacts associated with the deep groundwater systems
5.1 Baseflow losses to drainages
The 2016 groundwater model has been used to estimate the baseflow leakage losses via porous strata over the course of mining. These losses are determined by interrogating river cells for flow exchanges before mining, and flow exchanges post mining. They are basically losses via the porous matrix hosting a particular drainage channel and are governed by the prevailing water depth or stage at a specific channel location, and the potentiometric head in the adjacent aquifer. If the head in the aquifer is higher than the creek stage elevation then the creek is gaining water. Conversely, if the head is lower than the creek stage elevation then the creek is losing water.
Increased vertical gradients predicted by the groundwater model over the period of mining (and beyond) are expected to reduce baseflows to Cataract Creek, Cataract River and Bellambi Creek by 0.069, 0.0045 and 0.0049 ML/day respectively. These losses are considered to be generally insignificant.
5.2 Seepage losses to Cataract Reservoir
The 2016 groundwater model supports an estimate of leakage from the reservoir to the underlying strata of about 0.0005 ML/day at the completion of mining, rising to 0.007 ML/day 50 years after cessation of mining. These rates are losses to the reservoir and are governed by the strata depressurisation induced by the proposed mining operations. They are plausible and considered to be insignificant.
5.3 Mine groundwater make
The 2016 groundwater model supports estimates of mine water make that rise to a peak rate of about 3.08 ML/day (1128 ML/year) at the completion of longwall LW7, declining thereafter to a rate of 2.4 ML/day after completion of mining.22
Wollongong Coal will require water access licenses to manage and dispose of the peak volumes of groundwater. The total licensable inflow is not discussed in the 2016 groundwater model report but adopting the adjustment that the Proponent seems to have applied to previous models, the total licensable inflow is calculated to be somewhere in the range 982 to 1128 ML/year. The current water access entitlement held by the Proponent is reported to be 365 ML/year23 leaving a licensing deficit of some 617 to 763 ML/year.
Licensing for baseflow and reservoir leakage losses will also be required. A minimum provision of 15 ML/year will be required for losses via the porous rock matrix. This estimate does not include any provision for redirected surface waters from Cataract Creek or its tributaries, or for vertical leakage losses from upland swamp storage. Volumes associated with these redirected flow pathways are not calculated by the groundwater model. They are very difficult to quantify unless all losses report to the mine workings and measurement systems are in place to determine a water balance. No information is provided in the 2016 model reporting.
It is understood that the Proponent does not currently hold any relevant surface water licences.
22 see GES 2016a, page 39, Table 5 23 see Hansen Bailey, 2015 Appendix H, page 118

11
5.4 Long term recovery and adit spillage
Long term recovery of the phreatic surface associated with longwall extraction has been simulated by modifying the drainable storage parameter to reflect goaves, gate roads and main roads. All boundary conditions that were applied to longwall mining are relaxed and natural drainage from overlying interburden is then allowed to contribute to storage.
6. Key concerns
The most significant concern arising from my review is the potential loss of surface water flow in Cataract Creek via subsidence related cracking. Prerequisites for such a loss to occur include:
1. Seam to surface cracking that is interconnected and provides a vertically continuous pathway down to mine workings. Based upon the observed vertical pore pressure distributions at piezometer RV20, it is plausible that the longwall panel areas identified on Figure 5 by yellow shading will exhibit seam to surface connected cracking, particularly at the eastern ends of longwalls LW6 and LW7 where depths of cover are reduced compared to the cover that prevails at RV20.
2. Stream bed cracking and diverted flows. While creek bed damage to date appears to be low or negligible, there remains a risk that strata movements associated with valley closure could initiate cracking of the stream bed.
3. Connection between the two crack regimes. This may follow from valley closure movements with sliding of beds leading to development of horizontal flow pathways.
The 2015 Independent Risk Assessment concluded that the possibility of creek bed damage from subsidence related cracking was real. However the analysis appears to have been restricted to tributaries of Cataract Creek exclusive of Cataract Creek itself. As a worst case scenario, the Proponent considers re-direction of all surface flow from sub-catchments that are upstream of or overlying the proposed longwall panels. This area includes upland swamps.
To determine the reductions in stream flow resulting from cracking, these sub-catchments together with sub catchments associated with Cataract River and Bellambi Creek24 were excluded from the catchment runoff model.’25 This resulted in a reduction in total flow in Cataract Creek of 6.38 ML/day and in Cataract River and Bellambi Creeks of 0.56 and 0.4 ML/day respectively. These losses total 7.34 ML/day which represents 9.6% of the average flow from these catchments. The risk associated with these scenarios is classified as medium according to Risk ID AQH2121, BH2121 an d CH2121.
If Cataract Creek was to be included (assuming diverted flow and subterranean connection to the mine workings at the eastern end of LW6 and LW7), then the diverted flow losses could be substantially greater than has hitherto been assessed. This flow loss pathway appears to have been considered only in the context of adaptive management in the risk assessment. Just how this management approach would be invoked is unclear and raises significant concerns. Certainly, if such a diverted flow pathway occurs, experiences at other locations in the Southern Coalfields suggests remediation would prove difficult if not impossible.
Other concerns associated with the above relate to water access licences (surface and groundwater) which would need to be procured in a timely way should losses be identified. The logistics of this process are unclear.
24 see Hansen Bailey, 2015, 25 see Hansen Bailey, 2015, page 19

12
Figure 7: Catchment areas that are vulnerable to re-directed surface runoff through subsidence related seam to surface cracking (from Hansen Bailey 2015, WRM page 21)
Yours sincerely
Mackie Environmental Research Pty. Ltd.
C. Mackie
References:
Geoterra, 2016. Final response to PAC review. Email, February 2016
Groundwater Exploration Services (GES), 2016a. Russell Vale Colliery Underground expansion project – Groundwater modelling PAC review. Letter report to Wollongong Coal, February 2016.
Groundwater Exploration Services (GES), 2016b. Russell Vale Colliery Underground expansion project – Groundwater modelling PAC review – Technical Addendum. Letter report to Wollongong Coal, February 2016.
Hansen Bailey, 2014. Underground expansion project – Residual matters report. Report prepared for Wollongong Coal, June 2014.
Hansen Bailey, 2015. Response to Planning Assessment Commission review report. Report prepared for Wollongong Coal, September 2015.
Tammetta. P, 2013. Estimation of the Height of Complete Groundwater Drainage Above Mined Longwall Panels. Ground Water. September-October 2013, V51, No. 5, pp 723-734