appendix c condition 3 supporting...
TRANSCRIPT
Rainy River Project 2015 CEAA Annual Report - Decision Statement Condition 2.3 Appendices
APPENDIX C
CONDITION 3 SUPPORTING DOCUMENTATION
ECA 5781-9VAJQ2J Monthly Monitoring Report
New Gold Inc., Rainy River Project www.newgold.com 5967 Highway 11/71, P.O. Box 5 TSX/NYSE MKT:NGD Emo, Ontario, Canada, P0W 1E0
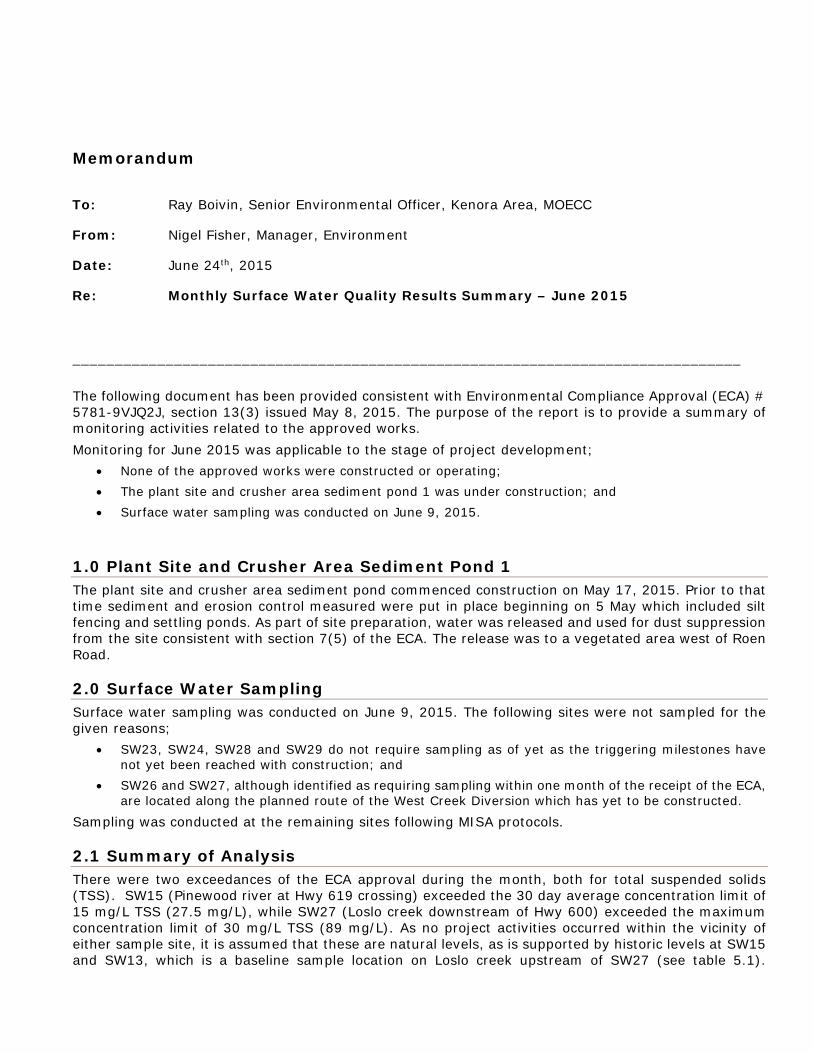
Memorandum
_______________________________________________________________________________
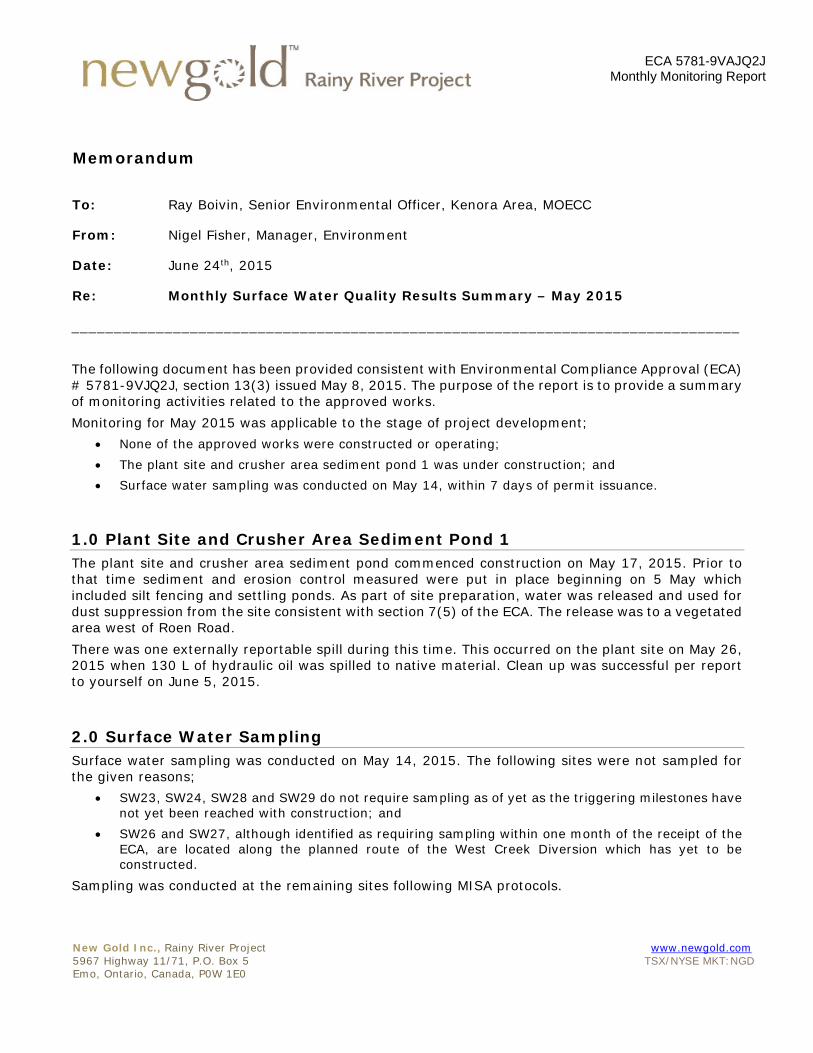
The following document has been provided consistent with Environmental Compliance Approval (ECA) # 5781-9VJQ2J, section 13(3) issued May 8, 2015. The purpose of the report is to provide a summary of monitoring activities related to the approved works. Monitoring for May 2015 was applicable to the stage of project development;
• None of the approved works were constructed or operating;• The plant site and crusher area sediment pond 1 was under construction; and• Surface water sampling was conducted on May 14, within 7 days of permit issuance.
1.0 Plant Site and Crusher Area Sediment Pond 1 The plant site and crusher area sediment pond commenced construction on May 17, 2015. Prior to that time sediment and erosion control measured were put in place beginning on 5 May which included silt fencing and settling ponds. As part of site preparation, water was released and used for dust suppression from the site consistent with section 7(5) of the ECA. The release was to a vegetated area west of Roen Road. There was one externally reportable spill during this time. This occurred on the plant site on May 26, 2015 when 130 L of hydraulic oil was spilled to native material. Clean up was successful per report to yourself on June 5, 2015.
2.0 Surface Water Sampling Surface water sampling was conducted on May 14, 2015. The following sites were not sampled for the given reasons;
• SW23, SW24, SW28 and SW29 do not require sampling as of yet as the triggering milestones havenot yet been reached with construction; and
• SW26 and SW27, although identified as requiring sampling within one month of the receipt of theECA, are located along the planned route of the West Creek Diversion which has yet to be constructed.
Sampling was conducted at the remaining sites following MISA protocols.
To: Ray Boivin, Senior Environmental Officer, Kenora Area, MOECC
From: Nigel Fisher, Manager, Environment
Date: June 24th, 2015
Re: Monthly Surface Water Quality Results Summary – May 2015
Monthly Surface Water Quality Results Summary
Per section 13(3) of ECA 5781-9VAJQ2J
New Gold Inc., Rainy River Project www.newgold.com 5967 Highway 11/71, P.O. Box 5 TSX/NYSE MKT:NGD Emo, Ontario, Canada, P0W 1E0
Page 2 of 3
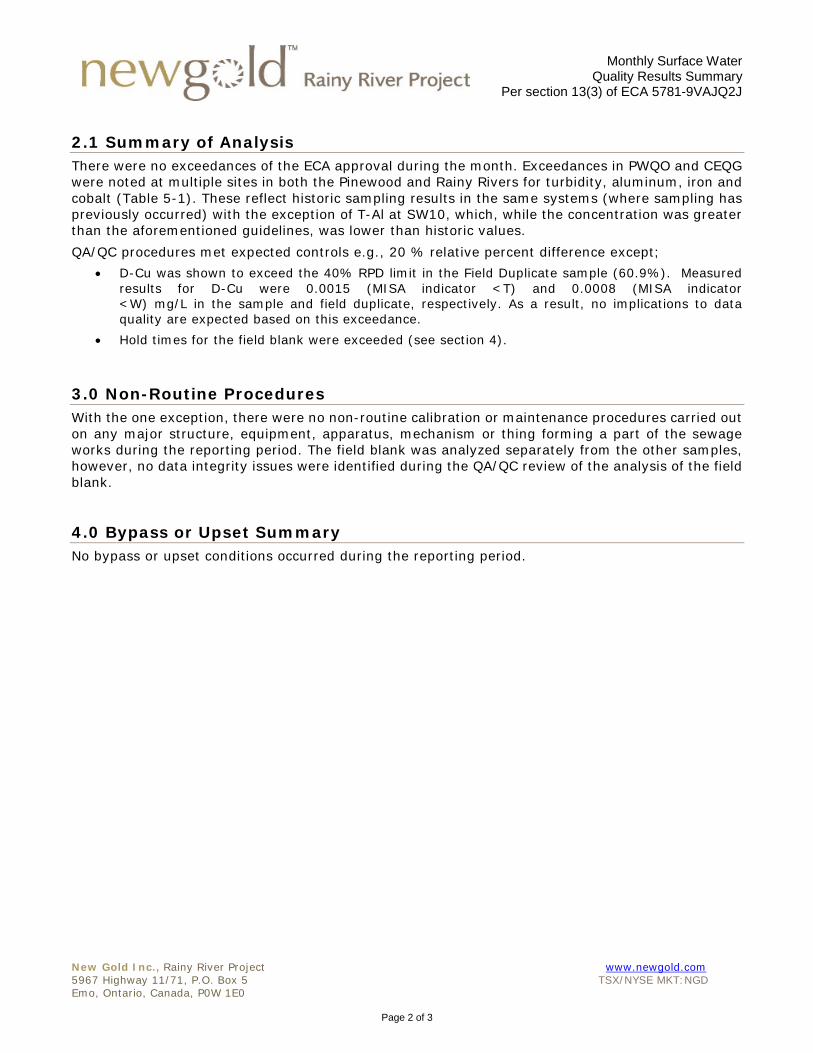
2.1 Summary of Analysis There were no exceedances of the ECA approval during the month. Exceedances in PWQO and CEQG were noted at multiple sites in both the Pinewood and Rainy Rivers for turbidity, aluminum, iron and cobalt (Table 5-1). These reflect historic sampling results in the same systems (where sampling has previously occurred) with the exception of T-Al at SW10, which, while the concentration was greater than the aforementioned guidelines, was lower than historic values. QA/QC procedures met expected controls e.g., 20 % relative percent difference except;
• D-Cu was shown to exceed the 40% RPD limit in the Field Duplicate sample (60.9%). Measuredresults for D-Cu were 0.0015 (MISA indicator <T) and 0.0008 (MISA indicator <W) mg/L in the sample and field duplicate, respectively. As a result, no implications to data quality are expected based on this exceedance.
• Hold times for the field blank were exceeded (see section 4).
3.0 Non-Routine Procedures With the one exception, there were no non-routine calibration or maintenance procedures carried out on any major structure, equipment, apparatus, mechanism or thing forming a part of the sewage works during the reporting period. The field blank was analyzed separately from the other samples, however, no data integrity issues were identified during the QA/QC review of the analysis of the field blank.
4.0 Bypass or Upset Summary No bypass or upset conditions occurred during the reporting period.
Monthly Surface Water Quality Results Summary
Per section 13(3) of ECA 5781-9VAJQ2J
New Gold Inc., Rainy River Project www.newgold.com 5967 Highway 11/71, P.O. Box 5 TSX/NYSE MKT:NGD Emo, Ontario, Canada, P0W 1E0
Page 3 of 3
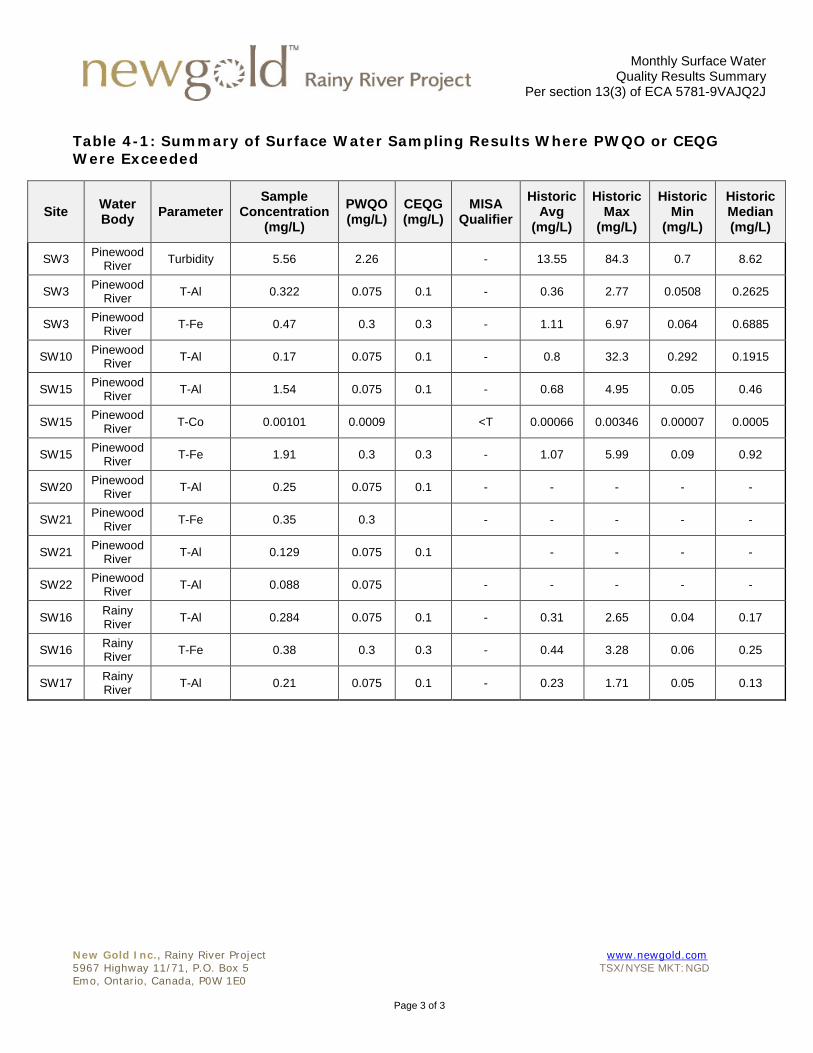
Table 4-1: Summary of Surface Water Sampling Results Where PWQO or CEQG Were Exceeded
Site Water Body Parameter
Sample Concentration
(mg/L) PWQO (mg/L)
CEQG (mg/L)
MISA Qualifier
Historic Avg
(mg/L)
Historic Max
(mg/L)
Historic Min
(mg/L)
Historic Median (mg/L)
SW3 Pinewood River Turbidity 5.56 2.26 - 13.55 84.3 0.7 8.62
SW3 Pinewood River T-Al 0.322 0.075 0.1 - 0.36 2.77 0.0508 0.2625
SW3 Pinewood River T-Fe 0.47 0.3 0.3 - 1.11 6.97 0.064 0.6885
SW10 Pinewood River T-Al 0.17 0.075 0.1 - 0.8 32.3 0.292 0.1915
SW15 Pinewood River T-Al 1.54 0.075 0.1 - 0.68 4.95 0.05 0.46
SW15 Pinewood River T-Co 0.00101 0.0009 <T 0.00066 0.00346 0.00007 0.0005
SW15 Pinewood River T-Fe 1.91 0.3 0.3 - 1.07 5.99 0.09 0.92
SW20 Pinewood River T-Al 0.25 0.075 0.1 - - - - -
SW21 Pinewood River T-Fe 0.35 0.3 - - - - -
SW21 Pinewood River T-Al 0.129 0.075 0.1 - - - -
SW22 Pinewood River T-Al 0.088 0.075 - - - - -
SW16 Rainy River T-Al 0.284 0.075 0.1 - 0.31 2.65 0.04 0.17
SW16 Rainy River T-Fe 0.38 0.3 0.3 - 0.44 3.28 0.06 0.25
SW17 Rainy River T-Al 0.21 0.075 0.1 - 0.23 1.71 0.05 0.13
Memorandum
_______________________________________________________________________________ The following document has been provided consistent with Environmental Compliance Approval (ECA) # 5781-9VJQ2J, section 13(3) issued May 8, 2015. The purpose of the report is to provide a summary of monitoring activities related to the approved works. Monitoring for June 2015 was applicable to the stage of project development;
None of the approved works were constructed or operating; The plant site and crusher area sediment pond 1 was under construction; and Surface water sampling was conducted on June 9, 2015.
1.0 Plant Site and Crusher Area Sediment Pond 1 The plant site and crusher area sediment pond commenced construction on May 17, 2015. Prior to that time sediment and erosion control measured were put in place beginning on 5 May which included silt fencing and settling ponds. As part of site preparation, water was released and used for dust suppression from the site consistent with section 7(5) of the ECA. The release was to a vegetated area west of Roen Road.
2.0 Surface Water Sampling Surface water sampling was conducted on June 9, 2015. The following sites were not sampled for the given reasons;
SW23, SW24, SW28 and SW29 do not require sampling as of yet as the triggering milestones have not yet been reached with construction; and
SW26 and SW27, although identified as requiring sampling within one month of the receipt of the ECA, are located along the planned route of the West Creek Diversion which has yet to be constructed.
Sampling was conducted at the remaining sites following MISA protocols.
2.1 Summary of Analysis There were two exceedances of the ECA approval during the month, both for total suspended solids (TSS). SW15 (Pinewood river at Hwy 619 crossing) exceeded the 30 day average concentration limit of 15 mg/L TSS (27.5 mg/L), while SW27 (Loslo creek downstream of Hwy 600) exceeded the maximum concentration limit of 30 mg/L TSS (89 mg/L). As no project activities occurred within the vicinity of either sample site, it is assumed that these are natural levels, as is supported by historic levels at SW15 and SW13, which is a baseline sample location on Loslo creek upstream of SW27 (see table 5.1).
To: Ray Boivin, Senior Environmental Officer, Kenora Area, MOECC
From: Nigel Fisher, Manager, Environment
Date: June 24th, 2015
Re: Monthly Surface Water Quality Results Summary – June 2015
Monthly Surface Water Quality Results Summary
Per section 13(3) of ECA 5781-9VAJQ2J
Page 2 of 3
TSX/NYSE AMEX:NGD
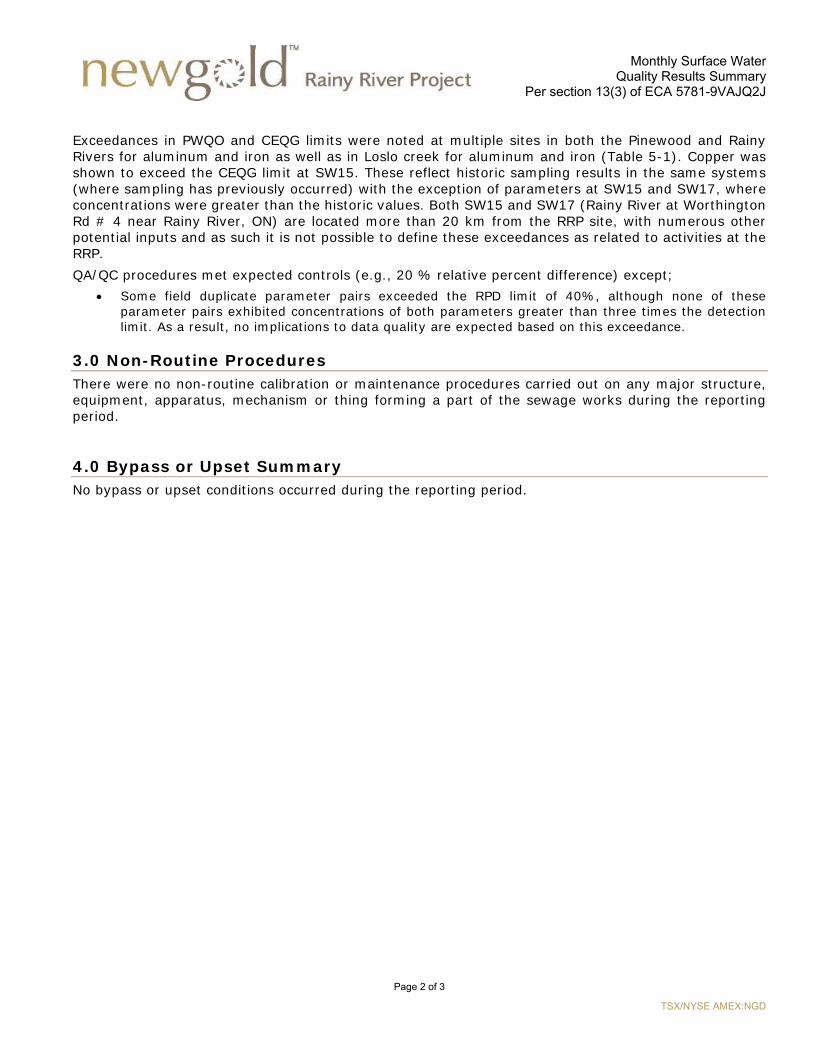
Exceedances in PWQO and CEQG limits were noted at multiple sites in both the Pinewood and Rainy Rivers for aluminum and iron as well as in Loslo creek for aluminum and iron (Table 5-1). Copper was shown to exceed the CEQG limit at SW15. These reflect historic sampling results in the same systems (where sampling has previously occurred) with the exception of parameters at SW15 and SW17, where concentrations were greater than the historic values. Both SW15 and SW17 (Rainy River at Worthington Rd # 4 near Rainy River, ON) are located more than 20 km from the RRP site, with numerous other potential inputs and as such it is not possible to define these exceedances as related to activities at the RRP. QA/QC procedures met expected controls (e.g., 20 % relative percent difference) except;
Some field duplicate parameter pairs exceeded the RPD limit of 40%, although none of these parameter pairs exhibited concentrations of both parameters greater than three times the detection limit. As a result, no implications to data quality are expected based on this exceedance.
3.0 Non-Routine Procedures There were no non-routine calibration or maintenance procedures carried out on any major structure, equipment, apparatus, mechanism or thing forming a part of the sewage works during the reporting period.
4.0 Bypass or Upset Summary No bypass or upset conditions occurred during the reporting period.
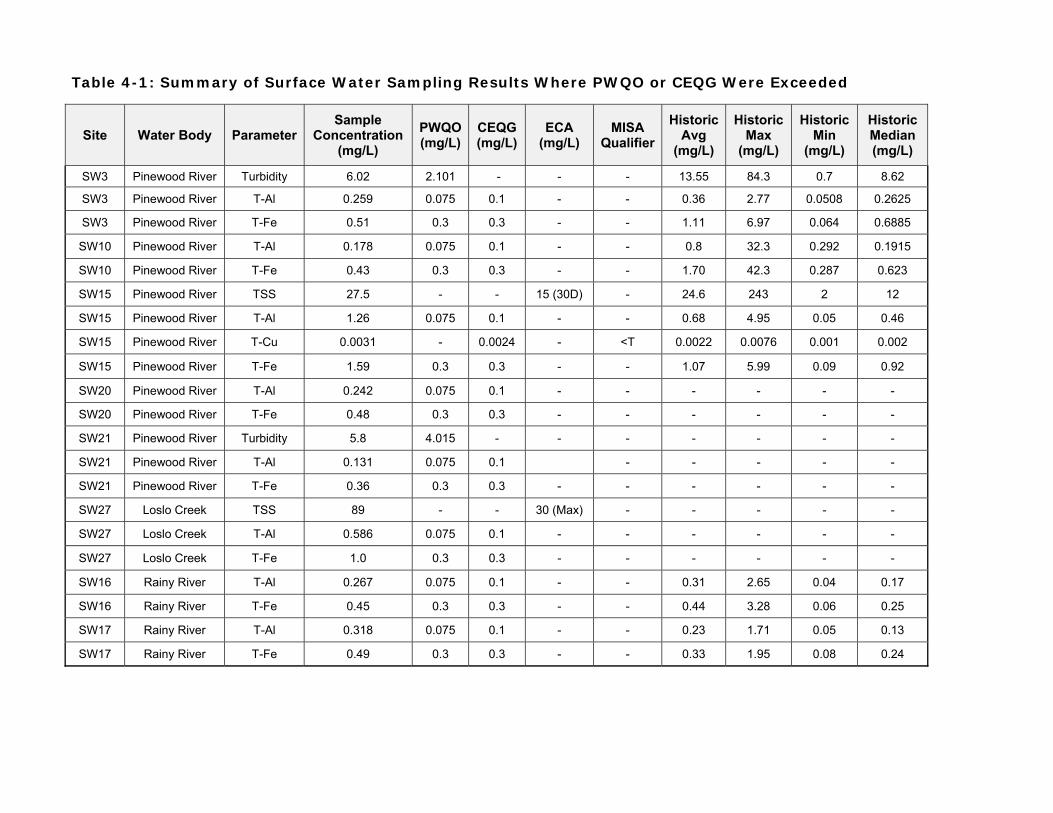
Table 4-1: Summary of Surface Water Sampling Results Where PWQO or CEQG Were Exceeded
Site Water Body Parameter Sample
Concentration (mg/L)
PWQO (mg/L)
CEQG (mg/L)
ECA (mg/L)
MISA Qualifier
Historic Avg
(mg/L)
Historic Max
(mg/L)
Historic Min
(mg/L)
Historic Median (mg/L)
SW3 Pinewood River Turbidity 6.02 2.101 - - - 13.55 84.3 0.7 8.62
SW3 Pinewood River T-Al 0.259 0.075 0.1 - - 0.36 2.77 0.0508 0.2625
SW3 Pinewood River T-Fe 0.51 0.3 0.3 - - 1.11 6.97 0.064 0.6885
SW10 Pinewood River T-Al 0.178 0.075 0.1 - - 0.8 32.3 0.292 0.1915
SW10 Pinewood River T-Fe 0.43 0.3 0.3 - - 1.70 42.3 0.287 0.623
SW15 Pinewood River TSS 27.5 - - 15 (30D) - 24.6 243 2 12
SW15 Pinewood River T-Al 1.26 0.075 0.1 - - 0.68 4.95 0.05 0.46
SW15 Pinewood River T-Cu 0.0031 - 0.0024 - <T 0.0022 0.0076 0.001 0.002
SW15 Pinewood River T-Fe 1.59 0.3 0.3 - - 1.07 5.99 0.09 0.92
SW20 Pinewood River T-Al 0.242 0.075 0.1 - - - - - -
SW20 Pinewood River T-Fe 0.48 0.3 0.3 - - - - - -
SW21 Pinewood River Turbidity 5.8 4.015 - - - - - - -
SW21 Pinewood River T-Al 0.131 0.075 0.1 - - - - -
SW21 Pinewood River T-Fe 0.36 0.3 0.3 - - - - - -
SW27 Loslo Creek TSS 89 - - 30 (Max) - - - - -
SW27 Loslo Creek T-Al 0.586 0.075 0.1 - - - - - -
SW27 Loslo Creek T-Fe 1.0 0.3 0.3 - - - - - -
SW16 Rainy River T-Al 0.267 0.075 0.1 - - 0.31 2.65 0.04 0.17
SW16 Rainy River T-Fe 0.45 0.3 0.3 - - 0.44 3.28 0.06 0.25
SW17 Rainy River T-Al 0.318 0.075 0.1 - - 0.23 1.71 0.05 0.13
SW17 Rainy River T-Fe 0.49 0.3 0.3 - - 0.33 1.95 0.08 0.24
Memorandum
_______________________________________________________________________________ The following document has been provided consistent with Environmental Compliance Approval (ECA) # 5781-9VJQ2J, section 13(3) issued May 8, 2015. The purpose of the report is to provide a summary of monitoring activities related to the approved works. Monitoring for July 2015 was applicable to the stage of project development;
Construction on the plant site pond was completed at the end of July and work subsequently commenced on the process plant overburden pile pond;
Surface water sampling was conducted on July 21 and 22, 2015; and Construction discharge sampling for the Plant Site Sediment Pond was conducted on 29 July, 2015
from water starting to naturally collect in the upstream pond (i.e., not the polishing pond).
1.0 Plant Site and Crusher Area Sediment Pond 1 The plant site and crusher area sediment pond commenced construction on May 17, 2015. Prior to that time sediment and erosion control measured were put in place beginning on 5 May which included silt fencing and settling ponds. As part of site preparation, water was released and used for dust suppression from the site consistent with section 7(5) of the ECA. A single-polymer flocculant system was installed and commissioned on 15 July, 2015. This system was not utilized in July. No discharge occurred from any works during July.
2.0 Effluent Sampling and Results Effluent sampling was conducted from the plant site pond on July 29. The sampling was to provide indication of performance of works relative to predicted performance and allow for water treatment to be tailored based on inputs. No parameters were found to have concentrations greater than the monthly average limits listed in the ECA, with concentrations generally an order of magnitude less than the monthly average limits.
3.0 Surface Water Sampling Surface water sampling was conducted on July 21 and 22, 2015. The following sites were not sampled for the given reasons;
SW23, SW24, SW28 and SW29 do not require sampling as of yet as the triggering milestones have not yet been reached with construction; and
To: Ray Boivin, Senior Environmental Officer, Kenora Area, MOECC
From: Nigel Fisher, Manager, Environment
Date: August 6, 2015
Re: Monthly Surface Water Quality Results Summary – July 2015
Monthly Surface Water Quality Results Summary
Per section 13(3) of ECA 5781-9VAJQ2J
Page 2 of 3
TSX/NYSE AMEX:NGD
SW26 and SW27, although identified as requiring sampling within one month of the receipt of the ECA, are located along the planned route of the West Creek Diversion which has yet to be constructed.
Sampling was conducted at the remaining sites following MISA protocols.
3.1 Summary of Analysis Surface water sampling results met PWQO and CEQG levels except for turbidity, total iron and aluminum at some sites in the Pinewood and Rainy Rivers (Table 1). The sites were both upstream and downstream of the Project site and results are consistent with baseline results. QA/QC procedures met expected controls (e.g., 20 % relative percent difference) except;
Some field duplicate parameter pairs exceeded the RPD limit of 40%, although none of these parameter pairs exhibited concentrations of both parameters greater than three times the detection limit. As a result, no implications to data quality are expected based on this exceedance.
Dissolved concentrations of copper and zinc exceeded total concentrations in several samples, including trip blank, field blank and field duplicate samples. The analytical laboratory has been queried as to the cause of this irregularity and its implications to data integrity. This remains under investigation by the laboratory. Given other parameters are within guidelines/objectives and no copper or zinc concentrations were found to be greater than PWQO or CEQG there is no concern relative to surface water quality.
4.0 Non-Routine Procedures There were no non-routine calibration or maintenance procedures carried out on any major structure, equipment, apparatus, mechanism or thing forming a part of the sewage works during the reporting period. Surface water sampling site SW15 (immediately adjacent to the Pinewood River crossing of highway 619) and an associated field duplicate were sampled on 22 July, 2015 rather than 21 July 2015 with the other sampling sites due to road resurfacing work which was occurring directly overhead of the sampling location, precluding safe access and increasing the potential for sample contamination.
5.0 Bypass or Upset Summary No bypass or upset conditions occurred during the reporting period.
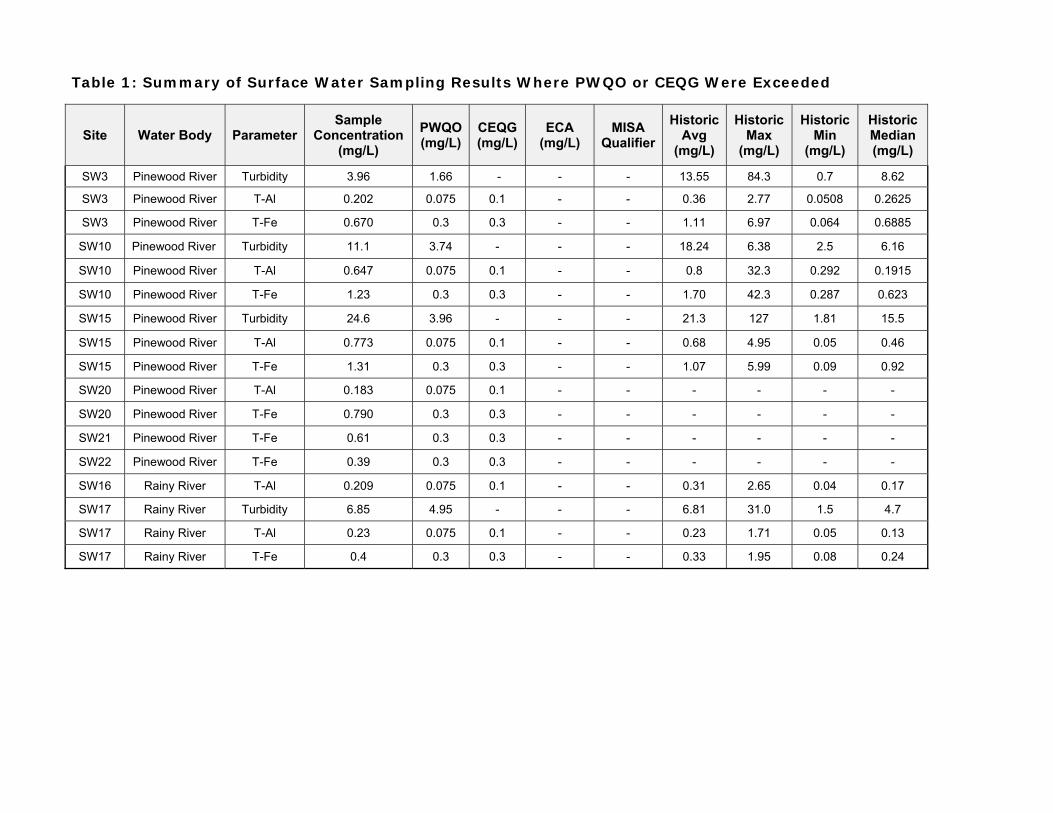
Table 1: Summary of Surface Water Sampling Results Where PWQO or CEQG Were Exceeded
Site Water Body Parameter Sample
Concentration (mg/L)
PWQO (mg/L)
CEQG (mg/L)
ECA (mg/L)
MISA Qualifier
Historic Avg
(mg/L)
Historic Max
(mg/L)
Historic Min
(mg/L)
Historic Median (mg/L)
SW3 Pinewood River Turbidity 3.96 1.66 - - - 13.55 84.3 0.7 8.62
SW3 Pinewood River T-Al 0.202 0.075 0.1 - - 0.36 2.77 0.0508 0.2625
SW3 Pinewood River T-Fe 0.670 0.3 0.3 - - 1.11 6.97 0.064 0.6885
SW10 Pinewood River Turbidity 11.1 3.74 - - - 18.24 6.38 2.5 6.16
SW10 Pinewood River T-Al 0.647 0.075 0.1 - - 0.8 32.3 0.292 0.1915
SW10 Pinewood River T-Fe 1.23 0.3 0.3 - - 1.70 42.3 0.287 0.623
SW15 Pinewood River Turbidity 24.6 3.96 - - - 21.3 127 1.81 15.5
SW15 Pinewood River T-Al 0.773 0.075 0.1 - - 0.68 4.95 0.05 0.46
SW15 Pinewood River T-Fe 1.31 0.3 0.3 - - 1.07 5.99 0.09 0.92
SW20 Pinewood River T-Al 0.183 0.075 0.1 - - - - - -
SW20 Pinewood River T-Fe 0.790 0.3 0.3 - - - - - -
SW21 Pinewood River T-Fe 0.61 0.3 0.3 - - - - - -
SW22 Pinewood River T-Fe 0.39 0.3 0.3 - - - - - -
SW16 Rainy River T-Al 0.209 0.075 0.1 - - 0.31 2.65 0.04 0.17
SW17 Rainy River Turbidity 6.85 4.95 - - - 6.81 31.0 1.5 4.7
SW17 Rainy River T-Al 0.23 0.075 0.1 - - 0.23 1.71 0.05 0.13
SW17 Rainy River T-Fe 0.4 0.3 0.3 - - 0.33 1.95 0.08 0.24

Memorandum
_______________________________________________________________________________
The following document has been provided consistent with Environmental Compliance Approval (ECA) #
5781-9VJQ2J, section 13(3) issued May 8, 2015. The purpose of the report is to provide a summary of
monitoring activities related to the approved works.
Monitoring for August 2015 was applicable to the stage of project development;
Construction on the plant site pond was completed at the end of July and work subsequently
commenced on the process plant overburden pile pond;
Surface water sampling was conducted on August 25, 2015; and
Construction discharge sampling for the Plant Site Sediment Pond was conducted on August 5, 10, 13,
and 20, 2015 from water in the upstream pond (i.e., not the polishing pond). A sample was taken
from the polishing pond on August 31, 2015.
1.0 Plant Site and Crusher Area Sediment Pond 1
The plant site and crusher area sediment pond commenced construction on May 17, 2015. Prior to that
time sediment and erosion control measured were put in place beginning on 5 May which included silt
fencing and settling ponds. As part of site preparation, water was released and used for dust suppression
from the site consistent with section 7(5) of the ECA. A single-polymer flocculant system was installed
and commissioned on 15 July, 2015. This system was not utilized in July. No discharge occurred from
any works during August.
2.0 Effluent Sampling and Results
Effluent sampling was conducted from the plant site pond on August 5, 10, 13, 20, and 31. The
sampling was to provide indication of performance of works relative to predicted performance and
allow for water treatment to be tailored based on inputs. Un-ionized ammonia and total suspended
sediment were found to have concentrations greater than the monthly average limits listed in the ECA.
No discharge has taken place and treatment will occur. Dry ice will be used to reduce the pH which will
decrease un-ionized ammonia. Flocculant and cycling of water will reduce the total suspended
sediment.
To: Director, Ministry of Environment and Climate Change
C/O Ray Boivin, Senior Environmental Officer, Kenora Area, MOECC
From: Cailey Anderson, Site Environmental Manager (Acting)
Date: September 29, 2015
Re: Monthly Surface Water Quality Results Summary – August 2015

Monthly Surface Water Quality Results Summary
Per section 13(3) of ECA 5781-9VAJQ2J
Page 2 of 4
TSX/NYSE AMEX:NGD
3.0 Surface Water Sampling
Surface water sampling was conducted on August 25, 2015. The following sites were not sampled for
the given reasons;
SW23, SW24, SW28 and SW29 do not require sampling as of yet as the triggering milestones have
not yet been reached with construction; and
SW25 and SW26, although identified as requiring sampling within one month of the receipt of the ECA,
are located along the planned route of the West Creek Diversion which has yet to be constructed.
Sampling was conducted at the remaining sites following MISA protocols.
3.1 Summary of Analysis
Surface water sampling results met PWQO and CEQG levels except for turbidity, total iron and aluminum
at some sites in the Pinewood and Rainy Rivers (Table 1). The sites were both upstream and downstream
of the Project site and results are consistent with baseline results.
QA/QC procedures met expected controls (e.g., 20 % relative percent difference) except;
Some field duplicate parameter pairs exceeded the RPD limit of 40%, although none of these
parameter pairs exhibited concentrations of both parameters greater than three times the detection
limit. As a result, no implications to data quality are expected based on this exceedance.
Dissolved concentrations of aluminum exceeded total concentrations in SW21. The analytical
laboratory has been queried as to the cause of this irregularity and its implications to data integrity.
This remains under investigation by the laboratory. Given other parameters are within
guidelines/objectives and the aluminum concentration was found to be less than PWQO or CEQG there
is no concern relative to surface water quality.
4.0 Non-Routine Procedures
There were no non-routine calibration or maintenance procedures carried out on any major structure,
equipment, apparatus, or mechanism forming a part of the sewage works during the reporting period.
5.0 Bypass or Upset Summary
No bypass or upset conditions occurred during the reporting period.
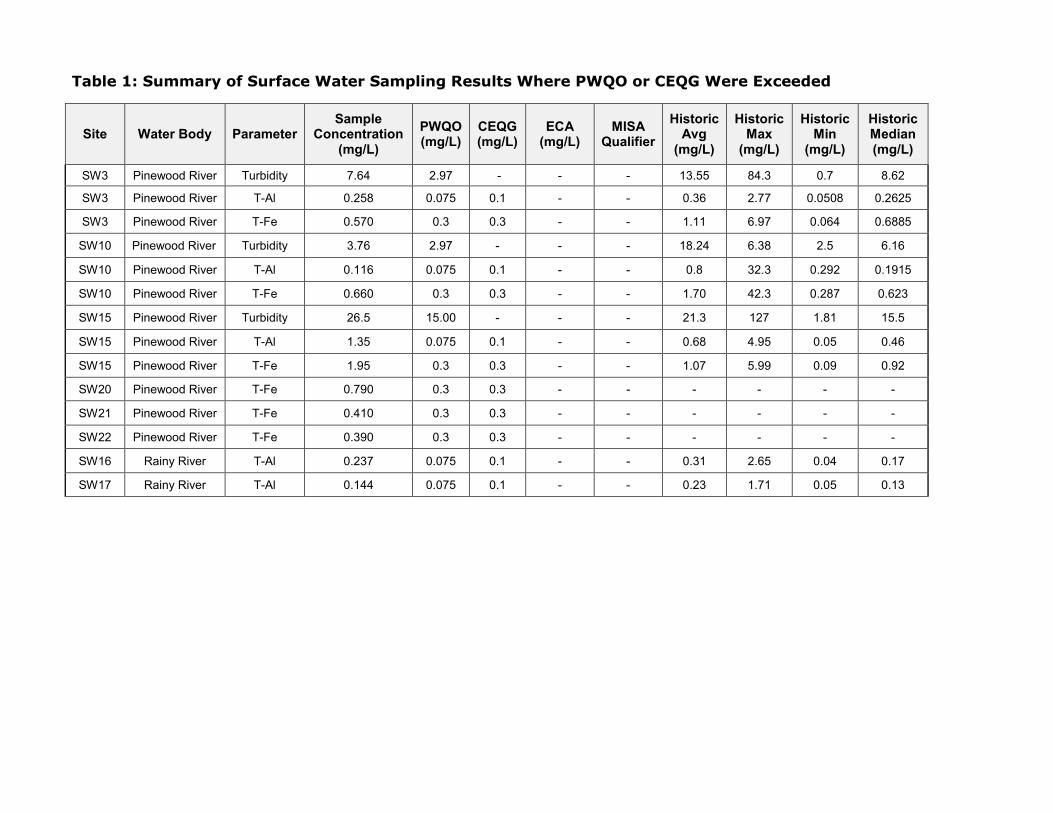
Table 1: Summary of Surface Water Sampling Results Where PWQO or CEQG Were Exceeded
Site Water Body Parameter Sample
Concentration (mg/L)
PWQO (mg/L)
CEQG (mg/L)
ECA (mg/L)
MISA Qualifier
Historic Avg
(mg/L)
Historic Max
(mg/L)
Historic Min
(mg/L)
Historic Median (mg/L)
SW3 Pinewood River Turbidity 7.64 2.97 - - - 13.55 84.3 0.7 8.62
SW3 Pinewood River T-Al 0.258 0.075 0.1 - - 0.36 2.77 0.0508 0.2625
SW3 Pinewood River T-Fe 0.570 0.3 0.3 - - 1.11 6.97 0.064 0.6885
SW10 Pinewood River Turbidity 3.76 2.97 - - - 18.24 6.38 2.5 6.16
SW10 Pinewood River T-Al 0.116 0.075 0.1 - - 0.8 32.3 0.292 0.1915
SW10 Pinewood River T-Fe 0.660 0.3 0.3 - - 1.70 42.3 0.287 0.623
SW15 Pinewood River Turbidity 26.5 15.00 - - - 21.3 127 1.81 15.5
SW15 Pinewood River T-Al 1.35 0.075 0.1 - - 0.68 4.95 0.05 0.46
SW15 Pinewood River T-Fe 1.95 0.3 0.3 - - 1.07 5.99 0.09 0.92
SW20 Pinewood River T-Fe 0.790 0.3 0.3 - - - - - -
SW21 Pinewood River T-Fe 0.410 0.3 0.3 - - - - - -
SW22 Pinewood River T-Fe 0.390 0.3 0.3 - - - - - -
SW16 Rainy River T-Al 0.237 0.075 0.1 - - 0.31 2.65 0.04 0.17
SW17 Rainy River T-Al 0.144 0.075 0.1 - - 0.23 1.71 0.05 0.13
Monthly Surface Water Quality Results Summary
Per section 13(3) of ECA 5781-9VAJQ2J
Page 4 of 4
TSX/NYSE AMEX:NGD
Monthly Surface Water Quality Results Summary
Per section 13(3) of ECA 5781-9VAJQ2J
Page 1 of 4
TSX/NYSE AMEX:NGD
Memorandum
_______________________________________________________________________________
The following document has been provided consistent with Environmental Compliance Approval (ECA) #
5781-9VJQ2J, section 13(3) issued May 8, 2015. The purpose of the report is to provide a summary of
monitoring activities related to the approved works.
Monitoring for September 2015 was applicable to the stage of project development;
Construction on the plant site pond was completed at the end of July and work subsequently
commenced on the process plant overburden pile pond;
Surface water sampling was conducted on September, 2015; and
Construction discharge sampling for the Temporary Plant Site Sediment Pond was conducted on
September 8, 14, 15, 23, and 28, 2015 from the North Polishing Pond.
1.0 Plant Site and Crusher Area Sediment Pond 1
The Temporary Plant Site Sediment Pond commenced construction on May 17, 2015. Prior to that time
sediment and erosion control measures were put in place beginning on 5 May which included silt fencing
and settling ponds. As part of site preparation, water was released and used for dust suppression from
the site consistent with section 7(5) of the ECA. A single-polymer flocculant system was installed and
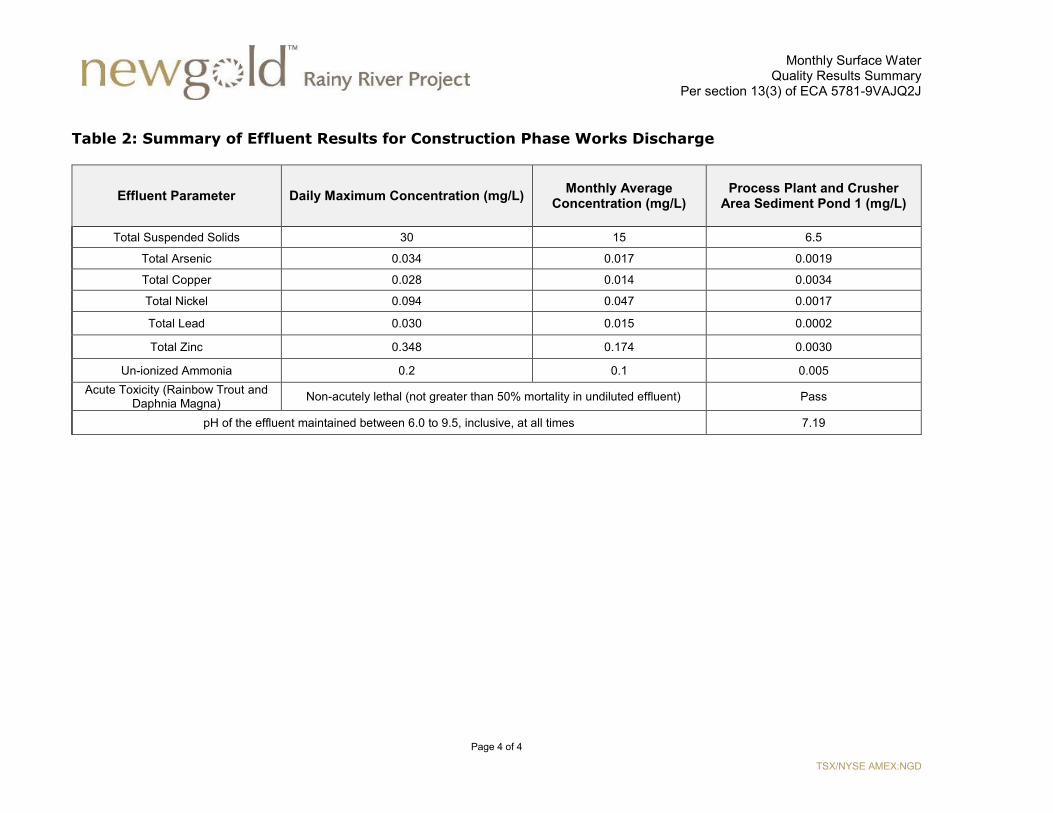
commissioned on 15 July, 2015. This system was utilized in September and a discharge took place on
September 17, 2015. Table 2 displays the effluent results at the time of discharge.
2.0 Effluent Sampling and Results
Effluent sampling was conducted from the Temporary Plant Site Sediment Pond on September 8, 14,
15, 23, and 28. The sampling was to provide indication of performance of works relative to predicted
performance and allow for water treatment to be tailored based on inputs. Effluent results did not
exceed the effluent limits prescribed in the ECA 5781-9VAJQ2J.
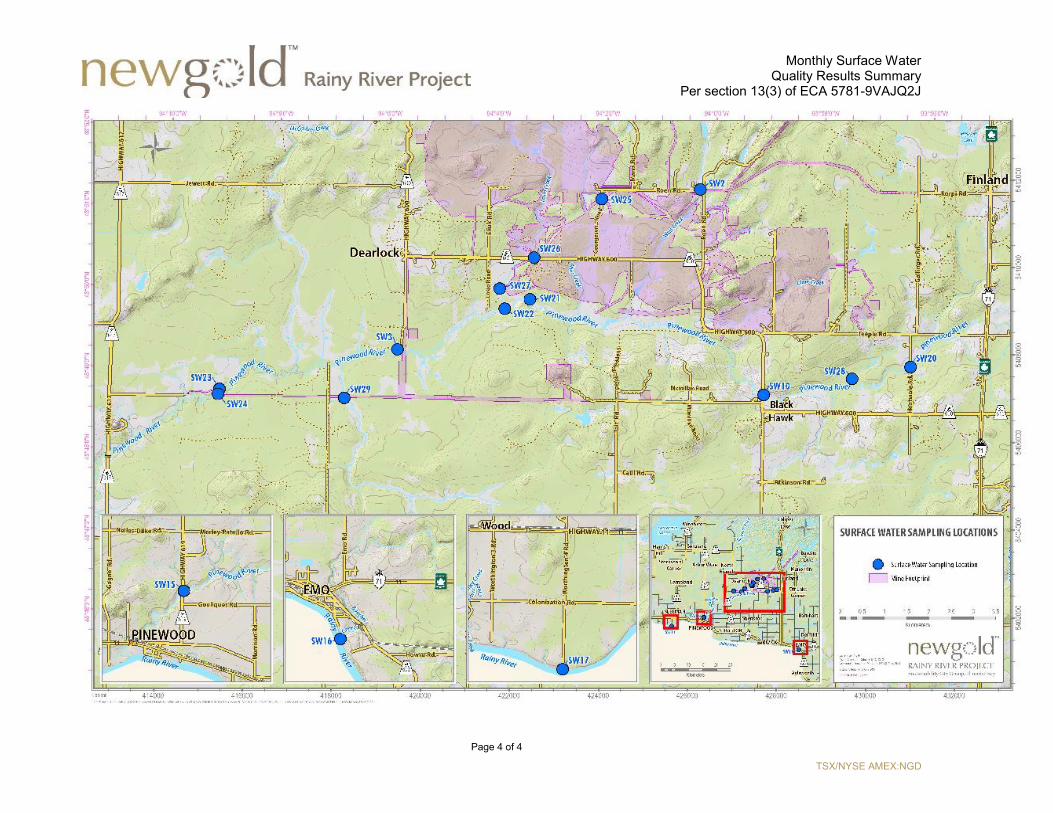
3.0 Surface Water Sampling
Surface water sampling was conducted on September 16, 2015. The following sites were not sampled
for the given reasons;
SW23, SW24, SW28 and SW29 do not require sampling as of yet as the triggering milestones have
not yet been reached with construction; and
To: Ray Boivin, Senior Environmental Officer, Kenora Area, MOECC
From: Cailey Anderson, Manager, Environment
Date: October 12, 2015
Re: Monthly Surface Water Quality Results Summary – September 2015
Monthly Surface Water Quality Results Summary
Per section 13(3) of ECA 5781-9VAJQ2J
Page 2 of 4
TSX/NYSE AMEX:NGD
SW25 and SW26, although identified as requiring sampling within one month of the receipt of the ECA,
are located along the planned route of the West Creek Diversion which has yet to be commissioned.
Sampling was conducted at the remaining sites following MISA protocols.
3.1 Summary of Analysis
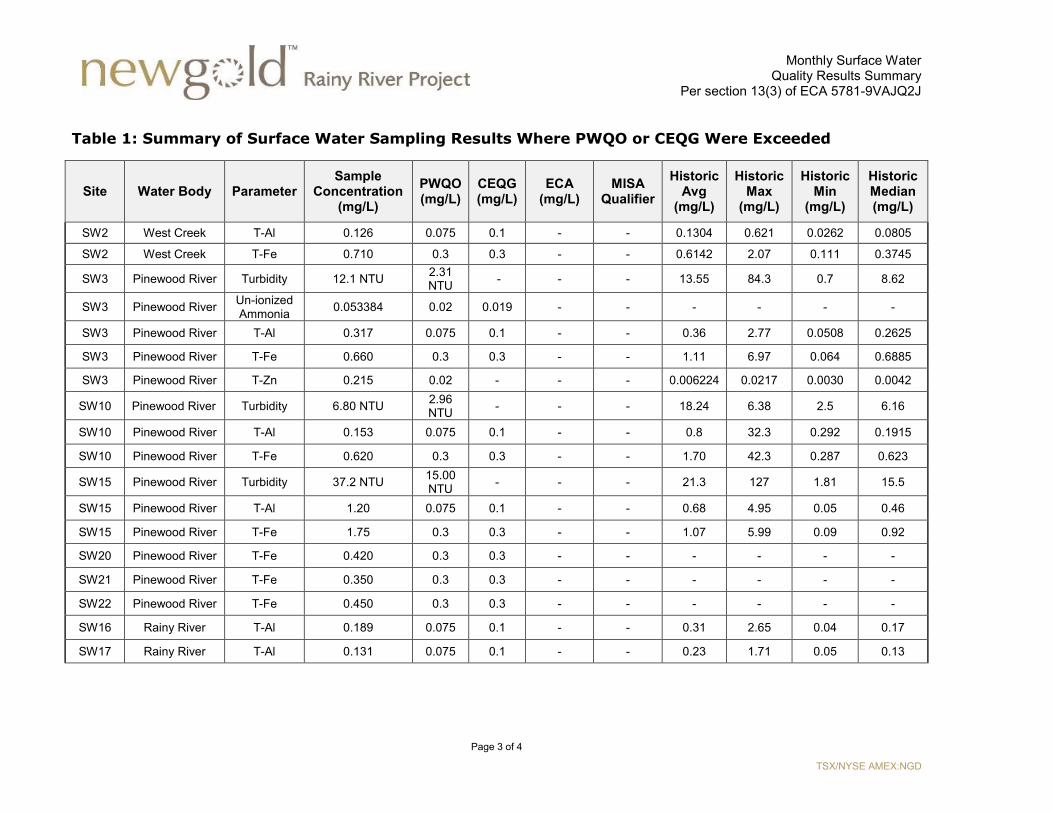
Surface water sampling results met PWQO and CEQG levels except for turbidity, total iron, total
aluminum, and un-ionized ammonia at some sites in the Pinewood River, the Rainy River, and West
Creek (Table 1). The sites were both upstream and downstream of the Project site and results are
consistent with baseline results.
QA/QC procedures met expected controls (e.g., 20 % relative percent difference) except;
Some field duplicate parameter pairs exceeded the RPD limit of 40%, although none of these
parameter pairs exhibited concentrations of both parameters greater than three times the detection
limit. As a result, no implications to data quality are expected based on this exceedance.
Dissolved concentrations of zinc exceeded total concentrations in the field blank. The analytical
laboratory has been queried as to the cause of this irregularity and its implications to data integrity.
This remains under investigation by the laboratory. Given other parameters are within
guidelines/objectives and the aluminum concentration was found to be less than PWQO or CEQG there
is no concern relative to surface water quality.
4.0 Non-Routine Procedures
There were no non-routine calibration or maintenance procedures carried out on any major structure,
equipment, apparatus, mechanism or thing forming a part of the sewage works during the reporting
period.
5.0 Bypass or Upset Summary
No bypass or upset conditions occurred during the reporting period.
Monthly Surface Water Quality Results Summary
Per section 13(3) of ECA 5781-9VAJQ2J
Page 3 of 4
TSX/NYSE AMEX:NGD
Table 1: Summary of Surface Water Sampling Results Where PWQO or CEQG Were Exceeded
Site Water Body Parameter Sample
Concentration (mg/L)
PWQO (mg/L)
CEQG (mg/L)
ECA (mg/L)
MISA Qualifier
Historic Avg
(mg/L)
Historic Max
(mg/L)
Historic Min
(mg/L)
Historic Median (mg/L)
SW2 West Creek T-Al 0.126 0.075 0.1 - - 0.1304 0.621 0.0262 0.0805
SW2 West Creek T-Fe 0.710 0.3 0.3 - - 0.6142 2.07 0.111 0.3745
SW3 Pinewood River Turbidity 12.1 NTU 2.31 NTU - - - 13.55 84.3 0.7 8.62
SW3 Pinewood River Un-ionized Ammonia 0.053384 0.02 0.019 - - - - - -
SW3 Pinewood River T-Al 0.317 0.075 0.1 - - 0.36 2.77 0.0508 0.2625
SW3 Pinewood River T-Fe 0.660 0.3 0.3 - - 1.11 6.97 0.064 0.6885
SW3 Pinewood River T-Zn 0.215 0.02 - - - 0.006224 0.0217 0.0030 0.0042
SW10 Pinewood River Turbidity 6.80 NTU 2.96 NTU - - - 18.24 6.38 2.5 6.16
SW10 Pinewood River T-Al 0.153 0.075 0.1 - - 0.8 32.3 0.292 0.1915
SW10 Pinewood River T-Fe 0.620 0.3 0.3 - - 1.70 42.3 0.287 0.623
SW15 Pinewood River Turbidity 37.2 NTU 15.00 NTU - - - 21.3 127 1.81 15.5
SW15 Pinewood River T-Al 1.20 0.075 0.1 - - 0.68 4.95 0.05 0.46
SW15 Pinewood River T-Fe 1.75 0.3 0.3 - - 1.07 5.99 0.09 0.92
SW20 Pinewood River T-Fe 0.420 0.3 0.3 - - - - - -
SW21 Pinewood River T-Fe 0.350 0.3 0.3 - - - - - -
SW22 Pinewood River T-Fe 0.450 0.3 0.3 - - - - - -
SW16 Rainy River T-Al 0.189 0.075 0.1 - - 0.31 2.65 0.04 0.17
SW17 Rainy River T-Al 0.131 0.075 0.1 - - 0.23 1.71 0.05 0.13
Monthly Surface Water Quality Results Summary
Per section 13(3) of ECA 5781-9VAJQ2J
Page 4 of 4
TSX/NYSE AMEX:NGD
Table 2: Summary of Effluent Results for Construction Phase Works Discharge
Effluent Parameter Daily Maximum Concentration (mg/L) Monthly Average
Concentration (mg/L) Process Plant and Crusher
Area Sediment Pond 1 (mg/L)
Total Suspended Solids 30 15 6.5
Total Arsenic 0.034 0.017 0.0019
Total Copper 0.028 0.014 0.0034
Total Nickel 0.094 0.047 0.0017
Total Lead 0.030 0.015 0.0002
Total Zinc 0.348 0.174 0.0030
Un-ionized Ammonia 0.2 0.1 0.005 Acute Toxicity (Rainbow Trout and
Daphnia Magna) Non-acutely lethal (not greater than 50% mortality in undiluted effluent) Pass
pH of the effluent maintained between 6.0 to 9.5, inclusive, at all times 7.19
Monthly Surface Water Quality Results Summary
Per section 13(3) of ECA 5781-9VAJQ2J
Page 1 of 5
TSX/NYSE AMEX:NGD
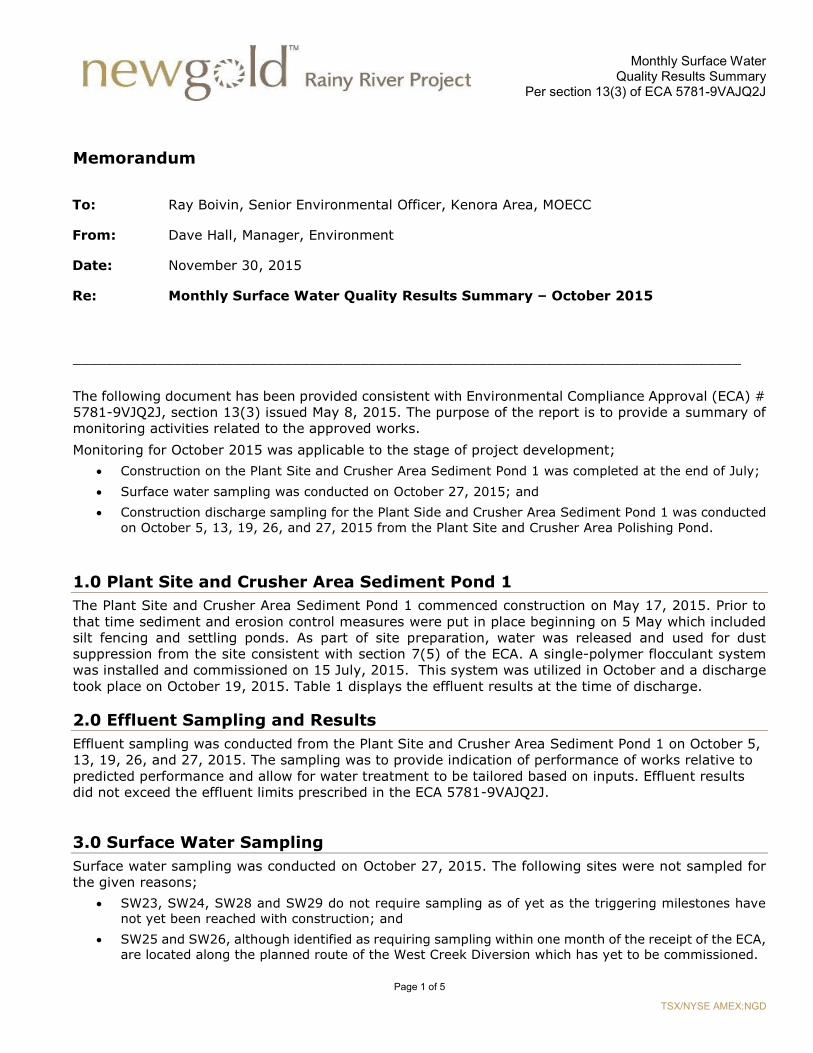
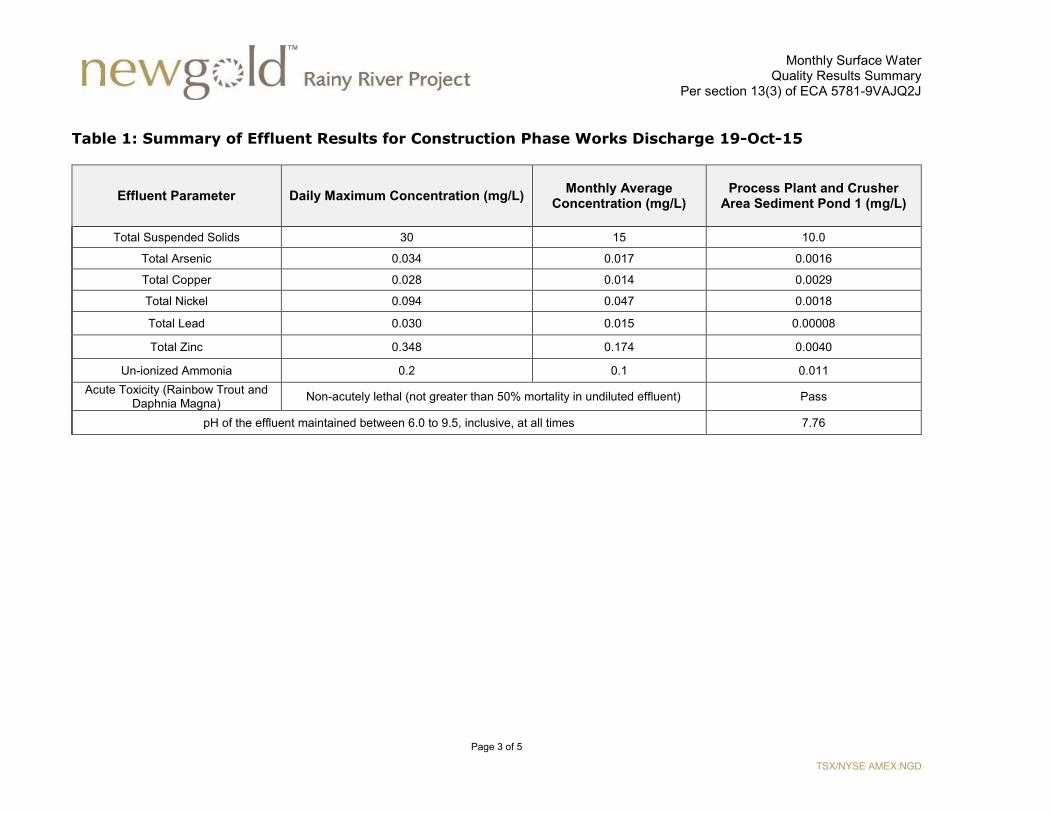
Memorandum
_______________________________________________________________________________
The following document has been provided consistent with Environmental Compliance Approval (ECA) #
5781-9VJQ2J, section 13(3) issued May 8, 2015. The purpose of the report is to provide a summary of
monitoring activities related to the approved works.
Monitoring for October 2015 was applicable to the stage of project development;
Construction on the Plant Site and Crusher Area Sediment Pond 1 was completed at the end of July;
Surface water sampling was conducted on October 27, 2015; and
Construction discharge sampling for the Plant Side and Crusher Area Sediment Pond 1 was conducted
on October 5, 13, 19, 26, and 27, 2015 from the Plant Site and Crusher Area Polishing Pond.
1.0 Plant Site and Crusher Area Sediment Pond 1
The Plant Site and Crusher Area Sediment Pond 1 commenced construction on May 17, 2015. Prior to
that time sediment and erosion control measures were put in place beginning on 5 May which included
silt fencing and settling ponds. As part of site preparation, water was released and used for dust
suppression from the site consistent with section 7(5) of the ECA. A single-polymer flocculant system
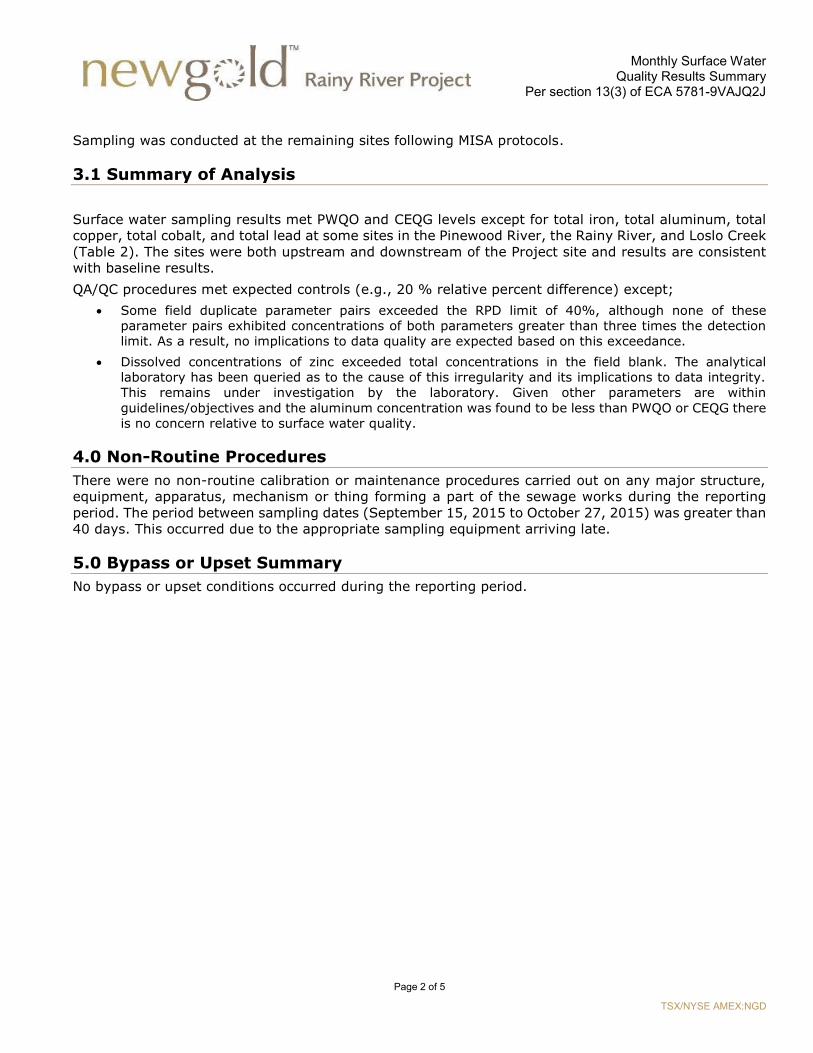
was installed and commissioned on 15 July, 2015. This system was utilized in October and a discharge
took place on October 19, 2015. Table 1 displays the effluent results at the time of discharge.
2.0 Effluent Sampling and Results
Effluent sampling was conducted from the Plant Site and Crusher Area Sediment Pond 1 on October 5,
13, 19, 26, and 27, 2015. The sampling was to provide indication of performance of works relative to
predicted performance and allow for water treatment to be tailored based on inputs. Effluent results
did not exceed the effluent limits prescribed in the ECA 5781-9VAJQ2J.
3.0 Surface Water Sampling
Surface water sampling was conducted on October 27, 2015. The following sites were not sampled for
the given reasons;
SW23, SW24, SW28 and SW29 do not require sampling as of yet as the triggering milestones have
not yet been reached with construction; and
SW25 and SW26, although identified as requiring sampling within one month of the receipt of the ECA,
are located along the planned route of the West Creek Diversion which has yet to be commissioned.
To: Ray Boivin, Senior Environmental Officer, Kenora Area, MOECC
From: Dave Hall, Manager, Environment
Date: November 30, 2015
Re: Monthly Surface Water Quality Results Summary – October 2015
Monthly Surface Water Quality Results Summary
Per section 13(3) of ECA 5781-9VAJQ2J
Page 2 of 5
TSX/NYSE AMEX:NGD
Sampling was conducted at the remaining sites following MISA protocols.
3.1 Summary of Analysis
Surface water sampling results met PWQO and CEQG levels except for total iron, total aluminum, total
copper, total cobalt, and total lead at some sites in the Pinewood River, the Rainy River, and Loslo Creek
(Table 2). The sites were both upstream and downstream of the Project site and results are consistent
with baseline results.
QA/QC procedures met expected controls (e.g., 20 % relative percent difference) except;
Some field duplicate parameter pairs exceeded the RPD limit of 40%, although none of these
parameter pairs exhibited concentrations of both parameters greater than three times the detection
limit. As a result, no implications to data quality are expected based on this exceedance.
Dissolved concentrations of zinc exceeded total concentrations in the field blank. The analytical
laboratory has been queried as to the cause of this irregularity and its implications to data integrity.
This remains under investigation by the laboratory. Given other parameters are within
guidelines/objectives and the aluminum concentration was found to be less than PWQO or CEQG there
is no concern relative to surface water quality.
4.0 Non-Routine Procedures
There were no non-routine calibration or maintenance procedures carried out on any major structure,
equipment, apparatus, mechanism or thing forming a part of the sewage works during the reporting
period. The period between sampling dates (September 15, 2015 to October 27, 2015) was greater than
40 days. This occurred due to the appropriate sampling equipment arriving late.
5.0 Bypass or Upset Summary
No bypass or upset conditions occurred during the reporting period.
Monthly Surface Water Quality Results Summary
Per section 13(3) of ECA 5781-9VAJQ2J
Page 3 of 5
TSX/NYSE AMEX:NGD
Table 1: Summary of Effluent Results for Construction Phase Works Discharge 19-Oct-15
Effluent Parameter Daily Maximum Concentration (mg/L) Monthly Average
Concentration (mg/L) Process Plant and Crusher
Area Sediment Pond 1 (mg/L)
Total Suspended Solids 30 15 10.0
Total Arsenic 0.034 0.017 0.0016
Total Copper 0.028 0.014 0.0029
Total Nickel 0.094 0.047 0.0018
Total Lead 0.030 0.015 0.00008
Total Zinc 0.348 0.174 0.0040
Un-ionized Ammonia 0.2 0.1 0.011 Acute Toxicity (Rainbow Trout and
Daphnia Magna) Non-acutely lethal (not greater than 50% mortality in undiluted effluent) Pass
pH of the effluent maintained between 6.0 to 9.5, inclusive, at all times 7.76

Monthly Surface Water Quality Results Summary
Per section 13(3) of ECA 5781-9VAJQ2J
Page 4 of 5
TSX/NYSE AMEX:NGD
Table 2: Summary of Surface Water Sampling Results Where PWQO or CEQG Were Exceeded
Site Water Body Parameter Sample
Concentration (mg/L)
PWQO (mg/L)
CEQG (mg/L)
ECA (mg/L)
MISA Qualifier
Historic Avg
(mg/L)
Historic Max
(mg/L)
Historic Min
(mg/L)
Historic Median (mg/L)
SW27 Loslo Creek T-Fe 0.320 0.3 0.3 - - - - - -
SW3 Pinewood River T-Al 0.234 0.075 0.1 - - 0.36 2.77 0.0508 0.2625
SW3 Pinewood River T-Fe 0.570 0.3 0.3 - - 1.11 6.97 0.064 0.6885
SW10 Pinewood River T-Al 0.127 0.075 0.1 - - 0.8 32.3 0.292 0.1915
SW10 Pinewood River T-Fe 0.45 0.3 0.3 - - 1.70 42.3 0.287 0.623
SW15 Pinewood River T-Al 1.07 0.075 0.1 - - 0.68 4.95 0.05 0.46
SW15 Pinewood River T-Fe 1.54 0.3 0.3 - - 1.07 5.99 0.09 0.92
SW20 Pinewood River T-Al 0.184 0.3 0.3 - - - - - -
SW20 Pinewood River T-Fe 0.530 0.3 0.3 - - - - - -
SW21 Pinewood River T-Fe 0.310 0.3 0.3 - - - - - -
SW16 Rainy River T-Al 0.096 0.075 0.1 - - 0.31 2.65 0.04 0.17
SW17 Rainy River T-Al 1.38 0.075 0.1 - - 0.23 1.71 0.05 0.13
SW17 Rainy River T-Co 0.00096 0.0009 - - - 0.0005 0.005 0.0001 0.0005
SW17 Rainy River T-Cu 0.0027 - 0.002 - - 0.0016 0.01 0.001 0.0013
SW17 Rainy River T-Fe 1.72 0.3 0.3 - - 0.35 1.95 0.08 0.24
SW17 Rainy River T-Pb 0.001 - 0.001 - - 0.0009 0.01 0.0001 0.001
Monthly Surface Water Quality Results Summary
Per section 13(3) of ECA 5781-9VAJQ2J
Page 5 of 5
TSX/NYSE AMEX:NGD
Monthly Surface Water Quality Results Summary
Per section 13(3) of ECA 5781-9VJQ2J
Page 1 of 5
TSX/NYSE AMEX:NGD
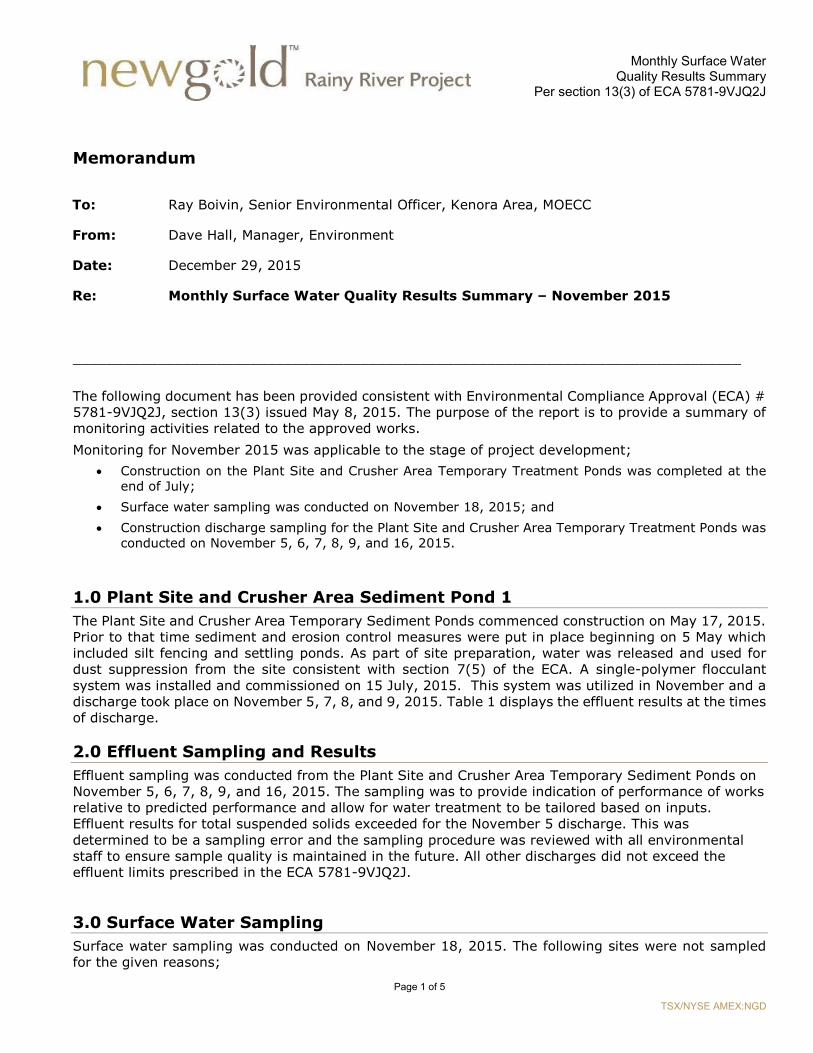
Memorandum
_______________________________________________________________________________
The following document has been provided consistent with Environmental Compliance Approval (ECA) #
5781-9VJQ2J, section 13(3) issued May 8, 2015. The purpose of the report is to provide a summary of
monitoring activities related to the approved works.
Monitoring for November 2015 was applicable to the stage of project development;
Construction on the Plant Site and Crusher Area Temporary Treatment Ponds was completed at the
end of July;
Surface water sampling was conducted on November 18, 2015; and
Construction discharge sampling for the Plant Site and Crusher Area Temporary Treatment Ponds was
conducted on November 5, 6, 7, 8, 9, and 16, 2015.
1.0 Plant Site and Crusher Area Sediment Pond 1
The Plant Site and Crusher Area Temporary Sediment Ponds commenced construction on May 17, 2015.
Prior to that time sediment and erosion control measures were put in place beginning on 5 May which
included silt fencing and settling ponds. As part of site preparation, water was released and used for
dust suppression from the site consistent with section 7(5) of the ECA. A single-polymer flocculant
system was installed and commissioned on 15 July, 2015. This system was utilized in November and a
discharge took place on November 5, 7, 8, and 9, 2015. Table 1 displays the effluent results at the times
of discharge.
2.0 Effluent Sampling and Results
Effluent sampling was conducted from the Plant Site and Crusher Area Temporary Sediment Ponds on
November 5, 6, 7, 8, 9, and 16, 2015. The sampling was to provide indication of performance of works
relative to predicted performance and allow for water treatment to be tailored based on inputs.
Effluent results for total suspended solids exceeded for the November 5 discharge. This was
determined to be a sampling error and the sampling procedure was reviewed with all environmental
staff to ensure sample quality is maintained in the future. All other discharges did not exceed the
effluent limits prescribed in the ECA 5781-9VJQ2J.
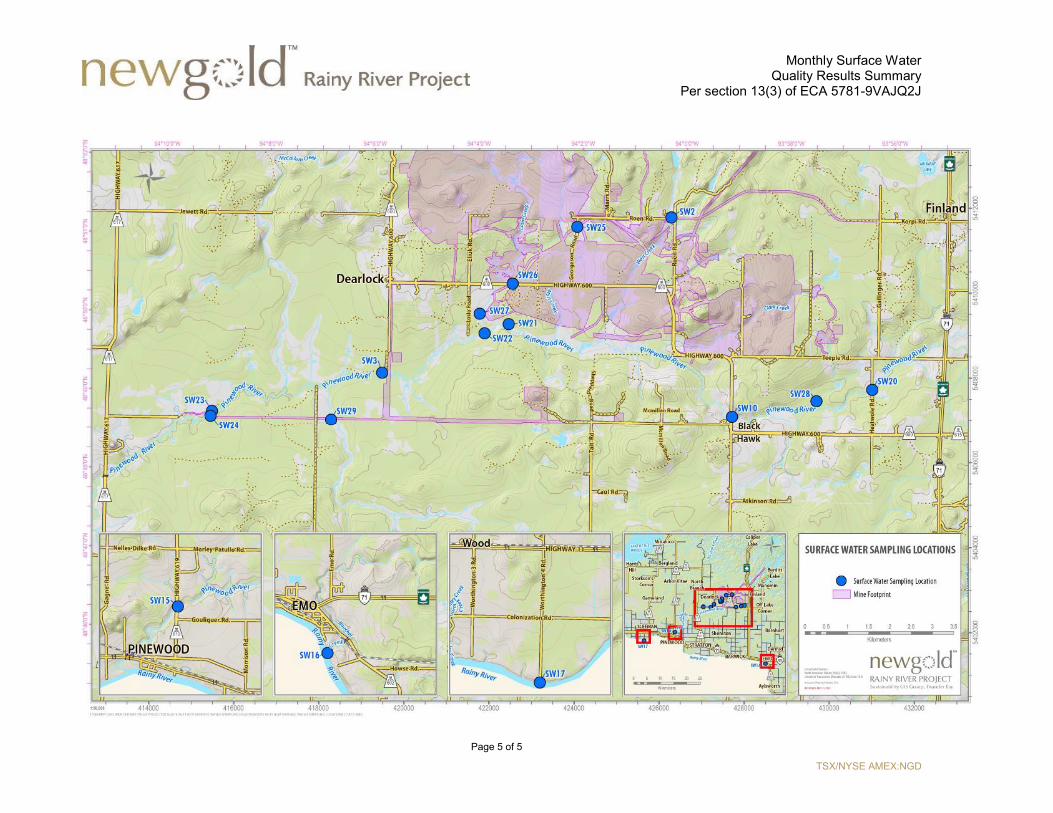
3.0 Surface Water Sampling
Surface water sampling was conducted on November 18, 2015. The following sites were not sampled
for the given reasons;
To: Ray Boivin, Senior Environmental Officer, Kenora Area, MOECC
From: Dave Hall, Manager, Environment
Date: December 29, 2015
Re: Monthly Surface Water Quality Results Summary – November 2015
Monthly Surface Water Quality Results Summary
Per section 13(3) of ECA 5781-9VJQ2J
Page 2 of 5
TSX/NYSE AMEX:NGD
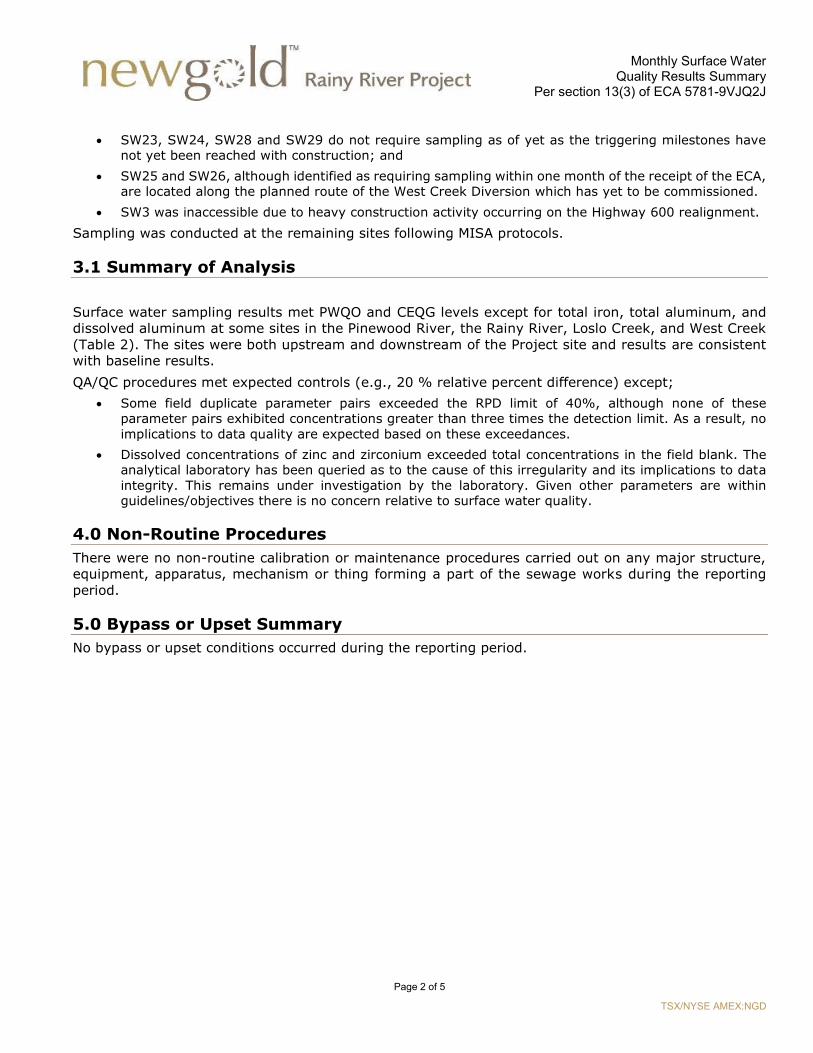
SW23, SW24, SW28 and SW29 do not require sampling as of yet as the triggering milestones have
not yet been reached with construction; and
SW25 and SW26, although identified as requiring sampling within one month of the receipt of the ECA,
are located along the planned route of the West Creek Diversion which has yet to be commissioned.
SW3 was inaccessible due to heavy construction activity occurring on the Highway 600 realignment.
Sampling was conducted at the remaining sites following MISA protocols.
3.1 Summary of Analysis
Surface water sampling results met PWQO and CEQG levels except for total iron, total aluminum, and
dissolved aluminum at some sites in the Pinewood River, the Rainy River, Loslo Creek, and West Creek
(Table 2). The sites were both upstream and downstream of the Project site and results are consistent
with baseline results.
QA/QC procedures met expected controls (e.g., 20 % relative percent difference) except;
Some field duplicate parameter pairs exceeded the RPD limit of 40%, although none of these
parameter pairs exhibited concentrations greater than three times the detection limit. As a result, no
implications to data quality are expected based on these exceedances.
Dissolved concentrations of zinc and zirconium exceeded total concentrations in the field blank. The
analytical laboratory has been queried as to the cause of this irregularity and its implications to data
integrity. This remains under investigation by the laboratory. Given other parameters are within
guidelines/objectives there is no concern relative to surface water quality.
4.0 Non-Routine Procedures
There were no non-routine calibration or maintenance procedures carried out on any major structure,
equipment, apparatus, mechanism or thing forming a part of the sewage works during the reporting
period.
5.0 Bypass or Upset Summary
No bypass or upset conditions occurred during the reporting period.
Monthly Surface Water Quality Results Summary
Per section 13(3) of ECA 5781-9VJQ2J
Page 3 of 5
TSX/NYSE AMEX:NGD
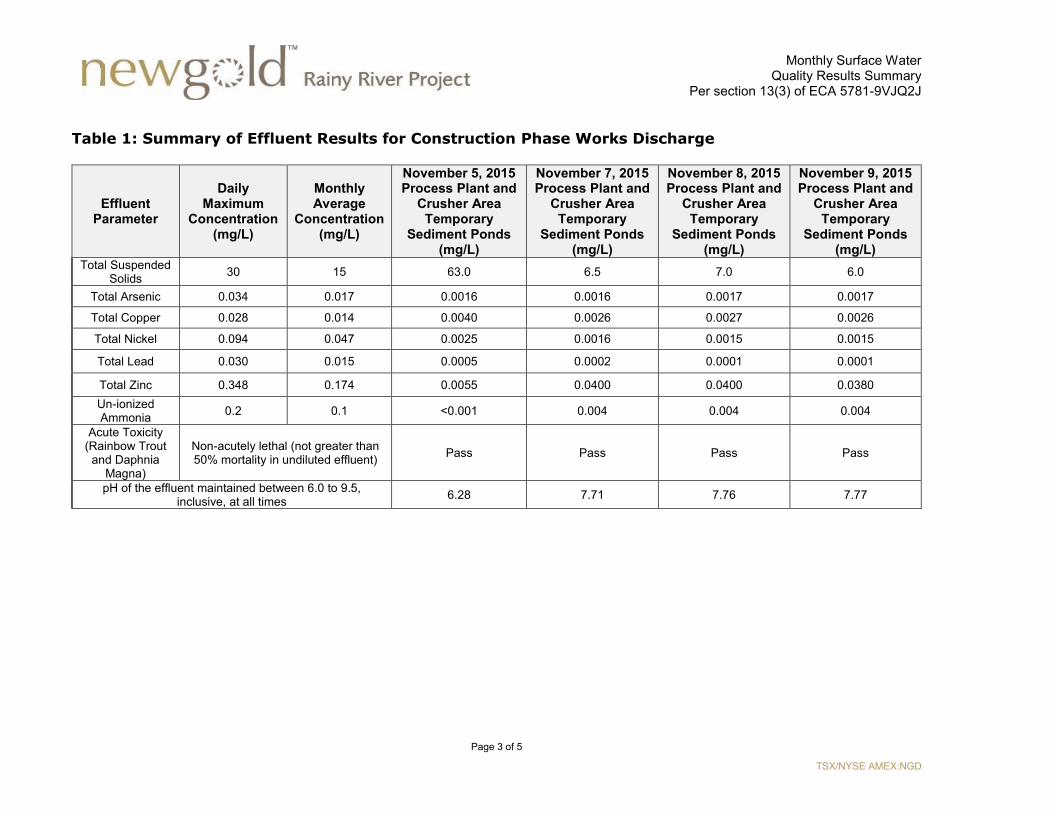
Table 1: Summary of Effluent Results for Construction Phase Works Discharge
Effluent Parameter
Daily Maximum
Concentration (mg/L)
Monthly Average
Concentration (mg/L)
November 5, 2015 Process Plant and
Crusher Area Temporary
Sediment Ponds (mg/L)
November 7, 2015 Process Plant and
Crusher Area Temporary
Sediment Ponds (mg/L)
November 8, 2015 Process Plant and
Crusher Area Temporary
Sediment Ponds (mg/L)
November 9, 2015 Process Plant and
Crusher Area Temporary
Sediment Ponds (mg/L)
Total Suspended Solids 30 15 63.0 6.5 7.0 6.0
Total Arsenic 0.034 0.017 0.0016 0.0016 0.0017 0.0017
Total Copper 0.028 0.014 0.0040 0.0026 0.0027 0.0026
Total Nickel 0.094 0.047 0.0025 0.0016 0.0015 0.0015
Total Lead 0.030 0.015 0.0005 0.0002 0.0001 0.0001
Total Zinc 0.348 0.174 0.0055 0.0400 0.0400 0.0380 Un-ionized Ammonia 0.2 0.1 <0.001 0.004 0.004 0.004
Acute Toxicity (Rainbow Trout
and Daphnia Magna)
Non-acutely lethal (not greater than 50% mortality in undiluted effluent) Pass Pass Pass Pass
pH of the effluent maintained between 6.0 to 9.5, inclusive, at all times 6.28 7.71 7.76 7.77
Monthly Surface Water Quality Results Summary
Per section 13(3) of ECA 5781-9VJQ2J
Page 4 of 5
TSX/NYSE AMEX:NGD
Table 2: Summary of Surface Water Sampling Results Where PWQO or CEQG Were Exceeded
Site Water Body Parameter Sample
Concentration (mg/L)
PWQO (mg/L)
CEQG (mg/L)
ECA (mg/L)
MISA Qualifier
Historic Avg
(mg/L)
Historic Max
(mg/L)
Historic Min
(mg/L)
Historic Median (mg/L)
SW27 Loslo Creek T-Al 0.0955 0.075 - - - - - - -
SW27 Loslo Creek T-Fe 0.320 0.3 0.3 - - - - - -
SW2 West Creek T-Al 0.230 0.075 0.1 - - 0.11 0.62 0.02 0.08
SW2 West Creek T-Fe 0.450 0.3 0.3 - - 0.56 2.07 0.11 0.40
SW10 Pinewood River T-Al 0.393 0.075 0.1 - - 0.8 32.3 0.292 0.1915
SW10 Pinewood River T-Fe 0.700 0.3 0.3 - - 1.70 42.3 0.287 0.623
SW15 Pinewood River T-Al 0.571 0.075 0.1 - - 0.68 4.95 0.05 0.46
SW15 Pinewood River T-Fe 0.840 0.3 0.3 - - 1.07 5.99 0.09 0.92
SW15 Pinewood River D-Al 0.093 0.075 - - - 0.04 0.20 0.01 0.03
SW20 Pinewood River T-Al 0.301 0.3 0.3 - - - - - -
SW20 Pinewood River T-Fe 0.560 0.3 0.3 - - - - - -
SW21 Pinewood River T-Al 0.098 0.075 - - - - - - -
SW21 Pinewood River T-Fe 0.320 0.3 0.3 - - - - - -
SW22a Pinewood River T-Al 0.0785 0.075 - - - - - - -
SW16 Rainy River T-Al 0.213 0.075 0.1 - - 0.31 2.65 0.04 0.17
SW17 Rainy River T-Al 0.152 0.075 0.1 - - 0.23 1.71 0.05 0.13

Monthly Surface Water Quality Results Summary
Per section 13(3) of ECA 5781-9VJQ2J
Page 5 of 5
TSX/NYSE AMEX:NGD
Monthly Surface Water Quality Results Summary
Per section 13(3) of ECA 5781-9VJQ2J
Page 1 of 5
TSX/NYSE AMEX:NGD
Memorandum
_______________________________________________________________________________ The following document has been provided consistent with Environmental Compliance Approval (ECA) # 5781-9VJQ2J, section 13(3) issued May 8, 2015. The purpose of the report is to provide a summary of monitoring activities related to the approved works. Monitoring for December 2015 was applicable to the stage of project development;
• Construction on the Plant Site and Crusher Area Temporary Treatment Ponds was completed at the end of July;
• Surface water sampling was conducted on December 17 and 21, 2015; and • Construction discharge sampling for the Plant Site and Crusher Area Temporary Treatment Ponds was
conducted on December 8 and 10, 2015. • Construction discharge sampling for In-Pit Sump 3 was conducted on December 13, 2015.
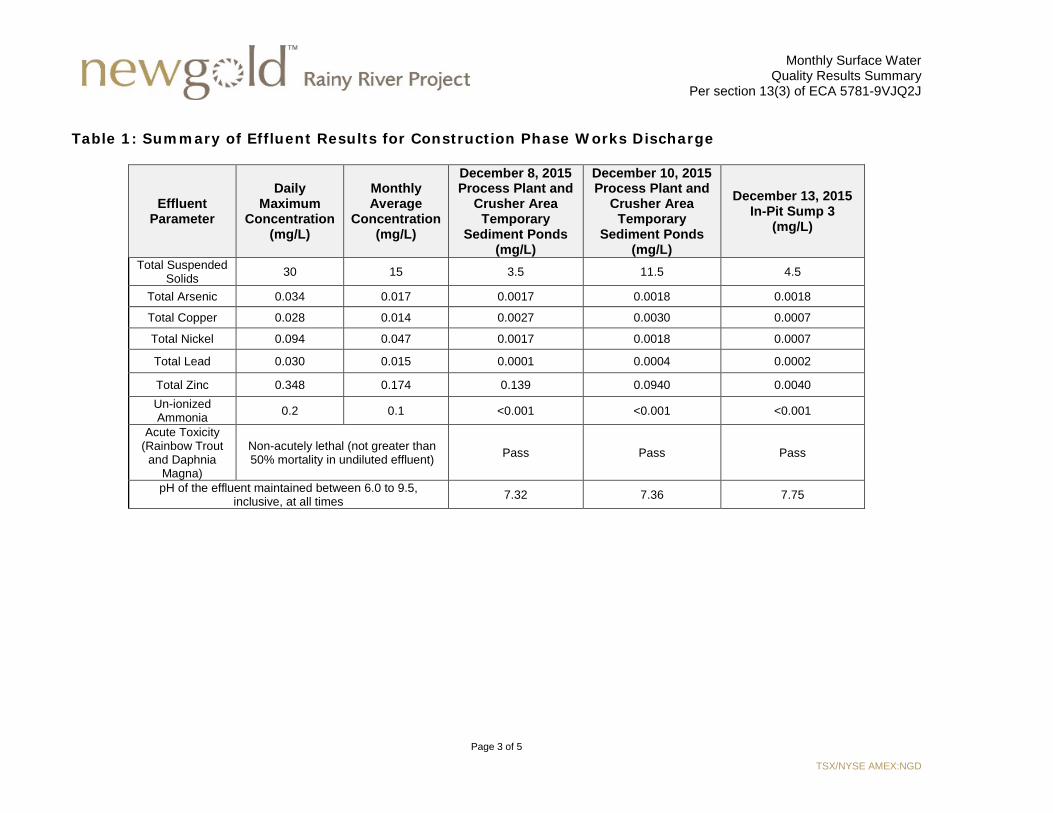
1.0 Plant Site and Crusher Area Sediment Ponds The Plant Site and Crusher Area Temporary Sediment Ponds commenced construction on May 17, 2015. Prior to that time sediment and erosion control measures were put in place beginning on 5 May which included silt fencing and settling ponds. As part of site preparation, water was released and used for dust suppression from the site consistent with section 7(5) of the ECA. A single-polymer flocculant system was installed and commissioned on 15 July, 2015. This system was utilized in December and a discharge took place on December 8 and 10, 2015. Table 1 displays the effluent results at the times of discharge.
1.1 In-Pit Sump 3 In-Pit Sump 3 commenced construction on August 20, 2015. Prior to that time sediment and erosion control measures were put in place which included silt fencing. As part of site preparation, water was released and used for dust suppression from the site consistent with section 7(5) of the ECA. No water was pumped to this sump as all water that collected was from natural overland flow and precipitation. A discharge took place on December 13, 2015. Table 1 displays the effluent results at the time of discharge.
To: Ray Boivin, Senior Environmental Officer, Kenora Area, MOECC
From: Dave Hall, Manager, Environment Date: February 1, 2016
Re: Monthly Surface Water Quality Results Summary – December 2015
Monthly Surface Water Quality Results Summary
Per section 13(3) of ECA 5781-9VJQ2J
Page 2 of 5
TSX/NYSE AMEX:NGD
2.0 Effluent Sampling and Results Effluent sampling was conducted from the Plant Site and Crusher Area Temporary Sediment Ponds on December 8 and 10, 2015 and on December 13, 2015 from In-Pit Sump 3. The sampling was to provide indication of performance of works relative to predicted performance and allow for water treatment to be tailored based on inputs. All discharges did not exceed the effluent limits prescribed in the ECA 5781-9VJQ2J.
3.0 Surface Water Sampling Surface water sampling was conducted on December 17 and 21, 2015. The following sites were not sampled for the given reasons;
• SW23, SW24, SW28 and SW29 do not require sampling as of yet as the triggering milestones have not yet been reached with construction.
• SW25 and SW26, although identified as requiring sampling within one month of the receipt of the ECA, are located along the planned route of the West Creek Diversion which has yet to be commissioned.
• SW15 and SW21 due to unsafe ice conditions at the sampling site.
Sampling was conducted at the remaining sites following MISA protocols.
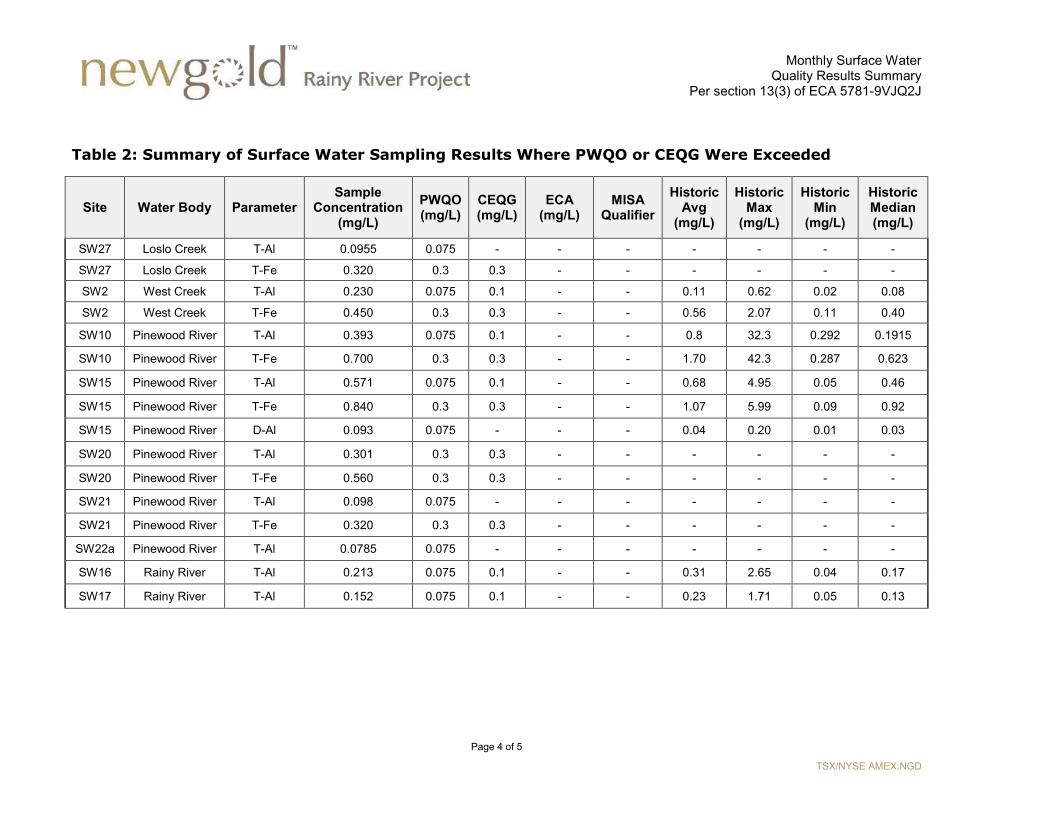
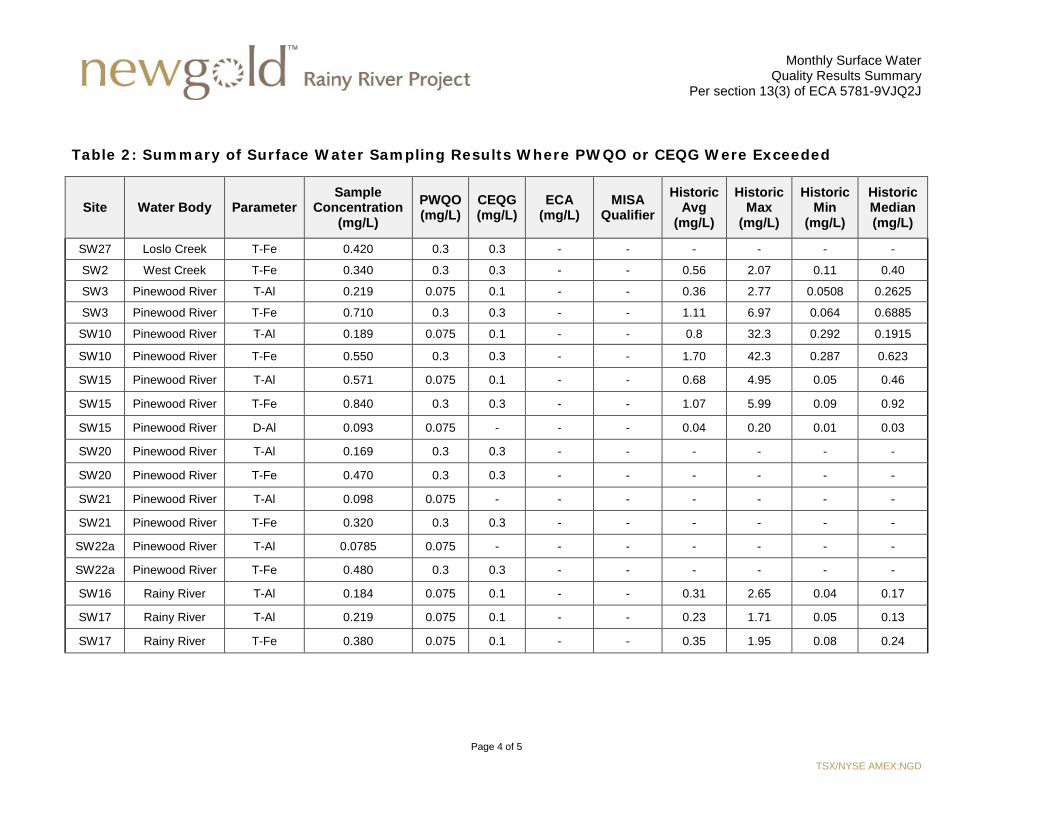
3.1 Summary of Analysis Surface water sampling results met PWQO and CEQG levels except for total iron and total aluminum at some sites in the Pinewood River, the Rainy River, Loslo Creek, and West Creek (Table 2). The sites were both upstream and downstream of the Project site and results are consistent with baseline results. QA/QC procedures met expected controls (e.g., 20 % relative percent difference) except;
• Some field duplicate parameter pairs exceeded the RPD limit of 40%, although none of these parameter pairs exhibited concentrations greater than three times the detection limit. As a result, no implications to data quality are expected based on these exceedances.
• Dissolved concentrations of zinc exceeded total concentrations in SW22a. The analytical laboratory has been queried as to the cause of this irregularity and its implications to data integrity. This remains under investigation by the laboratory. Given other parameters are within guidelines/objectives there is no concern relative to surface water quality.
4.0 Non-Routine Procedures There were no non-routine calibration or maintenance procedures carried out on any major structure, equipment, apparatus, mechanism or thing forming a part of the sewage works during the reporting period.
5.0 Bypass or Upset Summary No bypass or upset conditions occurred during the reporting period.
Monthly Surface Water Quality Results Summary
Per section 13(3) of ECA 5781-9VJQ2J
Page 3 of 5
TSX/NYSE AMEX:NGD
Table 1: Summary of Effluent Results for Construction Phase Works Discharge
Effluent Parameter
Daily Maximum
Concentration (mg/L)
Monthly Average
Concentration (mg/L)
December 8, 2015 Process Plant and
Crusher Area Temporary
Sediment Ponds (mg/L)
December 10, 2015 Process Plant and
Crusher Area Temporary
Sediment Ponds (mg/L)
December 13, 2015 In-Pit Sump 3
(mg/L)
Total Suspended Solids 30 15 3.5 11.5 4.5
Total Arsenic 0.034 0.017 0.0017 0.0018 0.0018
Total Copper 0.028 0.014 0.0027 0.0030 0.0007
Total Nickel 0.094 0.047 0.0017 0.0018 0.0007
Total Lead 0.030 0.015 0.0001 0.0004 0.0002
Total Zinc 0.348 0.174 0.139 0.0940 0.0040 Un-ionized Ammonia 0.2 0.1 <0.001 <0.001 <0.001
Acute Toxicity (Rainbow Trout
and Daphnia Magna)
Non-acutely lethal (not greater than 50% mortality in undiluted effluent) Pass Pass Pass
pH of the effluent maintained between 6.0 to 9.5, inclusive, at all times 7.32 7.36 7.75
Monthly Surface Water Quality Results Summary
Per section 13(3) of ECA 5781-9VJQ2J
Page 4 of 5
TSX/NYSE AMEX:NGD
Table 2: Summary of Surface Water Sampling Results Where PWQO or CEQG Were Exceeded
Site Water Body Parameter Sample
Concentration (mg/L)
PWQO (mg/L)
CEQG (mg/L)
ECA (mg/L)
MISA Qualifier
Historic Avg
(mg/L)
Historic Max
(mg/L)
Historic Min
(mg/L)
Historic Median (mg/L)
SW27 Loslo Creek T-Fe 0.420 0.3 0.3 - - - - - -
SW2 West Creek T-Fe 0.340 0.3 0.3 - - 0.56 2.07 0.11 0.40
SW3 Pinewood River T-Al 0.219 0.075 0.1 - - 0.36 2.77 0.0508 0.2625
SW3 Pinewood River T-Fe 0.710 0.3 0.3 - - 1.11 6.97 0.064 0.6885
SW10 Pinewood River T-Al 0.189 0.075 0.1 - - 0.8 32.3 0.292 0.1915
SW10 Pinewood River T-Fe 0.550 0.3 0.3 - - 1.70 42.3 0.287 0.623
SW15 Pinewood River T-Al 0.571 0.075 0.1 - - 0.68 4.95 0.05 0.46
SW15 Pinewood River T-Fe 0.840 0.3 0.3 - - 1.07 5.99 0.09 0.92
SW15 Pinewood River D-Al 0.093 0.075 - - - 0.04 0.20 0.01 0.03
SW20 Pinewood River T-Al 0.169 0.3 0.3 - - - - - -
SW20 Pinewood River T-Fe 0.470 0.3 0.3 - - - - - -
SW21 Pinewood River T-Al 0.098 0.075 - - - - - - -
SW21 Pinewood River T-Fe 0.320 0.3 0.3 - - - - - -
SW22a Pinewood River T-Al 0.0785 0.075 - - - - - - -
SW22a Pinewood River T-Fe 0.480 0.3 0.3 - - - - - -
SW16 Rainy River T-Al 0.184 0.075 0.1 - - 0.31 2.65 0.04 0.17
SW17 Rainy River T-Al 0.219 0.075 0.1 - - 0.23 1.71 0.05 0.13
SW17 Rainy River T-Fe 0.380 0.075 0.1 - - 0.35 1.95 0.08 0.24

Monthly Surface Water Quality Results Summary
Per section 13(3) of ECA 5781-9VJQ2J
Page 5 of 5
TSX/NYSE AMEX:NGD
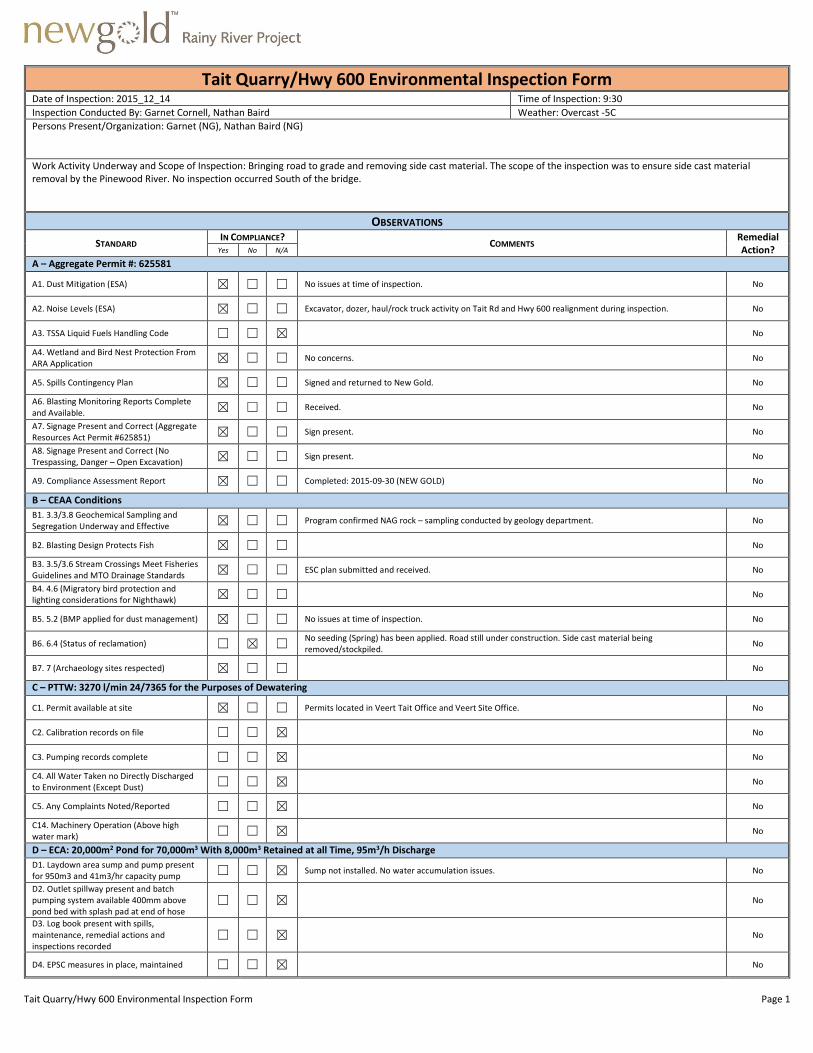
Tait Quarry/Hwy 600 Environmental Inspection Form Page 1
Tait Quarry/Hwy 600 Environmental Inspection Form Date of Inspection: 2015_12_14 Time of Inspection: 9:30
Inspection Conducted By: Garnet Cornell, Nathan Baird Weather: Overcast -5C
Persons Present/Organization: Garnet (NG), Nathan Baird (NG)
Work Activity Underway and Scope of Inspection: Bringing road to grade and removing side cast material. The scope of the inspection was to ensure side cast material removal by the Pinewood River. No inspection occurred South of the bridge.
OBSERVATIONS
STANDARD IN COMPLIANCE?
COMMENTS Remedial Action? Yes No N/A
A – Aggregate Permit #: 625581
A1. Dust Mitigation (ESA) ☒ ☐ ☐ No issues at time of inspection. No
A2. Noise Levels (ESA) ☒ ☐ ☐ Excavator, dozer, haul/rock truck activity on Tait Rd and Hwy 600 realignment during inspection. No
A3. TSSA Liquid Fuels Handling Code ☐ ☐ ☒ No
A4. Wetland and Bird Nest Protection From ARA Application ☒ ☐ ☐ No concerns. No
A5. Spills Contingency Plan ☒ ☐ ☐ Signed and returned to New Gold. No
A6. Blasting Monitoring Reports Complete and Available. ☒ ☐ ☐ Received. No
A7. Signage Present and Correct (Aggregate Resources Act Permit #625851) ☒ ☐ ☐ Sign present. No
A8. Signage Present and Correct (No Trespassing, Danger – Open Excavation) ☒ ☐ ☐ Sign present. No
A9. Compliance Assessment Report ☒ ☐ ☐ Completed: 2015-09-30 (NEW GOLD) No
B – CEAA Conditions
B1. 3.3/3.8 Geochemical Sampling and Segregation Underway and Effective ☒ ☐ ☐ Program confirmed NAG rock – sampling conducted by geology department. No
B2. Blasting Design Protects Fish ☒ ☐ ☐ No
B3. 3.5/3.6 Stream Crossings Meet Fisheries Guidelines and MTO Drainage Standards ☒ ☐ ☐ ESC plan submitted and received. No
B4. 4.6 (Migratory bird protection and lighting considerations for Nighthawk) ☒ ☐ ☐ No
B5. 5.2 (BMP applied for dust management) ☒ ☐ ☐ No issues at time of inspection. No
B6. 6.4 (Status of reclamation) ☐ ☒ ☐ No seeding (Spring) has been applied. Road still under construction. Side cast material being removed/stockpiled.
No
B7. 7 (Archaeology sites respected) ☒ ☐ ☐ No
C – PTTW: 3270 l/min 24/7365 for the Purposes of Dewatering
C1. Permit available at site ☒ ☐ ☐ Permits located in Veert Tait Office and Veert Site Office. No
C2. Calibration records on file ☐ ☐ ☒ No
C3. Pumping records complete ☐ ☐ ☒ No
C4. All Water Taken no Directly Discharged to Environment (Except Dust) ☐ ☐ ☒ No
C5. Any Complaints Noted/Reported ☐ ☐ ☒ No
C14. Machinery Operation (Above high water mark) ☐ ☐ ☒ No
D – ECA: 20,000m2 Pond for 70,000m3 With 8,000m3 Retained at all Time, 95m3/h Discharge
D1. Laydown area sump and pump present for 950m3 and 41m3/hr capacity pump ☐ ☐ ☒ Sump not installed. No water accumulation issues. No
D2. Outlet spillway present and batch pumping system available 400mm above pond bed with splash pad at end of hose
☐ ☐ ☒ No
D3. Log book present with spills, maintenance, remedial actions and inspections recorded
☐ ☐ ☒ No
D4. EPSC measures in place, maintained ☐ ☐ ☒ No
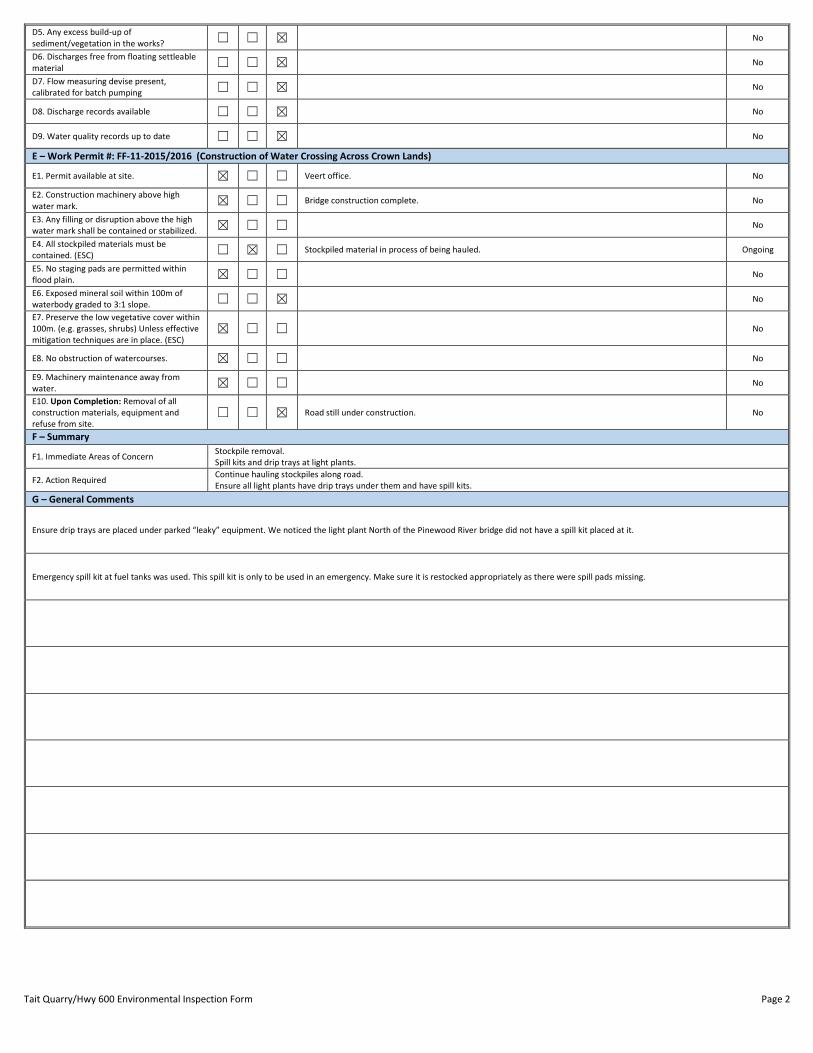
Tait Quarry/Hwy 600 Environmental Inspection Form Page 2
D5. Any excess build-up of sediment/vegetation in the works? ☐ ☐ ☒ No
D6. Discharges free from floating settleable material ☐ ☐ ☒ No
D7. Flow measuring devise present, calibrated for batch pumping ☐ ☐ ☒ No
D8. Discharge records available ☐ ☐ ☒ No
D9. Water quality records up to date ☐ ☐ ☒ No
E – Work Permit #: FF-11-2015/2016 (Construction of Water Crossing Across Crown Lands)
E1. Permit available at site. ☒ ☐ ☐ Veert office. No
E2. Construction machinery above high water mark. ☒ ☐ ☐ Bridge construction complete. No
E3. Any filling or disruption above the high water mark shall be contained or stabilized. ☒ ☐ ☐ No
E4. All stockpiled materials must be contained. (ESC) ☐ ☒ ☐ Stockpiled material in process of being hauled. Ongoing
E5. No staging pads are permitted within flood plain. ☒ ☐ ☐ No
E6. Exposed mineral soil within 100m of waterbody graded to 3:1 slope. ☐ ☐ ☒ No
E7. Preserve the low vegetative cover within 100m. (e.g. grasses, shrubs) Unless effective mitigation techniques are in place. (ESC)
☒ ☐ ☐ No
E8. No obstruction of watercourses. ☒ ☐ ☐ No
E9. Machinery maintenance away from water. ☒ ☐ ☐ No
E10. Upon Completion: Removal of all construction materials, equipment and refuse from site.
☐ ☐ ☒ Road still under construction. No
F – Summary
F1. Immediate Areas of Concern Stockpile removal. Spill kits and drip trays at light plants.
F2. Action Required Continue hauling stockpiles along road. Ensure all light plants have drip trays under them and have spill kits.
G – General Comments
Ensure drip trays are placed under parked “leaky” equipment. We noticed the light plant North of the Pinewood River bridge did not have a spill kit placed at it.
Emergency spill kit at fuel tanks was used. This spill kit is only to be used in an emergency. Make sure it is restocked appropriately as there were spill pads missing.

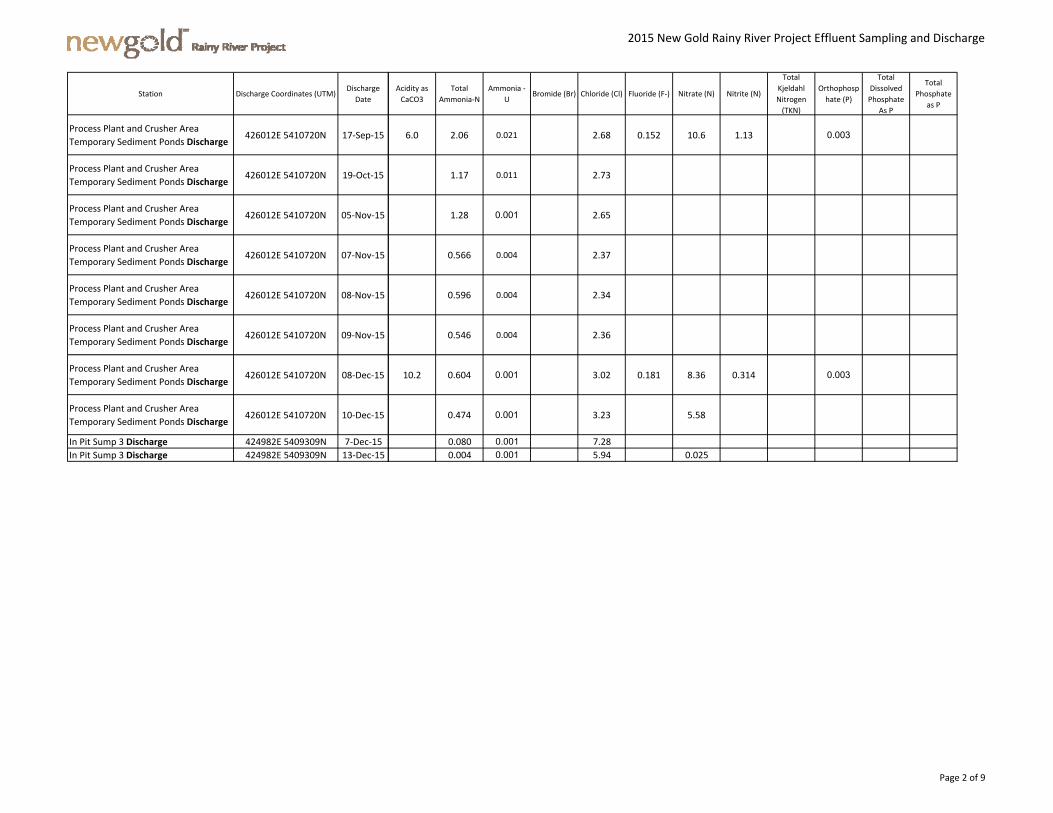
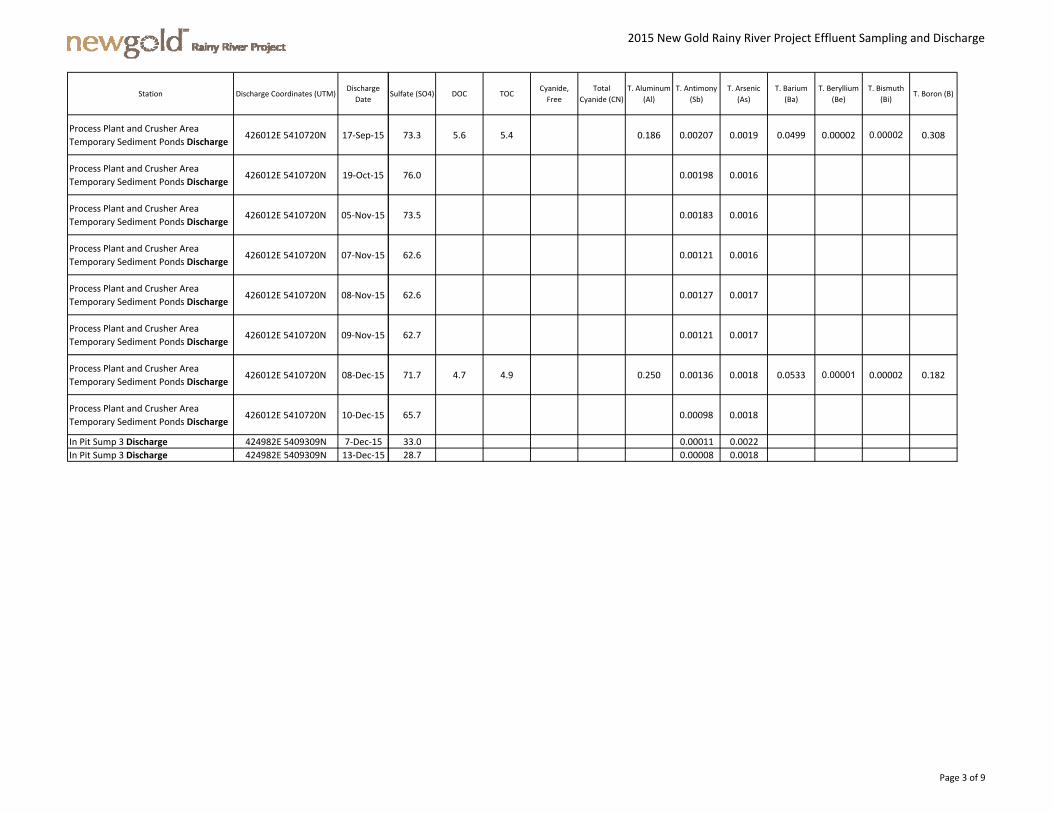
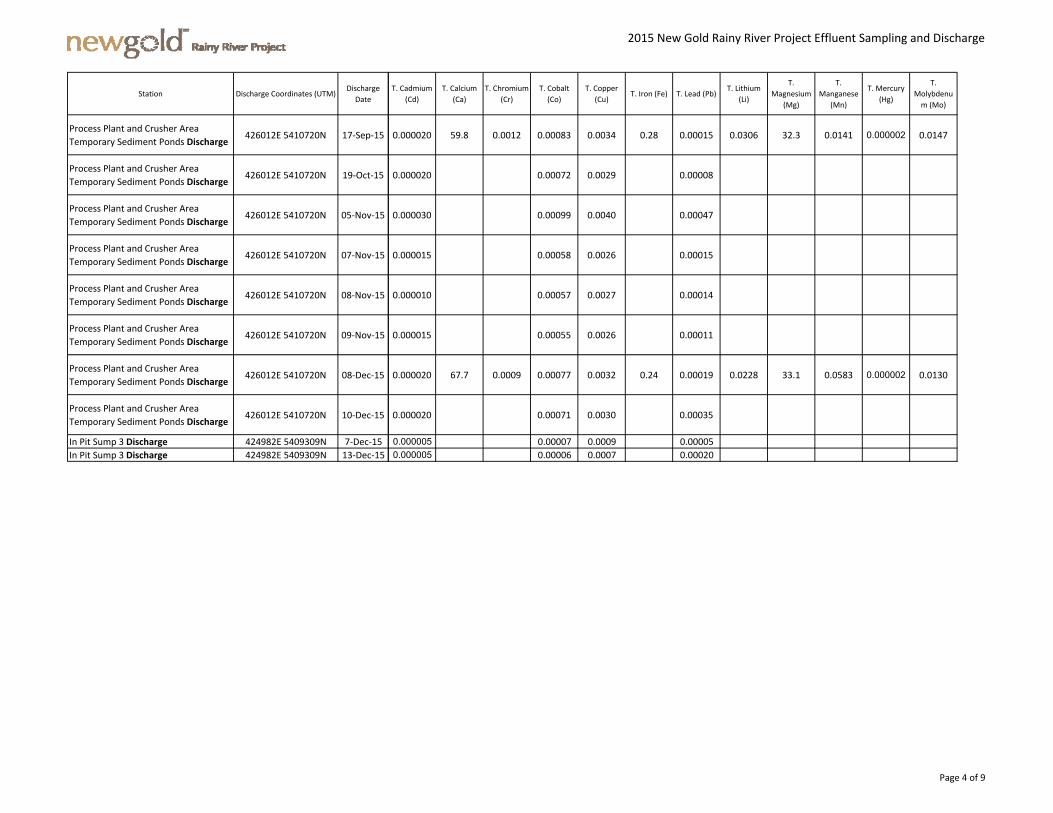
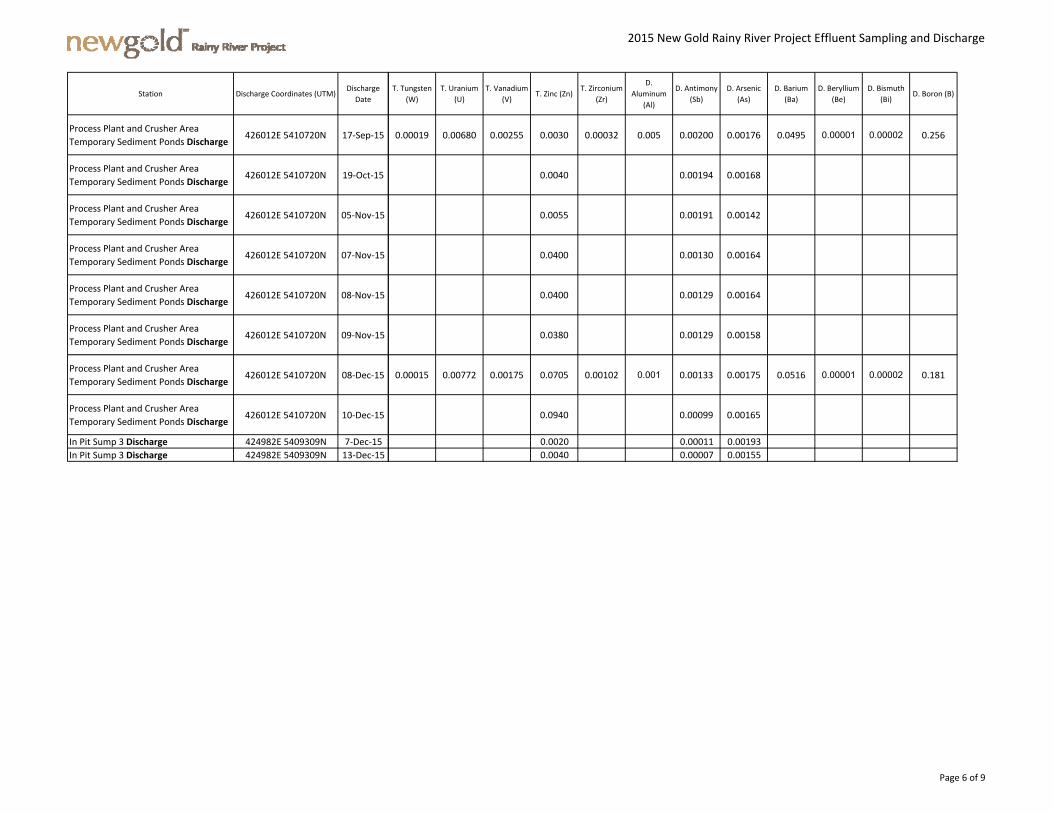
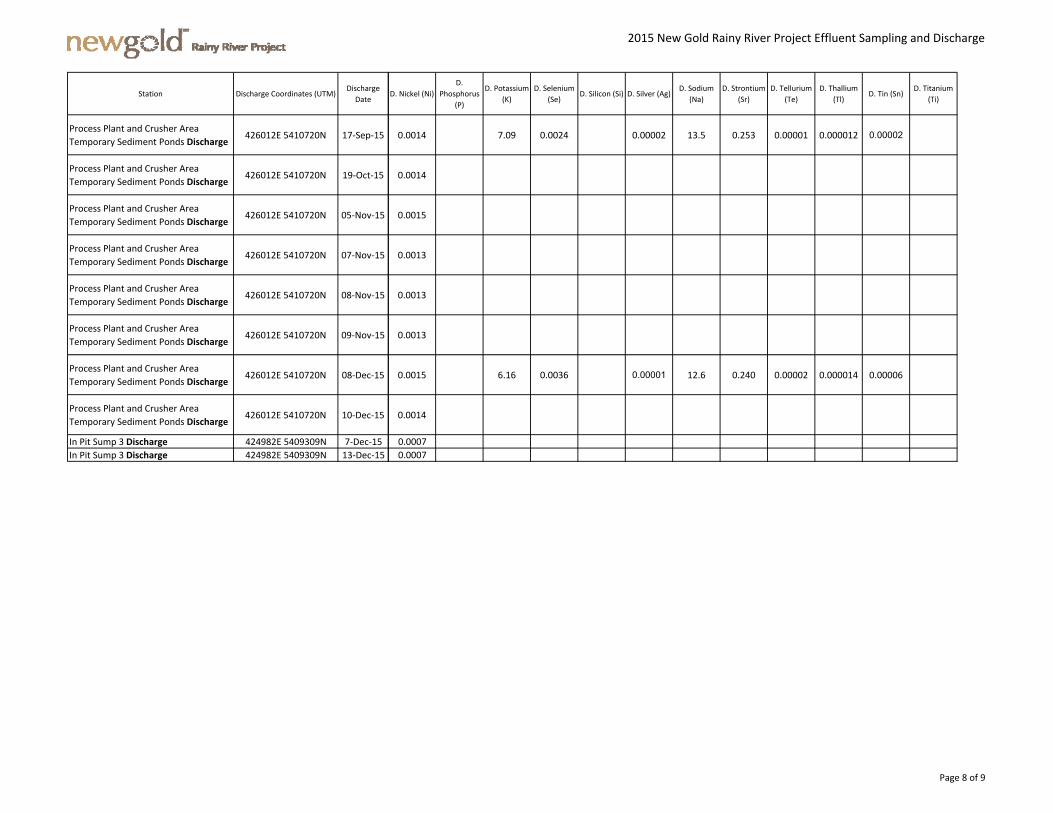
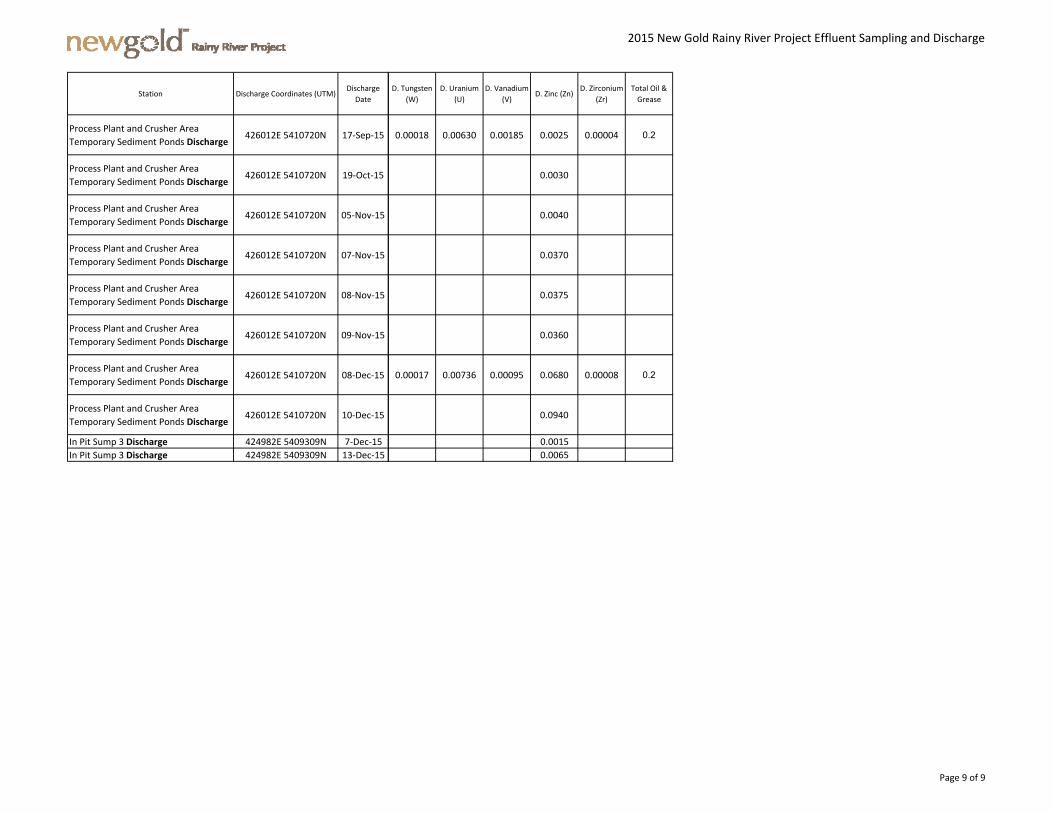
2015 New Gold Rainy River Project Effluent Sampling and Discharge
Station Discharge Coordinates (UTM)Discharge
DatepH_Field Temp_Field DO_Field Colour Conductivity Hardness pH_Lab TSS TDS Turbidity
Alkalinity (Total
as CaCO3)
Process Plant and Crusher Area
Temporary Sediment Ponds Discharge426012E 5410720N 17‐Sep‐15 7.45 18.94 5.3 606 275 7.70 17.5 380 12.9 217
Process Plant and Crusher Area
Temporary Sediment Ponds Discharge426012E 5410720N 19‐Oct‐15 7.76 8 647 273 7.98 10.0 218
Process Plant and Crusher Area
Temporary Sediment Ponds Discharge426012E 5410720N 05‐Nov‐15 6.28 7.63 629 297 7.10 63.0 224
Process Plant and Crusher Area
Temporary Sediment Ponds Discharge426012E 5410720N 07‐Nov‐15 7.71 5.29 563 275 8.15 6.5 218
Process Plant and Crusher Area
Temporary Sediment Ponds Discharge426012E 5410720N 08‐Nov‐15 7.76 5.05 567 271 8.15 7.0 221
Process Plant and Crusher Area
Temporary Sediment Ponds Discharge426012E 5410720N 09‐Nov‐15 7.77 5.57 577 279 8.18 6.0 227
Process Plant and Crusher Area
Temporary Sediment Ponds Discharge426012E 5410720N 08‐Dec‐15 6.79 1.58 5.2 629 298 7.70 11.0 375 7.61 230
Process Plant and Crusher Area
Temporary Sediment Ponds Discharge426012E 5410720N 10‐Dec‐15 6.91 1.96 602 281 7.36 11.5 229
In Pit Sump 3 Discharge 424982E 5409309N 7‐Dec‐15 7.63 3.25 616 298 7.99 1.0 328
In Pit Sump 3 Discharge 424982E 5409309N 13‐Dec‐15 7.33 1.85 688 341 7.75 4.5 344
Page 1 of 9
2015 New Gold Rainy River Project Effluent Sampling and Discharge
Station Discharge Coordinates (UTM)Discharge
Date
Process Plant and Crusher Area
Temporary Sediment Ponds Discharge426012E 5410720N 17‐Sep‐15
Process Plant and Crusher Area
Temporary Sediment Ponds Discharge426012E 5410720N 19‐Oct‐15
Process Plant and Crusher Area
Temporary Sediment Ponds Discharge426012E 5410720N 05‐Nov‐15
Process Plant and Crusher Area
Temporary Sediment Ponds Discharge426012E 5410720N 07‐Nov‐15
Process Plant and Crusher Area
Temporary Sediment Ponds Discharge426012E 5410720N 08‐Nov‐15
Process Plant and Crusher Area
Temporary Sediment Ponds Discharge426012E 5410720N 09‐Nov‐15
Process Plant and Crusher Area
Temporary Sediment Ponds Discharge426012E 5410720N 08‐Dec‐15
Process Plant and Crusher Area
Temporary Sediment Ponds Discharge426012E 5410720N 10‐Dec‐15
In Pit Sump 3 Discharge 424982E 5409309N 7‐Dec‐15
In Pit Sump 3 Discharge 424982E 5409309N 13‐Dec‐15
Acidity as
CaCO3
Total
Ammonia‐N
Ammonia ‐
UBromide (Br) Chloride (Cl) Fluoride (F‐) Nitrate (N) Nitrite (N)
Total
Kjeldahl
Nitrogen
(TKN)
Orthophosp
hate (P)
Total
Dissolved
Phosphate
As P
Total
Phosphate
as P
6.0 2.06 0.021 2.68 0.152 10.6 1.13 0.003
1.17 0.011 2.73
1.28 0.001 2.65
0.566 0.004 2.37
0.596 0.004 2.34
0.546 0.004 2.36
10.2 0.604 0.001 3.02 0.181 8.36 0.314 0.003
0.474 0.001 3.23 5.58
0.080 0.001 7.28
0.004 0.001 5.94 0.025
Page 2 of 9
2015 New Gold Rainy River Project Effluent Sampling and Discharge
Station Discharge Coordinates (UTM)Discharge
Date
Process Plant and Crusher Area
Temporary Sediment Ponds Discharge426012E 5410720N 17‐Sep‐15
Process Plant and Crusher Area
Temporary Sediment Ponds Discharge426012E 5410720N 19‐Oct‐15
Process Plant and Crusher Area
Temporary Sediment Ponds Discharge426012E 5410720N 05‐Nov‐15
Process Plant and Crusher Area
Temporary Sediment Ponds Discharge426012E 5410720N 07‐Nov‐15
Process Plant and Crusher Area
Temporary Sediment Ponds Discharge426012E 5410720N 08‐Nov‐15
Process Plant and Crusher Area
Temporary Sediment Ponds Discharge426012E 5410720N 09‐Nov‐15
Process Plant and Crusher Area
Temporary Sediment Ponds Discharge426012E 5410720N 08‐Dec‐15
Process Plant and Crusher Area
Temporary Sediment Ponds Discharge426012E 5410720N 10‐Dec‐15
In Pit Sump 3 Discharge 424982E 5409309N 7‐Dec‐15
In Pit Sump 3 Discharge 424982E 5409309N 13‐Dec‐15
Sulfate (SO4) DOC TOCCyanide,
Free
Total
Cyanide (CN)
T. Aluminum
(Al)
T. Antimony
(Sb)
T. Arsenic
(As)
T. Barium
(Ba)
T. Beryllium
(Be)
T. Bismuth
(Bi)T. Boron (B)
73.3 5.6 5.4 0.186 0.00207 0.0019 0.0499 0.00002 0.00002 0.308
76.0 0.00198 0.0016
73.5 0.00183 0.0016
62.6 0.00121 0.0016
62.6 0.00127 0.0017
62.7 0.00121 0.0017
71.7 4.7 4.9 0.250 0.00136 0.0018 0.0533 0.00001 0.00002 0.182
65.7 0.00098 0.0018
33.0 0.00011 0.0022
28.7 0.00008 0.0018
Page 3 of 9
2015 New Gold Rainy River Project Effluent Sampling and Discharge
Station Discharge Coordinates (UTM)Discharge
Date
Process Plant and Crusher Area
Temporary Sediment Ponds Discharge426012E 5410720N 17‐Sep‐15
Process Plant and Crusher Area
Temporary Sediment Ponds Discharge426012E 5410720N 19‐Oct‐15
Process Plant and Crusher Area
Temporary Sediment Ponds Discharge426012E 5410720N 05‐Nov‐15
Process Plant and Crusher Area
Temporary Sediment Ponds Discharge426012E 5410720N 07‐Nov‐15
Process Plant and Crusher Area
Temporary Sediment Ponds Discharge426012E 5410720N 08‐Nov‐15
Process Plant and Crusher Area
Temporary Sediment Ponds Discharge426012E 5410720N 09‐Nov‐15
Process Plant and Crusher Area
Temporary Sediment Ponds Discharge426012E 5410720N 08‐Dec‐15
Process Plant and Crusher Area
Temporary Sediment Ponds Discharge426012E 5410720N 10‐Dec‐15
In Pit Sump 3 Discharge 424982E 5409309N 7‐Dec‐15
In Pit Sump 3 Discharge 424982E 5409309N 13‐Dec‐15
T. Cadmium
(Cd)
T. Calcium
(Ca)
T. Chromium
(Cr)
T. Cobalt
(Co)
T. Copper
(Cu)T. Iron (Fe) T. Lead (Pb)
T. Lithium
(Li)
T.
Magnesium
(Mg)
T.
Manganese
(Mn)
T. Mercury
(Hg)
T.
Molybdenu
m (Mo)
0.000020 59.8 0.0012 0.00083 0.0034 0.28 0.00015 0.0306 32.3 0.0141 0.000002 0.0147
0.000020 0.00072 0.0029 0.00008
0.000030 0.00099 0.0040 0.00047
0.000015 0.00058 0.0026 0.00015
0.000010 0.00057 0.0027 0.00014
0.000015 0.00055 0.0026 0.00011
0.000020 67.7 0.0009 0.00077 0.0032 0.24 0.00019 0.0228 33.1 0.0583 0.000002 0.0130
0.000020 0.00071 0.0030 0.00035
0.000005 0.00007 0.0009 0.00005
0.000005 0.00006 0.0007 0.00020
Page 4 of 9

2015 New Gold Rainy River Project Effluent Sampling and Discharge
Station Discharge Coordinates (UTM)Discharge
Date
Process Plant and Crusher Area
Temporary Sediment Ponds Discharge426012E 5410720N 17‐Sep‐15
Process Plant and Crusher Area
Temporary Sediment Ponds Discharge426012E 5410720N 19‐Oct‐15
Process Plant and Crusher Area
Temporary Sediment Ponds Discharge426012E 5410720N 05‐Nov‐15
Process Plant and Crusher Area
Temporary Sediment Ponds Discharge426012E 5410720N 07‐Nov‐15
Process Plant and Crusher Area
Temporary Sediment Ponds Discharge426012E 5410720N 08‐Nov‐15
Process Plant and Crusher Area
Temporary Sediment Ponds Discharge426012E 5410720N 09‐Nov‐15
Process Plant and Crusher Area
Temporary Sediment Ponds Discharge426012E 5410720N 08‐Dec‐15
Process Plant and Crusher Area
Temporary Sediment Ponds Discharge426012E 5410720N 10‐Dec‐15
In Pit Sump 3 Discharge 424982E 5409309N 7‐Dec‐15
In Pit Sump 3 Discharge 424982E 5409309N 13‐Dec‐15
T. Nickel (Ni)
T.
Phosphorus
(P)
T. Potassium
(K)
T. Selenium
(Se)T. Silicon (Si) T. Silver (Ag)
T. Sodium
(Na)
T. Strontium
(Sr)
T. Tellurium
(Te)
T. Thallium
(Tl)T. Tin (Sn)
T. Titanium
(Ti)
0.0017 6.49 0.0022 0.00002 13.7 0.267 0.00004 0.000016 0.00006
0.0018
0.0025
0.0016
0.0015
0.0015
0.0019 6.29 0.0034 0.00001 13.2 0.255 0.00004 0.000018 0.00008
0.0018
0.0008
0.0007
Page 5 of 9
2015 New Gold Rainy River Project Effluent Sampling and Discharge
Station Discharge Coordinates (UTM)Discharge
Date
Process Plant and Crusher Area
Temporary Sediment Ponds Discharge426012E 5410720N 17‐Sep‐15
Process Plant and Crusher Area
Temporary Sediment Ponds Discharge426012E 5410720N 19‐Oct‐15
Process Plant and Crusher Area
Temporary Sediment Ponds Discharge426012E 5410720N 05‐Nov‐15
Process Plant and Crusher Area
Temporary Sediment Ponds Discharge426012E 5410720N 07‐Nov‐15
Process Plant and Crusher Area
Temporary Sediment Ponds Discharge426012E 5410720N 08‐Nov‐15
Process Plant and Crusher Area
Temporary Sediment Ponds Discharge426012E 5410720N 09‐Nov‐15
Process Plant and Crusher Area
Temporary Sediment Ponds Discharge426012E 5410720N 08‐Dec‐15
Process Plant and Crusher Area
Temporary Sediment Ponds Discharge426012E 5410720N 10‐Dec‐15
In Pit Sump 3 Discharge 424982E 5409309N 7‐Dec‐15
In Pit Sump 3 Discharge 424982E 5409309N 13‐Dec‐15
T. Tungsten
(W)
T. Uranium
(U)
T. Vanadium
(V)T. Zinc (Zn)
T. Zirconium
(Zr)
D.
Aluminum
(Al)
D. Antimony
(Sb)
D. Arsenic
(As)
D. Barium
(Ba)
D. Beryllium
(Be)
D. Bismuth
(Bi)D. Boron (B)
0.00019 0.00680 0.00255 0.0030 0.00032 0.005 0.00200 0.00176 0.0495 0.00001 0.00002 0.256
0.0040 0.00194 0.00168
0.0055 0.00191 0.00142
0.0400 0.00130 0.00164
0.0400 0.00129 0.00164
0.0380 0.00129 0.00158
0.00015 0.00772 0.00175 0.0705 0.00102 0.001 0.00133 0.00175 0.0516 0.00001 0.00002 0.181
0.0940 0.00099 0.00165
0.0020 0.00011 0.00193
0.0040 0.00007 0.00155
Page 6 of 9

2015 New Gold Rainy River Project Effluent Sampling and Discharge
Station Discharge Coordinates (UTM)Discharge
Date
Process Plant and Crusher Area
Temporary Sediment Ponds Discharge426012E 5410720N 17‐Sep‐15
Process Plant and Crusher Area
Temporary Sediment Ponds Discharge426012E 5410720N 19‐Oct‐15
Process Plant and Crusher Area
Temporary Sediment Ponds Discharge426012E 5410720N 05‐Nov‐15
Process Plant and Crusher Area
Temporary Sediment Ponds Discharge426012E 5410720N 07‐Nov‐15
Process Plant and Crusher Area
Temporary Sediment Ponds Discharge426012E 5410720N 08‐Nov‐15
Process Plant and Crusher Area
Temporary Sediment Ponds Discharge426012E 5410720N 09‐Nov‐15
Process Plant and Crusher Area
Temporary Sediment Ponds Discharge426012E 5410720N 08‐Dec‐15
Process Plant and Crusher Area
Temporary Sediment Ponds Discharge426012E 5410720N 10‐Dec‐15
In Pit Sump 3 Discharge 424982E 5409309N 7‐Dec‐15
In Pit Sump 3 Discharge 424982E 5409309N 13‐Dec‐15
D. Cadmium
(Cd)
D. Calcium
(Ca)
D.
Chromium
(Cr)
D. Cobalt
(Co)
D. Copper
(Cu)D. Iron (Fe) D. Lead (Pb)
D. Lithium
(Li)
D.
Magnesium
(Mg)
D.
Manganese
(Mn)
D. Mercury
(Hg)
D.
Molybdenu
m (Mo)
0.000015 57.4 0.0007 0.00062 0.0026 0.01 0.00001 0.0300 32.0 0.0056 0.000002 0.0142
0.000020 0.00064 0.0024 0.00001
0.000025 0.00064 0.0025 0.00001
0.000005 0.00051 0.0021 0.00002
0.000010 0.00049 0.0021 0.00003
0.000005 0.00049 0.0021 0.00001
0.000020 67.4 0.0004 0.00063 0.0026 0.01 0.00002 0.0234 31.5 0.0513 0.000002 0.0122
0.000020 0.00060 0.0026 0.00009
0.000005 0.00006 0.0006 0.00001
0.000005 0.00004 0.0006 0.00009
Page 7 of 9
2015 New Gold Rainy River Project Effluent Sampling and Discharge
Station Discharge Coordinates (UTM)Discharge
Date
Process Plant and Crusher Area
Temporary Sediment Ponds Discharge426012E 5410720N 17‐Sep‐15
Process Plant and Crusher Area
Temporary Sediment Ponds Discharge426012E 5410720N 19‐Oct‐15
Process Plant and Crusher Area
Temporary Sediment Ponds Discharge426012E 5410720N 05‐Nov‐15
Process Plant and Crusher Area
Temporary Sediment Ponds Discharge426012E 5410720N 07‐Nov‐15
Process Plant and Crusher Area
Temporary Sediment Ponds Discharge426012E 5410720N 08‐Nov‐15
Process Plant and Crusher Area
Temporary Sediment Ponds Discharge426012E 5410720N 09‐Nov‐15
Process Plant and Crusher Area
Temporary Sediment Ponds Discharge426012E 5410720N 08‐Dec‐15
Process Plant and Crusher Area
Temporary Sediment Ponds Discharge426012E 5410720N 10‐Dec‐15
In Pit Sump 3 Discharge 424982E 5409309N 7‐Dec‐15
In Pit Sump 3 Discharge 424982E 5409309N 13‐Dec‐15
D. Nickel (Ni)
D.
Phosphorus
(P)
D. Potassium
(K)
D. Selenium
(Se)D. Silicon (Si) D. Silver (Ag)
D. Sodium
(Na)
D. Strontium
(Sr)
D. Tellurium
(Te)
D. Thallium
(Tl)D. Tin (Sn)
D. Titanium
(Ti)
0.0014 7.09 0.0024 0.00002 13.5 0.253 0.00001 0.000012 0.00002
0.0014
0.0015
0.0013
0.0013
0.0013
0.0015 6.16 0.0036 0.00001 12.6 0.240 0.00002 0.000014 0.00006
0.0014
0.0007
0.0007
Page 8 of 9
2015 New Gold Rainy River Project Effluent Sampling and Discharge
Station Discharge Coordinates (UTM)Discharge
Date
Process Plant and Crusher Area
Temporary Sediment Ponds Discharge426012E 5410720N 17‐Sep‐15
Process Plant and Crusher Area
Temporary Sediment Ponds Discharge426012E 5410720N 19‐Oct‐15
Process Plant and Crusher Area
Temporary Sediment Ponds Discharge426012E 5410720N 05‐Nov‐15
Process Plant and Crusher Area
Temporary Sediment Ponds Discharge426012E 5410720N 07‐Nov‐15
Process Plant and Crusher Area
Temporary Sediment Ponds Discharge426012E 5410720N 08‐Nov‐15
Process Plant and Crusher Area
Temporary Sediment Ponds Discharge426012E 5410720N 09‐Nov‐15
Process Plant and Crusher Area
Temporary Sediment Ponds Discharge426012E 5410720N 08‐Dec‐15
Process Plant and Crusher Area
Temporary Sediment Ponds Discharge426012E 5410720N 10‐Dec‐15
In Pit Sump 3 Discharge 424982E 5409309N 7‐Dec‐15
In Pit Sump 3 Discharge 424982E 5409309N 13‐Dec‐15
D. Tungsten
(W)
D. Uranium
(U)
D. Vanadium
(V)D. Zinc (Zn)
D. Zirconium
(Zr)
Total Oil &
Grease
0.00018 0.00630 0.00185 0.0025 0.00004 0.2
0.0030
0.0040
0.0370
0.0375
0.0360
0.00017 0.00736 0.00095 0.0680 0.00008 0.2
0.0940
0.0015
0.0065
Page 9 of 9
ENV-PRCD-15-03 Site Procedure for Construction Dewatering and Monitoring
Printed copies of this document are NOT CONTROLLED Check original on the network drive to verify copy is current Date Printed: November 7, 2015 CONTROLLED DOCUMENT Page 1 of 3
ENV-PRCD-003
Site Procedure for Construction Dewatering and Monitoring
Author : Manager Environment November 7, 2015
Approver : Construct ion Director November 7, 2015
Revision Number : V1.0
Creation Date : November 7, 2015
Date Last Modified : November 7, 2015 Review Frequency: 1 Year
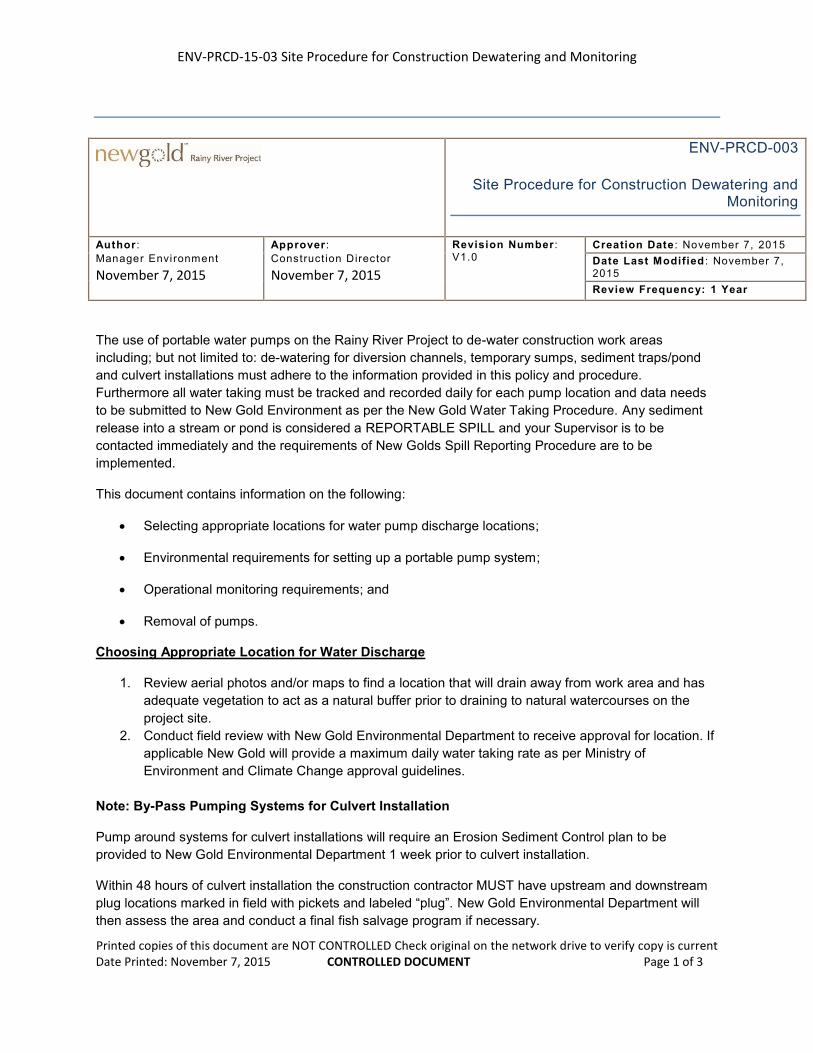
The use of portable water pumps on the Rainy River Project to de-water construction work areas including; but not limited to: de-watering for diversion channels, temporary sumps, sediment traps/pond and culvert installations must adhere to the information provided in this policy and procedure. Furthermore all water taking must be tracked and recorded daily for each pump location and data needs to be submitted to New Gold Environment as per the New Gold Water Taking Procedure. Any sediment release into a stream or pond is considered a REPORTABLE SPILL and your Supervisor is to be contacted immediately and the requirements of New Golds Spill Reporting Procedure are to be implemented.
This document contains information on the following:
Selecting appropriate locations for water pump discharge locations;
Environmental requirements for setting up a portable pump system;
Operational monitoring requirements; and
Removal of pumps.
Choosing Appropriate Location for Water Discharge
1. Review aerial photos and/or maps to find a location that will drain away from work area and hasadequate vegetation to act as a natural buffer prior to draining to natural watercourses on theproject site.
2. Conduct field review with New Gold Environmental Department to receive approval for location. Ifapplicable New Gold will provide a maximum daily water taking rate as per Ministry ofEnvironment and Climate Change approval guidelines.
Note: By-Pass Pumping Systems for Culvert Installation
Pump around systems for culvert installations will require an Erosion Sediment Control plan to be provided to New Gold Environmental Department 1 week prior to culvert installation.
Within 48 hours of culvert installation the construction contractor MUST have upstream and downstream plug locations marked in field with pickets and labeled “plug”. New Gold Environmental Department will then assess the area and conduct a final fish salvage program if necessary.
ENV-PRCD-15-03 Site Procedure for Construction Dewatering and Monitoring
Printed copies of this document are NOT CONTROLLED Check original on the network drive to verify copy is current Date Printed: November 7, 2015 CONTROLLED DOCUMENT Page 2 of 3
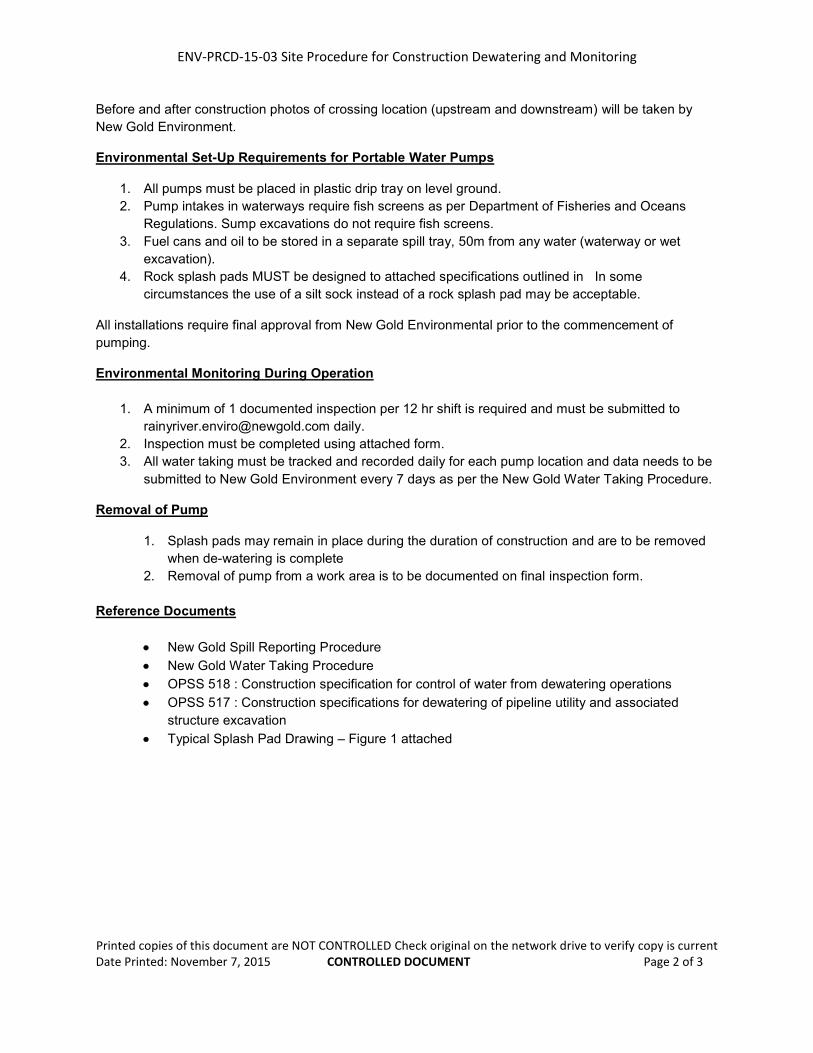
Before and after construction photos of crossing location (upstream and downstream) will be taken by New Gold Environment.
Environmental Set-Up Requirements for Portable Water Pumps
1. All pumps must be placed in plastic drip tray on level ground.2. Pump intakes in waterways require fish screens as per Department of Fisheries and Oceans
Regulations. Sump excavations do not require fish screens.3. Fuel cans and oil to be stored in a separate spill tray, 50m from any water (waterway or wet
excavation).4. Rock splash pads MUST be designed to attached specifications outlined in In some
circumstances the use of a silt sock instead of a rock splash pad may be acceptable.
All installations require final approval from New Gold Environmental prior to the commencement of pumping.
Environmental Monitoring During Operation
1. A minimum of 1 documented inspection per 12 hr shift is required and must be submitted [email protected] daily.
2. Inspection must be completed using attached form.3. All water taking must be tracked and recorded daily for each pump location and data needs to be
submitted to New Gold Environment every 7 days as per the New Gold Water Taking Procedure.
Removal of Pump
1. Splash pads may remain in place during the duration of construction and are to be removedwhen de-watering is complete
2. Removal of pump from a work area is to be documented on final inspection form.
Reference Documents
New Gold Spill Reporting Procedure New Gold Water Taking Procedure OPSS 518 : Construction specification for control of water from dewatering operations OPSS 517 : Construction specifications for dewatering of pipeline utility and associated
structure excavation Typical Splash Pad Drawing – Figure 1 attached
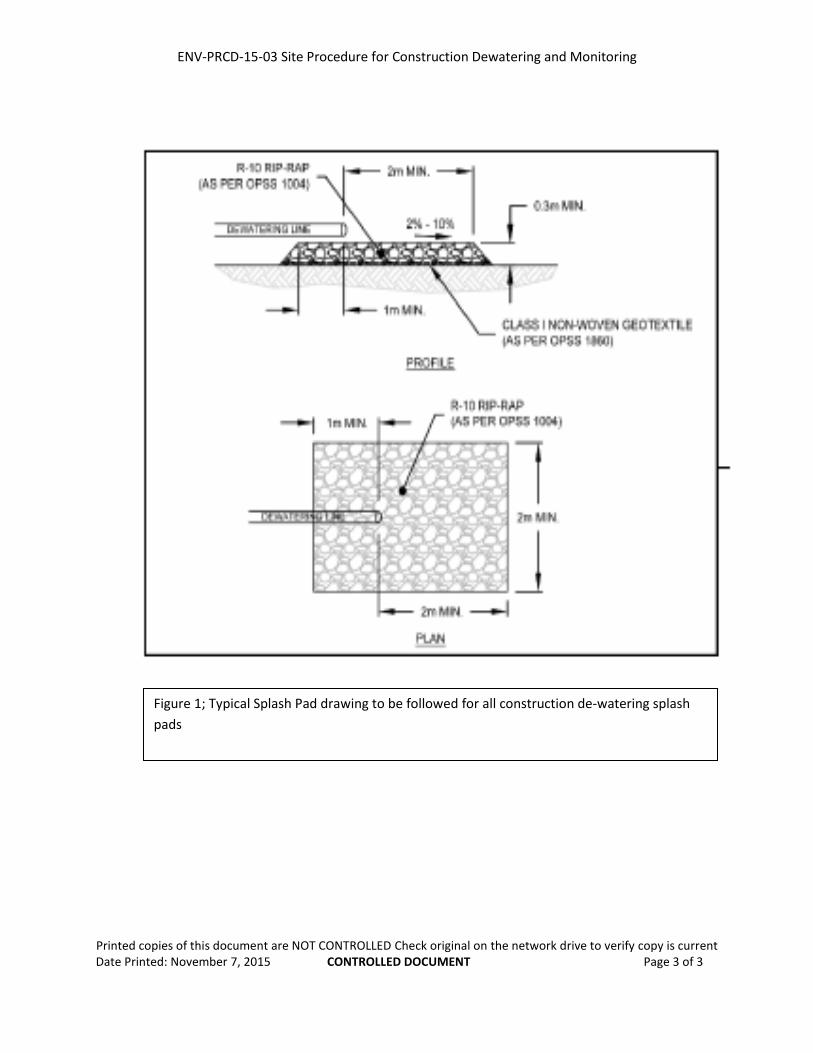
ENV-PRCD-15-03 Site Procedure for Construction Dewatering and Monitoring
Printed copies of this document are NOT CONTROLLED Check original on the network drive to verify copy is current Date Printed: November 7, 2015 CONTROLLED DOCUMENT Page 3 of 3
Figure 1; Typical Splash Pad drawing to be followed for all construction de-watering splash
pads
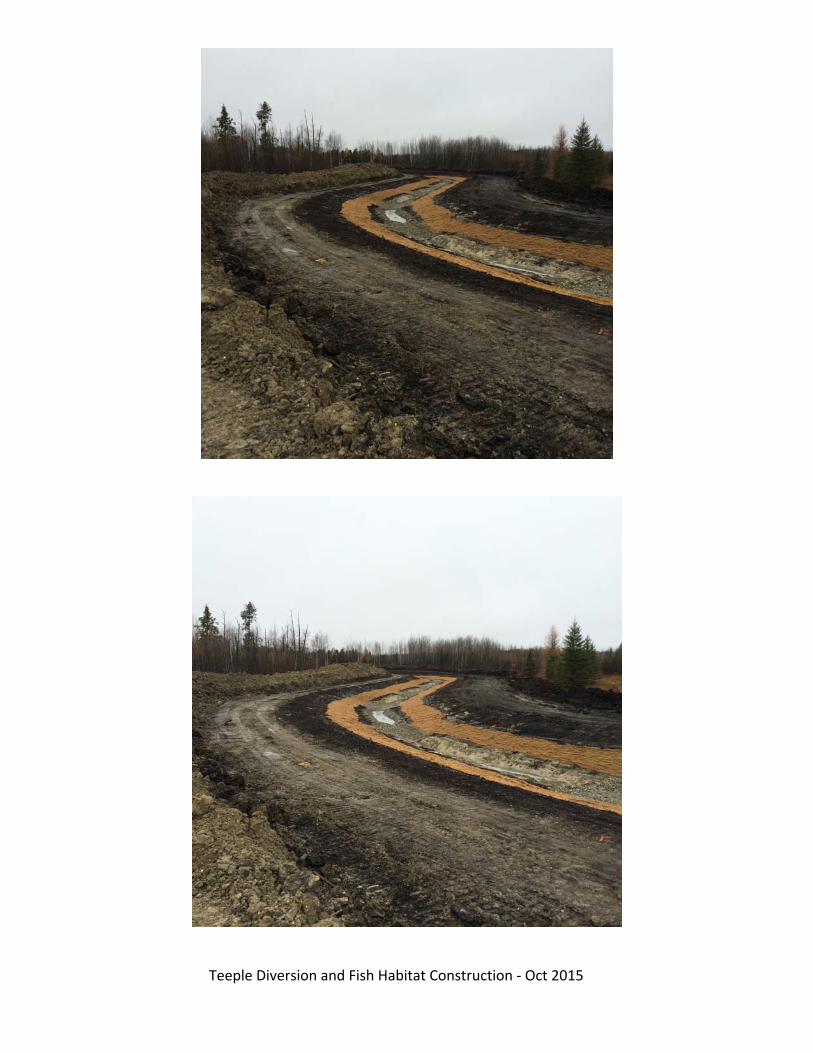
Teeple Diversion and Fish Habitat Construction - Oct 2015
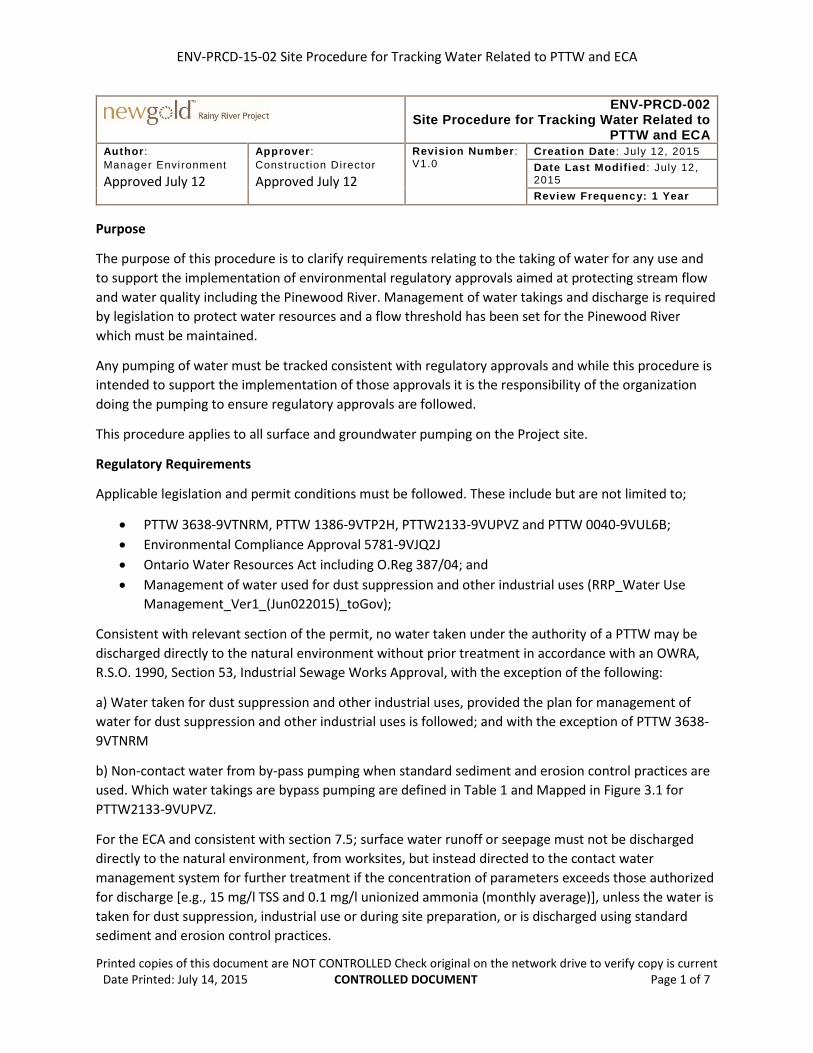
ENV-PRCD-15-02 Site Procedure for Tracking Water Related to PTTW and ECA
Printed copies of this document are NOT CONTROLLED Check original on the network drive to verify copy is current Date Printed: July 14, 2015 CONTROLLED DOCUMENT Page 1 of 7
ENV-PRCD-002 Site Procedure for Tracking Water Related to
PTTW and ECA Author : Manager Envi ronment Approved July 12
Approver : Construct ion Director Approved July 12
Revision Number : V1.0
Creation Date : July 12, 2015 Date Last Modified : July 12, 2015 Review Frequency: 1 Year
Purpose
The purpose of this procedure is to clarify requirements relating to the taking of water for any use and to support the implementation of environmental regulatory approvals aimed at protecting stream flow and water quality including the Pinewood River. Management of water takings and discharge is required by legislation to protect water resources and a flow threshold has been set for the Pinewood River which must be maintained.
Any pumping of water must be tracked consistent with regulatory approvals and while this procedure is intended to support the implementation of those approvals it is the responsibility of the organization doing the pumping to ensure regulatory approvals are followed.
This procedure applies to all surface and groundwater pumping on the Project site.
Regulatory Requirements
Applicable legislation and permit conditions must be followed. These include but are not limited to;
• PTTW 3638-9VTNRM, PTTW 1386-9VTP2H, PTTW2133-9VUPVZ and PTTW 0040-9VUL6B;• Environmental Compliance Approval 5781-9VJQ2J• Ontario Water Resources Act including O.Reg 387/04; and• Management of water used for dust suppression and other industrial uses (RRP_Water Use
Management_Ver1_(Jun022015)_toGov);
Consistent with relevant section of the permit, no water taken under the authority of a PTTW may be discharged directly to the natural environment without prior treatment in accordance with an OWRA, R.S.O. 1990, Section 53, Industrial Sewage Works Approval, with the exception of the following:
a) Water taken for dust suppression and other industrial uses, provided the plan for management ofwater for dust suppression and other industrial uses is followed; and with the exception of PTTW 3638-9VTNRM
b) Non-contact water from by-pass pumping when standard sediment and erosion control practices areused. Which water takings are bypass pumping are defined in Table 1 and Mapped in Figure 3.1 for PTTW2133-9VUPVZ.
For the ECA and consistent with section 7.5; surface water runoff or seepage must not be discharged directly to the natural environment, from worksites, but instead directed to the contact water management system for further treatment if the concentration of parameters exceeds those authorized for discharge [e.g., 15 mg/l TSS and 0.1 mg/l unionized ammonia (monthly average)], unless the water is taken for dust suppression, industrial use or during site preparation, or is discharged using standard sediment and erosion control practices.
ENV-PRCD-15-02 Site Procedure for Tracking Water Related to PTTW and ECA
Printed copies of this document are NOT CONTROLLED Check original on the network drive to verify copy is current Date Printed: July 14, 2015 CONTROLLED DOCUMENT Page 2 of 7
All water taken or discharged must be recorded by an annually calibrated flow measuring device with an accuracy of plus or minus 15 percent of the actual flow.
Procedure;
Pumping of any water on site must follow this procedure. The only exceptions are for water used for domestic use, potable water and fire suppression. The procedure has the following required steps;
1. Request for pumping approval submitted to New Gold together with calibration records a. Determine if pumping is (Environmental Compliance Approval) ECA or Permit to Take
Water (PTTW) related b. Provide Details of pumping plans and environmental controls c. Provide information for flow metering and associated calibration records
2. Track water taking/pumping 3. Limitations and restrictions on cumulative consumptive takings
Step 1: Request for pumping approval submitted to New Gold together with calibration records
Prior to ANY pumping of surface or ground water on site a request must be made through the contracts department and ultimately to the environmental department using the form included with this procedure (Pump/Flow Meter Site Authorization Form; Permit to Take Water). The purpose of the form is a onetime process to support communication of Permit requirements and provide New Gold with documentation regarding the proposed pumping including volume, rate, duration and the calibration records of flow measuring devices.
Step 1 must be completed prior to completion of pumping. In the event of an emergency this process can be bypassed with authorization of the Environment Manager or designate provided the information is still captured e.g., flow rates, volumes etc and provided after the event.
Step 1a: Determination of PTTW, ECA related pumping or pumping from groundwater
Step 1a is required to identify the approved permit and legislation allowing for the proposed pumping. The information determined in Step 1a is to be recorded on Part A of the form.
All approved water takings by a PTTW are listed in Table 1 and must follow the corresponding PTTW approval. If the required pumping is not listed in Table 1 then the pumping is related to an ECA and must follow the ECA approval particularly sections 7.5 and 9.6. However, water takings in Table 1 may also be subject to the ECA which are highlighted in blue in Table 1 and in this case both PTTW and ECA conditions apply.
Table 1 provides a summary of approved water takings consistent with the approved Permits To Take Water. There are 4 categories as colour coded in Table 1;
• To ECA approved water treatment • Bypass with sediment and erosion control • Bypass to enhanced sediment and erosion control (but not ECA) • Consumptive taking
ENV-PRCD-15-02 Site Procedure for Tracking Water Related to PTTW and ECA
Printed copies of this document are NOT CONTROLLED Check original on the network drive to verify copy is current Date Printed: July 14, 2015 CONTROLLED DOCUMENT Page 3 of 7
All PTTW related pumping fits into one of these categories. A description is to be provided of the pump e.g., for dewatering a work area associated with excavation water that will be pumped to a vegetative area with applicable sediment and erosion control.
If groundwater pumping is permitted through a PTTW a similar process must be followed as for PTTW approved takings for surface water. In the absence of a PTTW for groundwater pumping then water tracking is required consistent with surface water for PTTW takings to ensure 50 m3/day is not exceeded.
Pumping of all other surface water is related to the ECA as approved under section 7.5 and must be done with standard sediment erosion control practices or taken for dust suppression/industrial uses. Standard sediment and erosion control practices include those listed in OPSS 805, or as identified in sediment and erosion control plans for the site and/or specific works e.g., any LRIA approvals. Takings for dust suppression must follow the Management of water used for dust suppression and other industrial uses plan (RRP_Water Use Management_Ver1_(Jun022015)_toGov).
There are 8 approved final treated water discharge locations based on the ECA which is excluded from this procedure. No discharge from these locations may occur without authorization from the New Gold site environmental department. Once these treatment works are completed all water related to those works must go through the treatment works.
Step 1b Provide Details of pumping plans and environmental controls
The details of pumping and environmental controls required depend on the type of pumping and the enabling permit. The information determined from step 1b is to be recorded in Part B of the form.
For a PTTW the source of water taking, discharge location and a maximum volume, rate and duration of pumping has been defined in the PTTW. Therefore this information is required to ensure awareness of the permit requirement. The permit approves a maximum for each of these data fields which cannot be exceeded. Table 1 lists the approved pumping limits, sources and discharge points which can be used to populate Part B of the form.
For ECA related pumping there are no limits on the volume, duration or rate of pumping however, standard sediment and erosion control measures must be applied as identified above, these measures are to be identified on the form.
For dust suppression reference must be made to conformance with the following plan: RRP_Water Use Management_Ver1_(Jun022015)_toGov including specific control measures as applicable.
Step 1c Provide information for flow metering and associated calibration records
To ensure pumping records and volumes are accurate measuring pumping is required for any pumping. The measuring of water pumping must conform to one or more of the following criteria;
1. a flow measuring device(s) to an accuracy of ± 15% of the actual flow rate. The flow measuring device shall be calibrated at least once per year over the range of flow going through the meter
2. water truck with certified volume and the number of loads, volume and rate of taking is recorded
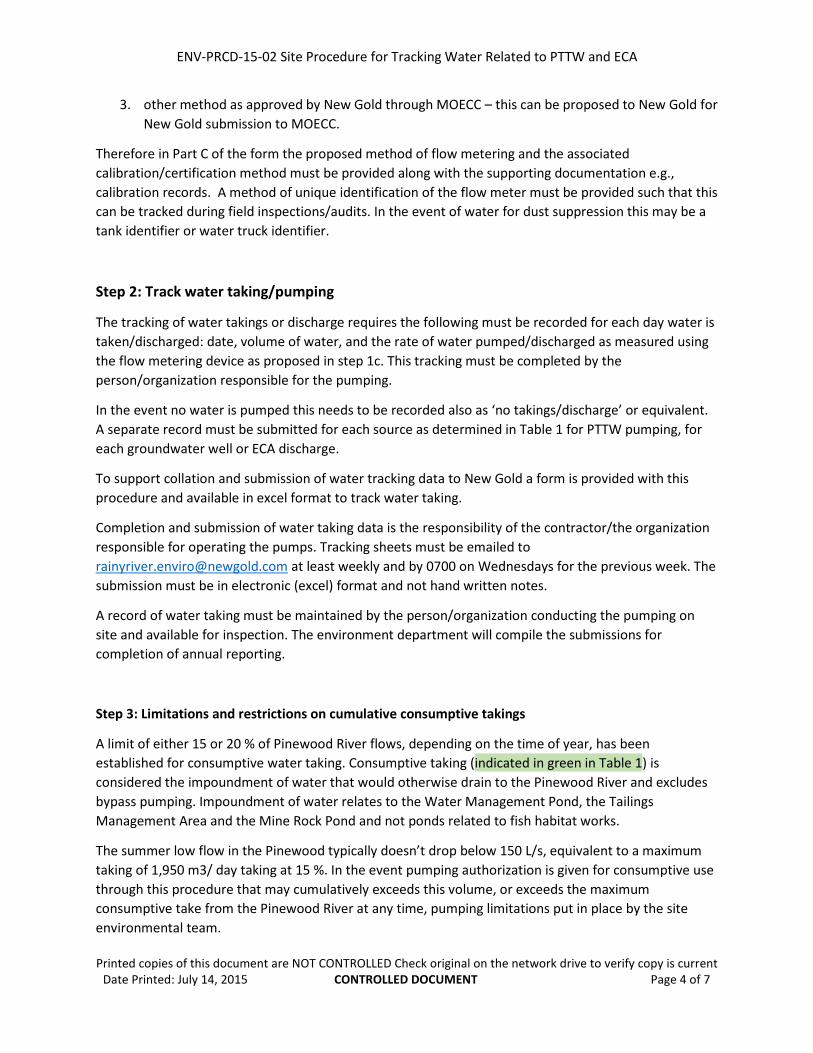
ENV-PRCD-15-02 Site Procedure for Tracking Water Related to PTTW and ECA
Printed copies of this document are NOT CONTROLLED Check original on the network drive to verify copy is current Date Printed: July 14, 2015 CONTROLLED DOCUMENT Page 4 of 7
3. other method as approved by New Gold through MOECC – this can be proposed to New Gold for New Gold submission to MOECC.
Therefore in Part C of the form the proposed method of flow metering and the associated calibration/certification method must be provided along with the supporting documentation e.g., calibration records. A method of unique identification of the flow meter must be provided such that this can be tracked during field inspections/audits. In the event of water for dust suppression this may be a tank identifier or water truck identifier.
Step 2: Track water taking/pumping
The tracking of water takings or discharge requires the following must be recorded for each day water is taken/discharged: date, volume of water, and the rate of water pumped/discharged as measured using the flow metering device as proposed in step 1c. This tracking must be completed by the person/organization responsible for the pumping.
In the event no water is pumped this needs to be recorded also as ‘no takings/discharge’ or equivalent. A separate record must be submitted for each source as determined in Table 1 for PTTW pumping, for each groundwater well or ECA discharge.
To support collation and submission of water tracking data to New Gold a form is provided with this procedure and available in excel format to track water taking.
Completion and submission of water taking data is the responsibility of the contractor/the organization responsible for operating the pumps. Tracking sheets must be emailed to [email protected] at least weekly and by 0700 on Wednesdays for the previous week. The submission must be in electronic (excel) format and not hand written notes.
A record of water taking must be maintained by the person/organization conducting the pumping on site and available for inspection. The environment department will compile the submissions for completion of annual reporting.
Step 3: Limitations and restrictions on cumulative consumptive takings
A limit of either 15 or 20 % of Pinewood River flows, depending on the time of year, has been established for consumptive water taking. Consumptive taking (indicated in green in Table 1) is considered the impoundment of water that would otherwise drain to the Pinewood River and excludes bypass pumping. Impoundment of water relates to the Water Management Pond, the Tailings Management Area and the Mine Rock Pond and not ponds related to fish habitat works.
The summer low flow in the Pinewood typically doesn’t drop below 150 L/s, equivalent to a maximum taking of 1,950 m3/ day taking at 15 %. In the event pumping authorization is given for consumptive use through this procedure that may cumulatively exceeds this volume, or exceeds the maximum consumptive take from the Pinewood River at any time, pumping limitations put in place by the site environmental team.
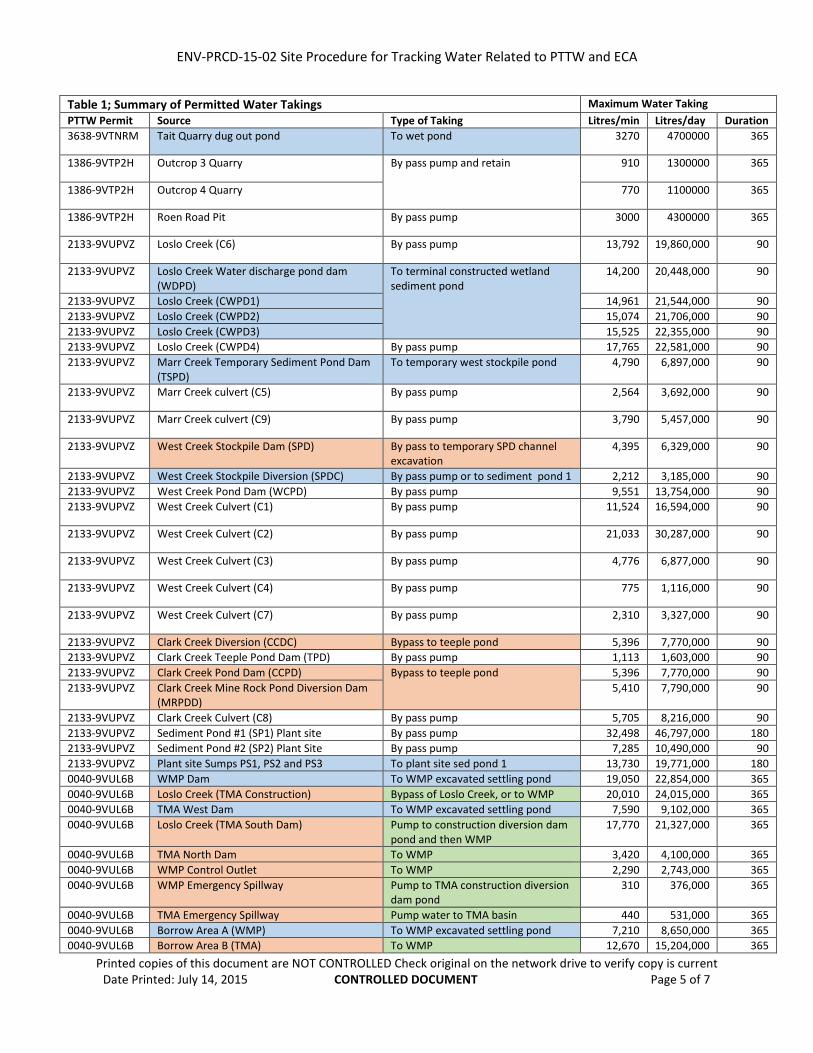
ENV-PRCD-15-02 Site Procedure for Tracking Water Related to PTTW and ECA
Printed copies of this document are NOT CONTROLLED Check original on the network drive to verify copy is current Date Printed: July 14, 2015 CONTROLLED DOCUMENT Page 5 of 7
Table 1; Summary of Permitted Water Takings Maximum Water Taking PTTW Permit Source Type of Taking Litres/min Litres/day Duration 3638-9VTNRM Tait Quarry dug out pond To wet pond 3270 4700000 365
1386-9VTP2H Outcrop 3 Quarry By pass pump and retain 910 1300000 365
1386-9VTP2H Outcrop 4 Quarry 770 1100000 365
1386-9VTP2H Roen Road Pit By pass pump 3000 4300000 365
2133-9VUPVZ Loslo Creek (C6) By pass pump 13,792 19,860,000 90
2133-9VUPVZ Loslo Creek Water discharge pond dam (WDPD)
To terminal constructed wetland sediment pond
14,200 20,448,000 90
2133-9VUPVZ Loslo Creek (CWPD1) 14,961 21,544,000 90 2133-9VUPVZ Loslo Creek (CWPD2) 15,074 21,706,000 90 2133-9VUPVZ Loslo Creek (CWPD3) 15,525 22,355,000 90 2133-9VUPVZ Loslo Creek (CWPD4) By pass pump 17,765 22,581,000 90 2133-9VUPVZ Marr Creek Temporary Sediment Pond Dam
(TSPD) To temporary west stockpile pond 4,790 6,897,000 90
2133-9VUPVZ Marr Creek culvert (C5) By pass pump 2,564 3,692,000 90
2133-9VUPVZ Marr Creek culvert (C9) By pass pump 3,790 5,457,000 90
2133-9VUPVZ West Creek Stockpile Dam (SPD) By pass to temporary SPD channel excavation
4,395 6,329,000 90
2133-9VUPVZ West Creek Stockpile Diversion (SPDC) By pass pump or to sediment pond 1 2,212 3,185,000 90 2133-9VUPVZ West Creek Pond Dam (WCPD) By pass pump 9,551 13,754,000 90 2133-9VUPVZ West Creek Culvert (C1) By pass pump 11,524 16,594,000 90
2133-9VUPVZ West Creek Culvert (C2) By pass pump 21,033 30,287,000 90
2133-9VUPVZ West Creek Culvert (C3) By pass pump 4,776 6,877,000 90
2133-9VUPVZ West Creek Culvert (C4) By pass pump 775 1,116,000 90
2133-9VUPVZ West Creek Culvert (C7) By pass pump 2,310 3,327,000 90
2133-9VUPVZ Clark Creek Diversion (CCDC) Bypass to teeple pond 5,396 7,770,000 90 2133-9VUPVZ Clark Creek Teeple Pond Dam (TPD) By pass pump 1,113 1,603,000 90 2133-9VUPVZ Clark Creek Pond Dam (CCPD) Bypass to teeple pond 5,396 7,770,000 90 2133-9VUPVZ Clark Creek Mine Rock Pond Diversion Dam
(MRPDD) 5,410 7,790,000 90
2133-9VUPVZ Clark Creek Culvert (C8) By pass pump 5,705 8,216,000 90 2133-9VUPVZ Sediment Pond #1 (SP1) Plant site By pass pump 32,498 46,797,000 180 2133-9VUPVZ Sediment Pond #2 (SP2) Plant Site By pass pump 7,285 10,490,000 90 2133-9VUPVZ Plant site Sumps PS1, PS2 and PS3 To plant site sed pond 1 13,730 19,771,000 180 0040-9VUL6B WMP Dam To WMP excavated settling pond 19,050 22,854,000 365 0040-9VUL6B Loslo Creek (TMA Construction) Bypass of Loslo Creek, or to WMP 20,010 24,015,000 365 0040-9VUL6B TMA West Dam To WMP excavated settling pond 7,590 9,102,000 365 0040-9VUL6B Loslo Creek (TMA South Dam) Pump to construction diversion dam
pond and then WMP 17,770 21,327,000 365
0040-9VUL6B TMA North Dam To WMP 3,420 4,100,000 365 0040-9VUL6B WMP Control Outlet To WMP 2,290 2,743,000 365 0040-9VUL6B WMP Emergency Spillway Pump to TMA construction diversion
dam pond 310 376,000 365
0040-9VUL6B TMA Emergency Spillway Pump water to TMA basin 440 531,000 365 0040-9VUL6B Borrow Area A (WMP) To WMP excavated settling pond 7,210 8,650,000 365 0040-9VUL6B Borrow Area B (TMA) To WMP 12,670 15,204,000 365
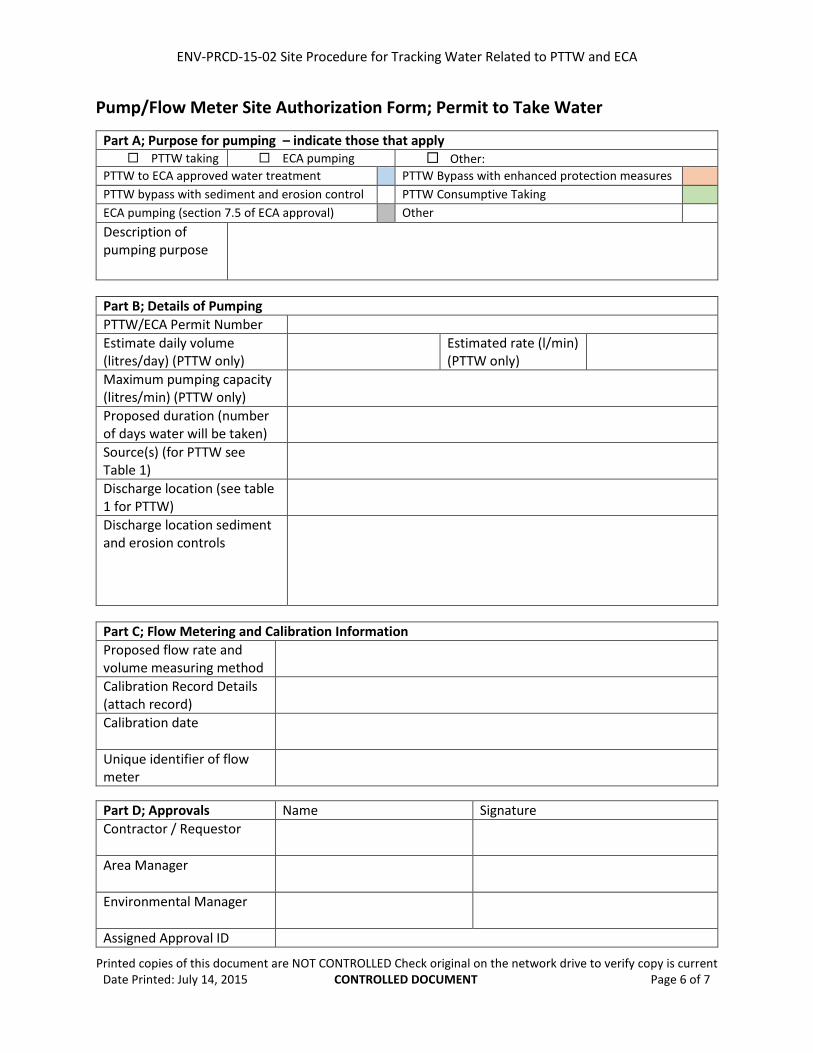
ENV-PRCD-15-02 Site Procedure for Tracking Water Related to PTTW and ECA
Printed copies of this document are NOT CONTROLLED Check original on the network drive to verify copy is current Date Printed: July 14, 2015 CONTROLLED DOCUMENT Page 6 of 7
Pump/Flow Meter Site Authorization Form; Permit to Take Water
Part A; Purpose for pumping – indicate those that apply PTTW taking ECA pumping Other:
PTTW to ECA approved water treatment PTTW Bypass with enhanced protection measures PTTW bypass with sediment and erosion control PTTW Consumptive Taking ECA pumping (section 7.5 of ECA approval) Other Description of pumping purpose
Part B; Details of Pumping PTTW/ECA Permit Number Estimate daily volume (litres/day) (PTTW only)
Estimated rate (l/min) (PTTW only)
Maximum pumping capacity (litres/min) (PTTW only)
Proposed duration (number of days water will be taken)
Source(s) (for PTTW see Table 1)
Discharge location (see table 1 for PTTW)
Discharge location sediment and erosion controls
Part C; Flow Metering and Calibration Information Proposed flow rate and volume measuring method
Calibration Record Details (attach record)
Calibration date
Unique identifier of flow meter
Part D; Approvals Name Signature Contractor / Requestor
Area Manager
Environmental Manager
Assigned Approval ID
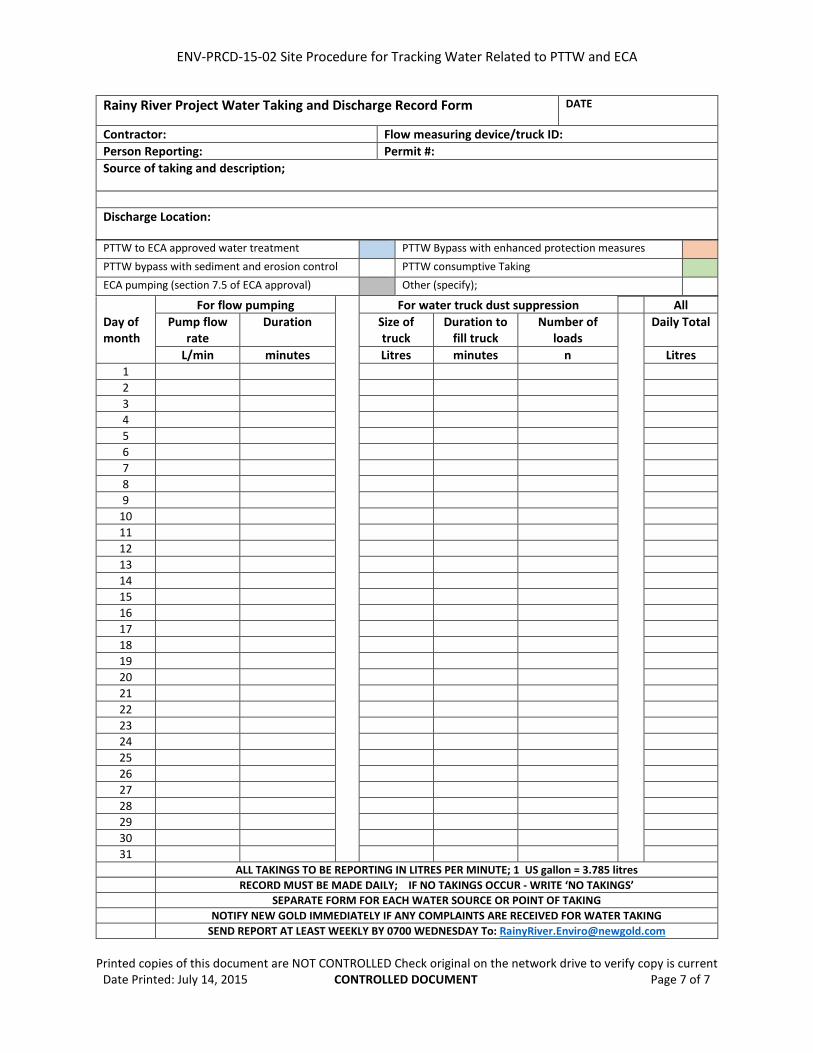
ENV-PRCD-15-02 Site Procedure for Tracking Water Related to PTTW and ECA
Printed copies of this document are NOT CONTROLLED Check original on the network drive to verify copy is current Date Printed: July 14, 2015 CONTROLLED DOCUMENT Page 7 of 7
Rainy River Project Water Taking and Discharge Record Form DATE
Contractor: Flow measuring device/truck ID: Person Reporting: Permit #: Source of taking and description; Discharge Location: PTTW to ECA approved water treatment PTTW Bypass with enhanced protection measures PTTW bypass with sediment and erosion control PTTW consumptive Taking ECA pumping (section 7.5 of ECA approval) Other (specify); For flow pumping For water truck dust suppression All Day of month
Pump flow rate
Duration
Size of truck
Duration to fill truck
Number of loads
Daily Total
L/min minutes Litres minutes n Litres 1 2 3 4 5 6 7 8 9
10 11 12 13 14 15 16 17 18 19 20 21 22 23 24 25 26 27 28 29 30 31
ALL TAKINGS TO BE REPORTING IN LITRES PER MINUTE; 1 US gallon = 3.785 litres RECORD MUST BE MADE DAILY; IF NO TAKINGS OCCUR - WRITE ‘NO TAKINGS’ SEPARATE FORM FOR EACH WATER SOURCE OR POINT OF TAKING NOTIFY NEW GOLD IMMEDIATELY IF ANY COMPLAINTS ARE RECEIVED FOR WATER TAKING SEND REPORT AT LEAST WEEKLY BY 0700 WEDNESDAY To: [email protected]
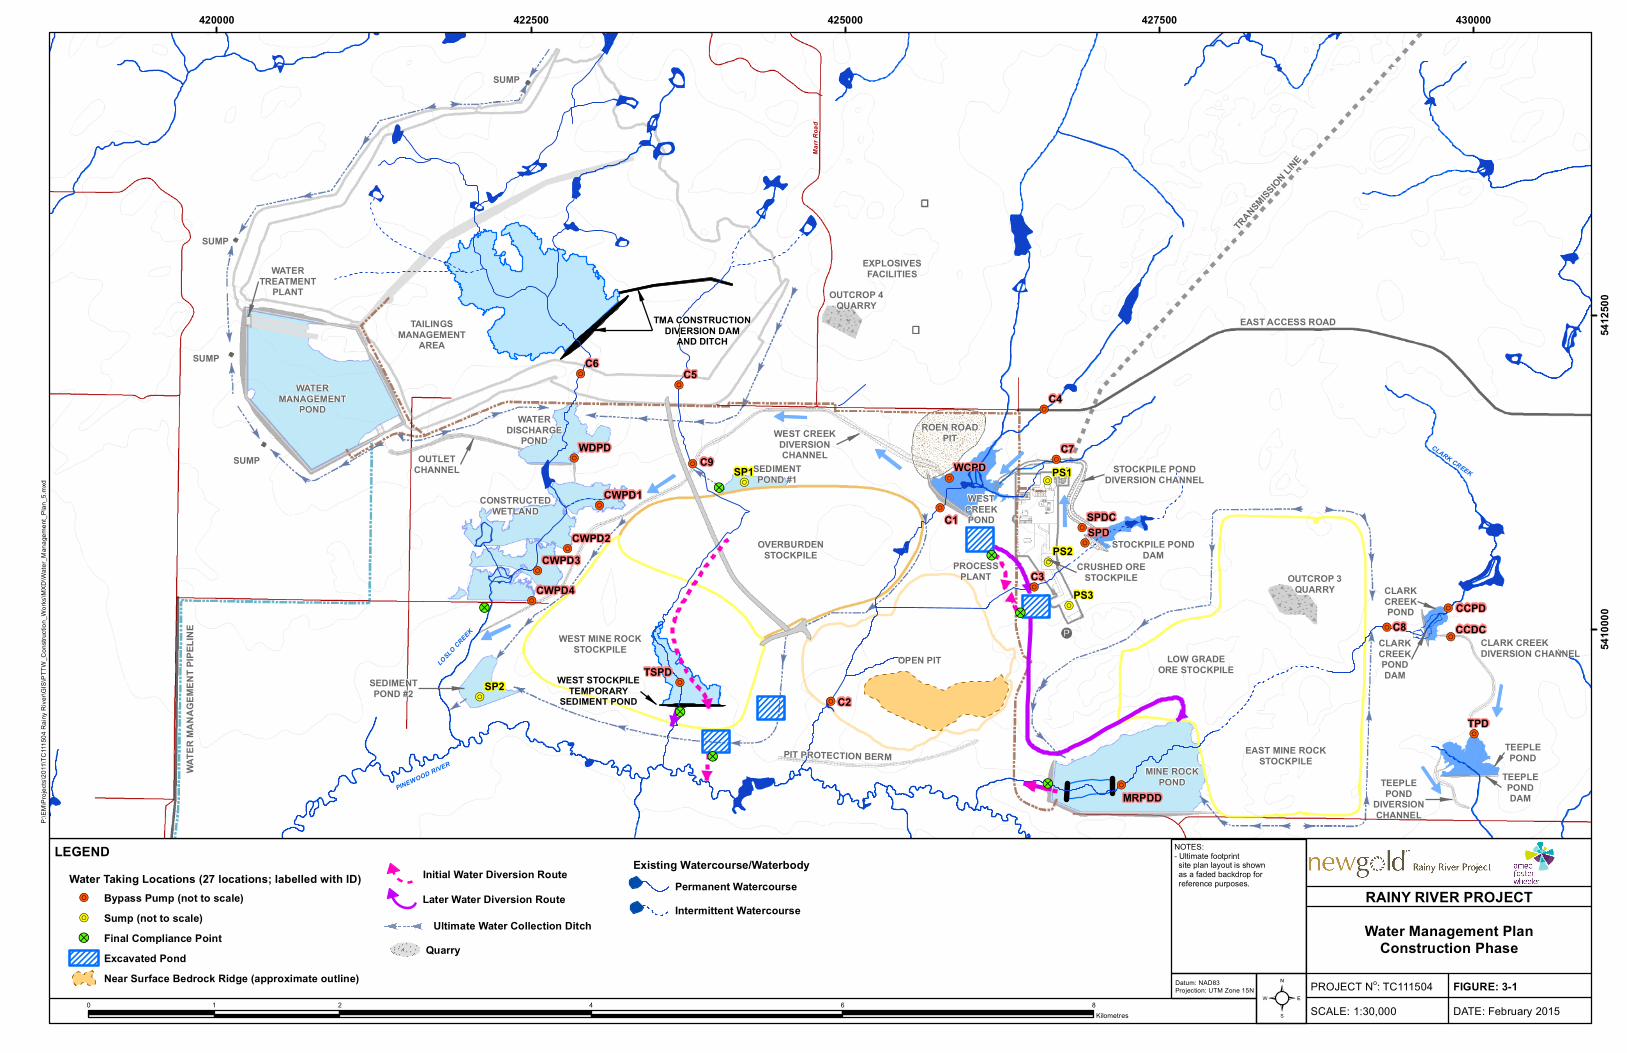
!>
!>
!>
!>
!>
!>
!>!R
!R
!R
!R
!R
!R
!R!R
!R
!R
!R
!R
!R
!R
!R
!R
!R!R
!R
!R
!R
!R
!R!R
!R
!R
!R
LOW GRADEORE STOCKPILE
EAST MINE ROCKSTOCKPILE
OPEN PITWEST MINE ROCK
STOCKPILE
OVERBURDENSTOCKPILE
STOCKPILE PONDDAM
PROCESSPLANT
WESTCREEKPOND
ROEN ROADPIT
SEDIMENTPOND #1
WATERDISCHARGE
POND
CONSTRUCTEDWETLAND
TAILINGSMANAGEMENT
AREA
WATERMANAGEMENT
POND
SUMP
SUMP
TRANSMISSION LIN
E
EAST ACCESS ROAD
WATE
R MA
NAGE
MENT
PIPE
LINE
"
CLARKCREEKPOND
"
CLARKCREEKPONDDAM
"WEST CREEKDIVERSIONCHANNEL
" CRUSHED ORESTOCKPILE
PINEWOOD RIVER
LOSLO CREEK
PINEWOOD RIVER
CLARK CREEK
EXPLOSIVESFACILITIES
"
OUTLETCHANNEL
Heath
wole
Road
Highway 600
TAIT CREEK
Marr
Road
Korpi Road
Gallin
ger R
oad
Teeple Road
MINE ROCKPOND
SUMP
SUMP
"SEDIMENTPOND #2
PIT PROTECTION BERM
CLARK CREEKDIVERSION CHANNEL
"
TEEPLEPOND
" TEEPLEPONDDAM"
TEEPLEPOND
DIVERSIONCHANNEL
"STOCKPILE POND
DIVERSION CHANNEL
"
WEST STOCKPILETEMPORARY
SEDIMENT POND
"
TMA CONSTRUCTIONDIVERSION DAM
AND DITCH"
OUTCROP 4QUARRY
OUTCROP 3QUARRY
"
WATERTREATMENT
PLANT
C9
C5C6
C2
C1
C4
C7
C3
SPD
TPD
WDPD
TSPD
WCPD
SPDC
CCDCCCPD
CWPD1
CWPD2CWPD3
CWPD4
MRPDD
C8
PS3
PS2
PS1
SP2
SP1
420000 422500 425000 427500 430000
5410
000
5412
500
²0 2 4 6 81Kilometres
RAINY RIVER PROJECT
FIGURE: 3-1DATE: February 2015
PROJECT No: TC111504SCALE: 1:30,000
Datum: NAD83Projection: UTM Zone 15N
NOTES:- Ultimate footprint site plan layout is shown as a faded backdrop for reference purposes.
Legend
P:\EM
\Proj
ects\
2011
\TC11
1504
Rain
y Rive
r\GIS
\PTT
W_C
onstr
uctio
n_Wo
rks\M
XD\W
ater_M
anag
emen
t_Plan
_5.m
xd
LEGENDInitial Water Diversion RouteLater Water Diversion Route
Ultimate Water Collection Ditch
Existing Watercourse/WaterbodyPermanent WatercourseIntermittent Watercourse
Water Management PlanConstruction Phase
Water Taking Locations (27 locations; labelled with ID)
!> Final Compliance PointExcavated PondNear Surface Bedrock Ridge (approximate outline)
!R Bypass Pump (not to scale)!R Sump (not to scale)
Quarry