appendix g-4 draft bouss-2d modeling report
TRANSCRIPT
APPENDIX G-4
DRAFT BOUSS-2D MODELING REPORT

This page intentionally left blank.

Sub-Appendix G-4 BOUSS-2D Modeling Report
Southern Palm Beach Island Comprehensive Shoreline Stabilization Project i June 2016 Final Environmental Impact Statement
SOUTHERN PALM BEACH ISLAND COMPREHENSIVE SHORELINE STABILIZATION PROJECT
BOUSS2D MODELING REPORT
TABLE OF CONTENTS
1.0 INTRODUCTION ................................................................................................... 1
2.0 BACKGROUND .................................................................................................... 2
3.0 SURFING IMPACT ANALYSIS ............................................................................ 7
3.1. BOUSS-2D Model Description ......................................................................... 7
3.2. Model setup and simulated scenarios ........................................................... 9
3.2.1. Model Grid .................................................................................................. 9
3.2.2. Bathymetry ............................................................................................... 10
3.2.3. Boundary Conditions .............................................................................. 13
3.2.4. Waves ....................................................................................................... 14
3.2.5. Model Parameters .................................................................................... 16
4.0 RESULTS ............................................................................................................ 17
4.1. Lake Worth Pier .............................................................................................. 17
4.1.1. Southeast Waves (Hs 6 feet, Tp 6.1 s from 105°) .................................. 17
4.1.2. Cold Front (Hs 7.4 feet, Tp 11 s from 65°) .............................................. 22
4.1.3. Hurricane Pre-Landfall (Hs 8.1 feet, Tp 13.5 s from 103°) .................... 27
4.2. Lantana Park ................................................................................................... 31
4.2.1. Southeast Waves (Hs 6 feet, Tp 6.1 s from 105°) .................................. 31
4.2.2. Cold Front (Hs 7.4 feet, Tp 11 s from 65°) .............................................. 36
4.2.3. Hurricane Pre-Landfall (Hs 8.1 feet, Tp 13.5 s from 103°) .................... 40
5.0 SUMMARY AND CONCLUSIONS ...................................................................... 45
6.0 LITERATURE CITED .......................................................................................... 47

Sub-Appendix G-4 BOUSS-2D Modeling Report
Southern Palm Beach Island Comprehensive Shoreline Stabilization Project ii June 2016 Final Environmental Impact Statement
LIST OF FIGURES
Figure No.
2-1 Wave breaking type. . ........................................................................................... 4
2-2 Peel angle terminology. ........................................................................................ 5
2-3 Classification of surfing skill rated against peel angle and wave height. . ............. 7
3-1 Bouss2D grid (red box – left) and zoom at areas of interest – Pier (right top) and
Lantana (right bottom). ....................................................................................... 11
3-2 Existing bathymetry (left) and differences between alternatives and existing
condition. . .......................................................................................................... 12
3-3 BOUSS-2D boundaries - wavemaker (green), sea sponge layer (blue) land
sponge layer (orange) ........................................................................................ 14
4-1 Significant wave height for existing condition and differences between each
alternative and the existing condition for southeast waves at Lake Worth Pier. . 18
4-2 Water surface elevation at Lake Worth Pier for southeast waves....................... 20
4-3 Peel angle (α), peel rate (Vp), wave velocity (Vw) and surfer velocity (Vs)
identification for southeast waves at the Pier. .................................................... 21
4-4 Significant wave height for existing condition and differences between each
alternative and the existing condition for cold front scenario at Pier. .................. 24
4-5 Water surface elevation at Pier for cold front. ..................................................... 25
4-6 Peel angle (α), peel rate (Vp), wave velocity (Vw) and surfer velocity (Vs)
identification for cold front at Pier. ...................................................................... 26
4-7 Significant wave height forexisting condition and differences between each
alternative and the existing condition for pre-hurricane at Pier. .......................... 28
4-8 Water surface elevation at Pier for hurricane pre-landfall. .................................. 29
4-9 Peel angle (α), peel rate (Vp), wave velocity (Vw) and surfer velocity (Vs)
identification for hurricane pre-landfall at the Pier. .............................................. 30
4-10 Significant wave height for existing condition and differences between each
alternative and the existing condition for southeast waves at Lantana Park. ...... 33
4-11 Water surface elevation at Lantana Park for southeast waves. .......................... 34
4-12 Peel angle (α), peel rate (Vp), wave velocity (Vw) and surfer velocity (Vs)
identification for southeast waves at Lantana. .................................................... 35

Sub-Appendix G-4 BOUSS-2D Modeling Report
Southern Palm Beach Island Comprehensive Shoreline Stabilization Project iii June 2016 Final Environmental Impact Statement
4-13 Significant wave height for existing condition and differences between each
alternative and the existing condition for cold front scenario at Lantana. ........... 37
4-14 Water surface elevation at Lantana for cold front. .............................................. 38
4-15 Peel angle (α), peel rate (Vp), wave velocity (Vw) and surfer velocity (Vs)
identification for cold front at Lantana. ................................................................ 39
4-16 Significant wave height for existing condition and differences between each
alternative and the existing condition for pre-hurricane at Lantana Park. ........... 42
4-17 Water surface elevation at Lantana for Hurricane Pre-Landfall. ......................... 43
4-18 Peel angle (α), peel rate (Vp), wave velocity (Vw) and surfer velocity (Vs)
identification for hurricane pre-landfall at Lantana. ............................................. 44
LIST OF TABLES
Table No.
2-1 Rating of the skill of surfers. Ratings are independent of surf break quality or the
degree of difficulty of waves.. ............................................................................... 6
3-1 Bouss2D simulated scenarios. ........................................................................... 16
4-1 Comparison of existing conditions and alternatives for southeast waves at the
Pier. .................................................................................................................... 22
4-2 Comparison of existing and alternatives conditions for cold front at Pier. ........... 23
4-3 Comparison of existing and alternatives conditions for hurricane pre-landfall at
Pier. .................................................................................................................... 31
4-4 Comparison of existing conditions and alternatives for southeast waves at
Lantana. ............................................................................................................. 32
4-5 Comparison of existing and alternatives conditions for cold front at Lantana. .... 40
4-6 Comparison of existing and alternatives conditions for hurricane pre-landfall at
Lantana. ............................................................................................................. 41

Sub-Appendix G-4 BOUSS-2D Modeling Report
Southern Palm Beach Island Comprehensive Shoreline Stabilization Project 1 June 2016 Final Environmental Impact Statement
1.0 INTRODUCTION
Under direction of the U.S. Army Corps of Engineers (USACE), CB&I Coastal Planning
& Engineering, Inc. (CB&I) assisted in the development of the Southern Palm Beach
Island Comprehensive Shoreline Stabilization Project Environmental Impact Statement
(EIS). The initial tasks associated with the effort included public scoping and agency
coordination to determine what data was necessary to develop the EIS. After review of
the data and previous work, the USACE has determined that numerical modeling of
breaking waves is required to obtain necessary data that is not currently available.
Concern regarding potential impacts to surfing has previously been expressed in public
scoping for projects within the Project Area. In order to evaluate project-related effects
on surfing, the BOUSS-2D model was used in this study to simulate waves within the
Project Area. BOUSS-2D model was developed by the U.S. Army Corps of Engineers
(Nwogu and Demirbilek, 2001) and utilized through the Surface Water Modeling System
(SMS) interface (Aquaveo, 2008).
To assess the potential impacts on surfability within the Study Area, a modeling
approach was adopted. First, a morphological model (Delft3D) was run to develop the
anticipated bathymetry from the coastline response to the alternatives. The bathymetry
resulting from the alternatives along with the existing bathymetry were incorporated into
the BOUSS-2D model to evaluate the impacts to surfability within the Project Area. In
particular, the surfability was evaluated at two popular southern Palm Beach surf spots,
Lantana Park and the Lake Worth Pier.
The alternatives that were considered in the analysis included:
Alternative 1 – No Action Alternative (Status Quo) and referenced herein as the
existing conditions.
Alternative 2 – Applicants’ Preferred Project (Proposed Action): Beach and Dune
Fill with Shoreline Protection Structures Project
Sub-Appendix G-4 BOUSS-2D Modeling Report
Southern Palm Beach Island Comprehensive Shoreline Stabilization Project 2 June 2016 Final Environmental Impact Statement
Alternative 6 – The Town of Palm Beach Increased Sand Volume Project and
County Increased Sand Volume without Shoreline Protection Structures Project
Alternative 7a – Plan was presented by The Coalition to Save Our Shoreline, Inc.
(SOS) consisting of beach fill and dune restoration between R-129-210 and R-
134+135 with shoreline protection structures. The sand fill volumes required for
the SOS plan are greater than the volumes for Alternative 6 over the same
shoreline extents. For the purpose of modeling, Alternative 7a was defined as the
SOS plan north of R-134+135 and Alternative 2 to the south.
The remainder of the alternatives (Alternatives 3, 4, and 5) did not need to be included
in the analysis. They consisted of various combinations of the sand fill volumes and
shoreline protection structures comprising Alternatives 2 and 6. Of Alternatives 2
through 6, Alternative 2 required the smallest fill volumes and Alternative 6 required the
greatest.
2.0 BACKGROUND
According to Benedet et al. (2007), you can find surfers just about anywhere there is a
large body of water with sufficient fetch to allow the generation of surfable waves.
Surfing is practiced in the Pacific Nations, North America, South America, Central
America, Europe and Asia. Surfing destinations range from Hawaii, Australia and Costa
Rica to Ireland, Alaska, Dubai, and even at the North American Great Lakes and the
Amazon River tidal bore. Surfing is currently the most popular sport in Australia, the
second most popular sport in Brazil, and one of the most popular extreme sports in
North America.
The population of surfers around the world has social and economic benefits. Recently,
a number of studies are been conducted in terms of impacts of engineering works,
creation of surf spots and relation between wave conditions and surfability (e.g. Black,
2001; Black and Mead, 2001; Hutt et al. 2001; Scarfe et al., 2003 Benedet et al., 2007).

Sub-Appendix G-4 BOUSS-2D Modeling Report
Southern Palm Beach Island Comprehensive Shoreline Stabilization Project 3 June 2016 Final Environmental Impact Statement
Surfers are traditionally defensive about any activity in the vicinity of their favorite
surfing breaks. This behavior may be justified because history shows that their rights
have at times been ignored and many surfing breaks have been impacted by coastal
modification (Scarfe et al., 2003). Interestingly, some of the most popular surf spots on
the east coast of Florida occur near these coastal modifications. For example, the New
Smyrna Beach on the south side of Ponce Inlet, the north side of Sebastian Inlet, the
north side of Ft. Pierce Inlet, Reef Road south of Palm Beach Inlet, and the south side
of the Lake Worth Pier. In this way, the analysis of surfability has become an important
issue where an engineering intervention is need.
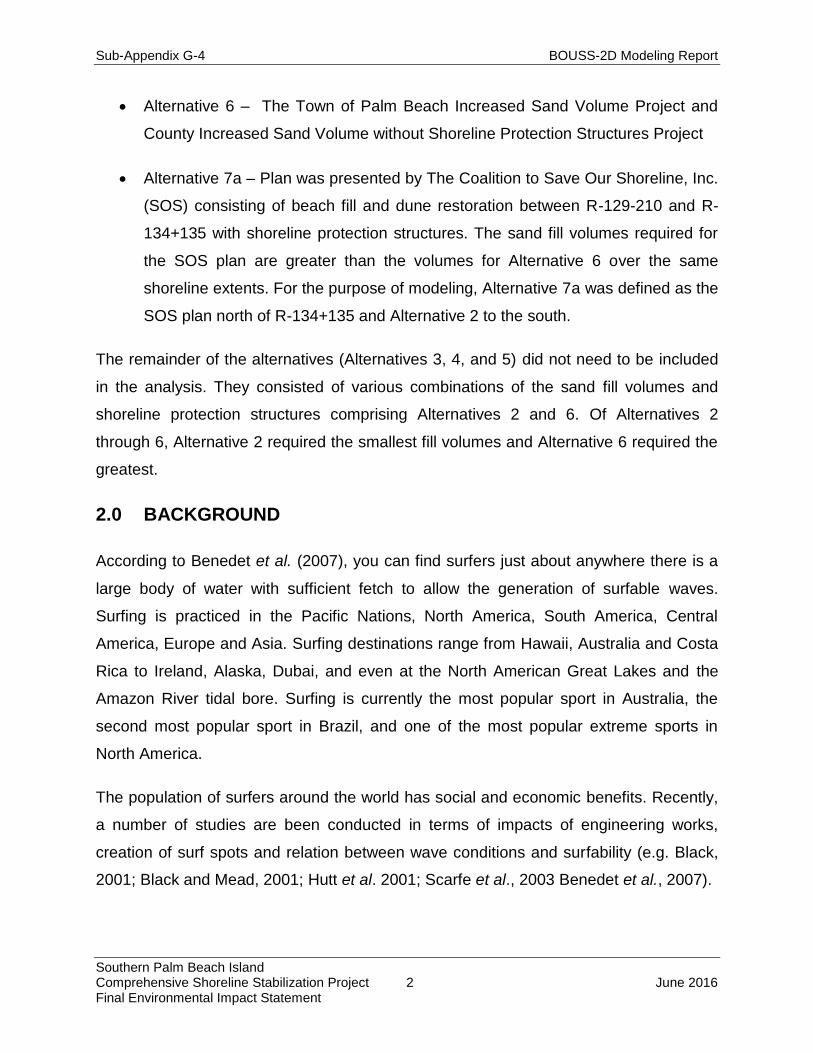
The most important parameters to analyze surfability are the breaker type, peel angle,
peel rate, wave velocity and surfer velocity. Battjes (1974) describes the breaker type as
function of Iribarren number:
𝜉𝑏 =𝑡𝑎𝑛 𝛼
√𝐻𝑏𝐿0
⁄
where: 𝑡𝑎𝑛 𝛼 is the beach slope, 𝐻𝑏 is the significant wave height at break, 𝐿0 is the
deep water wavelength (~1.56*T2). According to the author:
Collapsing if 𝜉𝑏>2.0
Plunging if 0.4< 𝜉𝑏<2.0
Spilling if 𝜉𝑏< 0.4
Figure 2-1 presents examples of the wave breaker type.
Sub-Appendix G-4 BOUSS-2D Modeling Report
Southern Palm Beach Island Comprehensive Shoreline Stabilization Project 4 June 2016 Final Environmental Impact Statement
Figure 2-1. Wave breaking type (Benedet, 2007).
Sub-Appendix G-4 BOUSS-2D Modeling Report
Southern Palm Beach Island Comprehensive Shoreline Stabilization Project 5 June 2016 Final Environmental Impact Statement
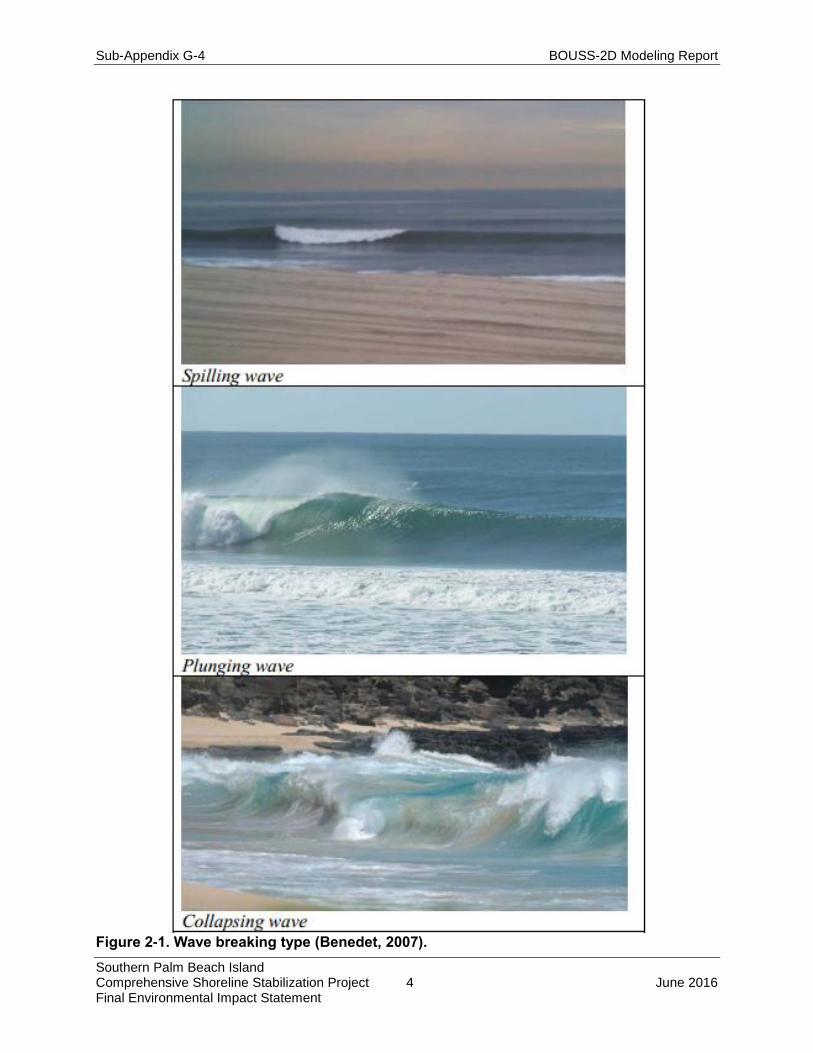
In addition to the way wave breaks, it is important to understand the angle the wave
breaks related to its crest. If this angle is to sharp, the wave will “close-out”. For optimal
surfing conditions the wave has to break gradually along the wave crest. Figure 2-2
presents the peel angle, which is defined as the angle enclosed by the wave crest and
the breaker lines (Dafferner and Klein, 2009; Walker, 1974). Knowing the peel angle
and the wave velocity (in shallow water = √gh ) it is possible to calculate the peel rate
and surfer velocity.
Figure 2-2. Peel angle terminology (Dafferner and Klein, 2009).
Hunt et al. 2001 rated the skill of surfers with respect to peel angle and wave height.
Table 2-1 presents the rating matrix, while Figure 2-3 presents Hunt’s classification in
graphical form. The larger peel angle and smaller the wave height, the easier the wave
is to be ridden. Conversely, the smaller the peel angle and larger the wave height, the
more difficult the wave becomes to ride.

Sub-Appendix G-4 BOUSS-2D Modeling Report
Southern Palm Beach Island Comprehensive Shoreline Stabilization Project 6 June 2016 Final Environmental Impact Statement
Table 2-1. Rating of the skill of surfers. Ratings are independent of surf break quality or the degree of difficulty of waves (Hunt et al., 2001).
Rating Description of Rating Peel
Angle Limit (°)
Min/Max Wave Height
(m)
Min/Max Wave Height
(ft)
1 Beginner surfers not yet able to ride the face of wave and simply moves
forward as wave advances 90 0.70/1.00 2.3/3.3
2 Learner surfers able to successfully
ride laterally along the crest of a wave 70 0.65/1.50 2.1/4.9
3 Surfers that have developed the skill to generate speed by “pumping” on
the face of the wave 60 0.60/2.5 2/8.2
4 Surfers beginning to initiate and
execute standard surfing maneuvers on occasion
55 0.55/4.0 1.8/13.1
5 Surfers able to execute standard
surfing manoeuvres consecutively on a single wave
50 0.50/>4.0 1.6/>13.1
6
Surfers able to execute standard surfing manoeuvres consecutively. Executes advanced maneuvers on
occasion
40 0.45/>4.0 1.5/>13.1
7 Top amateur surfers able to
consecutively execute advanced maneuvers
29 0.40/>4.0 1.3/>13.1
8 Professional surfers able to
consecutively execute advanced maneuvers
27 0.35/>4.0 1.1/>13.1
9 Top 44 professional surfers able to consecutively execute advanced
maneuvers Not reach 0.30/>4.0 1/>13.1
10 Surfers in the future Not reach 0.30/>4.0 1/>13.1

Sub-Appendix G-4 BOUSS-2D Modeling Report
Southern Palm Beach Island Comprehensive Shoreline Stabilization Project 7 June 2016 Final Environmental Impact Statement
Figure 2-3. Classification of surfing skill rated against peel angle and wave height. (Hunt et al., 2001).
3.0 SURFING IMPACT ANALYSIS
3.1. BOUSS-2D Model Description
BOUSS-2D is a numerical model for simulating the propagation and transformation of
waves in coastal regions and harbors based on a time-domain solution of Boussinesq-
type equations (Nwogu and Demirbilek, 2001). The governing equations are uniformly
valid from deep to shallow water and can simulate most of the phenomena of interest in
the nearshore zone and harbor basins including shoaling/refraction over variable
topography, reflection/diffraction near structures, energy dissipation due to wave
breaking and bottom friction, cross-spectral energy transfer due to nonlinear wave-wave
interactions, breaking-induced longshore and rip currents, wave-current interaction and
wave interaction with porous structures.
The governing equations in BOUSS-2D are solved in a time domain with a finite-
difference method where the water-surface elevation and horizontal velocities are
calculated at the grid nodes in a staggered manner. The area of interest is discretized
as a rectangular grid. Time-histories of the velocities and fluxes corresponding to
incident storm conditions are specified along wave generation boundaries of the grid.
The input wave conditions may be periodic (regular) or non-periodic (irregular).
Unidirectional or multidirectional sea states can be simulated. Waves propagating out of
the computational domain are either absorbed in damping layers placed around the
perimeter of the domain or allowed to leave the domain freely. Damping and porosity

Sub-Appendix G-4 BOUSS-2D Modeling Report
Southern Palm Beach Island Comprehensive Shoreline Stabilization Project 8 June 2016 Final Environmental Impact Statement
layers are used to simulate the reflection and transmission characteristics of jetties,
breakwaters, and other structures existing in the modeling domain (Demirbilek et al.,
2005). Details about BOUSS-2D model are provided in the model theory and examples
report (Nwogu and Demirbilek, 2001).
The classical form of the Boussinesq equations for wave propagation over water of
variable depth was derived by Peregrine (1967). The equations were restricted to
relatively shallow water depths, i.e., the water depth, h, had to be less than one-fifth of
the wavelength, L, in order to keep errors in the phase velocity to less than 5%. Nwogu
(1993) extended the range of applicability of Boussinesq-type equations to deeper water
by recasting the equations in terms of the velocity at an arbitrary distance, z, from the
still-water elevation, instead of the depth-averaged velocity. The distance from the still-
water elevation of the velocity variable becomes a free parameter, which is chosen to
optimize the linear dispersion characteristics of the equations.
The optimized form of the equations results in an error of less than 2% for the phase
velocity from shallow-water depths up to the deepwater limit (h/L= 0.5). Despite the
improvement in the frequency dispersion characteristics, Nwogu’s (1993) equations are
based on the assumption that the wave heights were much smaller than the water
depth. This limits the ability of the equations to describe highly nonlinear waves in
shallow water, which led Wei et al. (1995) to derive a fully nonlinear form of the
equations. The fully nonlinear equations are particularly useful for simulating highly
asymmetric waves in shallow water, wave-induced currents, wave setup close to the
shoreline, and wave-current interaction. As ocean waves approach the shoreline, they
steepen and ultimately break.
The turbulence and currents generated by breaking waves are important driving
mechanisms for the transport of sediments and pollutants. Nwogu (1996) extended the
fully nonlinear form of the Boussinesq equations to the surf zone, by coupling the mass
and momentum equations with a one-equation model for the temporal and spatial
evolution of the turbulent kinetic energy produced by wave breaking. The equations

Sub-Appendix G-4 BOUSS-2D Modeling Report
Southern Palm Beach Island Comprehensive Shoreline Stabilization Project 9 June 2016 Final Environmental Impact Statement
have since been modified to include the effects of bottom friction and flow through
porous structures (Nwogu and Demirbilek, 2001).
The modified equations can simulate most of the hydrodynamic phenomena of interest
in coastal regions and harbor basins including:
Shoaling
Refraction
Diffraction
Full/partial reflection and transmission
Bottom friction
Nonlinear wave-wave interactions
Wave breaking and runup
Wave-induced currents
Wave-current interaction
The BOUSS-2D was used to analyze the potential impacts to surfability due to the
alternatives as compared to the existing conditions. Surfability was assessed in terms of
peel angle, peel rate, wave velocity, and the velocity of the surfer.
3.2. Model setup and simulated scenarios
3.2.1. Model Grid
The potential impacts of the alternatives were analyzed at two important southern Palm
Beach surf spots, Lantana Park (hereafter called “Lantana”) and Lake Worth Pier
(hereafter called “Pier”). A grid with 4 meter resolution was developed as shown by the
red box in Figure 3-1. The grid is 1732 meter (X direction) x 5720 meter (Y direction)
with a total of 433 x 1730 grid cells.

Sub-Appendix G-4 BOUSS-2D Modeling Report
Southern Palm Beach Island Comprehensive Shoreline Stabilization Project 10 June 2016 Final Environmental Impact Statement
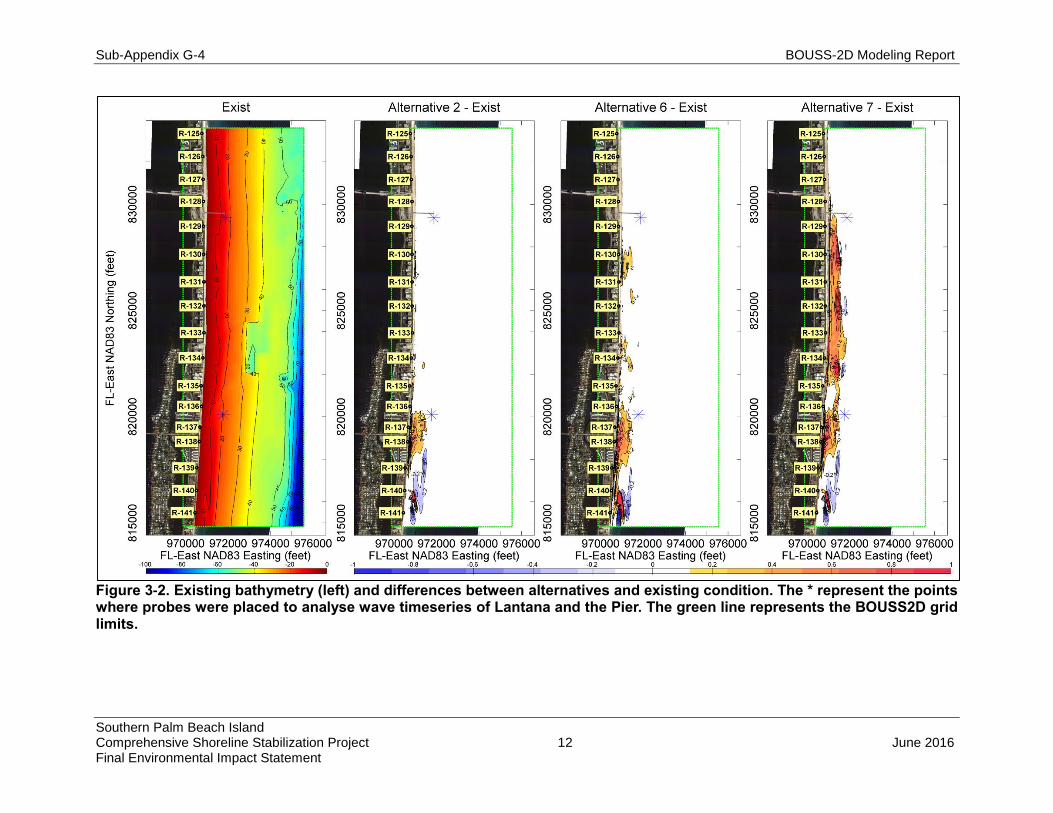
3.2.2. Bathymetry
Bathymetries for the BOUSS-2D model were developed to represent the beach
conditions after the coastal system’s natural processes had responded to construction
of the alternatives to achieve equilibrium. The temporal evolution of the bathymetries
after equilibration was simulated by running the Delft3D morphological model for 3
years after construction for each alternative. The relative changes (greater than 0.2 feet)
are shown by the three graphics on the right in Figure 3-2. The relative changes
represent the differences between each bathymetry alternative and the existing
condition bathymetry (left graphic in Figure 3-2). Within the area of interest at the Pier,
Alternatives 2 and 6 did not show differences greater than 0.2 feet, while Alternative 7a
showed sedimentation between 2 and 4 feet extending offshore from the shoreline
approximately half the length of the Pier. Within the area of interest at Lantana, the
differences were more evident for all of the alternatives considered with sedimentation
up to 1 foot within the surf zone.

Sub-Appendix G-4 BOUSS-2D Modeling Report
Southern Palm Beach Island Comprehensive Shoreline Stabilization Project 11 June 2016 Final Environmental Impact Statement
Figure 3-1. Bouss2D grid (red box – left) and zoom at areas of interest – Pier (right top) and Lantana (right bottom).
Sub-Appendix G-4 BOUSS-2D Modeling Report
Southern Palm Beach Island Comprehensive Shoreline Stabilization Project 12 June 2016 Final Environmental Impact Statement
Figure 3-2. Existing bathymetry (left) and differences between alternatives and existing condition. The * represent the points where probes were placed to analyse wave timeseries of Lantana and the Pier. The green line represents the BOUSS2D grid limits.

Sub-Appendix G-4 BOUSS-2D Modeling Report
Southern Palm Beach Island Comprehensive Shoreline Stabilization Project 13 June 2016 Final Environmental Impact Statement
3.2.3. Boundary Conditions
According to Nwogu and Demirbilek (2001), to solve the governing equations,
appropriate boundary conditions have to be imposed at the boundaries of the
computational domain. This requires specification of waves propagating into the domain
and the absorption of waves propagating out of the domain. The equations have also
been modified to simulate wave interaction with fully/partially reflecting structures within
the computational domain. The types of boundaries considered in BOUSS-2D include:
Fully reflecting or solid wall boundaries
External wave generation boundaries
Internal wave generation boundaries
Wave absorption or damping regions
Porous structures
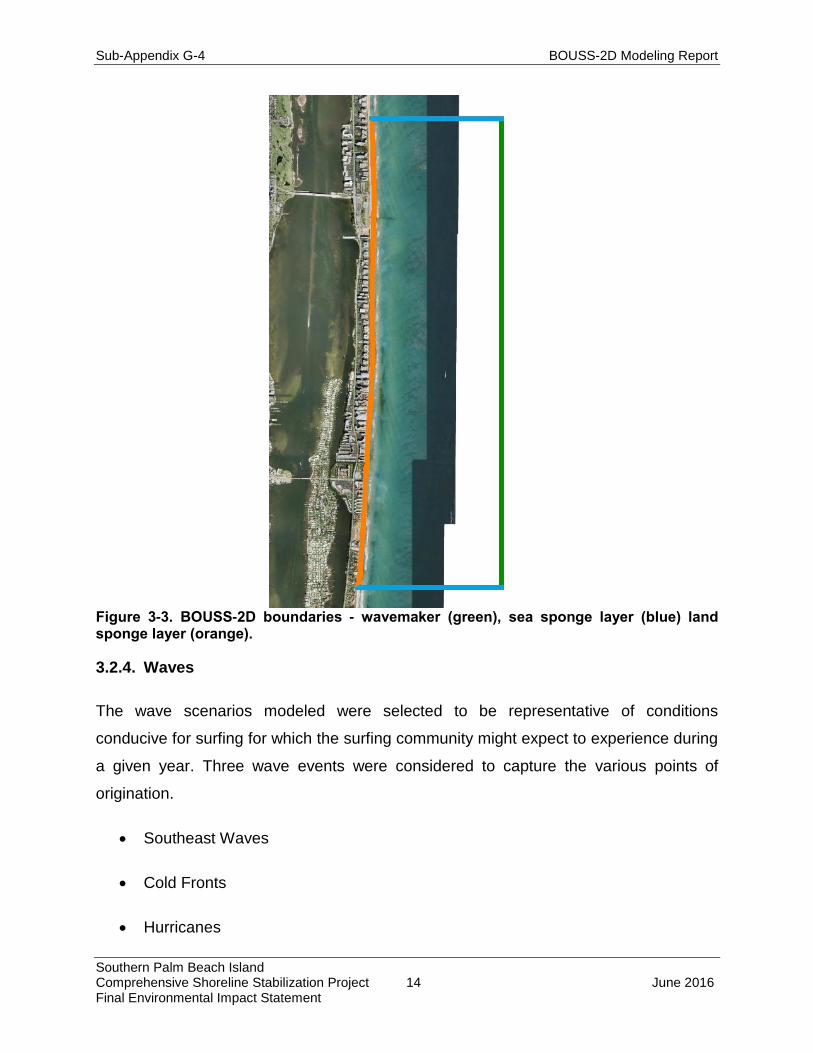
For the present study, two types of boundary conditions were defined: wave makers and
sponge/damp layers (Figure 3-3). According to Nwogu and Demirbilek (2001), waves
propagating out of the computational domain should be absorbed in damping regions
placed around the perimeter of the computational domain.
The “sponge layers” were set by adjusting the width and reflection coefficient values
(Table 3-1). At the north and south boundaries, the layers were defined to minimize
reflection (approximately 2.5%) in order to absorb wave energy exiting the grid (Goda,
1985). At the landward boundary, the layer was set to simulate the reflection of the
incident wave energy (approximately 20%) as waves interact within the coastline (Goda,
1985).
Sub-Appendix G-4 BOUSS-2D Modeling Report
Southern Palm Beach Island Comprehensive Shoreline Stabilization Project 14 June 2016 Final Environmental Impact Statement
Figure 3-3. BOUSS-2D boundaries - wavemaker (green), sea sponge layer (blue) land sponge layer (orange).
3.2.4. Waves
The wave scenarios modeled were selected to be representative of conditions
conducive for surfing for which the surfing community might expect to experience during
a given year. Three wave events were considered to capture the various points of
origination.
Southeast Waves
Cold Fronts
Hurricanes

Sub-Appendix G-4 BOUSS-2D Modeling Report
Southern Palm Beach Island Comprehensive Shoreline Stabilization Project 15 June 2016 Final Environmental Impact Statement
Southeast waves were assumed to represent the typical surfing conditions experienced
within the modeling domain. These conditions are characterized as closely spaced,
short period waves that provide a minimal ride for surfing. Wave data used in the model
to represent the southeast wave event was obtained from CPE-ADCP measurements
collected at the Pier between 02/10/2008 to 04/21/2008 (CPE, 2009) The event had a
significant wave height (Hs) of 6 feet, period (Tp) of 6.1 seconds, and direction (Dp) of
105°.
Cold fronts, commonly as known as Nor’easters, frequently occur during winter months
(October to April) as low pressure systems move offshore of North Carolina and New
England. These systems can produce large waves originating from the northeast that
propagate south impacting the Study Area. The wave events experienced at the Study
Area typically results in longer period swells accompanied by short period wind waves.
Depending upon the wind direction and severity of the wind waves, the wave event can
provide a relatively long ride as compared to southeast wave events. Wave data used in
the model to represent the cold front wave event was obtained from CPE-ADCP
measurements collected at the Pier between 02/10/2008 to 04/21/2008 (CPE, 2009).
The event had a significant wave height (Hs) of 7.4 feet, period (Tp) of 11 seconds, and
direction (Dp) of 64.5°.
Hurricanes generally occur during the summer months (June to November). Depending
on the storm track in relation to the Study Area, the systems can produce swells form
any direction radiating outward from its center. The wave events experienced can result
in long period, high energy swells immediately preceding and/or following the passage
of the storm. These ground swells can produce the longest rides experienced within the
Study Area. Wave data obtained approximately 12 miles offshore of the Study Area at
USACE WIS station ST 63461 over a 30 year period was reviewed (Hubertz, 1992).
The highest significant wave height within the record was associated with Hurricane
Frances occurring in September 2004. When considering the wind (direction and speed)
and swell (direction, height, and period), the best surf conditions were assumed to occur
approximately 12 hours prior to landfall of the storm. The conditions characterizing this
event were simulated in Delft3D-WAVES in order to determine the wave parameters at
Sub-Appendix G-4 BOUSS-2D Modeling Report
Southern Palm Beach Island Comprehensive Shoreline Stabilization Project 16 June 2016 Final Environmental Impact Statement
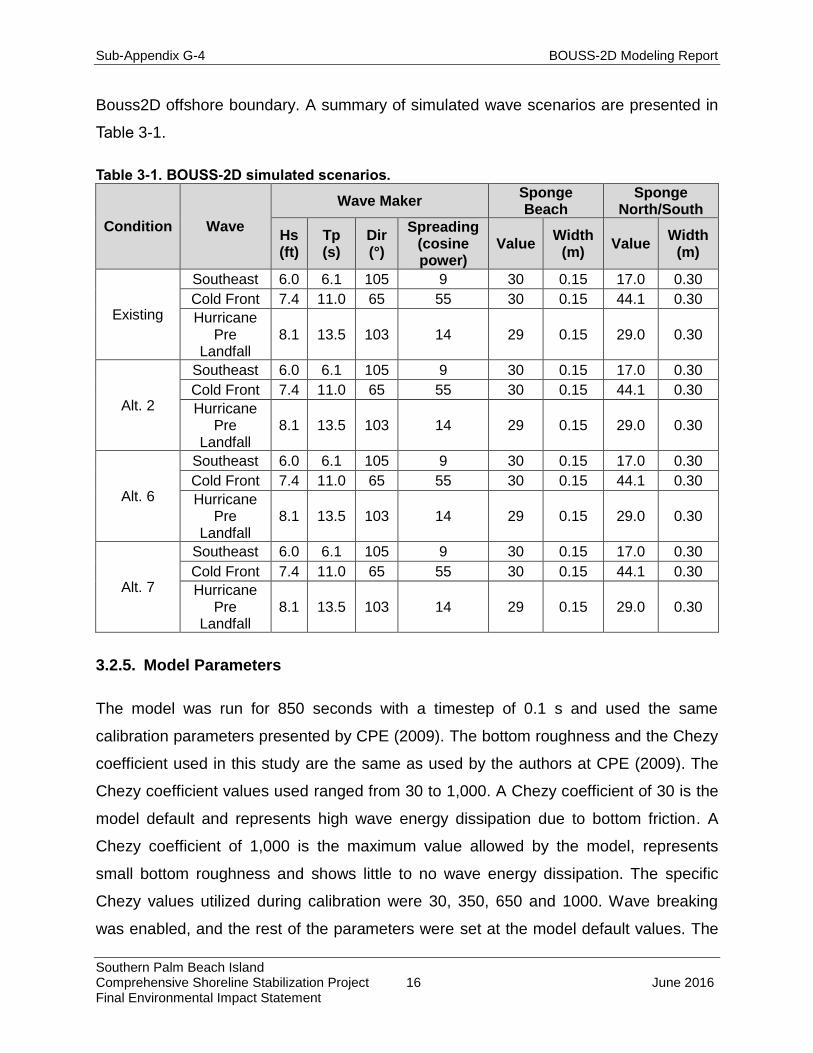
Bouss2D offshore boundary. A summary of simulated wave scenarios are presented in
Table 3-1.
Table 3-1. BOUSS-2D simulated scenarios.
Condition Wave
Wave Maker Sponge Beach
Sponge North/South
Hs (ft)
Tp (s)
Dir (°)
Spreading (cosine power)
Value Width
(m) Value
Width (m)
Existing
Southeast 6.0 6.1 105 9 30 0.15 17.0 0.30
Cold Front 7.4 11.0 65 55 30 0.15 44.1 0.30
Hurricane Pre
Landfall 8.1 13.5 103 14 29 0.15 29.0 0.30
Alt. 2
Southeast 6.0 6.1 105 9 30 0.15 17.0 0.30
Cold Front 7.4 11.0 65 55 30 0.15 44.1 0.30
Hurricane Pre
Landfall 8.1 13.5 103 14 29 0.15 29.0 0.30
Alt. 6
Southeast 6.0 6.1 105 9 30 0.15 17.0 0.30
Cold Front 7.4 11.0 65 55 30 0.15 44.1 0.30
Hurricane Pre
Landfall 8.1 13.5 103 14 29 0.15 29.0 0.30
Alt. 7
Southeast 6.0 6.1 105 9 30 0.15 17.0 0.30
Cold Front 7.4 11.0 65 55 30 0.15 44.1 0.30
Hurricane Pre
Landfall 8.1 13.5 103 14 29 0.15 29.0 0.30
3.2.5. Model Parameters
The model was run for 850 seconds with a timestep of 0.1 s and used the same
calibration parameters presented by CPE (2009). The bottom roughness and the Chezy
coefficient used in this study are the same as used by the authors at CPE (2009). The
Chezy coefficient values used ranged from 30 to 1,000. A Chezy coefficient of 30 is the
model default and represents high wave energy dissipation due to bottom friction. A
Chezy coefficient of 1,000 is the maximum value allowed by the model, represents
small bottom roughness and shows little to no wave energy dissipation. The specific
Chezy values utilized during calibration were 30, 350, 650 and 1000. Wave breaking
was enabled, and the rest of the parameters were set at the model default values. The

Sub-Appendix G-4 BOUSS-2D Modeling Report
Southern Palm Beach Island Comprehensive Shoreline Stabilization Project 17 June 2016 Final Environmental Impact Statement
authors found that the best value for Chezy coefficient is 1,000. According to Nwogu
and Demirbilek (2001), the Smagorinsky number should be kept between 0 and 0.5,
with a default value of 0. CPE (2009) found the best value of 0 and this value was used
in this study.
4.0 RESULTS
The results of the potential impacts to surfing are divided in two main sections, one
section for each surf spot: Lake Worth Pier and Lantana Park. Within each main
section, results for the three wave events (southeast waves, cold front and hurricanes)
were included. For each wave event, the significant wave height and wave direction for
existing condition were presented followed by the percentage difference of Hs between
each alternative and existing condition. Additionally, water surface elevation timeseries
were presented followed by the breaker type, water surface elevation and wave
breaking for each condition. The peel angle, peel rate, wave velocity and surfer velocity
were calculated from BOUSS-2D wave simulations screenshots. The Iribarren number
(𝜉𝑏) was calculated from significant wave height at breaking, deep water wave length
and beach slope.
4.1. Lake Worth Pier
4.1.1. Southeast Waves (Hs 6 feet, Tp 6.1 s from 105°)
The significant wave height (Hs) for existing conditions and the differences between
each alternative and the existing conditions at the Pier are presented in Figure 4-1.
Analysis of the wave propagation for existing conditions revealed the reduction of Hs
until certain point where the waves start the shoaling process, thereby increasing Hs.
The effect of the borrow area on the wave propagation is also observed. For this wave
case, two wave energy focalization areas are noticed: one between R134 and R135 and
another at R132. Two lobes of wave height reduction at each side of the borrow area
are observed as a result of refraction/diffraction.

Sub-Appendix G-4 BOUSS-2D Modeling Report
Southern Palm Beach Island Comprehensive Shoreline Stabilization Project 18 June 2016 Final Environmental Impact Statement
Figure 4-1. Significant wave height for existing condition and differences between each alternative and the existing condition for southeast waves at the Pier.

Sub-Appendix G-4 BOUSS-2D Modeling Report
Southern Palm Beach Island Comprehensive Shoreline Stabilization Project 19 June 2016 Final Environmental Impact Statement
Analyzing the results at the Pier takeoff position (point where the wave starts to break
and the surfer would start to surf), it can be observed that for all alternatives there are
virtually no changes in Hs. Alternative 7a shows a little variation (~2.5%) south of the
Pier’s takeoff position. Alternative 7a presented the higher Hs increase at this Study
Area since this alternative has the higher nourishment volume. A reduction in significant
wave height is observed in very shallow water, close to the beach. This reduction
should not be an issue for surfing since it happens landward of the surfing area.
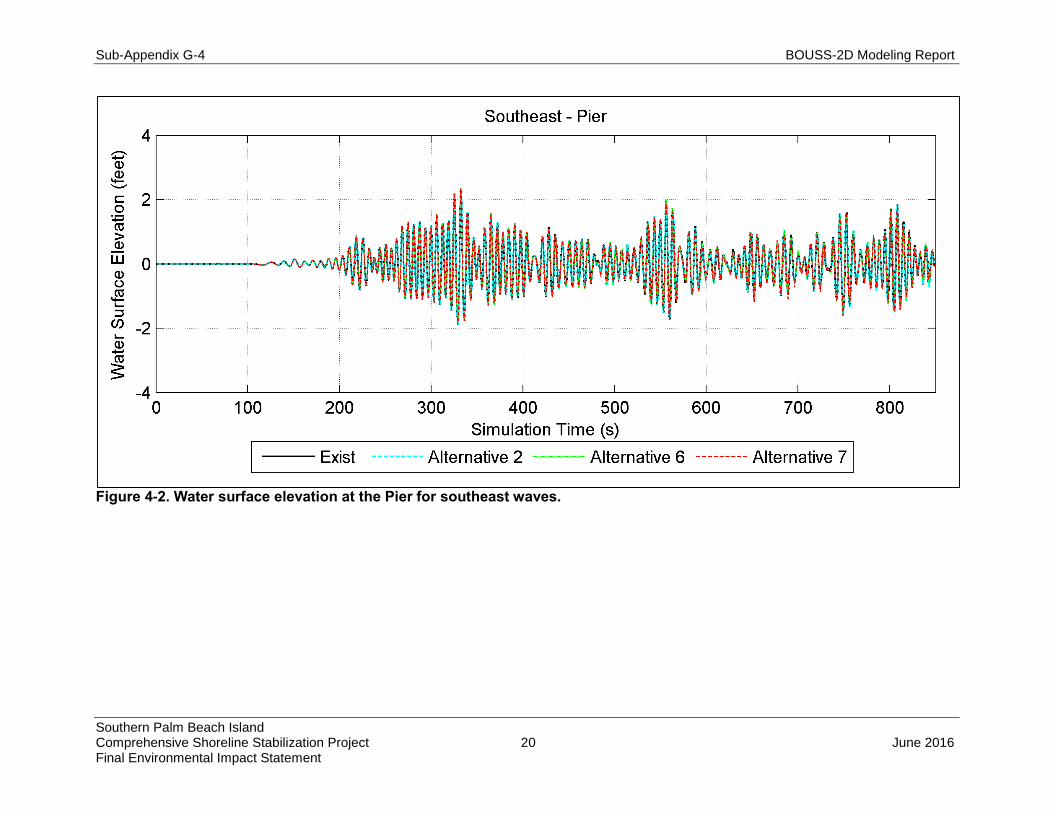
Figure 4-2 presents the water surface elevation at the Pier for existing and alternatives
conditions. The analysis points are presented in Figure 3-2. All alternatives presented
very similar timeseries with very small variations, indicating that at the analyzed points,
there will not be significant changes in wave propagation.
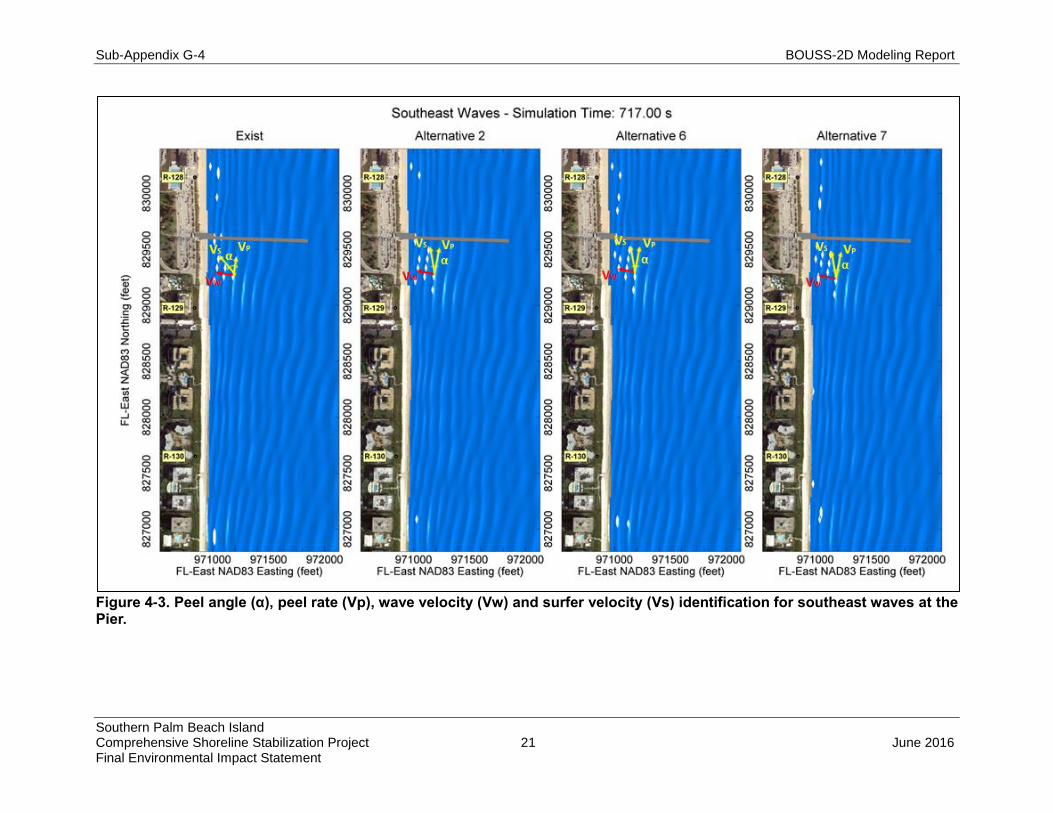
BOUSS-2D screenshots of wave simulation results are presented for the Pier in Figure
4-3. The parameters calculated from these screenshots are presented in Table 4-1. At
the Pier, the breaker type did not change between existing conditions and the
alternatives. This breaker was classified as a spilling breaker type. The peel angle was
46° (rating of 6) for existing conditions. A faster wave section was observed for all
alternatives, as evident by the increased peel angle. These peel angles were
anticipated to result in “close-out” waves. For the same wave velocity, the peel rate
increased and consequently, the surfer velocity increased between existing conditions
and the alternatives.
Sub-Appendix G-4 BOUSS-2D Modeling Report
Southern Palm Beach Island Comprehensive Shoreline Stabilization Project 20 June 2016 Final Environmental Impact Statement
Figure 4-2. Water surface elevation at the Pier for southeast waves.
Sub-Appendix G-4 BOUSS-2D Modeling Report
Southern Palm Beach Island Comprehensive Shoreline Stabilization Project 21 June 2016 Final Environmental Impact Statement
Figure 4-3. Peel angle (α), peel rate (Vp), wave velocity (Vw) and surfer velocity (Vs) identification for southeast waves at the Pier.
Sub-Appendix G-4 BOUSS-2D Modeling Report
Southern Palm Beach Island Comprehensive Shoreline Stabilization Project 22 June 2016 Final Environmental Impact Statement
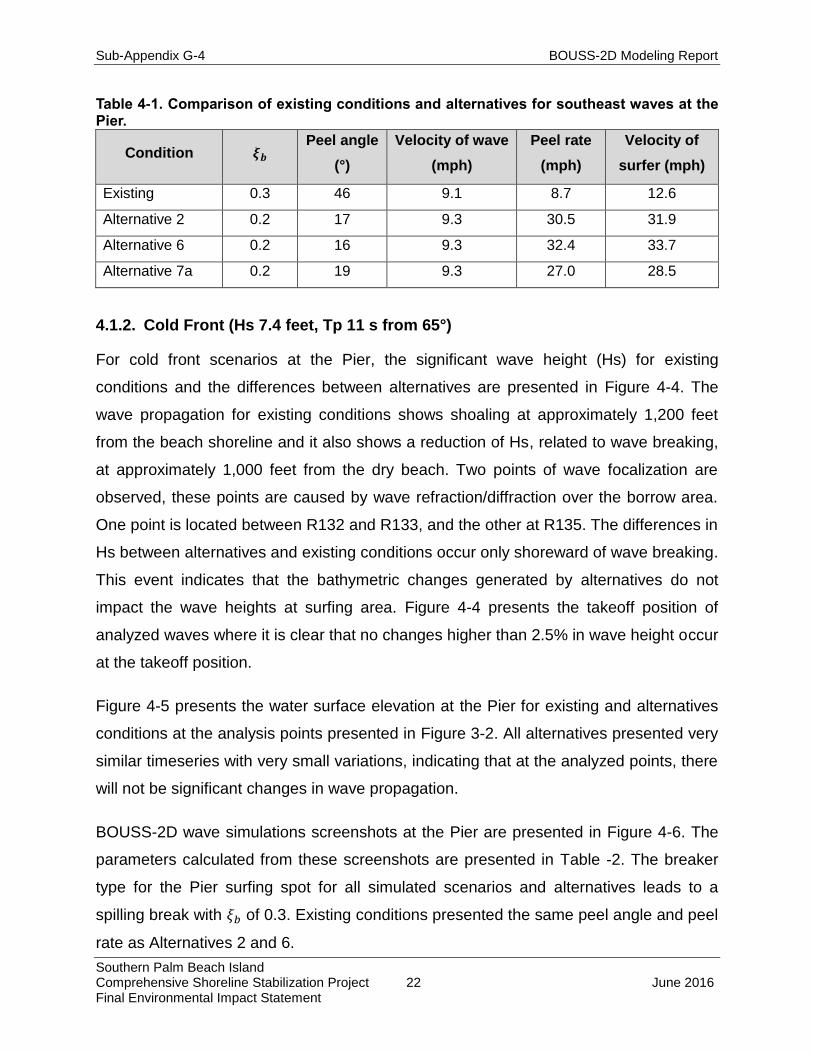
Table 4-1. Comparison of existing conditions and alternatives for southeast waves at the Pier.
4.1.2. Cold Front (Hs 7.4 feet, Tp 11 s from 65°)
For cold front scenarios at the Pier, the significant wave height (Hs) for existing
conditions and the differences between alternatives are presented in Figure 4-4. The
wave propagation for existing conditions shows shoaling at approximately 1,200 feet
from the beach shoreline and it also shows a reduction of Hs, related to wave breaking,
at approximately 1,000 feet from the dry beach. Two points of wave focalization are
observed, these points are caused by wave refraction/diffraction over the borrow area.
One point is located between R132 and R133, and the other at R135. The differences in
Hs between alternatives and existing conditions occur only shoreward of wave breaking.
This event indicates that the bathymetric changes generated by alternatives do not
impact the wave heights at surfing area. Figure 4-4 presents the takeoff position of
analyzed waves where it is clear that no changes higher than 2.5% in wave height occur
at the takeoff position.
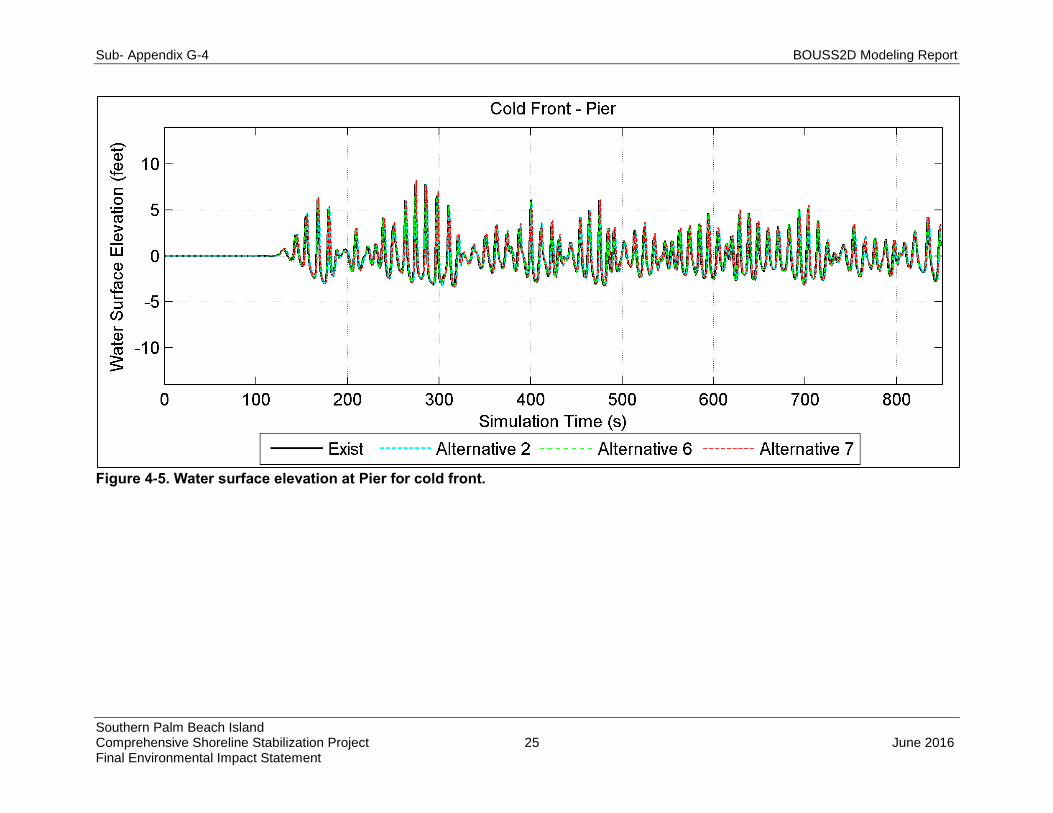
Figure 4-5 presents the water surface elevation at the Pier for existing and alternatives
conditions at the analysis points presented in Figure 3-2. All alternatives presented very
similar timeseries with very small variations, indicating that at the analyzed points, there
will not be significant changes in wave propagation.
BOUSS-2D wave simulations screenshots at the Pier are presented in Figure 4-6. The
parameters calculated from these screenshots are presented in Table -2. The breaker
type for the Pier surfing spot for all simulated scenarios and alternatives leads to a
spilling break with 𝜉𝑏 of 0.3. Existing conditions presented the same peel angle and peel
rate as Alternatives 2 and 6.
Condition 𝝃𝒃 Peel angle
(°)
Velocity of wave
(mph)
Peel rate
(mph)
Velocity of
surfer (mph)
Existing 0.3 46 9.1 8.7 12.6
Alternative 2 0.2 17 9.3 30.5 31.9
Alternative 6 0.2 16 9.3 32.4 33.7
Alternative 7a 0.2 19 9.3 27.0 28.5

Sub-Appendix G-4 BOUSS-2D Modeling Report
Southern Palm Beach Island Comprehensive Shoreline Stabilization Project 23 June 2016 Final Environmental Impact Statement
Table 4-2. Comparison of existing and alternative conditions for a cold front at the Pier.
Condition 𝝃𝒃 Peel angle
(°) Velocity of wave (mph)
Peel rate (mph)
Velocity of surfer (mph)
Existing 0.3 60 14.2 8.2 16.5
Alternative 2 0.3 60 14.3 8.2 16.5
Alternative 6 0.3 60 14.2 8.2 16.4
Alternative 7a 0.3 70 14.2 5.2 15.1

Sub- Appendix G-4 BOUSS2D Modeling Report
Southern Palm Beach Island Comprehensive Shoreline Stabilization Project 24 June 2016 Final Environmental Impact Statement
Figure 4-4. Significant wave height for existing condition and differences between each alternative and the existing condition for cold front scenario at Pier.
Sub- Appendix G-4 BOUSS2D Modeling Report
Southern Palm Beach Island Comprehensive Shoreline Stabilization Project 25 June 2016 Final Environmental Impact Statement
Figure 4-5. Water surface elevation at Pier for cold front.

Sub- Appendix G-4 BOUSS2D Modeling Report
Southern Palm Beach Island Comprehensive Shoreline Stabilization Project 26 June 2016 Final Environmental Impact Statement
Figure 4-6. Peel angle (α), peel rate (Vp), wave velocity (Vw) and surfer velocity (Vs) identification for cold front at Pier.

Sub- Appendix G-4 BOUSS2D Modeling Report
Southern Palm Beach Island Comprehensive Shoreline Stabilization Project 27 June 2016 Final Environmental Impact Statement
4.1.3. Hurricane Pre-Landfall (Hs 8.1 feet, Tp 13.5 s from 103°)
For the hurricane pre-landfall scenario, the significant wave height (Hs) for existing
conditions and the differences between existing conditions and the alternatives are
presented in Figure 4-7. The wave propagation shows that for this condition, shoaling
starts at approximately 2,000 feet from the beach shoreline and the wave breaks at
approximately 1,000 feet from dry beach. For the other wave conditions in the hurricane
pre-landfall scenario, an Hs focalization caused by wave refraction/diffraction is
observed at the borrow pit. In this case, the wave height is focused at R132 and
between R133 and R134. For all alternatives a reduction of wave height is observed
near the coast due to reduction of depth at that area and increase of bottom friction
and/or wave breaking. As Alternative 7a presents higher nourishment volumes, the
differences are more noticeable in this alternative. This alternative presents higher Hs
as well as higher wave period compared to the existing conditions and other
alternatives. Also, in Alternative 7a conditions, the waves will break in deeper water
(compared to cold front and southeast waves) and there will be no observable
differences in wave height at the surf spots.
Figure 4-8 presents the water surface elevation at the Pier for existing and alternatives
conditions, at the analysis points presented in Figure 3-2. All alternatives presented very
similar timeseries with very small variations, indicating that at the analyzed points, there
will not be significant changes in wave propagation.
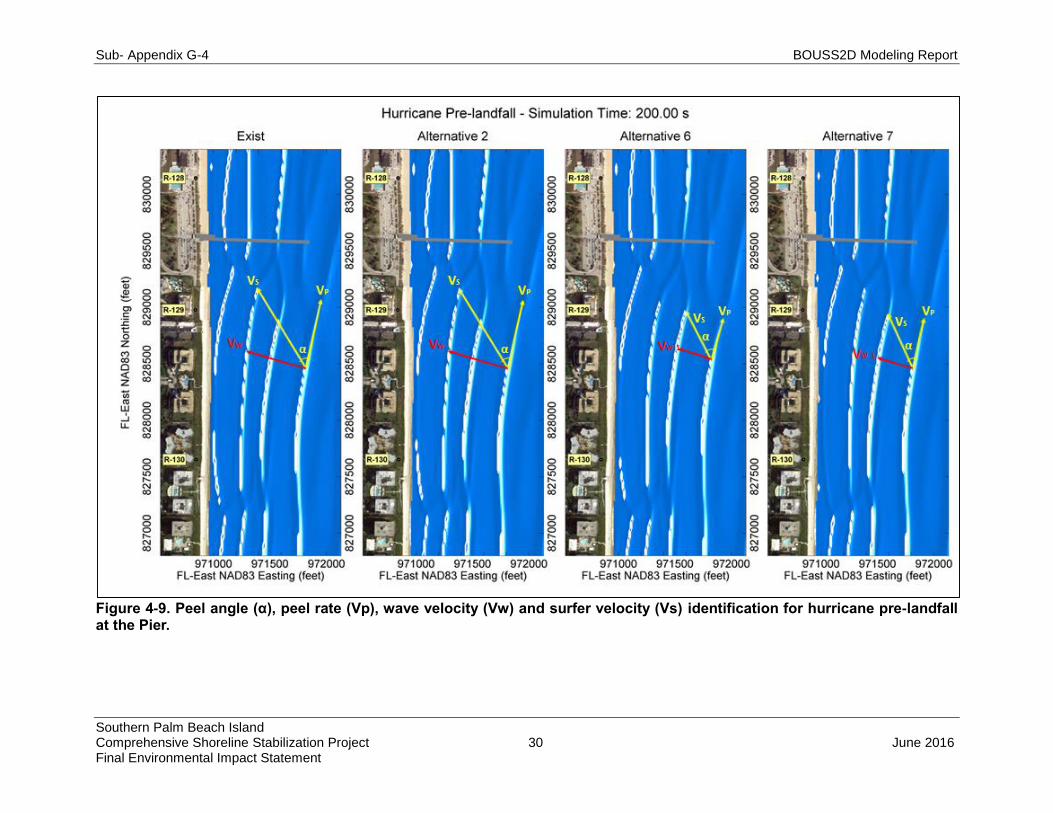
Screenshots of hurricane pre-landfall simulations are presented in Figure 4-9. The
parameters calculated from these screenshots are presented in Table 4-3. The breaker
type for the Pier surfing spot for all simulated scenarios and alternatives is a spilling
break with ξb of 0.3 for all analyzed waves.

Sub- Appendix G-4 BOUSS2D Modeling Report
Southern Palm Beach Island Comprehensive Shoreline Stabilization Project 28 June 2016 Final Environmental Impact Statement
Figure 4-7. Significant wave height for existing condition and differences between each alternative and the existing condition for pre-hurricane at Pier.

Sub- Appendix G-4 BOUSS2D Modeling Report
Southern Palm Beach Island Comprehensive Shoreline Stabilization Project 29 June 2016 Final Environmental Impact Statement
Figure 4-8. Water surface elevation at Pier for hurricane pre-landfall.
Sub- Appendix G-4 BOUSS2D Modeling Report
Southern Palm Beach Island Comprehensive Shoreline Stabilization Project 30 June 2016 Final Environmental Impact Statement
Figure 4-9. Peel angle (α), peel rate (Vp), wave velocity (Vw) and surfer velocity (Vs) identification for hurricane pre-landfall at the Pier.

Sub- Appendix G-4 BOUSS2D Modeling Report
Southern Palm Beach Island Comprehensive Shoreline Stabilization Project 31 June 2016 Final Environmental Impact Statement
Table 4-3. Comparison of existing and alternatives conditions for hurricane pre-landfall at Pier.
4.2. Lantana Park
4.2.1. Southeast Waves (Hs 6 feet, Tp 6.1 s from 105°)
The significant wave height (Hs) for existing conditions and the differences between
each alternative and the existing conditions at Lantana are presented in Figure 4-10.
Analysis of the impact of each alternative on Hs revealed an increase of significant
wave height at Lantana around the takeoff position. This increase in Hs is primarily due
to the larger amounts of sediment located where the wave starts to “touch” the bottom
before starting its shoaling process.
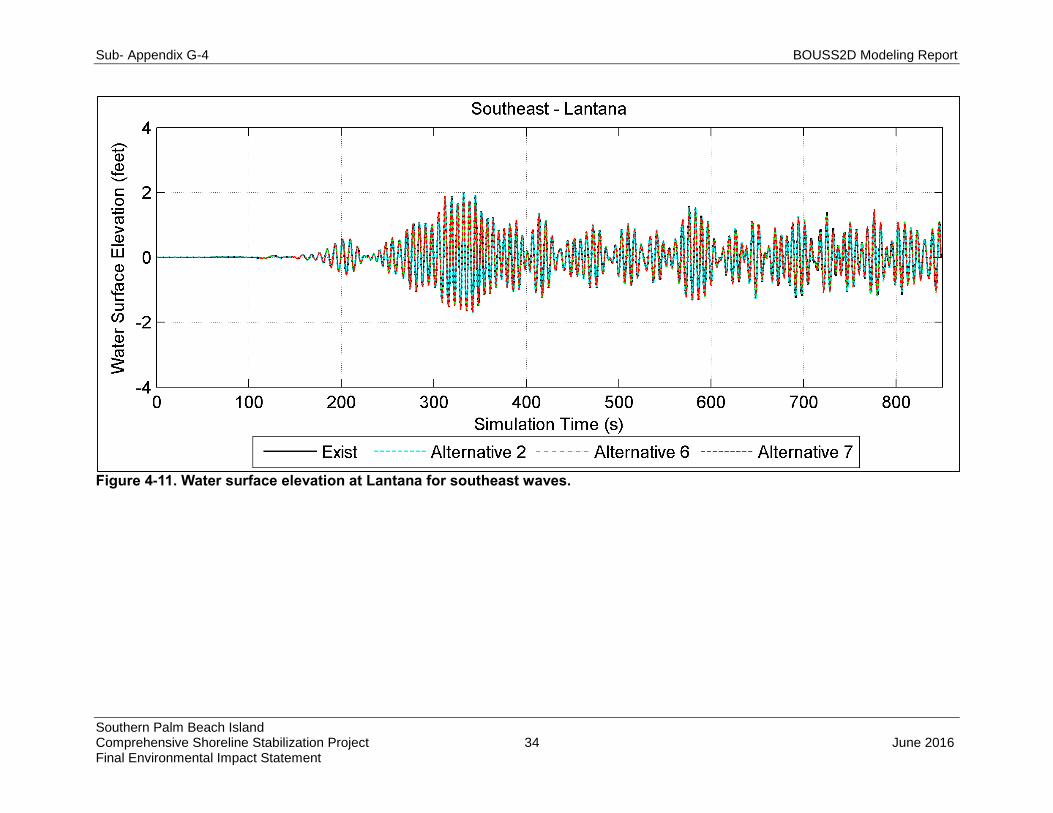
Figure 4-11 presents the water surface elevation at Lantana for existing and alternatives
conditions. The analysis points are presented in Figure 3-2. All alternatives presented
very similar timeseries with very small variations, indicating that at the analyzed points,
there will not be significant changes in wave propagation.
BOUSS-2D wave simulations screenshots at Lantana are presented in Figure 4-12. The
parameters calculated from these screenshots are presented in Table 4-4.
The breaker type at Lantana did not change between the existing conditions and the
alternatives. For all cases, the Iribarren calculated was 0.2, indicating a spilling break
type. It is noted that the takeoff position in Alternative 7a is further landward than in the
other alternatives and the existing conditions. This can be due to wave energy
dissipation over the bottom. Since Alternative 7a is shallower, the wave dissipates more
energy before breaking and this dissipation leads the wave to break closer to the shore.
Condition 𝝃𝒃 Peel angle
(°)
Velocity of wave
(mph)
Peel rate
(mph)
Velocity of
surfer (mph)
Existing 0.3 45 15.1 15.1 21.4
Alternative 2 0.3 45 15.4 15.4 21.8
Alternative 6 0.3 42 15.8 17.5 23.6
Alternative 7a 0.3 38 15.3 19.6 24.9

Sub- Appendix G-4 BOUSS2D Modeling Report
Southern Palm Beach Island Comprehensive Shoreline Stabilization Project 32 June 2016 Final Environmental Impact Statement
The existing conditions and Alternative 2 would be rated a 5 in Hunt et al. (2001)
classification (see Table 2-1), as compared to a 6 for Alternative 6 and a 7a for
Alternative 7a. The velocity of wave did not change significantly between alternatives
and existing conditions.
Table 4-4. Comparison of existing conditions and alternatives for southeast waves at Lantana.
Condition 𝝃𝒃 Peel angle
(°) Velocity of wave (mph)
Peel rate (mph)
Velocity of surfer (mph)
Existing 0.2 54 10.5 7.6 13.0
Alternative 2 0.2 55 10.3 7.2 12.6
Alternative 6 0.2 47 10.4 9.7 14.2
Alternative 7a 0.2 26 10.4 21.2 23.6

Sub- Appendix G-4 BOUSS2D Modeling Report
Southern Palm Beach Island Comprehensive Shoreline Stabilization Project 33 June 2016 Final Environmental Impact Statement
Figure 4-10. Significant wave height for existing condition and differences between each alternative and the existing condition for southeast waves at Lantana.
Sub- Appendix G-4 BOUSS2D Modeling Report
Southern Palm Beach Island Comprehensive Shoreline Stabilization Project 34 June 2016 Final Environmental Impact Statement
Figure 4-11. Water surface elevation at Lantana for southeast waves.

Sub- Appendix G-4 BOUSS2D Modeling Report
Southern Palm Beach Island Comprehensive Shoreline Stabilization Project 35 June 2016 Final Environmental Impact Statement
Figure 4-12. Peel angle (α), peel rate (Vp), wave velocity (Vw) and surfer velocity (Vs) identification for southeast waves at Lantana.

Sub- Appendix G-4 BOUSS2D Modeling Report
Southern Palm Beach Island Comprehensive Shoreline Stabilization Project 36 June 2016 Final Environmental Impact Statement
4.2.2. Cold Front (Hs 7.4 feet, Tp 11 s from 65°)
For cold front scenarios at Lantana, the significant wave height (Hs) for existing
conditions and the differences between alternatives are presented in Figure 4-13. The
differences in Hs between the alternatives and existing conditions occur only shoreward
of wave breaking, indicating that the bathymetric changes generated by alternatives
does not impact the wave heights at the Lantana surf spot. Figure 4-13 presents the
takeoff position of analyzed waves where it is clear that no changes higher than 2.5% in
wave height occur.
Figure 4-14 presents the water surface elevation at Lantana for existing and alternatives
conditions at the analysis points presented in Figure 3-2. All alternatives presented very
similar timeseries with very small variations, indicating that at the analyzed points, there
will not be significant changes in wave propagation.
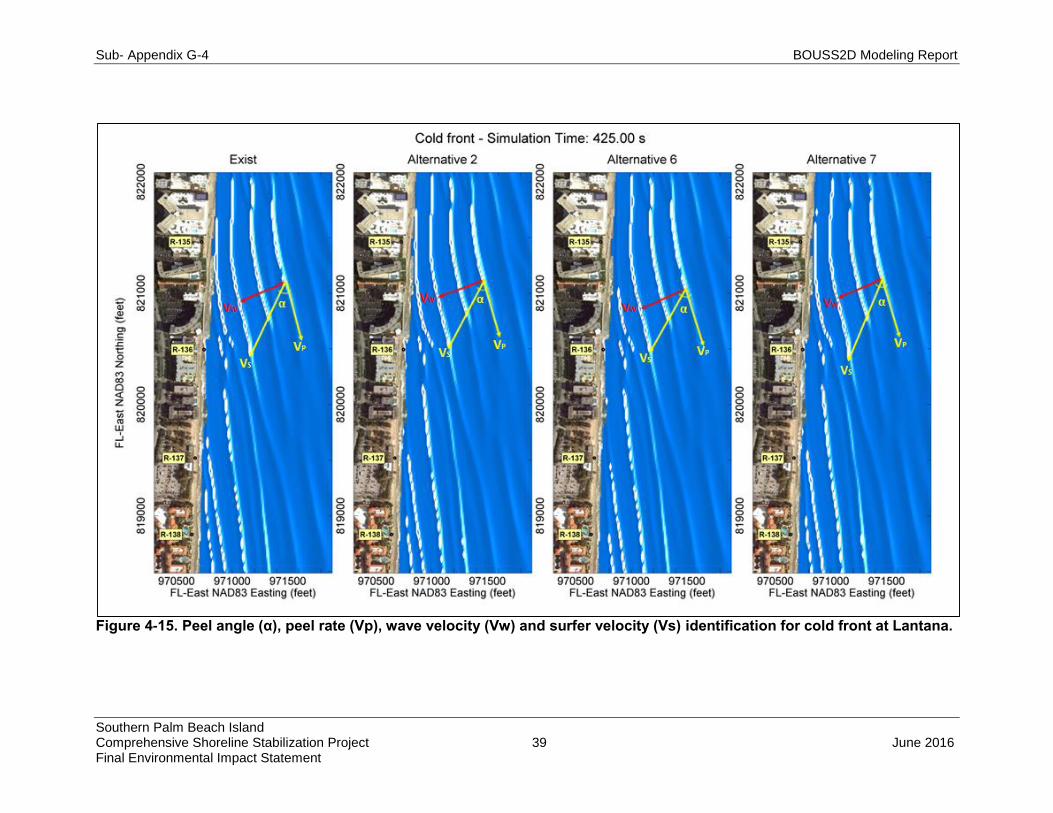
Bouss2D wave simulations screenshots for cold front waves at Lantana are presented
in Figure 4-15. The parameters calculated from these screenshots are presented in
Table 4-5. The breaker type for Lantana for all simulated scenarios and alternatives
leads to a spilling break with 𝜉𝑏 of 0.3.
For Lantana, the existing conditions and Alternatives 2 and 6 are likely to result in
waves rated for surfers at a skill level of 6 (Hunt et al. 2001). Alternative 7a presented a
sharper peel angle and it is likely to be surfed by surfers rated as 7 or higher. The
velocity of wave for all simulated cases is 15 mph. Alternative 7a increased its surfer
velocity to 24.8 mph as a result of peel angle sharpening.

Sub- Appendix G-4 BOUSS2D Modeling Report
Southern Palm Beach Island Comprehensive Shoreline Stabilization Project 37 June 2016 Final Environmental Impact Statement
Figure 4-13. Significant wave height for existing condition and differences between each alternative and the existing condition for cold front scenario at Lantana.

Sub- Appendix G-4 BOUSS2D Modeling Report
Southern Palm Beach Island Comprehensive Shoreline Stabilization Project 38 June 2016 Final Environmental Impact Statement
Figure 4-14. Water surface elevation at Lantana for cold front.
Sub- Appendix G-4 BOUSS2D Modeling Report
Southern Palm Beach Island Comprehensive Shoreline Stabilization Project 39 June 2016 Final Environmental Impact Statement
Figure 4-15. Peel angle (α), peel rate (Vp), wave velocity (Vw) and surfer velocity (Vs) identification for cold front at Lantana.
Sub- Appendix G-4 BOUSS2D Modeling Report
Southern Palm Beach Island Comprehensive Shoreline Stabilization Project 40 June 2016 Final Environmental Impact Statement
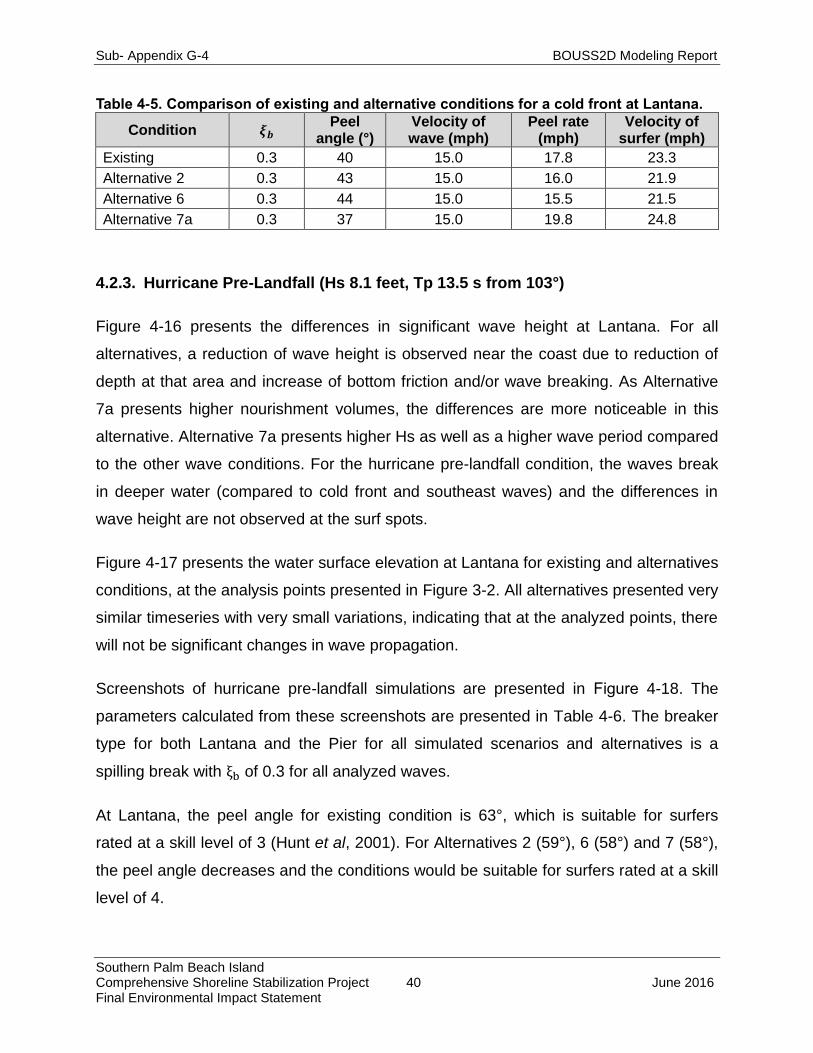
Table 4-5. Comparison of existing and alternative conditions for a cold front at Lantana.
4.2.3. Hurricane Pre-Landfall (Hs 8.1 feet, Tp 13.5 s from 103°)
Figure 4-16 presents the differences in significant wave height at Lantana. For all
alternatives, a reduction of wave height is observed near the coast due to reduction of
depth at that area and increase of bottom friction and/or wave breaking. As Alternative
7a presents higher nourishment volumes, the differences are more noticeable in this
alternative. Alternative 7a presents higher Hs as well as a higher wave period compared
to the other wave conditions. For the hurricane pre-landfall condition, the waves break
in deeper water (compared to cold front and southeast waves) and the differences in
wave height are not observed at the surf spots.
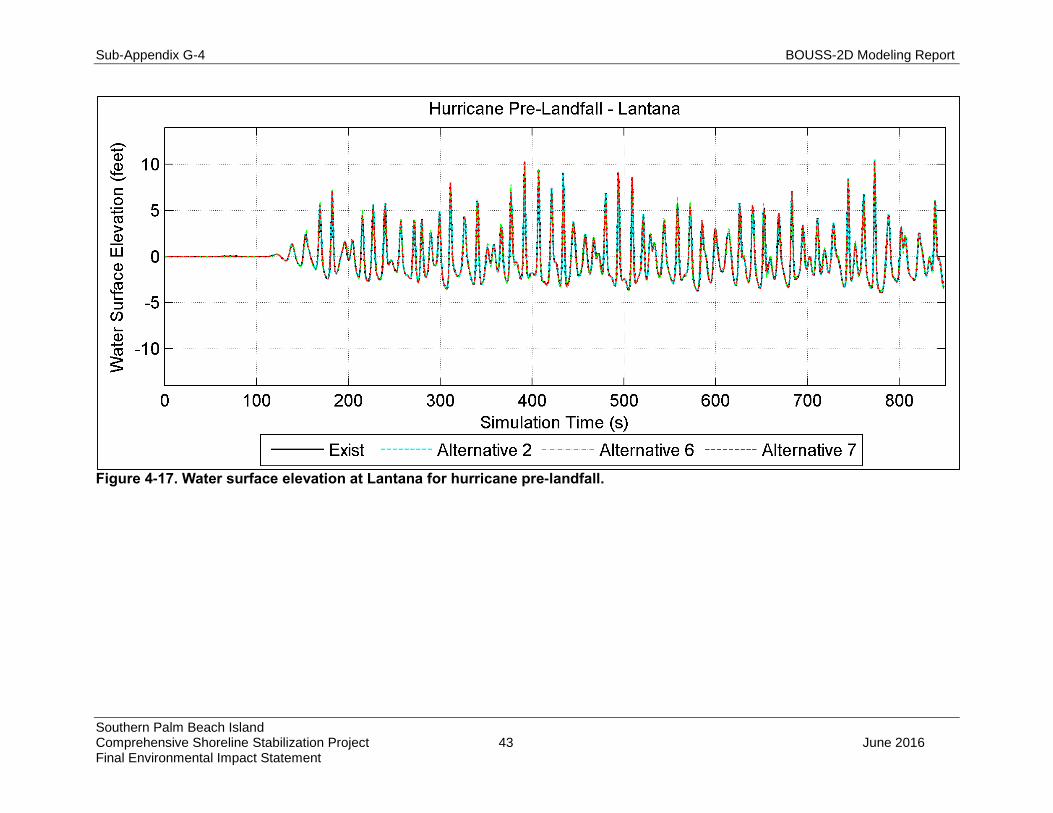
Figure 4-17 presents the water surface elevation at Lantana for existing and alternatives
conditions, at the analysis points presented in Figure 3-2. All alternatives presented very
similar timeseries with very small variations, indicating that at the analyzed points, there
will not be significant changes in wave propagation.
Screenshots of hurricane pre-landfall simulations are presented in Figure 4-18. The
parameters calculated from these screenshots are presented in Table 4-6. The breaker
type for both Lantana and the Pier for all simulated scenarios and alternatives is a
spilling break with ξb of 0.3 for all analyzed waves.
At Lantana, the peel angle for existing condition is 63°, which is suitable for surfers
rated at a skill level of 3 (Hunt et al, 2001). For Alternatives 2 (59°), 6 (58°) and 7 (58°),
the peel angle decreases and the conditions would be suitable for surfers rated at a skill
level of 4.
Condition 𝝃𝒃 Peel
angle (°) Velocity of wave (mph)
Peel rate (mph)
Velocity of surfer (mph)
Existing 0.3 40 15.0 17.8 23.3
Alternative 2 0.3 43 15.0 16.0 21.9
Alternative 6 0.3 44 15.0 15.5 21.5
Alternative 7a 0.3 37 15.0 19.8 24.8

Sub- Appendix G-4 BOUSS2D Modeling Report
Southern Palm Beach Island Comprehensive Shoreline Stabilization Project 41 June 2016 Final Environmental Impact Statement
Table 4-6. Comparison of existing and alternative conditions for hurricane pre-landfall at Lantana.
Condition 𝝃𝒃 Peel angle (°) Velocity of wave (mph)
Peel rate (mph)
Velocity of surfer (mph)
Existing 0.3 63 16.4 8.3 18.4
Alternative 2 0.3 59 16.3 9.8 19.1
Alternative 6 0.3 58 16.4 10.2 19.3
Alternative 7a 0.3 58 16.3 10.2 19.3

Sub-Appendix G-4 BOUSS-2D Modeling Report
Southern Palm Beach Island Comprehensive Shoreline Stabilization Project 42 June 2016 Final Environmental Impact Statement
Figure 4-16. Significant wave height for existing condition and differences between each alternative and the existing condition for pre-hurricane at Lantana.
Sub-Appendix G-4 BOUSS-2D Modeling Report
Southern Palm Beach Island Comprehensive Shoreline Stabilization Project 43 June 2016 Final Environmental Impact Statement
Figure 4-17. Water surface elevation at Lantana for hurricane pre-landfall.

Sub-Appendix G-4 BOUSS-2D Modeling Report
Southern Palm Beach Island Comprehensive Shoreline Stabilization Project 44 June 2016 Final Environmental Impact Statement
Figure 4-18. Peel angle (α), peel rate (Vp), wave velocity (Vw) and surfer velocity (Vs) identification for hurricane pre-landfall at Lantana.
Sub-Appendix G-4 BOUSS-2D Modeling Report
Southern Palm Beach Island Comprehensive Shoreline Stabilization Project 45 June 2016 Final Environmental Impact Statement
5.0 SUMMARY AND CONCLUSIONS
A numerical modeling study utilizing BOUSS-2D model was conducted to simulate the
potential impacts of Project alternatives to surfability at two points: nearby Lantana
Beach Park and at the Lake Worth Pier. Three wave conditions: (i) southeast, (ii) cold
front and (iii) hurricane pre-landfall, were used for model verification and model runs.
The significant wave height for existing conditions was analyzed as well as the relative
differences (%) between existing conditions and the alternatives. In addition, the main
parameters to assess surfability (Iribarren number 𝜉𝑏, peel angle, velocity of wave, peel
rate and velocity of surfer) were studied to evaluate the quality of wave for surfing.
The main conclusions of this BOUSS2D study are as follows:
- The minimum skill level required of surfers to surf at the two locations was rated
at 5 (out of 10), representing an intermediate skill level.
- Differences of significant wave heights (Hs) between existing and alternatives
scenarios were more noticeable for alternatives with higher amount of sediment
placement.
- A decrease of wave height was observed near the beach for all alternatives. This
decrease would not impact surfing directly since it happened after wave
breaking, landward of surfing area.
- The wave condition that showed more impact from the alternatives was the
southeast waves. Under this condition (smaller waves with smaller periods) the
waves would break close to the beach where the differences in bathymetry
(between alternatives and existing) are higher. For hurricane and cold front wave
conditions (higher waves with higher periods) the waves would break offshore
where the bathymetry presents little or no differences between existing
conditions and the alternatives.
- An increase of wave height before wave breaking is observed for southeast
waves conditions in Alternative 7a. This wave height increase is noticed due to

Sub-Appendix G-4 BOUSS-2D Modeling Report
Southern Palm Beach Island Comprehensive Shoreline Stabilization Project 46 June 2016 Final Environmental Impact Statement
the combination of the wave conditions used in the model and the bathymetry of
Alternative 7a. The southeast wave conditions have the smallest simulated wave
height and period and Alternative 7a presents the highest amount of sediment
placed.
- In general, a small variation in peel angle, peel rate, and the velocity of the surfer
was observed in all the simulations for the different alternatives. The changes in
the surfability at the two locations due to the alternatives were also small.
The results of this numerical modeling study should be used in conjunction with other
coastal engineering assessments and prudent engineering judgment.

Sub-Appendix G-4 BOUSS-2D Modeling Report
Southern Palm Beach Island Comprehensive Shoreline Stabilization Project 47 June 2016 Final Environmental Impact Statement
6.0 LITERATURE CITED
Battjes, J. A. 1974. Surf Similarity. Coastal Engineering. 466-480 p.
Benedet, L., T. Pierro, and M. Henriquez. 2007. Impacts of coastal engineering projects
on the surfability of sandy beaches. Shore & Beach 75(4), Fall 2007, American Shore &
Beach Preservation Association, Ft. Myers, FL, pp 3-20.
Black, K.P. 2001. Artificial Surfing Reefs for Erosion Control and Amenity; Theory and
Application. Special Issue 34 (ICS 2000), Journal of Coastal Research, pp 1-7. 312.
Black, K.P. and S. Mead. 2001. Design of the Gold Coast Artificial Surfing Reef: Surfing
Aspects. In: K. Black (ed) Natural and Artificial Reefs for Surfing and Coastal Protection.
Special Issue 29, Journal of Coastal Research, pp 115-130.
Coastal Planning and Engineering, Inc. (CPE). 2009. Boussinesq Wave Modelling for
Evaluation of Impact of Proposed Structures on Surfing Conditions. Technical Report.
48p.
Dafferner, G. and A.H. da F. Klein. 2009. The Relationship between Morphodynamics
and Surfability at Brava Beach, Southern Brazil. Reef Journal 1(1):153-161.
Demirbilek, Z., A. Zundel, and O. Nwogu. 2005. BOUSS-2D Wave Model in the SMS: 1.
Graphical Interface. US Army Corps of Engineers – Engineer Research and
Development Center. Vicksburg, MS.
Goda, Y. 1985. A new method of wave pressure calculation for design of composite
breakwater, Proceedings 14th international conference on Coastal, ASCE. Pp 1702-
1720.
Hubertz, J.M. 1992. User’s Guide to the Wave Information Studies (WIS) Wave Model:
Version 2.0, WIS Report 27, US Army Corps of Engineers, Waterways Experiment
Station, Vicksburg, MS, 41 pp.
Sub-Appendix G-4 BOUSS-2D Modeling Report
Southern Palm Beach Island Comprehensive Shoreline Stabilization Project 48 June 2016 Final Environmental Impact Statement
Hutt, J.A., K.P. Black, and S.T. Mead. 2001. Classification of surf breaks in relation to
surfing skill. Journal of Coast Research. SI 29. 66-81 p.
Nwogu, O. 1993. Alternative form of Boussinesq equations for nearshore wave
propagation. Journal of Waterway, Port, Coastal and Ocean Engineering, ASCE,
119(6), 618-638.
Nwogu, O. 1996. Numerical prediction of breaking waves and currents with a
Boussinesq model. Paper presented at the 25th International Conference on Coastal
Engineering, ICCE ‘96, Orlando, FL.
Nwogu, O., and Z. Demirbilek. 2001. BOUSS-2D: A Boussinesq wave model for coastal
regions and harbors. ERDC/CHL TR-01-25, U.S. Army Engineer Research and
Development Center, Vicksburg, MS.
Peregrine, D. H. 1967. Long waves on a beach. Journal of Fluid Mechanics 27, 815-
827.
Scarfe, B.E., M.H.S. Elwany, S.T. Mead, and K.P. Black. 2003. The science of surfing
waves and surfing breaks – A review. Scripps Institution of Oceanography – UC San
Diego. Technical Report. 1- 12.
Walker, J.R. 1974. Recreational Surf Parameters, Technical Report 30, Look
Laboratory, University of Hawaii, 311 pp
Wei, G., J.T. Kirby, S.T. Grilli, and R. Subramanya. 1995. A fully nonlinear Boussinesq
model for surface waves, Part 1, highly nonlinear unsteady waves. Journal of Fluid
Mechanics 294, 71-92.