application of a new methodology for determining ...palabras clave: haps, denuders xad,...
TRANSCRIPT
Scientia Chromatographica 2016; 8(3):189-195Instituto Internacional de Cromatografiahttp://dx.doi.org/10.4322/sc.2016.032ISSN 1984-4433
CROMATOGRAFIA GASOSA
Scientia Chromatographica 2016; 8(3) 189
AbstractRecognizing that the Polycyclic Aromatic Hydrocarbons (PAHs) are semi volatile organic
compounds (SVOCs), are distributed between the gas phases (GP) and the atmospheric
particulate matter (PM), and have a recognized toxicity, it is increasingly important that
their analysis was as reliable as possible. For this purpose, the combination of different
kinds of membrane filters has been used frequently, as well as polyurethane foam filters
(PUF), to sample the gaseous phase. However, this technique is unreliable for determining
the distribution between the phases, due mainly to different types of sampling artifacts.
Considering this issue, a new methodology for determining the PAHs phase distribution is
proposed. This technique involves the utilization of the combination of parallel cartridges,
one equipped with membrane filter and PUF (F+PUF) and other with F+PUF+ XAD
Denuder (XAD-D). This methodology was proved in a PAHs monitoring campaign in
the urban air of Temuco, Chile, in winter season and the obtained results indicate using
the combination of cartridge (F+PUF) and (F+PUF+ XAD), we are reducing the effect of
sampling artifacts on the determination of the atmospheric concentration of PAHs.
Keywords: PAHs, XAD-Denuder, Air Toxics, Particulate Matter, Temuco.
ResumenLos hidrocarburos aromáticos policíclicos (HAPs) son compuestos orgánicos semi-volátiles
(SVOCs) que se distribuyen entre las fases gaseosa (GP) y el material particulado atmosférico
(PM) del aerosol atmosférico, y tienen una toxicidad reconocida, cada vez es más importante
que su análisis sea lo más confiable posible. Para este propósito, la combinación de diferentes
tipos de filtros de membrana se ha utilizado con frecuencia, así como los filtros de espuma
de poliuretano (PUF). Sin embargo, esta técnica no es fiable para la determinación de la
distribución entre las fases, debido principalmente a los diferentes tipos de problemas de
muestreo que pueden presentarse. Teniendo en cuenta este problema, se propone una nueva
metodología para determinar la distribución de fases de HAPs en aerosoles atmosféricos. Esta
técnica consiste en la utilización de la combinación de cartuchos paralelos, uno equipado
con filtro de membrana y PUF (F + PUF) y otra con F + PUF + XAD Denuder (XAD-D). Esta
metodología fue probada en una campaña de monitoreo atmosférico invernal realizada en la
ciudad de Temuco, Chile. Los resultados obtenidos indican que el uso de la combinación de
cartucho (F + PUF) y (F + PUF + XAD), reducen el efecto de los problemas de muestreo en la
determinación de la concentración atmosférica de HAPs.
Palabras clave: HAPs, Denuders XAD, Contaminantes Atmosféricos, Temuco, Material
Particulado, Distribución de Fases.
Francisco Cereceda-Balic1,2* Ximena Fadic1 Víctor Vidal1,2 Luis Díaz-Robles3
1Centro de Tecnologías Ambientales (CETAM), Universidad Técnica Federico Santa María, General Bari 699, Valparaíso, Chile.2Departamento de Química, Universidad Técnica Federico Santa María, Avenida España 1680, Valparaíso, Chile.3Chemical Engineering Department, Engineering Faculty, Universidad de Santiago de Chile, Av. Libertador Bernardo O`Higgins 3363, Santiago, Chile.
Recebido: 01-07-2016Aceito: 14-09-2016
Application of a new methodology for determining Polycyclic Aromatic Hydrocarbons (PAHs) in atmospheric aerosols using different filter configurations, PUF and XAD-DenuderAplicación de una nueva metodología para la determinación de Hidrocarburos Aromáticos Policíclicos (HAPs) en aerosoles atmosféricos usando diferentes configuraciones de filtros, PUF y Denuders-XAD

Cereceda-Balic F et al. Application of a new methodology for determining Polycyclic Aromatic Hydrocarbons (PAHs)
190 Scientia Chromatographica 2016; 8(3):189-195
1. IntroductionPolycyclic Aromatic Hydrocarbons (PAHs) are
semi-volatile organic compounds (SVOCs) produced in the combustion of fuels such as wood, coal and oil[1]. They consist of aromatic ring structures many of which are carcinogenic, e.g., benzo [a] pyrene[1]. PAHs can be distributed between the gas phase (GP) and particulate phase (PM
2.5) of the atmospheric aerosol[1]. Semivolatile
organic compounds partition between vapor and particle-associated fractions in the atmosphere. Vapor-particle partitioning behavior plays an important role in determining the fate, exposure of wildlife and humans and longrange transport of organic pollutants[2]. Accurate ambient sampling and analysis of PAHs are required to provide quantitative information of their levels and temporal variability. For this purpose, the combination of different kinds of filters has frequently been used, such as Teflon membranes, polypropylene, glass, and quartz fiber, to sample the particulate phase[3], as well as polyurethane foam filters (PUFs), to sample the gaseous phase[4]. For example, by combining Teflon Filters (TF) and PUFs, the total concentrations of PAHs (TPAHs) can be determined, this is the standard configuration recommended by international environmental agencies like US-EPA[5], and other authors[4]; however, this technique is unreliable for determining the distribution between the phases, due mainly to various kinds of sampling artifacts. Alternative techniques for sampling gas and particulate phase of PAHs has been described in literature like the use of functionalized Glass Fiber Filters which is very effective to sample total concentration of PAHs[6], nevertheless, this kind of filter are not designed to obtain phases distribution of PAHs.
Some authors has describe the use of different active sampling configurations (e.g., sampling times, sorbents, different inlets, etc) who may lead to a range of different sampling artifacts (e.g. breakthrough, degradation, etc.)[7]. One of the most common sampling artifacts is caused by adsorption of PAHs associated with the gas phase onto PM
2.5 previously collected on the TF[4].
One way to eliminate this artifact is using a denuder of XAD (XAD-D) before the air flow reaches the TF.
Concerning this issue, a new methodology for determining the PAH phase distribution is proposed. This technique involves the utilization of a combination of parallel cartridges, one equipped with TF+PUF and the other with TF+PUF+XAD-D (Figure 1), TF+PUF cartridge is used for retaining and determination of PAHs in both gas and particulate phases, meanwhile TF+PUF+XAD-D cartridge is used for retaining and determination of PAHs associated to particulate phase (PAHsPM) exclusively because PAHsGP are retained by XAD-D which cannot be analyzed, therefore PAHs associated to gas phase (PAHsGP) are obtained by difference (PAHs (TF+PUF) – (TF+PUF+XAD-D)). This methodology was used in a PAH ambient monitoring campaign.
2. ExperimentalBetween August and September of 2008 an
atmospheric monitoring campaign was carried out in the city of Temuco, Chile. Temuco is located 800 Km south of Santiago – Chile (Latitude 38° 45’S; Longitude 72° 40’W; 100 m.a.s.l) and suffers from severe residential wood smoke particulate pollution events, especially during the period from April to September (fall and winter in the Southern hemisphere) each year[8]. In fact, almost 70% of the population uses wood for cooking or heating
Figure 1. Sampling configuration, combination of parallel cartridges.

Application of a new methodology for determining Polycyclic Aromatic Hydrocarbons (PAHs) Cereceda-Balic F et al.
Scientia Chromatographica 2016; 8(3):189-195 191
in winter, and it is estimated that 90% of PM10
winter emissions originate from residential wood combustion[9]. This situation, which is common in many cities worldwide, results in elevated concentrations of primary particulate matter during the evening-night period[8]. In Temuco, monitoring stations records show high levels of PM
10 concentration with a 24-h 98 percentile from
188 µg/m3 and 172 µg/m3 in 2001 and 2002 respectively. Hourly PM10 mass concentrations sometimes exceed 900-1000 µg/m3, the majority of which (80-90%) lies in the PM
2,5 fraction. During 2008, 35 days were reported
with PM10
concentrations exceeding the Chilean daily PM
10 standard of 150 µg/m3, and there were more than
110 exceedance days during the 2001- 2008 period. For this reason, Temuco was declared a non-attainment area for PM
10 in 2005[8]. Samples were collected at two city
locations, the first at “Las Encinas” (LE) a ground level residential site located at the southern part of the city, and the second situated 40 m over ground level at “Universidad Católica de Temuco” (UCT) in the downtown area, 2 km north of LE. At each monitoring station a “low-vol” “Partisol 2300, Speciation Sampler” (S. Samp) (Thermo Environental Inc, USA) was installed. Each S. Samp
was configured to 24 h sample using 2 cartridges with
simultaneous sample flow of 10 L/min. The first cartridge
(Config 1) was equipped with 1 TF of 0.45 [µm] pore size
(Sartorius, Germany) and 3 PUFs (30 mm [H] x 55 mm
[OD], GORE-TEX , USA): on this cartridge TPAHs
were collected, meaning the PAHs associated to the PM2.5
plus the PAHs associated to the gas phase (PAHsGP
).
The second cartridge (Config 2) was equipped with TF,
3 PUFs and 2 XAD-D: on this cartridge PAHs associated
to PM2.5
(PAHsPM
) were determined because PAHsGP
were
retained by the XAD-D. Inside cartridge Config 2, PAHs
volatilized from PM2.5
collected on TF will be captured by
PUFs, changing their phase distribution, for this reason
it is considered that PAHs collected in TF plus PAHs
collected in PUF of cartridge Config 2 represent only
PAHsPM.
. Where PAHsGP
was determined by Equation 1:
PM GPTPAHs = PAHs + PAHs (1)
where TPAHs was obtained from TF + PUF cartridge
Config 1, and PAHsPM
was obtained from TF + PUF
cartridge Config 2.
Figure 2. 16 EPA-PAHs standard solution 8 ng µL-1 obtained by GC-FID.

Cereceda-Balic F et al. Application of a new methodology for determining Polycyclic Aromatic Hydrocarbons (PAHs)
192 Scientia Chromatographica 2016; 8(3):189-195
Once the samples were taken, the cartridges were transported to the laboratory for analysis, which was performed on September-October 2008. TF and PUFs were extracted separately. For quality assurance each step of the analytical procedure was optimized and validated: TF and PUFs extraction (toluene was the PAHs solvent extraction in this study), volume reduction in rotary evaporator, evaporation under controlled nitrogen stream, sample purification (clean-up), and the complete procedure including chromatographic determination[1]. For this objective, a certified standard solution of 16 EPA PAHs (NIST, USA) was used in three concentration levels: 8; 40 and 80 ng µL-1 for all PAHs (acenaphthylene (ACY), acenaphthene (ACE), fluorene (FLU), phenanthrene (PHE), anthracene (ANT), benzo(a)anthracene (BAA), chrysene (CRY), pyrene (PYR), fluoranthene (FLT), benzo(a)pyrene (BAP), dibenzo(a,h)anthracene (DBA), indeno(1,2,3-cd)pyrene (INP), and benzo(g,h,i)perylene (BGP)). A standard reference material from NIST was also used, which contains absorbed and adsorbed PAHs on particulate matter (“Urban-Dust,” SRM 1649a), with a total PAHs quantity between 0.02 and 0.22 µg. QA/QC detailed procedure and results are described by Cereceda et. al. 2012[1].
The concentration of PAHs in the atmospheric aerosol was determined by a gas chromatography with flame ionization detector (GC-FID) (Autosystem XL; Perkin Elmer, Arlington, MA, USA); and for structural confirmation, gas chromatography with mass spectrometric detectors (GC-MS) (Clarus 500; Perkin Elmer) was used. Both instruments were equipped with a programmable large-volume injection technique for capillary gas chromatography with solvent diverts and split/splitless injector with electronic pneumatic control and temperature programming (PSSTM; Perkin Elmer). PSS injector was used on GC-FID to eliminate most of the solvent (toluene) away from the injector (only 6 sec) through the PreVentTM system (Perkin Elmer), so that the analytical column and the detector were able to produce appropriate chromatographic conditions
and the peaks in the chromatograms were much more suitable for quantitative analysis. Splitless mode was used to inject 1 mL of the extract into a 30-m-long capillary column of 5% phenylmethylsilicone fused silica (Varian Factor Four type DB-5; Walnut Creek, CA, U.S.A.); temperature program: 60 °C, 3 min, 10 °C min-1→210 °C, 5 min, 30 °C min-1→285 °C, 7 min, 15 °C min-1→300 °C, 10 min; carrier gas: helium (99.9999% purity) for both chromatographic systems. The samples were analyzed by electron impact (EI) GC-MS in scan mode (50 -500 Da). Internal standard method was used for PAHs quantification, using 1-methylpyrene, 2,2’-binaphthyl and indeno[1,2,3,c,d]fluoranthene (Dr. W. Schmidt, Institut für PAH Forschung). The limit of detection (LOD¼ 3SDs) varied between 0.012 (indeno[1,2,3,c,d]pyrene) and 0.094 (chrysene) ng m-3. In Figure 2 can be seen a 16 EPA-PAHs standard solution (8 ng µL-1) chromatogram obtained with analytical conditions described before.
3. Results and DiscussionsPAH mean concentrations (TF + PUF) obtained
on both monitoring stations studied are shown on Figures 3A and 3B. The figures show that in both monitoring stations, PAHs concentration obtained with cartridges Config 1 is higher than Config 2, indicating that in Cartridge Config 1 TPAHs were captured, and in cartridge Config 2, PAHs
GP were captured by XAD-D.
Figures 1A and 1B also show that the PAHs concentration profile obtained in LE and UCT are similar. ANOVA analysis of the data indicate that there is no significant difference between the two sampling sites, meaning that distance between both monitoring stations analyzed is not relevant in terms of PAHs atmospheric concentrations.
To probe if the PAHs concentrations obtained with cartridge Config 1 and Config 2 are different from each other and to confirm the association between cartridges configurations, the results were submitted to cluster analysis (Figure 4).

Application of a new methodology for determining Polycyclic Aromatic Hydrocarbons (PAHs) Cereceda-Balic F et al.
Scientia Chromatographica 2016; 8(3):189-195 193
Figure 3. A) PAHs mean concentration (FT+PUF) LE; B) PAHs mean concentration (FT+PUF) UCT.
Figure 4. Dendogram form cluster analysis for PAHs concentration (TF + PUF) in Temuco 2008 samples.
Figure 4 clearly shows that all samples taken in Temuco´s monitoring campaign are grouped in two clusters, samples taken with cartridges Config 1 at both monitoring stations are grouped in one cluster
and all samples taken using Config 2 are grouped in another cluster, meaning that both cartridge configurations are different and they could be used complementarily.
Cereceda-Balic F et al. Application of a new methodology for determining Polycyclic Aromatic Hydrocarbons (PAHs)
194 Scientia Chromatographica 2016; 8(3):189-195
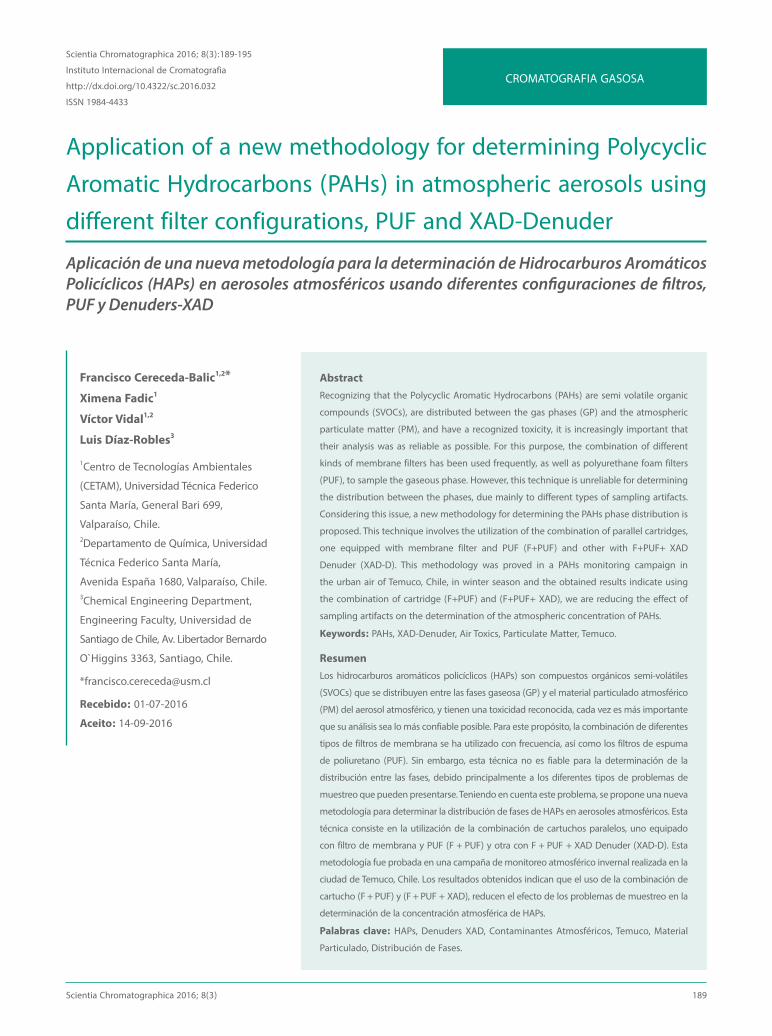
Figure 5. Phase distribution of PAHs from LE monitoring station calculated from equation 1, Phenanthrene (PHE) concentration was shown in right axis due to its high concentration.
To prove that both cartridge configurations are complementary, phase distribution of PAHs was calculated according to Equation 1 (Figure 5).
Figure 5 shows that PAHsGP
represents in average 57% of TPAHs mean concentrations. On Temuco 2008 cartridge Config 1, PAHs determined on PUF represent in average 62% of TPAHs, meaning overestimation on the phase distribution. Considering that phase distribution of PAHs is commonly obtained directly from cartridge type Config 1, (inspite of the sampling artifacts that produce over or sub-estimation in the PAHs concentration and their phase distribution[8-11]) where PAHs
MP are determined directly from TF and PAHs
GP
directly from PUF. Then, using the combination of cartridge Config 1 and Config 2, we are reducing the effect of sampling artifacts on the determination of the atmospheric concentration of PAHs.
4. ConclusionsFor both studied monitoring stations, PAHs
concentration obtained with cartridges equipped
with FT+PUF were higher than cartridges equipped
with FT+PUF+XAD-D, indicating that in Cartridge
FT+PUF, TPAHs were captured, and in cartridge
FT+PUF+XAD-D, PAHs in gas phase were captured by
XAD-D.
PAH concentration profile obtained in Las
Encinas and UCT monitoring stations had no significant
differences between them, meaning that distance and
altitude between both monitoring stations analyzed is not
relevant in terms of PAHs atmospheric concentrations.
Both cartridges configurations used in this
study (FT+PUF and FT+PUF+XAD-D) are significant
different from each other (95% confidence) indicating
they could be used complementarily.
Using the combination of cartridge Config 1
(FT+PUF) and Config 2 (FT+PUF+XAD-D), sampling
artifacts on the determination of the atmospheric
concentration of PAHs can be reduced.

Application of a new methodology for determining Polycyclic Aromatic Hydrocarbons (PAHs) Cereceda-Balic F et al.
Scientia Chromatographica 2016; 8(3):189-195 195
AcknowledgmentsAuthors thank to FONDECYT Project N° 1120791, FONDECYT N° 1131028, FONDECYT N° 1161793 and
FONDEF D09-I-1070 projects for their financial support and for logistic support the Environmental Ministry of Chile.
References[1] Cereceda-Balic. F., Fadic. X., Llanos. A., Domínguez. A., Guevera. J., Vidal. V., Diaz-Robles. L, Schiappacasse. L., Etcharren.
P., Obtaining polycyclic aromatic hydrocarbon concentration ratios and molecular markers for residential wood combustion: Temuco, a case study. Journal of the Air & Waste Management Association, 2012. 62(1):44–51.
[2] Delgado-Saborit, J. M., Stark, C., and Harrison, R. M., Use of a Versatile High Efficiency Multiparallel Denuder for the Sampling of PAHs in Ambient Air: Gas and Particle Phase Concentrations, Particle Size Distribution and Artifact Formation. Environmental Science and Technology, 2014, 48: 499−507.
[3] Mader, B.T. and J.F. Pankow, Gas/Solid Partitioning of Semivolatile Organic Compounds (SOCs) to Air Filters. 3. An Analysis of Gas Adsorption Artifacts in Measurements of Atmospheric SOCs and Organic Carbon (OC) When Using Teflon Membrane Filters and Quartz Fiber Filters. Environmental Science & Technology, 2001. 35(17): p. 3422-3432.
[4] Cereceda-Balic, F., E. Kleist, H. Prast, H. Schlimper, H. Engel, and K. Günther, Description and evaluation of a sampling system for long-time monitoring of PAHs wet deposition. Chemosphere, 2002. 49(3): p. 331-340.
[5] EPA Compendium Method TO-13A, Determination of Polycyclic Aromatic Hydrocarbons (PAHs) in Ambient Air Using Gas Chromatography/Mass Spectrometry (GC/MS), 1999, EPA/625/R-96/010b.
[6] Paolini,V., Guerriero E., Bacaloni, A., Rotatori, M., Benedetti, P., Mosca, S., 2016, Simultaneous Sampling of Vapor and Particle-Phase Carcinogenic Polycyclic Aromatic Hydrocarbons on Functionalized Glass Fiber Filters. Aerosol and Air Quality Research, 16: 175–183.
[7] Melymuk, L., Bohlin, P., Sanka, O., Pozo, K., Klaanova, J., 2014. Current challenges in air sampling of semivolatile organic contaminants: sampling artifacts and their influence on data comparability. Environmental Science and Technology. 48: 14077-14091.
[8] Diaz-Robles, L.A., J.C. Ortega, J.S. Fu, G.D. Reed, J.C. Chow, J.G. Watson, and J.A. Moncada-Herrera, A hybrid ARIMA and artificial neural networks model to forecast particulate matter in urban areas: The case of Temuco, Chile. Atmospheric Environment, 2008. 42(35): p. 8331-8340.
[9] Sanhueza, P., C. Vargas, and P. Mellado, Impact of air pollution by fine particulate matter (PM10) on daily mortality in Temuco, Chile. Revista Medica De Chile, 2005. 134(6): p. 754-761.
[10] Lewtas, J., Y. Pang, D. Booth, S. Reimer, D.J. Eatough, and L.A. Gundel, Comparison of Sampling Methods for Semi-Volatile Organic Carbon Associated with PM2.5. Aerosol Science and Technology, 2001. 34(1): p. 9-22.
[11] Sanderson, E.G. and J.P. Farant, Atmospheric Size Distribution of PAHs: Evidence of a High-Volume Sampling Artifact. Environmental Science & Technology, 2005. 39(19): p. 7631-7637.