application of gis technologies in monitoring · pdf fileapplication of gis technologies in...
TRANSCRIPT

485
Application of GIS Technologies in Monitoring Biodiversity
(Case study in Siriu, Ceahlau, Lunca Muresului Protected Sites, Romania)
Simona STAICULESCU
Abstract
Recently, there has been a revolution in the availability of spatial information and in the development of applications and tools for managing geographical content in any field of interest and in particular, in the field of Biodiversity – the variety of ecosystems, species and genes, which is the world’s natural capital and its conservation is a key environmental priority for the EU. Information needs for biodiversity are many and varied and an important tool for monitoring biodiversity is a geographic information system (GIS), which accommodates large varieties of spatial and non-spatial data regarding the biological diversity.
This paper provides a description of a workflow related to a case study of a GIS Technologies – based approach applied in monitoring biodiversity in a few Romanian protected sites. The output is a GIS based integrated monitoring system, implemented according to the INSPIRE data specifications (http://inspire.jrc.ec.europa.eu, Annex I) developed so far, in terms of geodatabase schema, dissemination products and reporting mechanisms.
1 Introduction
In the context of EU legislation, as a response to the European Union requests, regarding the reports on biodiversity conservation in all Member States Protected Areas (Article 6, Habitats Directive, 1992; Articles 9 and 12, Birds Directive, 2009), assessing the need for biodiversity information has been addressed by managers of protected areas, scientists, decision makers, researchers and many others. Most of these people involved in protected areas’ work are aware that the absence of reliable information can have the most serious consequences for the understanding of biodiversity and that they need better information for decision making, which must be equally accessible to all interested parties and integrated with other relevant information. However, the situation is still critical because the currently available Romanian biodiversity data is in the form of physical text documents, although, the biodiversity data needed to meet the conservation strategy must be centralised in the form of spatial databases and must be shared and disseminated in such a manner so as to allow interoperability and interconnection between networks.
This is where the ability of using GIS technology as a tool to monitor the habitat change, to track wildlife demographics, to predict future land and resources, to use and share all this results according to the EU policies, is essential to conservation goals and practices.
Jekel, T., Car, A., Strobl, J. & Griesebner, G. (Eds.) (2012): GI_Forum 2012: Geovizualisation, Society and Learning. © Herbert Wichmann Verlag, VDE VERLAG GMBH, Berlin/Offenbach. ISBN 978-3-87907-521-8.
S. Staiculescu 486
This study, focused here on a Romanian protected area, but successfully applied in many other related projects, exposes a solution for the above situation, in terms of using GIS technologies in each field of research, for collecting, centralizing, analysing and sharing biodiversity data and new field data in a standardized mode, in order to address biodiversity assessment and monitoring purposes. Based on a GIS approach, the study outputs a GIS biodiversity monitoring system, adopted by many protected areas in Romania, which integrates (a) a complete database of Biodiversity information related to the study area, which supports the maps and many other cartographic products; (b) the analysis methodology that allows to assess the key characteristics and the conservation status, which designate the area as protected; (c) a geoportal application which is ensuring interoperability and expanding the access to biodiversity spatial data, maps, metadata, web services and applications as part of the Romanian national spatial infrastructure. A standardised set of reports, presentations and graphics have been created for each component of the system, based on the Common Monitoring Standards (http://www. jncc.gov.uk/page-2217).
The site under investigation, which is related to this case-study, is a 11.300 Ha protected area named Siriu, located in the northern part of Buzau County, in Romania, managed by the Buzau County Council. The area was officially declared as a protected site, by the order of the Ministry of Environment No. 1964/2007, regarding the declaration of protected sites as integrated part of NATURA 2000 European ecological network.
2 Input Data and Data Processing
Data collection and processing proved to be very challenging for us during this project. Most of the data related to biodiversity in the study area was missing or lacking information. Firstly, no country has a comprehensive species list for any of the species-rich groups, and furthermore, the costs of undertaking the preparation of such a list, which generally requires work from scratch, will generally be prohibitive. However, for organisms that have been selected as priorities for inventorying, ascertaining what is already known in the country was the essential first step. Secondly, all the background data (topographical data) and the data needed for the morphometric analysis were missing or they were out of date. Data sources that we had to gather fall into the following categories: (1) nomenclatures, or catalogues covering the literature of organisms names including countries of origin and updating issues; (2) checklists and biotas (floras and faunas), which are complementary tools that provide a basis for a full account of species including descriptions and keys; (3) the associations between plants species and habitats; (4) topographic data (hydrography, transportation); (5) administrative data; (6) Land cover data; (7) reference grids (EEA grids, with different cell size used to mark the presence/absence of a species or habitat); (8) soil data (needed for analysing the species and habitats distribution); (9) geology data; (10) the data needed for morphometric analysis (slope, curvature, aspect, altitude); (11) Landsat Imagery (used for classification); (12) currently available aerial photo (for feature extraction), etc.
The first step needed to be done in founding the biodiversity monitoring system, was to gather all the above necessary information, using GIS automation tools where possible (like importing or loading from different formats to GIS known formats), GIS spatial analysis
Application of GIS Technologies in Monitoring Biodiversity 487
tools (to create slope, aspect, flow direction, curvature rasters) or just basic GIS data collection tools (like digitizing features or manually collecting attributive data related to species and habitats). For this purpose we manually collected the list of species and habitats with specific descriptions, codes and groups or associations, related to Romania, using the Romanian Manual for Interpretation of EU Habitats, and other Natura 2000 specialized documentation (NICOLAE et al. 2007). The aerial images (1:5000 scale, flight 2005 year) and unclassified topographic map, scale 1:100000 were used for feature extraction of all topographic data (hydrography, transportation, land cover). Soils and geology data were derived updating the available sources. We generated all the data needed for morphometric analysis accordingly and we calculated the EEA recommended grid reference system, for Romania (cf. http://www.eea.europa.eu/data-and-maps/data/eea-reference-grids). All the above data were sorted according to type as spatial or non-spatial. The spatial datasets were digitized, edited and made usable as GIS data layers using ArcGIS technologies.
3 Methodology and Methods
In this phase of our study, first the above input data was modelled accordingly using GIS applications (and best practices available at http://www.esri.com/industries), being integrated into a centralised, geodatabase structure. Starting with the geodatabase structure, existing data sources and a solid know-how, we developed a workflow for biodiversity data captured from the field, and specialized tools in order to support this workflow. Throughout the data capturing process we used ArcGIS tools to analyse all the spatial and non-spatial data, and created maps that gave us a feedback regarding biodiversity distribution (habitats, but also species and changes in distribution) in the study area.
A project management approach was used to develop the system and especially to complete this phase, relying on a multidisciplinary team of GIS and information technology professionals, biology experts, environment experts, real property accountants, environment authorities and community planners.
3.1 Establishing GIS database for Biodiversity
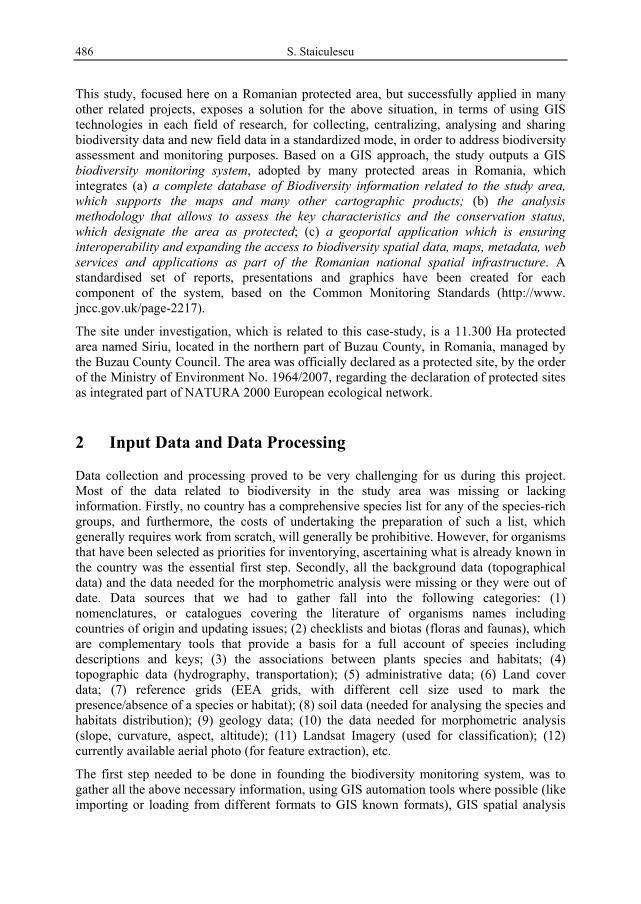
The data was sorted according to a type as spatial or non-spatial in a geodatabase structure, designed using GIS software according to INSPIRE Directive – Annex I, INSPIRE_ DataSpecification_PS_v3.1 (http://inspire.jrc.ec.europa.eu) and developed so far, to support all necessary driven project workflows. The attributes and non-spatial data were associated within the spatial database as appropriate (http://www.eea.europa.eu/data-and-maps/ data/corine-biotopes). The species names were revised using specialized documenttation and the automation rules as well as geodatabase behaviours, were created to facilitate the editors work and data integration. The geodatabase schema (see figure 1) includes 9 spatial themes (land cover; hydrography; morphology-altitude, aspect, curvature; transportation; pedology-soils; geology; biodiversity-habitats distribution areas, species distribution areas, habitats and species field surveys; habitats and species threats areas; field surveys on habitats and species threats, etc.; Grid-EEA grid reference system used for mapping the distribution of species and habitats), which group spatial data according to its purpose and a few non-spatial tables (Habitats, Species, Plants association), storing information related to species and habitats. Once the geodatabase schema was created (passing through a
S. Staiculescu 488
conceptual, logical and physical model), it was optimized properly in order to support all the workflows required by the project. All the available data was migrated into the geodatabase schema and using a Microsoft SQL Server database tied to ArcGIS through ArcSDE; a GIS repository was created for the whole study area, consolidating data from disparate sources and formats.
Fig. 1: GEODATABASE Physical Model
Implementing this enterprise geodatabase – an intelligent environment, is a big step ahead for the evolution of this study, ensuring interoperability and enabling accessibility.
We also implemented some QA/QC mechanisms in order to assure the accuracy and quality of the existing data but also the data acquired from the field. The QA/QC process included two phases: an automatic data check and a visual data check. The automatic data check, was done by creating and applying GIS topological rules to spatial data, meant to model the behaviour of the related entities in the real world (like habitats areas or species areas, must not overlap and must not have gaps, rivers must not have dangles and must not overlap, etc.). The results obtained after validating the topologies, led us to a 40% of inaccuracy in data, which required automatic or manual error corrections. Most of the errors were caused by the improper way of using GIS editing tools during the data collection process and they were fixed using GIS Topology Error tools. The visual data check, was a time-consuming process directed by a field expert biologist, requiring detailed visual investigation and exploration of field data using aerial imagery and other basemaps obtained in the previous phase. The findings in the end of this second QA/QC phase led us to a 90% of data accuracy and 85% of data consistency. Data validation process was successfully passed after a few more fields surveys which ensured data accuracy and after the completion of the missing data attributes. As the data was cleaned and assembled, we began to use it for next step of the analysis and modelling in order to be able to extract the information we needed, and of course we started to use it as a launching pad for the specialized applications included in the designed biodiversity monitoring system.
3.2 Biodiversity Field Data Acquisition
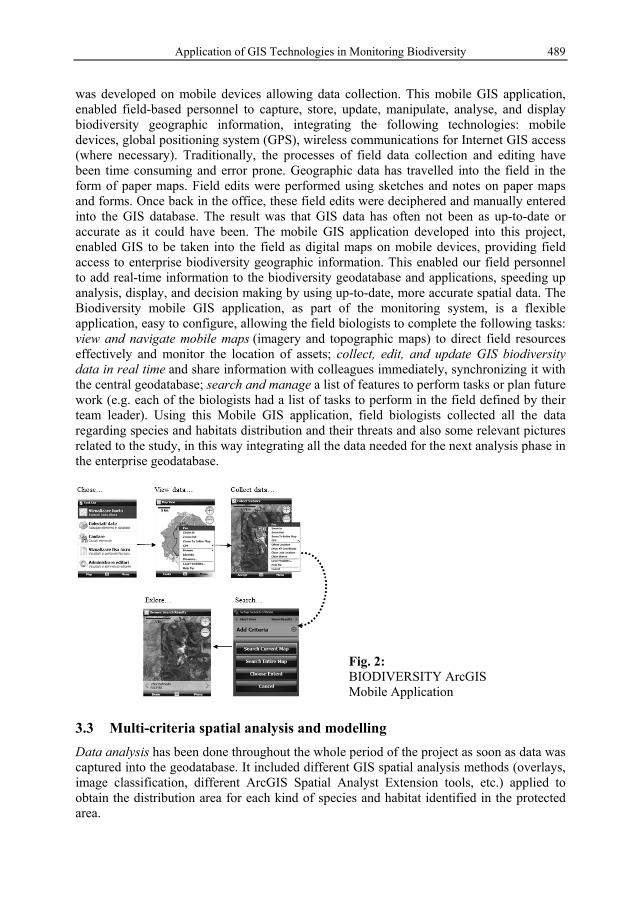
Data acquisition phase was the most time costly process including different field biologists who have been studying the habitats and species characteristics at a high level. They used GPS Mobile devices in the field for collecting data about species and habitats and their specific characteristics, but also potential threats for protected species and habitats (like excessive grazing, landslide, deforestation, etc.). To facilitate the field surveys, as a component of the biodiversity monitoring system, a mobile GIS application (see figure 2)
Application of GIS Technologies in Monitoring Biodiversity 489
was developed on mobile devices allowing data collection. This mobile GIS application, enabled field-based personnel to capture, store, update, manipulate, analyse, and display biodiversity geographic information, integrating the following technologies: mobile devices, global positioning system (GPS), wireless communications for Internet GIS access (where necessary). Traditionally, the processes of field data collection and editing have been time consuming and error prone. Geographic data has travelled into the field in the form of paper maps. Field edits were performed using sketches and notes on paper maps and forms. Once back in the office, these field edits were deciphered and manually entered into the GIS database. The result was that GIS data has often not been as up-to-date or accurate as it could have been. The mobile GIS application developed into this project, enabled GIS to be taken into the field as digital maps on mobile devices, providing field access to enterprise biodiversity geographic information. This enabled our field personnel to add real-time information to the biodiversity geodatabase and applications, speeding up analysis, display, and decision making by using up-to-date, more accurate spatial data. The Biodiversity mobile GIS application, as part of the monitoring system, is a flexible application, easy to configure, allowing the field biologists to complete the following tasks: view and navigate mobile maps (imagery and topographic maps) to direct field resources effectively and monitor the location of assets; collect, edit, and update GIS biodiversity data in real time and share information with colleagues immediately, synchronizing it with the central geodatabase; search and manage a list of features to perform tasks or plan future work (e.g. each of the biologists had a list of tasks to perform in the field defined by their team leader). Using this Mobile GIS application, field biologists collected all the data regarding species and habitats distribution and their threats and also some relevant pictures related to the study, in this way integrating all the data needed for the next analysis phase in the enterprise geodatabase.
Fig. 2: BIODIVERSITY ArcGIS Mobile Application
3.3 Multi-criteria spatial analysis and modelling
Data analysis has been done throughout the whole period of the project as soon as data was captured into the geodatabase. It included different GIS spatial analysis methods (overlays, image classification, different ArcGIS Spatial Analyst Extension tools, etc.) applied to obtain the distribution area for each kind of species and habitat identified in the protected area.
S. Staiculescu 490
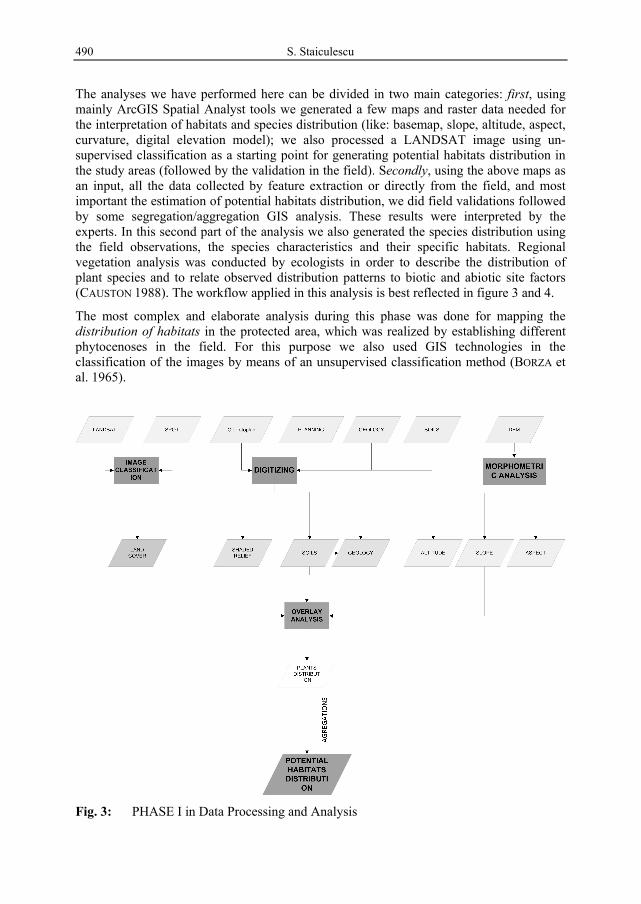
The analyses we have performed here can be divided in two main categories: first, using mainly ArcGIS Spatial Analyst tools we generated a few maps and raster data needed for the interpretation of habitats and species distribution (like: basemap, slope, altitude, aspect, curvature, digital elevation model); we also processed a LANDSAT image using un-supervised classification as a starting point for generating potential habitats distribution in the study areas (followed by the validation in the field). Secondly, using the above maps as an input, all the data collected by feature extraction or directly from the field, and most important the estimation of potential habitats distribution, we did field validations followed by some segregation/aggregation GIS analysis. These results were interpreted by the experts. In this second part of the analysis we also generated the species distribution using the field observations, the species characteristics and their specific habitats. Regional vegetation analysis was conducted by ecologists in order to describe the distribution of plant species and to relate observed distribution patterns to biotic and abiotic site factors (CAUSTON 1988). The workflow applied in this analysis is best reflected in figure 3 and 4.
The most complex and elaborate analysis during this phase was done for mapping the distribution of habitats in the protected area, which was realized by establishing different phytocenoses in the field. For this purpose we also used GIS technologies in the classification of the images by means of an unsupervised classification method (BORZA et al. 1965).
Fig. 3: PHASE I in Data Processing and Analysis

Application of GIS Technologies in Monitoring Biodiversity 491
Fig. 4: PHASE II in Data Processing and Analysis
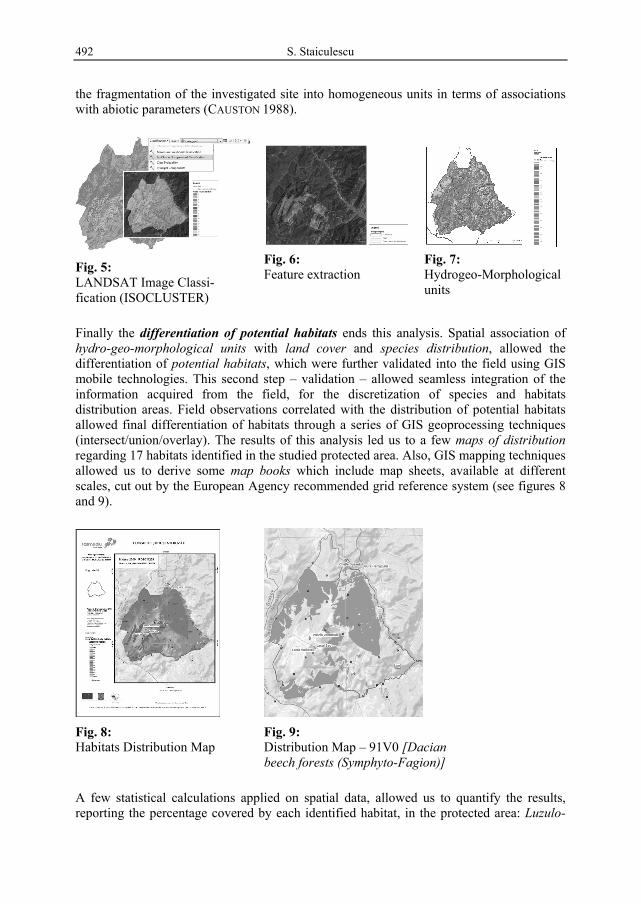
The first step was the LANDSAT image classification (see figure 5) using ArcGIS Software (Spatial Analyst Image Classification capability – ISO CLUSTER Unsupervised Classifi-cation). Changes were directly classified within multi-temporal images and numerous sub-classes created for each final class. Having the reclassified raster image we applied a Majority Filter generalization tool on it, only to replace cells in raster based on the majority of their contiguous neighbouring cells. Multiple iterations were run using Majority Filter and sub-classes from the final iteration were merged using ArcGIS editing tools, in order to eliminate any polygon with an area smaller than 2 ha. The study led to 18 different classes for land cover. The analysis continued with the validation of the polygons obtained by raster-vector conversion of the image classification output, using the digitized land use and the aerial photo which allowed us visual classification at a high resolution image to identify the boundaries of different elements that could be distinguished on the image (see figure 6). So, in this first phase, we concluded the classification of habitats in to a few main classes and sub-classes.
Another phase in this process, supposed collecting all the existing specialized information regarding the chorology of fauna and flora species (CRISTEA et al. 2004). This activity allowed our biology experts to identify and integrate some of the currently available information in their analysis, for each group of species and habitat. This was correlated with direct observations into the field, allowing an estimation of trends in evolution, relative to the citation point, considered as a reference state (BRAUN-BLANCQUET 1964). An intermediate phase was the land morphometric analysis – the differentiation of 1st order parameters (slope, aspect, flow direction) and those derived, of 2nd order (flat curvature, profile curvature, total curvature) – made with GIS techniques, which allows meshing. Next step was the differentiation of hydro-geo-morphological units (see figure 7). The overlay GIS analysis techniques (Intersects), applied to the layers containing the distribution of abiotic parameters (geology, curvature, slope) established in the previous activities, allows
S. Staiculescu 492
the fragmentation of the investigated site into homogeneous units in terms of associations with abiotic parameters (CAUSTON 1988).
Fig. 5: LANDSAT Image Classi-fication (ISOCLUSTER)
Fig. 6: Feature extraction
Fig. 7: Hydrogeo-Morphological units
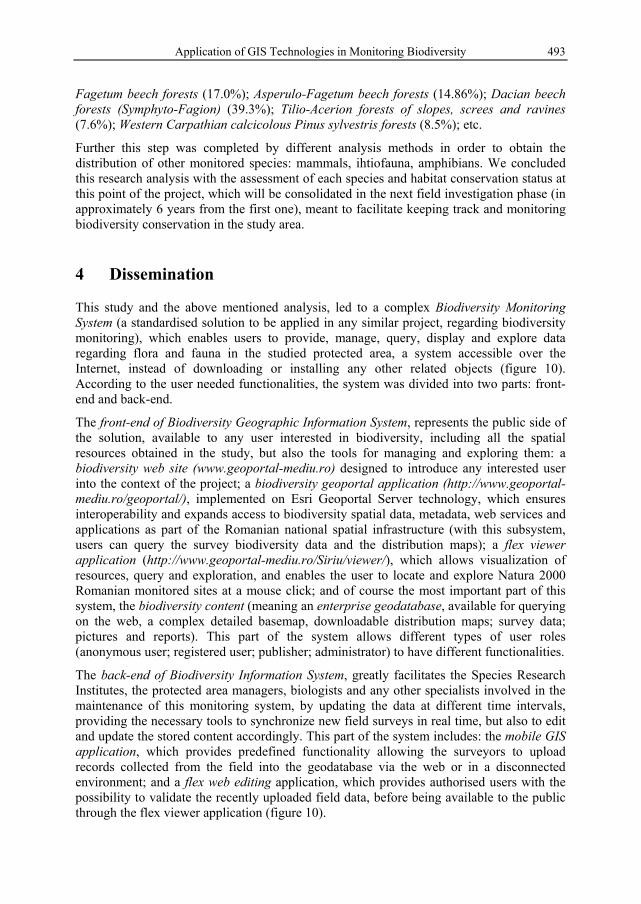
Finally the differentiation of potential habitats ends this analysis. Spatial association of hydro-geo-morphological units with land cover and species distribution, allowed the differentiation of potential habitats, which were further validated into the field using GIS mobile technologies. This second step – validation – allowed seamless integration of the information acquired from the field, for the discretization of species and habitats distribution areas. Field observations correlated with the distribution of potential habitats allowed final differentiation of habitats through a series of GIS geoprocessing techniques (intersect/union/overlay). The results of this analysis led us to a few maps of distribution regarding 17 habitats identified in the studied protected area. Also, GIS mapping techniques allowed us to derive some map books which include map sheets, available at different scales, cut out by the European Agency recommended grid reference system (see figures 8 and 9).
Fig. 8: Habitats Distribution Map
Fig. 9: Distribution Map – 91V0 [Dacian beech forests (Symphyto-Fagion)]
A few statistical calculations applied on spatial data, allowed us to quantify the results, reporting the percentage covered by each identified habitat, in the protected area: Luzulo-
Application of GIS Technologies in Monitoring Biodiversity 493
Fagetum beech forests (17.0%); Asperulo-Fagetum beech forests (14.86%); Dacian beech forests (Symphyto-Fagion) (39.3%); Tilio-Acerion forests of slopes, screes and ravines (7.6%); Western Carpathian calcicolous Pinus sylvestris forests (8.5%); etc.
Further this step was completed by different analysis methods in order to obtain the distribution of other monitored species: mammals, ihtiofauna, amphibians. We concluded this research analysis with the assessment of each species and habitat conservation status at this point of the project, which will be consolidated in the next field investigation phase (in approximately 6 years from the first one), meant to facilitate keeping track and monitoring biodiversity conservation in the study area.
4 Dissemination
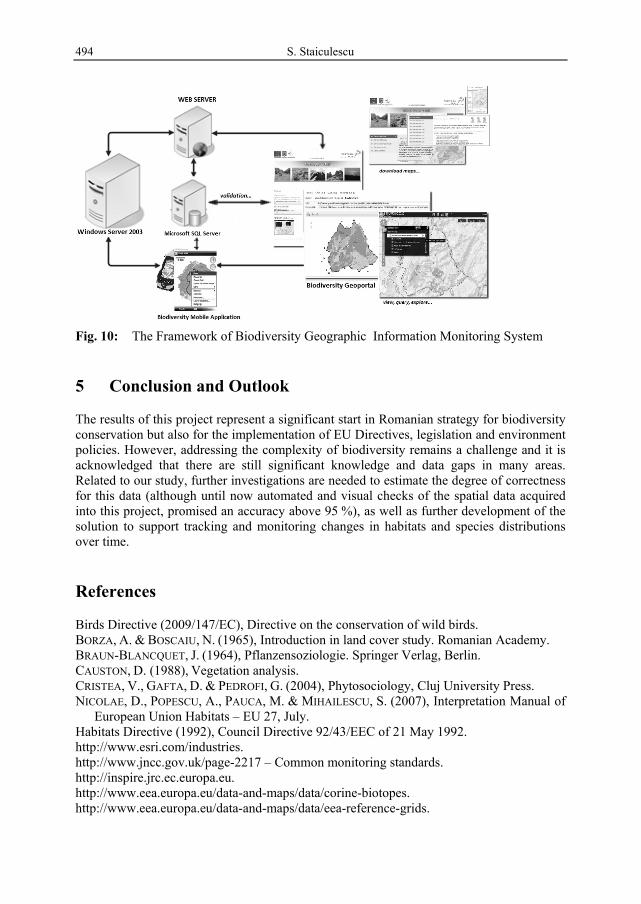
This study and the above mentioned analysis, led to a complex Biodiversity Monitoring System (a standardised solution to be applied in any similar project, regarding biodiversity monitoring), which enables users to provide, manage, query, display and explore data regarding flora and fauna in the studied protected area, a system accessible over the Internet, instead of downloading or installing any other related objects (figure 10). According to the user needed functionalities, the system was divided into two parts: front-end and back-end.
The front-end of Biodiversity Geographic Information System, represents the public side of the solution, available to any user interested in biodiversity, including all the spatial resources obtained in the study, but also the tools for managing and exploring them: a biodiversity web site (www.geoportal-mediu.ro) designed to introduce any interested user into the context of the project; a biodiversity geoportal application (http://www.geoportal-mediu.ro/geoportal/), implemented on Esri Geoportal Server technology, which ensures interoperability and expands access to biodiversity spatial data, metadata, web services and applications as part of the Romanian national spatial infrastructure (with this subsystem, users can query the survey biodiversity data and the distribution maps); a flex viewer application (http://www.geoportal-mediu.ro/Siriu/viewer/), which allows visualization of resources, query and exploration, and enables the user to locate and explore Natura 2000 Romanian monitored sites at a mouse click; and of course the most important part of this system, the biodiversity content (meaning an enterprise geodatabase, available for querying on the web, a complex detailed basemap, downloadable distribution maps; survey data; pictures and reports). This part of the system allows different types of user roles (anonymous user; registered user; publisher; administrator) to have different functionalities.
The back-end of Biodiversity Information System, greatly facilitates the Species Research Institutes, the protected area managers, biologists and any other specialists involved in the maintenance of this monitoring system, by updating the data at different time intervals, providing the necessary tools to synchronize new field surveys in real time, but also to edit and update the stored content accordingly. This part of the system includes: the mobile GIS application, which provides predefined functionality allowing the surveyors to upload records collected from the field into the geodatabase via the web or in a disconnected environment; and a flex web editing application, which provides authorised users with the possibility to validate the recently uploaded field data, before being available to the public through the flex viewer application (figure 10).
S. Staiculescu 494
Fig. 10: The Framework of Biodiversity Geographic Information Monitoring System
5 Conclusion and Outlook
The results of this project represent a significant start in Romanian strategy for biodiversity conservation but also for the implementation of EU Directives, legislation and environment policies. However, addressing the complexity of biodiversity remains a challenge and it is acknowledged that there are still significant knowledge and data gaps in many areas. Related to our study, further investigations are needed to estimate the degree of correctness for this data (although until now automated and visual checks of the spatial data acquired into this project, promised an accuracy above 95 %), as well as further development of the solution to support tracking and monitoring changes in habitats and species distributions over time.
References
Birds Directive (2009/147/EC), Directive on the conservation of wild birds. BORZA, A. & BOSCAIU, N. (1965), Introduction in land cover study. Romanian Academy. BRAUN-BLANCQUET, J. (1964), Pflanzensoziologie. Springer Verlag, Berlin. CAUSTON, D. (1988), Vegetation analysis. CRISTEA, V., GAFTA, D. & PEDROFI, G. (2004), Phytosociology, Cluj University Press. NICOLAE, D., POPESCU, A., PAUCA, M. & MIHAILESCU, S. (2007), Interpretation Manual of
European Union Habitats – EU 27, July. Habitats Directive (1992), Council Directive 92/43/EEC of 21 May 1992. http://www.esri.com/industries. http://www.jncc.gov.uk/page-2217 – Common monitoring standards. http://inspire.jrc.ec.europa.eu. http://www.eea.europa.eu/data-and-maps/data/corine-biotopes. http://www.eea.europa.eu/data-and-maps/data/eea-reference-grids.