application of lean tools (vsm, smed, … · minimizing the lead time in gear manufacturing process...
TRANSCRIPT

International Journal of Scientific & Engineering Research, Volume 7, Issue 5, May-2016 53 ISSN 2229-5518
IJSER © 2016 http://www.ijser.org
APPLICATION OF LEAN TOOLS (VSM, SMED, KAIZEN) IN MINIMIZING THE LEAD TIME IN GEAR MANUFACTURING
PROCESS KARTHICK.N1, HARI PRASAD.V2 , GOPI.S3 , BALAJI.K4
1 Assistant Professor, Department of Mechanical Engineering, Knowledge Institute of Technology, Tamil nadu, India.
2Student , Department of Mechanical Engineering, Knowledge Institute of Technology, Tamil nadu, India.
3Student, Department of Mechanical Engineering, Knowledge Institute of Technology, Tamil nadu, India.
4Student, Department of Mechanical Engineering, Knowledge Institute of Technology, Tamil nadu, India.
SYNOPSIS
Lean manufacturing is a process improvement
methodology that focuses on eliminating non-value
added activity, continuous improvement in the process,
minimizing cycle time and lead time, reducing inventory
level, lower the production cost, and increasing
productivity
.
The project is carried out in Rydon industries
private limited, Coimbatore. This industry produces
variety of products such as sprocket, spur gear, helical
gear and gear housing etc. In this project work spur gear
manufacturing is taken for study. At first different
manufacturing processes (cutting the bar stock, OD
turning, center drilling followed by boring, CNC
machining, gear hobbing, deburring, keyway slotting and
gear grinding) are identified. Then Cycle time including
machining and non machining time is calculated using
simple stop watch method .Then takt time and lead time
are calculated and value stream mapping has been plotted
for the current state. From this bottle neck processes are
found based on the cycle time above the takt time.
From the above, it is found the cutting,
hobbing, drilling and slotting process are bottle neck
processes. From the analysis it is found that the setup
time of keyway slotting consumes more time. Using
SMED concept single pallet is converted to two pallet. In
cutting process continuous improvement technique
Kaizen is used to change single piece cutting to two bar
cutting at a time. With the implementation of these lean
tools total lead time of the product can be reduced and
the customer demand can be met. Finally the future state
value stream map is drawn.
INTRODUCTION
1.1 LEAN MANUFACTURING Lean Manufacturing, also called Lean
Production, is a set of tools and methodologies that aims
to improve the productivity, quality and reduce the cost
through minimizing the non-value added time, cycle
time, lead time. These aims are achieved by the
implementation of various lean tools and concepts. The
explanation of various lean tools and concept is given
below
LEAN TOOLS AND CONCEPTS
• Visual management
• Quality at the Source
• Kaizan
• Leveling (HEIJUNKA)
• Kanban
• Single minute exchange of die
(SMED)
• Five S’s
• Total productive maintenance
• Standard Work
• Poka Yoke
• Preventative Maintenance
IJSER

International Journal of Scientific & Engineering Research, Volume 7, Issue 5, May-2016 54 ISSN 2229-5518
IJSER © 2016 http://www.ijser.org
• Changeover/setuptime reduction
• Batch Size Reduction
• Overall Equip ment Effectiveness
(OEE)The above tools and concepts
have been explained below in detail.
Visual Management
Visual Management systems enable factory
workers to be well informed about production
procedures, status and other important information for
them to do their jobs as effectively as possible. Large
visual displays are generally much more effective means
of communication to workers on the factory floor than
written reports and guidelines.
Fig 1.1: Visual management Quality at the source
Quality at the Source, also called “Do It Right
the First Time”, means that quality should be built into
the production process in such a way that defects are
unlikely to occur in the first place – or insofar as they do
occur, they will be immediately detected.
The Five S’s
The Five S’s are some rules for workplace
organization which aim to organize each worker’s work
area for maximum efficiency.
1. Sort – Sort what is needed and what is not
needed so that the things that are frequently
needed are available nearby and as easy to find
as possible. Things which are less often used or
not needed should be relocated or discarded.
2. Straighten (or “Set in order”) – Arrange
essential things in order for easy access. The
objective is to minimize the amount of motion
required in order for workers to do their jobs.
3. Scrub (or “Shine”) – Keep machines and work
areas clean so as to eliminate problems
associated with un-cleanliness. In some
industries, airborne dust is among the causes of
poor product surface or color contamination.
To be more aware of dust, some companies
paint their working places in light colors and
use a high level of lighting.
4. Stabilize (or “Standardize”) – Make the first 3
S’s a routine practice by implementing clear
procedures for sorting, straightening and
scrubbing.
5. Sustain – Promote, communicate and train in
the 5 S’s to ensure that it is part of the
company’s corporate culture. This might
include assigning a team to be responsible for
supervising compliance with the 5 S’s.
Fig 1.2 Five s
Preventative Maintenance
Preventative Maintenance is a series of routines,
procedures and steps that are taken in order to try to
identify and resolve potential problems before they
happen. In Lean Manufacturing, there is a strong
emphasis on preventative maintenance which is essential
for minimizing machine downtime due to breakdowns
and unavailability of spare parts.
Production levelling (heijunka)
Production leveling is a means of stabilizing
production volume and variety by consolidating the total
number of customer orders, and then spreading out their
production in an even manner through-out the day. This
is done to mitigate against the variation in customer
demand that happens on a daily basis. The even
spreading-out of production ensures a high order
fulfillment rate because variety and volume requirements
are catered for. Heijunka also ensures that the internal
production is balanced, and that the established capacity
is not over or under-utilized.
IJSER

International Journal of Scientific & Engineering Research, Volume 7, Issue 5, May-2016 55 ISSN 2229-5518
IJSER © 2016 http://www.ijser.org
Changeover/setup time reduction
Lean Manufacturing aims to reduce unnecessary
downtime due to machine setup or product changeovers
since machine downtime is a significant source of
unnecessary waste. This requires a culture of continuous
improvement in which the company is continuously
trying to find ways to reduce changeover and setup
times.
Value Stream Mapping (VSM)
Value stream mapping is a lean-management
method for analyzing the current state and designing a
future state for the series of events that take a product or
service from its beginning through to the customer. At
Toyota, it is known as "material and information
flow mapping".
Value stream mapping has supporting methods
that are often used in Lean environments to analyze and
design flows at the system level
Total Productive Maintenance (TPM)
Total Productive Maintenance (TPM) assigns
basic preventative maintenance work including
inspection, cleaning, lubricating, tightening and
calibration to the production workers who operate the
equipment. TPM clearly assigns responsibility to
workers to proactively identify, monitor and correct the
causes of problems leading to unnecessary machine
downtime. By allocating this responsibility to the
machine operators, maintenance problems are less likely
to occur and therefore machine downtime can be
reduced. This also requires the operators to frequently
update to the maintenance team about the machine
condition so that potential technical problems could be
discovered on a timely basis and prevented.
Fig 1.3 Total productive maintenance (TPM)
As explained above several lean tools and
concepts are available for the elimination of waste,
reduction of lead time, cycle time, reducing inventory
level and for increasing productivity. This project is
focus on following points.
1.2 Focus and objectives
The main focus of the project is to reduce the lead
time in a manufacturing process, by analyzing the cycle
time for each of the process and identifying the critical
process in the manufacturing line. Then identification of
value added and non value added activities in process
and to reduce non value added activities to increase the
productivity in it.
• To increase the productivity of the industry so
that the demands are met.
• To reduce the wastes leading to reduced
expenditure.
• To eliminate the bottlenecks in the production
line.
• To increase the efficiency of the process by
reducing the non-value added activities.
The above given focus is carried in the project through
the following objectives
With the above focus the objective is being followed
• Study the process flow in the production line of
a manufacturing.
• Estimate the cycle time for each manufacturing
processes.
• Create the current state value stream map with
the cycle time.
• Find out the bottleneck in the current state
value stream map.
• Identifying the value added and non-value
added activities for the product (bottleneck).
• Apply lean tools to minimize non value added
activities.
• Create the future state value stream map and
compare the benefits (Production time).
IJSER

International Journal of Scientific & Engineering Research, Volume 7, Issue 5, May-2016 56 ISSN 2229-5518
IJSER © 2016 http://www.ijser.org
LITRATURE REVIEW
M. Kemal Karasu et al (2013) discussed on the
improvement of injection molding die changeover time
reduction via Taguchi empowered SMED. The setup
time of the mould before SMED implementation is about
30-40% of the total time. Setup time data for the mould
is studied and all activities involved are been recorded
through video recorder and listed to evaluate via ECRS
(eliminate, combine, re-arrange and simplify). SMED
concept is implemented and setup time has been reduced
to 5 to 10%. [1]
Mohammed Ali Almomani et al (2013)
proposed an approach for setup time reduction through
Single Minute Exchange Die (SMED) and Multiple
Criteria Decision-Making techniques (MCDM) in PVC
pipes extruder process through the following steps.
• Phase 1: Mapping the current state map
• Phase 2: Classifying activities as external and
internal setups
• Phase 3: Transferring internal to external
activities, wherever it is possible
• Phase 4: Streamline all internal and external
activities
In this work it is found that MCDM techniques
are more effective in selecting the best setup time
technology. [2]
K. Venkataraman et al (2014) implemented
SMED concept in crankshaft manufacturing system. In
this work following problems were identified more
inventory between the workstations, more scrap, high
cycle time and more number of workers. Earlier the flow
of material between each station was in zig-zag manner
as shown in the figure 2.1.
Fig 2.1: Manufacturing cell with a zig-zag flow of
material
Fig 2.2: Manufacturing cell with single piece flow
After analysis the material flow is been converted to
single piece flow in which single work piece movies at a
time which reduces the inventory level, cycle time and
reduces the number of worker. [3]
Fawaz A. Abdulmalek et al (2007) discussed
the case study about implementing lean principles in
steel mill. The value stream mapping has been prepared
first to identify the bottle neck process involved in the
steel mill. With this data push production system is been
converted to pull production system by the
implementation of lean tools like Just-in-time (JIT),
Kanban, Total Preventive Maintenance (TPM), Total
Quality Management (TQM) and Five‘S. After that a
detailed simulation model is been done using arena
software to evaluate the potential gains. The results are
been shown through future state map. [4]
Satish Tyagi et al (2015) focused on lean
thinking concepts in order to improve and develop the
product faster in gas turbine product. Value stream
IJSER

International Journal of Scientific & Engineering Research, Volume 7, Issue 5, May-2016 57 ISSN 2229-5518
IJSER © 2016 http://www.ijser.org
mapping was used to explore the waste, inefficiencies
and non-value added steps. It is found that most of the
time is spent on waiting for information, decisions or
processing over information or duplicate information,
rework, rework due to early release of information. After
value stream mapping Pareto diagram are used for
prioritization purpose after identifying the major
problems and ranking them. The figure 2.3 shows the
Pareto analysis of the various processes. [5]
Fig 2.3: Pareto analysis of each process with cost
involved
Benjamin Haefner et al (2014) adopted an
innovative approach called Quality Value Stream
Mapping (QVSM). QVSM is a procedure model,
complementing classical Value Stream Mapping with
specific quality related elements to systematically
visualize, analyze and improve quality issues within a
process chain. The presented method of QVSM consists
of four phases: preparation, quality value stream analysis
(QVSA), quality value stream design (QVSD) and
implementation as given below fig. The developed
method of Quality Value Stream Mapping is capable of
systematically visualizing, analyzing and optimizing
multistage manufacturing processes from a quality
assurance viewpoint. The advantages of QVSM were
demonstrated by means of an exemplary application of
the method in an industrial case study. [6]
Steps for Implementing Quality Value Stream
Mapping
Pierre E. C. Johansson et al (2013) focus on
Standardized Work in Automotive Industry in Sweden.
In this paper it describes the steps to implement the
standard work and continuous improvement (KAIZEN)
in automotive industries. In this competitive environment
it is very difficult for the company to withstand, now
days the market situation is cost needs to be minimized
and quality should be increased so standardized work
comes in to picture.
The steps shown in the figure is the steps for
implementation of standard work in the industry by
introducing the standard work productivity of the
industry could be improved but there will be no
flexibility in production. By implementing standardized
work the production is increased by 60% [7]
R. Sundar et al (2014) discussed the lean
manufacturing implementation techniques for any type of
organizations. In order to implement the lean
manufacturing successfully, the organisation had to focus
on all aspects of lean element such as Value Stream
Mapping (VSM), in which every activity including
Value-Added activity (VA) and Non-Value-Added
activity (NVA) are analyzed. Type of production flow is
being analyzed and SMED concepts are implemented to
reduce non-value added activities, conversion of push
system to pull system in the production line. The
implementation of Kanban, Production leveling and
conversion of batch production to one piece flow
required to convert the raw material into finished
product. [8]
CYCLE TIME STUDY FOR EACH PROCESS IN
GEAR MANUFACTURING
As indicated earlier the main aim of the project
is to reduce the lead time in a gear manufacturing
process. The project is taken in the Rydon Industries
private limited in Coimbatore. The main products
manufactured in the company are spur gears, helical
gears, automobile sprockets, chain couplings and gear
couplings. From the above products manufactured in the
industry spur gear is choose as product and the study is
made on it. To reduce the lead time in gear
manufacturing process the following steps are followed.
1. To study about plant layout of the industry.
2. To know various processes involved in the
manufacturing of gear.
3. Estimation of cycle time study for each process
in gear manufacturing.
Preparation Quality Value
Stream Analysis
Quality Value Stream Design
Implementation
IJSER

International Journal of Scientific & Engineering Research, Volume 7, Issue 5, May-2016 58 ISSN 2229-5518
IJSER © 2016 http://www.ijser.org
4. Determination of lead time and takt time of
gear manufacturing process.
5. Analysis on the current method to meet the
demand.
6. Creation of current state value stream map.
3.1 Plant layout of the industry
Plant layout of the industry shows the location
of the machine and the various sections in the plant with
the dimensions. The study is made on plant layout and
been drawn as shown in the figure 3.1 with this layout it
is known that where the machines are located located in
each sections and the pathways ways in the plant. The
machines which are available in the plant are bang saw
cutting machine, centre lathe, drilling machine, CNC
turning centre, gear hobbing machine, broaching
machine, and slotting machine. The sections involve
inventory storage, cutting section, lathe section, drilling
section, CNC section, gear hobbing section, slotting
section, office, inventory storage, and quality control
section.
3.2 Process involved in gear manufacturing with process layout
In this work spur gear manufacturing is taken
for study. To draw the process layout we should know
the various process and machine involved in the
manufacturing of spur gear. In process layout, the work
stations and machinery are not arranged according to a
particular production sequence. Instead, there is an
assembly of similar operations or similar machinery in
each department (for example, a drilling department, a
paint department, etc). The various process involved in
manufacture of spur gear with machines are listed in the
table 3.1 as shown below.
Table 3.1: Sequence of process involved in gear
manufacturing with the machine
IJSER

International Journal of Scientific & Engineering Research, Volume 7, Issue 5, May-2016 59 ISSN 2229-5518
IJSER © 2016 http://www.ijser.org
S.
No
Sequence of process Machine used
1 Cutting process Bang saw cutting
machine
2 Outer diameter
turning
Center lathe
3 Drilling Center lathe
4 Boring CNC turning center
5 Gear hobbing Hobbing machine
6 Deburring Manual
7 Slotting of keyway Slotting machine
8 Deburring Manual
9 Heat treatment Out sourcing
10 Dispatching Manual
Fig 3.2: Process sequence in spur gear manufacturing pr
Fig 3.3: Process layout of gear manufacturing
With the above study made about the process
involved in gear manufacturing and the machine required
for the machining, the process layout is draw as shown in
fig 3.3. Numbers in the layout indicate the sequence of
the operation involved in gear machining process with
material movement.
3.3 Estimation of cycle time of each process
To calculate the lead time of the product, it is
required to calculate the cycle time of each process
sequence from start to finish.
Time study is a work measurement technique
for recording the time of performing a certain specific
job or its element carried out under specific condition
and for analyzing the data so as to obtain the time
necessary for an operator to carry out at a defined rate of
performance. Time study is a method of direct
observation it can be done in any method. To make the
time study of each process stop watch method is used
here. The observer watches the job and records data as
the job is being performed over a number of cycles.
Measurement of working time via time study
technique was done for all the processes involved in the
IJSER
International Journal of Scientific & Engineering Research, Volume 7, Issue 5, May-2016 60 ISSN 2229-5518
IJSER © 2016 http://www.ijser.org
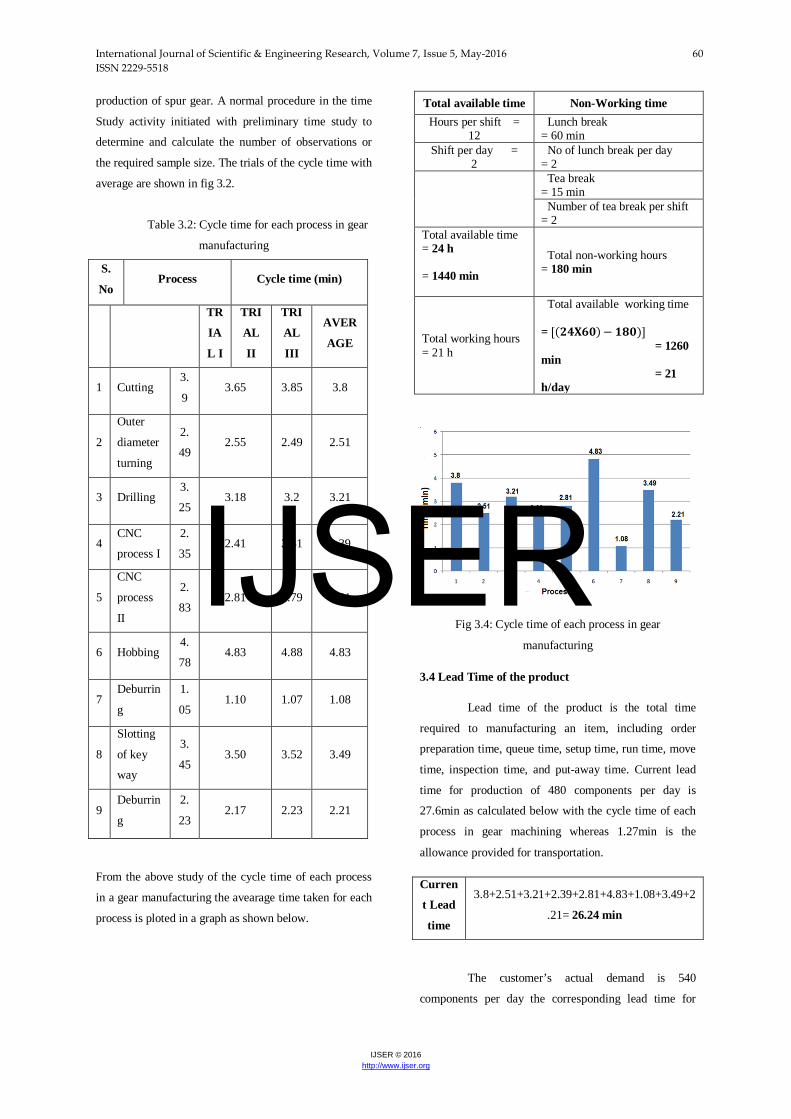
production of spur gear. A normal procedure in the time
Study activity initiated with preliminary time study to
determine and calculate the number of observations or
the required sample size. The trials of the cycle time with
average are shown in fig 3.2.
Table 3.2: Cycle time for each process in gear
manufacturing
S.
No Process Cycle time (min)
TR
IA
L I
TRI
AL
II
TRI
AL
III
AVER
AGE
1 Cutting 3.
9 3.65 3.85 3.8
2
Outer
diameter
turning
2.
49 2.55 2.49 2.51
3 Drilling 3.
25 3.18 3.2 3.21
4 CNC
process I
2.
35 2.41 2.41 2.39
5
CNC
process
II
2.
83 2.81 2.79 2.81
6 Hobbing 4.
78 4.83 4.88 4.83
7 Deburrin
g
1.
05 1.10 1.07 1.08
8
Slotting
of key
way
3.
45 3.50 3.52 3.49
9 Deburrin
g
2.
23 2.17 2.23 2.21
From the above study of the cycle time of each process
in a gear manufacturing the avearage time taken for each
process is ploted in a graph as shown below.
Fig 3.4: Cycle time of each process in gear
manufacturing
3.4 Lead Time of the product
Lead time of the product is the total time
required to manufacturing an item, including order
preparation time, queue time, setup time, run time, move
time, inspection time, and put-away time. Current lead
time for production of 480 components per day is
27.6min as calculated below with the cycle time of each
process in gear machining whereas 1.27min is the
allowance provided for transportation.
Curren
t Lead
time
3.8+2.51+3.21+2.39+2.81+4.83+1.08+3.49+2
.21= 26.24 min
The customer’s actual demand is 540
components per day the corresponding lead time for
Total available time Non-Working time Hours per shift =
12 Lunch break = 60 min
Shift per day = 2
No of lunch break per day = 2
Tea break = 15 min Number of tea break per shift = 2
Total available time = 24 h = 1440 min
Total non-working hours = 180 min
Total working hours = 21 h
Total available working time = [(𝟐𝟒𝐗𝟔𝟎)−𝟏𝟖𝟎)] = 1260 min = 21 h/day
IJSER

International Journal of Scientific & Engineering Research, Volume 7, Issue 5, May-2016 61 ISSN 2229-5518
IJSER © 2016 http://www.ijser.org
component is 20.9 min. So lead time has to be reduced
from 27.6 min to 20.9 min to meet the customer’s
demand.
3.5 Takt Time of the product
To calculate takt time of the product it is
necessary to know about the working and non-working
hours in the plant. The following data’s are being
collected as mentioned in the table 3.3.
Table 3.3: Total working and non-working hours per day
Take time is the average unit
production time needed to meet customer demand. Takt
Time is calculated by dividing the available production
time (per day) by customer demand (per day).The data
pertaining to the working hours and customer demand
was provided by the plant supervisor. The above data in
table 3.3 are used to calculate takt time.
1. Current production rate =480
components/day
2. Expected production rate = 540
component/day
Takt time = (No of working hours X No of shifts X minutes)−(Break time X No of breaks)
Products produced
Calculation of takt time
Current takt time (480 gears/day) = (No of working hours X No of shifts X minutes)−(Break time X No of breaks)
Products produced
= ((12𝑋2𝑋60)−(90𝑋2))
480
= 2.63 min
= 158 s
Takt Goal (540 gears/day) = (No of working hours X No of shifts X minutes)−(Break time X No of breaks)
Products Demand
= ((12𝑋2𝑋60)−(90𝑋2))
540
= 2.33 min
= 140 s
Fig 3.5: Current takt time and takt goal in cycle time
chart
From the above figure 3.8 it is known that
certain process are below the takt time however the
demands are met using extra machines as discussed
below
Current method to meet the demand
To meet the current demand of 480
components per day number of machine are employed in
the work the graph given below shows the working hours
of each machine per day to meet the demand in this
cutting, drilling, and hobbing machine require the
support of another extra one machine to produce the total
product. The data’s are being collected from the study of
working hours of each machine involved in the
manufacturing of gear.
Fig 3.6: Current working hours per day of each machine
to meet demand
Components produced by each machine to meet
demand
IJSER

International Journal of Scientific & Engineering Research, Volume 7, Issue 5, May-2016 62 ISSN 2229-5518
IJSER © 2016 http://www.ijser.org
With the above known working hours per day
of each machine we can calculate the number of
components produced by each machine per day this
calculated using the below formula and figure 3.6 shows
the components produced by each machine.
No of components per day = No of working hours of machine per day X min
Cycle time of the machine
Example for calculation
Process 1(machine1) = 21 X 603.8
= 331
components per day
Fig 3.7: Number of components produced by each
machine
Machining (value added activities) and non-
machining (value added activities) for each process
Cycle time of each process in the gear
manufacturing is known with this we can separate value
added and non valued added in each process.
Machining time (Value-added activities) are activities
which transform the materials into the exact product that
the customer requires.
Non-machining time (Non value-added activities) are
activities which aren’t required for transforming the
materials into the product that the customer wants.
Anything which is non-value-added may be defined as
waste.
In order to reduce the cycle time of the process
we have to reduce non value added activities time in the
process this can be done by the complete study about the
loading and unloading time ie setup time in the process.
The graph shows the value added and non value added
time of each process.
Fig 3.8: Machining time (value added) and non-
machining (non value added time) in each process
Thus from this we know the current production
rate and separation of time in each process. Then we
have to calculate takt time of the product to find the
bottleneck process.
3.6 VALUE STREAM MAPPING
It is a process modelling and analysis tool
available to help organizations understand and improve
business. iGrafx Flow Charter facilitates creating
graphical representations of processes allowing people to
easily comprehend business information. It can be used
to create.
• Process Maps / Flowcharts, Value Stream
Maps Cause & Effect Diagrams / Ishikawa
Diagrams, FMEA Spreadsheets
IJSER

International Journal of Scientific & Engineering Research, Volume 7, Issue 5, May-2016 63 ISSN 2229-5518
IJSER © 2016 http://www.ijser.org
To create a current state map, our team
collected the data and information by walking the flow
and interviewing the operators who perform the
individual task. The drawing of the VSM mapping was
carried out using the software iGrafx Flow charter
2013.The following information were fed to the software
to create the current state map
• The Takt time data
• The Process steps
• Process time (Cycle time and Waiting time)
• Supplier with Material flows
• Information and Physical flows
Figure 3.9 represents the current state map. At
the bottom of the current state map is the timeline
summative indicator. It represents value added time and
non-value added time as given below
Fig 3.9 Snapshot of take time data entry in iGrafx
software
Fig 3. 10: Snapshot of iGrafx software of cycle time in
gear manufacturing process
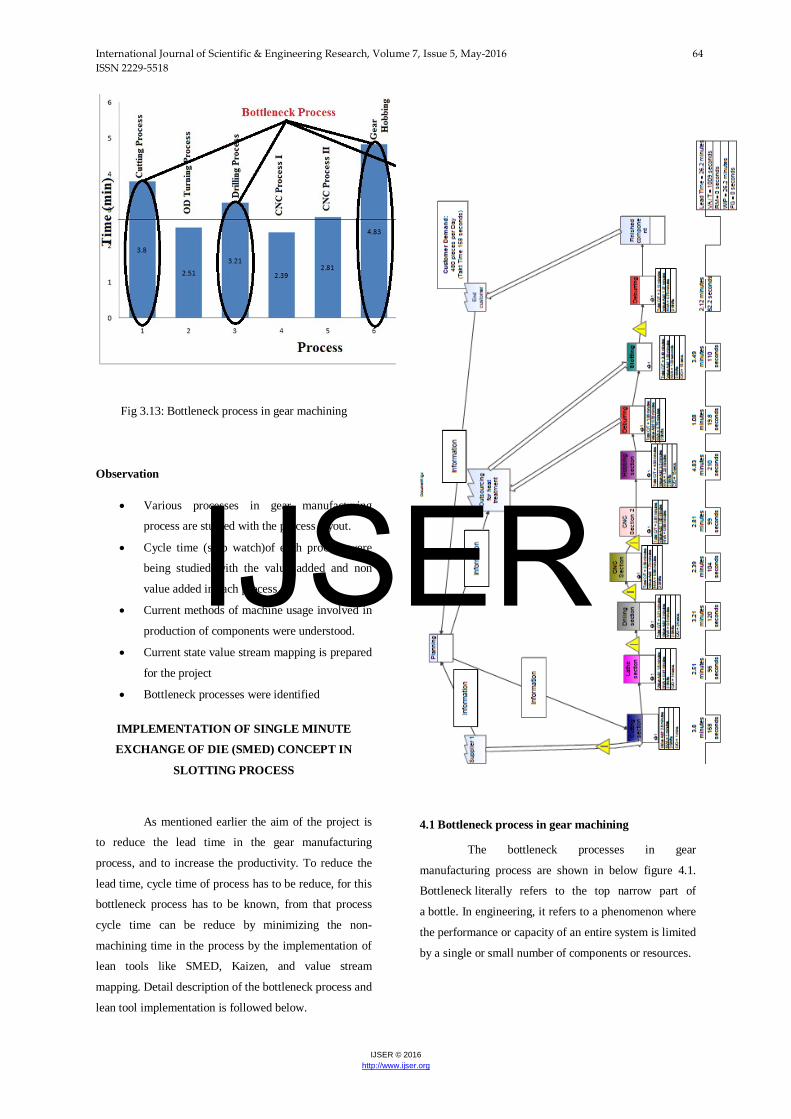
Fig 3.11: Current state map
After creation of current state value stream
mapping work balance sheet for the process is
generated as shown in below figure
Bottleneck literally refers to the top narrow
part of a bottle. In engineering, it refers to a phenomenon
where the performance or capacity of an entire system is
limited by a single or small number of components or
resources
IJSER
International Journal of Scientific & Engineering Research, Volume 7, Issue 5, May-2016 64 ISSN 2229-5518
IJSER © 2016 http://www.ijser.org
Fig 3.13: Bottleneck process in gear machining
Observation
• Various processes in gear manufacturing
process are studied with the process layout.
• Cycle time (stop watch)of each process were
being studied with the value added and non
value added in each process
• Current methods of machine usage involved in
production of components were understood.
• Current state value stream mapping is prepared
for the project
• Bottleneck processes were identified
IMPLEMENTATION OF SINGLE MINUTE
EXCHANGE OF DIE (SMED) CONCEPT IN
SLOTTING PROCESS
As mentioned earlier the aim of the project is
to reduce the lead time in the gear manufacturing
process, and to increase the productivity. To reduce the
lead time, cycle time of process has to be reduce, for this
bottleneck process has to be known, from that process
cycle time can be reduce by minimizing the non-
machining time in the process by the implementation of
lean tools like SMED, Kaizen, and value stream
mapping. Detail description of the bottleneck process and
lean tool implementation is followed below.
4.1 Bottleneck process in gear machining
The bottleneck processes in gear
manufacturing process are shown in below figure 4.1.
Bottleneck literally refers to the top narrow part of
a bottle. In engineering, it refers to a phenomenon where
the performance or capacity of an entire system is limited
by a single or small number of components or resources.
IJSER

International Journal of Scientific & Engineering Research, Volume 7, Issue 5, May-2016 65 ISSN 2229-5518
IJSER © 2016 http://www.ijser.org
Fig 4.1: Bottleneck process in gear machining process
From the above figure 4.1 it is noted that there are four
bottleneck processes. They are
1. Cutting process 3. Gear
hobbing process
2. Drilling process 4. Slotting
process
The machining (value added activities) and non-
machining time (non-value added activities) are shown in
the graph in 3rd chapter in figure 3.7
Table 4.1: Machining (value added activities) and non-
machining (non-value added activities) time for
bottleneck process
S.
No
Bottleneck
process
Machining
time (min)
Non-
machining
time (min)
1 Slotting 1.83 1.66 = 99 s
2 Gear hobbing 3.5 1.31 = 78.6
s
3 Cutting
process
2.8 1 = 60 s
4 Drilling
process
2.4 0.81 = 48 s
Inference
• From the above table it is clear that non
machining time of slotting process takes 40%
of the total time so cycle time of the process
increases.
• In order to reduce the non machining time we
have to reduce setup time ie both loading and
unloading time it is done by optimizing the
slotting fixture.
4.2 Detail study of setup time (non-machining time) of
gear in slotting machine
Procedure for mounding of gear
Over slotting machine table three jaws chuck is
placed which is fixed with the table by means of clamps.
On the chuck fixture plate is clamped to the jaws of
chuck which is held stationary. Over the plate gear are to
be mounted and clamped by means of strap clamp and
bolts, support block is placed at the end for support of
clamps as shown in figure 4.1.
In this slotting fixture single work piece is
clamped at a time here strap clamps are removed and
clamped every time by means of bolt and nut so the setup
time for clamping of the work piece is about 3.49 min.
In this method about 40% of time is taken as non-value
added activities so we have aimed to design a slotting
fixture using SMED concept.
Slotting machine
Fig 4.2: Close up view of mounting of the gear
Sub elements of non-value added time for setup time
Table 4.2: Activities of present slotting fixture
IJSER

International Journal of Scientific & Engineering Research, Volume 7, Issue 5, May-2016 66 ISSN 2229-5518
IJSER © 2016 http://www.ijser.org
From this table we can know that activities of
placing the strap clamp and fixing it take time of 58 s
nearly 1 min which can be avoided more over adjustment
of the table also takes 30s which is also avoidable. The
each activity is explained in detail with the figures given
below.
The Software used slotting fixture design is
Autodesk Inventor 2014 – It is a 3D CAD
software offers an easy-to-use set of tools for 3D
mechanical design, documentation and product
simulation.
Step by step procedure for mounting the gear
using CAD model
(a) (b)
(c) (d)
Fig 4.3: 3D model of each activity of present
slotting fixture
(a) Fixture plate of fixture (b)
Placing of gear in the fixture plate
(c) Fixing of clamp 1 with nut (d)
Fixing of clamp 2 with nut
The assembly drawing of the slotting fixture is
shown in the figure 4.4 with the indication of the parts
with it.
Fig 4.4: CAD model for present slotting fixture
4.3 Application of single minute exchange die (SMED)
concept to reduce setup time
In this slotting fixture every time the clamp has
to be removed and place so it takes much time in fixing
of gear positioning of gear with the tool also take more
time and effort so it can be reduce by the implementation
of lean tools like SMED, changeover time reduction and
much more in this project we implement SMED concept.
Single- minute exchange die (SMED) is the term used
to represent the Single Minute Exchange of Die or setup
time that can be counted in a single digit of minutes.
SMED is often used interchangeably with quick
changeover. SMED and quick changeover or the practice
Task
no
Activities Time (s)
1 Positioning the gear on
fixture plate
9
2 Fixing the strap clamp 1 11
3 Loose fastening the nut 1 10
4 Fixing the strap clamp 2 13
5 Loose fastening the nut 2 10
6 Tight fastening 15
7 Adjusting the table to the
tool position
31
Total
99 s
IJSER

International Journal of Scientific & Engineering Research, Volume 7, Issue 5, May-2016 67 ISSN 2229-5518
IJSER © 2016 http://www.ijser.org
of reducing the time it takes to change a line or machine
from running one product to the next.
Fig 4.5a: 3D view of the proposed slotting fixture
Fig 4.5b: Orthografic view of proposed slotting fixture
The description of the component and part
drawing of the proposed design of the fixture is attached
in annexure 2 page no 34.
Procedure
The design is made to hold two gears
simultaneously the step by step procedure is given
below.
• There are two projections in the fixture plate in
order to hold two gears at a time.
• There is a strap clamp with retraction spring
which is used to tighten the gear.
• There is a support block which is used to hold
the strap clamp with the help of pivot in the
support block.
• Table is mounted on the indexing head so it is
easy to index at each time.
Detail of the activities with time is explained in
table with necessary figure 4.6.
Table 4.3: Activities in proposed slotting fixture
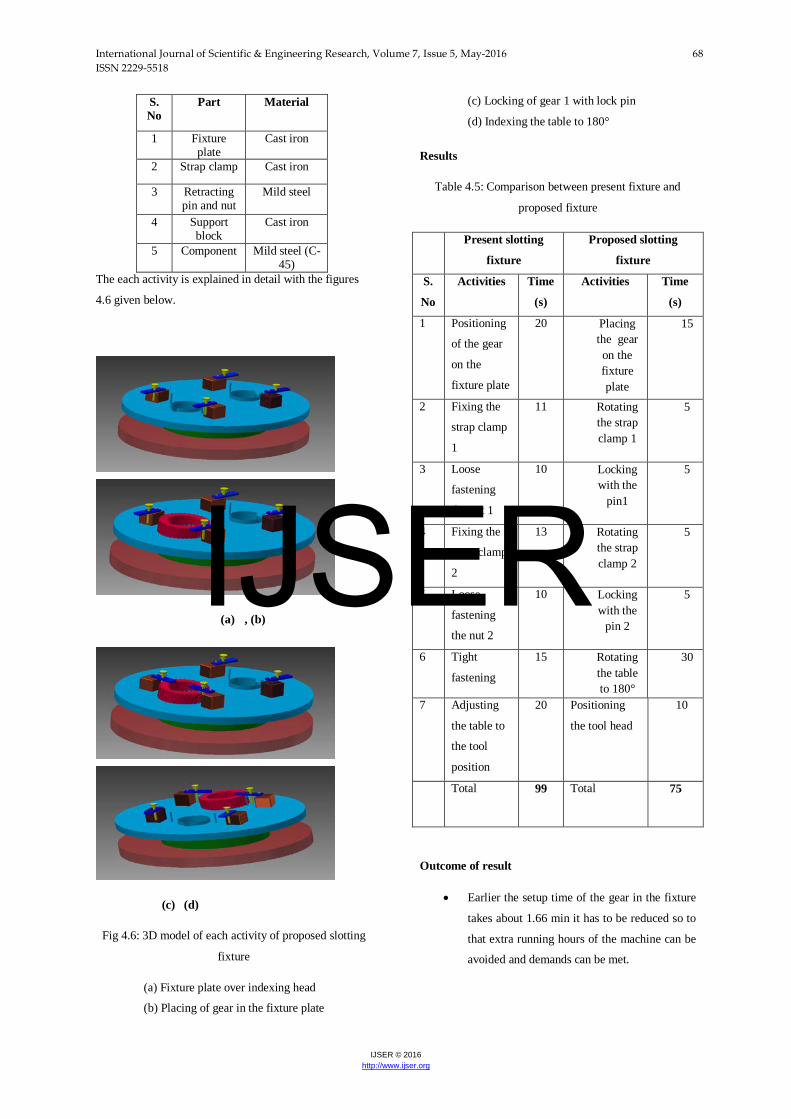
Materials for slotting fixture design
Table 4.4: Material for slotting fixture
S.NO ACTIVITIES TIME
(s)
Offline station
1 Placing the
gear on the
fixture plate
15
2 Rotating the
strap clamp 1
5
3 Locking with
the pin1
5
4 Rotating the
strap clamp 2
5
5 Locking with
the pin 2
5
Online station
6 Rotating the
table to 180*
30
7 Positioning of
the tool head
10
Total 75 s
IJSER
International Journal of Scientific & Engineering Research, Volume 7, Issue 5, May-2016 68 ISSN 2229-5518
IJSER © 2016 http://www.ijser.org
S. No
Part Material
1 Fixture plate
Cast iron
2 Strap clamp Cast iron
3 Retracting pin and nut
Mild steel
4 Support block
Cast iron
5 Component Mild steel (C-45)
The each activity is explained in detail with the figures
4.6 given below.
(a) , (b)
(c) (d)
Fig 4.6: 3D model of each activity of proposed slotting
fixture
(a) Fixture plate over indexing head
(b) Placing of gear in the fixture plate
(c) Locking of gear 1 with lock pin
(d) Indexing the table to 180°
Results
Table 4.5: Comparison between present fixture and
proposed fixture
Present slotting
fixture
Proposed slotting
fixture
S.
No
Activities Time
(s)
Activities Time
(s)
1 Positioning
of the gear
on the
fixture plate
20 Placing the gear on the fixture plate
15
2 Fixing the
strap clamp
1
11 Rotating the strap clamp 1
5
3 Loose
fastening
the nut 1
10 Locking with the
pin1
5
4 Fixing the
strap clamp
2
13 Rotating the strap clamp 2
5
5 Loose
fastening
the nut 2
10 Locking with the
pin 2
5
6 Tight
fastening
15 Rotating the table to 180°
30
7 Adjusting
the table to
the tool
position
20 Positioning
the tool head
10
Total 99 Total 75
Outcome of result
• Earlier the setup time of the gear in the fixture
takes about 1.66 min it has to be reduced so to
that extra running hours of the machine can be
avoided and demands can be met.
IJSER

International Journal of Scientific & Engineering Research, Volume 7, Issue 5, May-2016 69 ISSN 2229-5518
IJSER © 2016 http://www.ijser.org
• After the study about the existing activities
involved in fixing the gear in fixture
implementation of SMED concept is done.
• With the implementation of SMED concept the
setup time has been reduced to 0.5 min which
stops the extra running of machine.
• The below graph shows the reduction in cycle
time with the implementation of SMED
concept with takt time in it.
Fig 4.7: Time Comparison between present and proposed
method for slotting fixture
IMPLEMENTATION OF KAIZEN CONCEPT IN
CUTTING PROCESS
Fig 5.1: Bang saw cutting machine
Sawing machine is a device used for cutting
up bars of material or for cutting out shapes in plates of
raw material. The cutting tools of sawing machines may
be thin metallic disks with teeth on their edges, thin
metal blades or flexible bands with teeth on one edge.
5.1 Present method of cutting bar stock
In the present method of cutting bar stock only
one workpiece is being cut at a time in the cutting
machine the diameter of the work piece is dia 90mm.
The time taken for cutting one wokpiece is 3.8 min.
During the process the speed of the blade is 25 rpm .The
fixture has two jaws to clamp the workpiece the two jaws
are moveable to hold the work piece. So that at each time
workpiece can be easily loaded and unloaded by moving
jaws.
Fig 5.2: Cutting single bar stock
5.2 Implemented method of cutting bar stock
In this type we made two work pieces to cut at
a time in the cutting machine. As the specification of the
machine is to hold maximum work piece dia of 180 mm.
So after making the study we come to know that two
work pieces can be clamped in the fixture, so that two
work pieces are being cut at the time of 4.2 min with the
speed of the blade as 22 rpm.
Fig 5.3: Cutting two bar stocks
IJSER

International Journal of Scientific & Engineering Research, Volume 7, Issue 5, May-2016 70 ISSN 2229-5518
IJSER © 2016 http://www.ijser.org
Result
Table 5.1: Comparison between current method and implemented method
Existing method
Future method
Cycle time = 3.8 min
Cycle time = 4.22
= 2.1 min
Single component is cut at a
time
Double component is cut at a time
Fig 5.4: Present method to implemented method
Outcome of study
• First one
workpiece
was been cut
in the bang
saw cutting
machine after
the study two
workpiece
were made to
cut.
• With this
implementatio
n for the same
cutting time
two
workpiece
were cut.
Figure 5.5
shows the
time reduction
in the cutting
of single
workpiece.
Fig 5.5: Graph between present method and implemented method
5.3 Future state value stream map
The current state map picturises the existing
practices which on analysis would reveal the waste
elimination opportunities. After gathering the
information of the current state value stream mapping
future state map is being developed for production of 540
components per day.
IJSER

International Journal of Scientific & Engineering Research, Volume 7, Issue 5, May-2016 71 ISSN 2229-5518
IJSER © 2016 http://www.ijser.org
Fig 5.6: Future state VSM
Work balance sheet generated from future state map
Fig 5.7: Work balance sheet for future state map
Comparison between current state value stream mapping to future state value stream mapping
Fig 5.8: Comparison of current state and future state VSM
CONCLUSION
Lean principles and methods were studied and
utilized in this project to increase the
productivity of the industry under study. The various
processes in the Rydon industries private
Limited Industry was analyzed. Current state value
stream mapping is being drawn using iGrafx software. In
the current state value stream mapping using work
balance sheet it is identified that there are there process
which is being identified as bottleneck process are
Cutting process, Drilling process, Hobbing process,
Slotting process
One of the major problems more setup time was
identified and then study about the current fixture design.
Literature survey related to single minute exchange of dies
(SMED) was carried out. Current fixture design that about
40% of the total time is non-value added activities so SMED
concept was introduced to reduce the setup time.
Next bottleneck operation is cutting section
here KAIZEN (Continuous improvement) is being
implemented to utilize the effectiveness of the machine
properly. Initially only one work piece is being cut at
time but the cutting process has been enhanced that two
raw materials can be cut at a time by implementing
kaizen. The time for cutting process is drastically
reduced from 3.8 min to 2.1 min.
Next bottleneck operation is hobbing process. In
this process the problem is more inventory inorder to
reduce the inventory one more machine is being
introduced in the
shop floor due to this
production also
increases
simultaneously
Finally future state map was drawn after giving
the solution to all the bottleneck operations in the the
lead time is drastically reduced from 26.2 min to 20.9
min therefore the production rate has been increased
from 480 products/day to 510 products/day. Thus the
production in the company has been enhanced.
References [1] R. Shah, A. Chandrasekaran and K. Linderman, "In
pursuit of implementationpatterns: The context of Lean
and Six Sigma", International Journal ofProduction
Research, voI.- 46, no.- 23, pp. 6679-6699,2008.
[2] Mader and D.P., "Lean Six Sigma's Evolution".
Quality Progress, vol.- 41,no.-l, pp. 40- 48,2008.
[3] Brett, C. and P. Queen., "Streamlining Enterprise
Records Management withLean Six Sigma", Information
Management Journal, vol.-39, iss.-6, pp. 58-62,Nov. /
Dec. 2005.
[4] Byrne, G. Lubowe, D. Blitz and A., "Using a Lean
Six Sigma approach todrive innovation", Journal of
Strategy and Leadership, vol.-35, no.-2, pp. 5-10,
2007.
Lead time = 20.9 min VA\T = 820 s
WIP = 20.9 min
Lead time = 26.2 min VA/T = 1009 s WIP = 26.2 min IJSER