application of modern grouting technology to remedial
TRANSCRIPT
Improvements in reservoir construction, operation and maintenance. Thomas Telford, London, 2006
Application of Modern Grouting Technology to Remedial Works on Dams
AK HUGHES, Director of Dams & Water Resources, Atkins Ltd CT KETTLE, Principal Engineer, Bachy Soletanche
SYNOPSIS Grouting to form cut-offs and to seal leakages has been used for many decades. In the past the process of grout injections were difficult to control and did not always produce the desired results. This paper seeks to give a historical background to the grouting process and identify the need for change. The paper outlines the GIN process and goes on to illustrate the rapid changes in the grouting process based on computer packages. To conclude the paper illustrates the work recently carried out in Wimbleball Dam in the South West of England.
Historical Background – The Need for Change Over recent decades hundreds of dam cut/offs have been constructed in rock and alluvium by the injection of self-hardening grouts. The plant, equipment, grout formulations, and injection procedures were very simple, and slow to evolve. Systems and practices developed in parallel with increasing understanding of grout rheology, rock conditions, and the mechanism of grout injection. However, the new procedures could be very difficult to control in the field, where the restrictions of current technology and site practice could not always deliver the desired results. In the early days grouts were designed on the basis of locally available materials, and often applied where there was only limited knowledge of fissure widths, patterns, and spacings.
IMPROVEMENTS IN RESERVOIRS
Grouts were batched by hand or by means of basic weigh batching equipment, mixed in simple low speed mixers and pumped by simple reciprocating pumps, frequently over large distances to the point of injection. At the point of injection the pressure control of the process was achieved by manual observation of the manometer, hand control of the return line flow to the storage agitator (where one was used), or by field telephone to the pump operator. Borehole pressure gauge readings were adjusted for line loss from the point of injection, generally taking into account the additional head of grout in the borehole. Limiting volumes of grout to be injected were controlled by manual measuring of the volume pumped from agitator holding tanks, and grout absorptions were ultimately expressed either in the form of litres/linear metre of borehole, or per discrete ‘stage’ (discrete length of the borehole injected, usually 2-5 m). More generally were expressed as dry weight of cement and other materials per linear metre, or per stage, since this since this formed part of the basis of payment Monitoring of the progressive reduction in mass conductivity was made by comparing the results of water testing in un-grouted holes prior to injection, with post-grouting tests in subsequent series of boreholes and/or in separate control boreholes. Analysis and evaluation of the grouting was based upon comparing the final pressures achieved at the end of each injection, and by comparison of the total dry weight of material injected per linear metre for each stage. The results for successive phases of injection compared the results achieved between adjacent boreholes and stages, and the global average values for each phase of injection. Results were plotted each day by hand on scale drawings of the grout curtain. These drawings carried only basic information, as they soon became crowded and difficult to read. Areal analysis of weak zones was by visual inspection of grout takes and pressures recorded on the drawings, and more complex analyses were often never seen fully plotted up until the final record drawings were submitted - too late to influence the execution of work carried out on a localised, hole by hole, stage by stage, or phase by phase, basis. Although much excellent work was carried out by experienced and professional specialist contractors using traditional methods, there was clearly potential for many errors of execution or interpretation. The following is a summary of the key areas of risk :-
HUGHES & KETTLE
o At the mixing station grout batching could be very inaccurate,
requiring ‘reconciliation’ at the close of each shift between the dry weight of material delivered and used, the volume of grout mixed, and the injected volume measured from observation of the agitator tank.
o Errors in mixing grouts of differing water/cement ratios, errors in
measuring the volumes prepared in the mixer, errors in measuring the volumes pumped from the agitator, all compounded to produce large discrepancies. Site teams became adept at covertly balancing out such errors on paper, but were often unable to accurately extrapolate the amount of grout actually injected into a given stage. A performance analysis made simply on the basis of absorbed quantity of grout could therefore be flawed, and could fail to highlight stages or zones where grout takes were high and/or additional work was required, thereby leaving inadequately treated rock in situ.
o Poor mixing practice, inefficient mixers, and the practice of starting
with ‘dirty water’ style mixes of water cement ratios as high as 10:1, even 15 or 20:1, all combined as factors in allowing the injection of thin, unstable mixes. This frequently resulted in premature blocking off of grout lines or boreholes (sometimes undetected or unrecorded) due to segregation and/or sedimentation, or to the premature blocking off of fissures due to pressure filtration (the process of squeezing out the water in the mix). This was exacerbated in some cases by the absorption of water into dry formations, leading to poorly hydrated grouts which achieved much slower rates of gain of strength and lower ultimate compressive strengths.
o The pressure of injection is related to conditions in the ground and the effective rate of pumping into the borehole. Similar pressures could be generated in a number of ways, by manipulating the pumping speed, and the control of the valves on the grout line and the return line at the borehole. Specified ‘refusal’ conditions at the end of an injection could be simulated by pumping too quickly, or by adjusting the valves. For the engineer, there was always a problem interpreting the ‘snapshot’ picture of the results recorded at the end of an injection, and a difficulty of verifying this information. This often made it difficult often to be confident of the data recorded on site.
o Poor control of pressure at the point of injection arose due to inadequately damped pressure and flow from reciprocating pumps, non-continuous observation of the manometer and/or control of the return line valve, and inaccurate, poorly calibrated, manometers. As a

IMPROVEMENTS IN RESERVOIRS
result, limiting hydro-fracture pressures were often exceeded, and readings of oscillating pressures at the gauge were inaccurate. The resulting analysis on the basis of the final injection pressure achieved took no account of the time / pressure relationship, and often did not identify or highlight premature blocking off of the fissure or borehole. Unscrupulous contractors were able to falsify the apparent successful completion by deliberately increasing the pump speed, and/or reducing the return line flow, to effectively plug off the borehole too early, leaving the adjacent rock inadequately treated.
o A related problem was that of poor control of hydro-fracture in the formation, or breakout of the grout at the surface, due to poor observation of the fall in grout pressure under these conditions. This lead to a potential weakening of the formation, an excessive volume being injected for the given location, and to the execution of subsequent supplementary injections due to an apparently high absorption.
o Frequent changes from one mix to another (water/ cement ratios by weight often following a pattern such as 20:1, 10:1, 8:1, 5:1, 2:1, 1:1, and 0.5:1) added hugely to the confusion on site and the difficulty of analysing results. The amount of grout specified for each mix was often quite limited, so that sometimes the injection terminated before the new mix in the grout line arrived at the point of injection. The quantity and/or type of the final mix types for a given injection were often incorrect, leading to an inaccurate picture of the closing mixes, and a consequent mis-calculation of the dry weight of material injected. Where this value was part of the performance specification, such errors could distort the general picture, leading to either too much or insufficient quantity of grout being injected, and could result in a situation where the final grout injected was of considerably lower strength than the characteristic strength of the final mix indicated on the record sheet, and/or too low to ensure long term durability.
The above is just a brief summary of some of the major problems associated with controlling the injection process. Added to problems in controlling drilling practice and accuracy of drilling, and the whole field of water testing control and design, it can be seen that there was much the industry needed to do to ensure good design, best practice, and adequate control. The inherent inaccuracies combined to give rise to inadequate or uneven treatment, reduced grout strengths, and reduced longevity of the grout curtain. Where grout curtains remain fully effective, it is in many cases a function of over-design, where inefficient and uneconomically high quantities of drilling and grouting were executed.
HUGHES & KETTLE
Of course, responsible contractors tried to handle all the problems of unwieldy specifications, the constraints of semi skilled local labour and long pumping distances, the limitations of the available plant and materials, such that despite all the risks, many fine examples of work were completed. However, for the designer and client the end results were often inconclusive, not demonstrably cost effective, and frequently undermined confidence in the result, the process, and the contractor.
Progressive Change
Over the years many incremental practical improvements have been made to the manual control which have helped significantly in improving the quality of work.
These have included: ♦ Introduction of automated batching plants ♦ pressure damping devices ♦ improved pumps ♦ high speed grout mixers of improved efficiency ♦ improved quality and reliability of manometers ♦ introduction of pressure recording rotary graphs ♦ introduction of flow meters, and pressure relief valves ♦ reduction in water/cement ratios ♦ improved grout materials and additives ♦ improved control of injection by simplification of the specification ♦ the introduction of dynamic refusal criteria controlling the volume,
pressure, and flow rate in the final stages of injection. ♦ better quality, more controlled regulating valves ♦ pre- hydration of bentonite in slurry form prior to its introduction to the
mix ♦ better understanding of the theory and practise of grouting ♦ the introduction of routine Lugeon testing as a simple, robust guide to
rock characteristics and the effectiveness of the grouting programme. ♦ introduction and controlled use of better methods of on site testing,
including the mud balance, pressure filtration device, marsh cone, and plate cohesion test
Not withstanding these improvements the end result was dependent entirely on the skill, observation, diligence, and honesty of field personnel, and the quality of management and planning of the site operations by the Contractor.

IMPROVEMENTS IN RESERVOIRS
Rock Fissure Treatment - GIN method In the late 1970’s and early 1980’s a fundamental change in philosophy of rock grouting was developed and introduced by Lombardi, Deere, and others who introduced a new concept – the GIN process. (GIN = Grout Intensity Number). The GIN system, which involves the application of a constant factor P x V (pressure x cumulative volume) for each injection, allowed for a more accurate and dynamic treatment of fissured rock and a better engineering evaluation of the injection process. The method sets a limiting pressure envelope which decreases according to the volume injected, until the limiting volume (V max) is reached. This procedure is very useful in formations where grout absorptions are expected to vary significantly, such as karzstic limestone, in weak formations susceptible to hydro-fracture, and in very open formations where excessive grout travel is likely. Apart from applying the GIN value, the system proposed the use of a single grout mix of low water cement ratio, which by the use of deflocculents eliminated the loss of mix water due to pressure filtration. This, together with the use plasticisers and the pre-hydration of bentonite slurry resulted in a ‘stable’ mix of greatly improved fluidity, penetrability, strength, and durability. The dry weight of material can be ignored as a calculation other than for payment, as interpretation and measurement was now directly related to the volume injected. The further advantage of this method, arising from the fact that the grout physical and rheological properties remain constant throughout each given injection, and from phase to phase throughout the injection programme, is that it allows individual injections to be compared dynamically. By maintaining a relatively constant injection rate, the constant and stable physical properties of the grout allowed the key parameters (pressure, cumulative volume, pressure/time, and volume/time parameters) to form an accurate basis for comparison of individual injections and of successive phases of injection. The injection had become, in effect, a water test with grout.
The GIN process, though recognised immediately by engineers in the field as a major breakthrough, was for almost 10 years a difficult process to implement on site. The boundary curve had to be ‘modelled’ by instructing a series of decreasing steps of constant injection pressure, each linked to a limiting volume, creating a series of injection domains which were touching the boundary curve. All this had to be controlled with great diligence on site by very experienced operatives and supervisors. At the start of the works,

HUGHES & KETTLE
trials were made on site to verify the appropriate single mix and the GIN value for the formation being injected.
The following Figures 1 - 3 are examples from an early reference work by Lombardi describing the GIN theory, and indicating how, at a constant rate of pumping, the evolution of the PV plot might appear for differing rock conditions. Once the PV intercept is reached the injection rate was adjusted manually in an attempt to follow the curve until the injection rate reduced to a practicable minimum (Qmin), ie to ‘refusal’, or until the limiting volume (Vmax) was injected, at which point the injection is deemed complete. However, it is evident that if Q was poorly controlled on site, P would vary accordingly, and the graphical plot might be meaningless since the PV plot could be made to indicate a wide range of conditions. Add to this the requirement for manually recording P and V on site, then plotting the results by hand for every injection, every day, before they could be analysed, and the scale of the practical difficulty for the grouting engineer can be imagined.
Figure 1. Illustration of an early GIN profile with a typical grouting path.
The solution to this difficulty came with the availability of the personal computer. The next fundamental improvement has been the availability of
IMPROVEMENTS IN RESERVOIRS
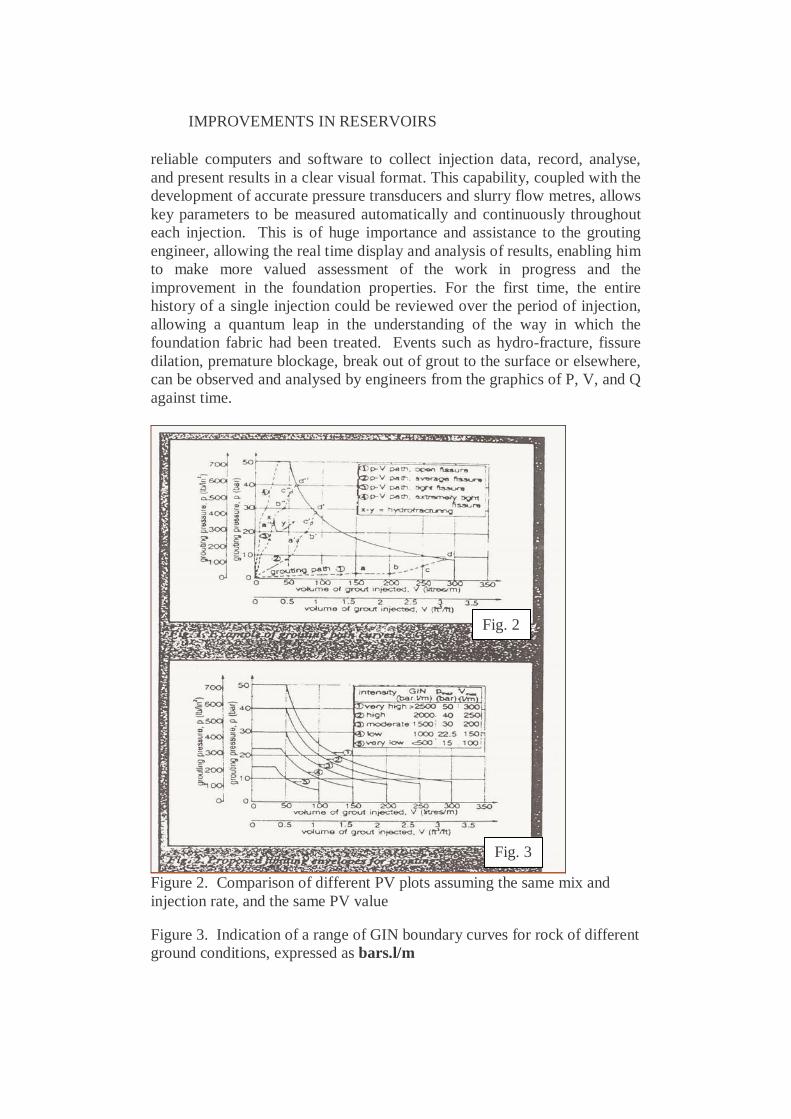
reliable computers and software to collect injection data, record, analyse, and present results in a clear visual format. This capability, coupled with the development of accurate pressure transducers and slurry flow metres, allows key parameters to be measured automatically and continuously throughout each injection. This is of huge importance and assistance to the grouting engineer, allowing the real time display and analysis of results, enabling him to make more valued assessment of the work in progress and the improvement in the foundation properties. For the first time, the entire history of a single injection could be reviewed over the period of injection, allowing a quantum leap in the understanding of the way in which the foundation fabric had been treated. Events such as hydro-fracture, fissure dilation, premature blockage, break out of grout to the surface or elsewhere, can be observed and analysed by engineers from the graphics of P, V, and Q against time.
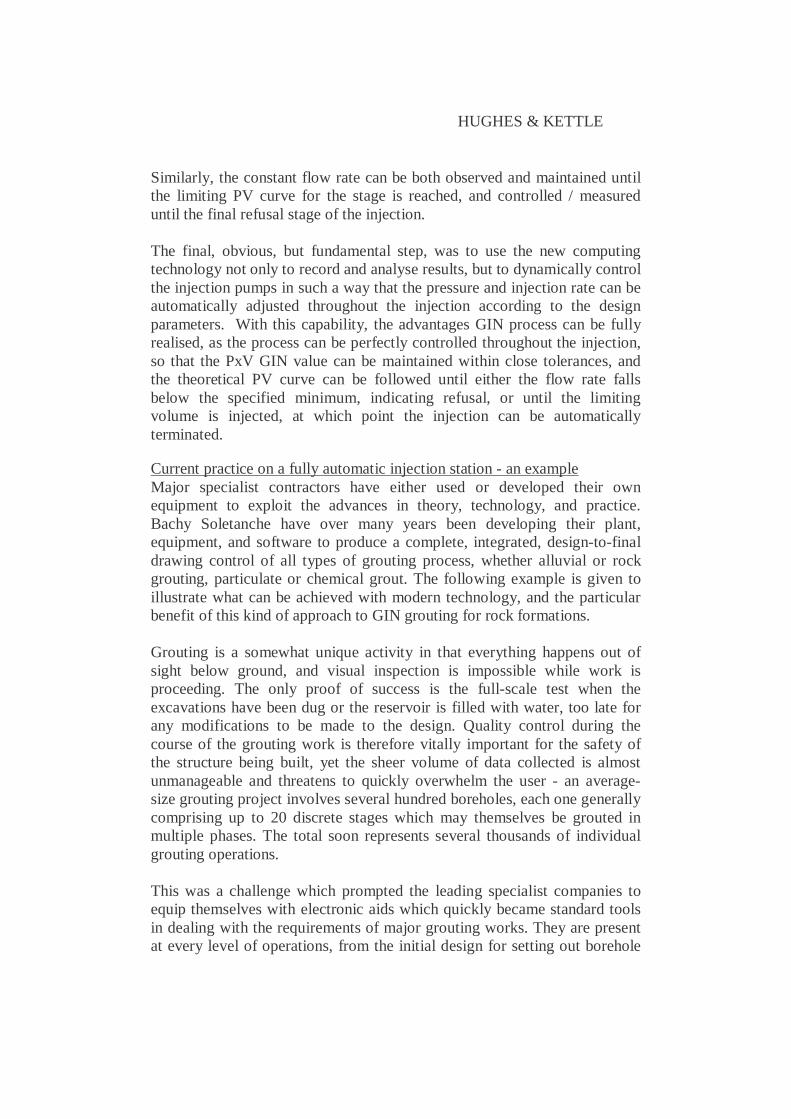
Figure 2. Comparison of different PV plots assuming the same mix and injection rate, and the same PV value Figure 3. Indication of a range of GIN boundary curves for rock of different ground conditions, expressed as bars.l/m
Fig. 2
Fig. 3
HUGHES & KETTLE
Similarly, the constant flow rate can be both observed and maintained until the limiting PV curve for the stage is reached, and controlled / measured until the final refusal stage of the injection. The final, obvious, but fundamental step, was to use the new computing technology not only to record and analyse results, but to dynamically control the injection pumps in such a way that the pressure and injection rate can be automatically adjusted throughout the injection according to the design parameters. With this capability, the advantages GIN process can be fully realised, as the process can be perfectly controlled throughout the injection, so that the PxV GIN value can be maintained within close tolerances, and the theoretical PV curve can be followed until either the flow rate falls below the specified minimum, indicating refusal, or until the limiting volume is injected, at which point the injection can be automatically terminated.
Current practice on a fully automatic injection station - an example Major specialist contractors have either used or developed their own equipment to exploit the advances in theory, technology, and practice. Bachy Soletanche have over many years been developing their plant, equipment, and software to produce a complete, integrated, design-to-final drawing control of all types of grouting process, whether alluvial or rock grouting, particulate or chemical grout. The following example is given to illustrate what can be achieved with modern technology, and the particular benefit of this kind of approach to GIN grouting for rock formations. Grouting is a somewhat unique activity in that everything happens out of sight below ground, and visual inspection is impossible while work is proceeding. The only proof of success is the full-scale test when the excavations have been dug or the reservoir is filled with water, too late for any modifications to be made to the design. Quality control during the course of the grouting work is therefore vitally important for the safety of the structure being built, yet the sheer volume of data collected is almost unmanageable and threatens to quickly overwhelm the user - an average-size grouting project involves several hundred boreholes, each one generally comprising up to 20 discrete stages which may themselves be grouted in multiple phases. The total soon represents several thousands of individual grouting operations. This was a challenge which prompted the leading specialist companies to equip themselves with electronic aids which quickly became standard tools in dealing with the requirements of major grouting works. They are present at every level of operations, from the initial design for setting out borehole
IMPROVEMENTS IN RESERVOIRS
patterns and calculating grout quantities per injection, through on-site control of the grout pumps and data collection, to verification of the quality of the finished programme . This has necessitated not only an enormous amount of research and development into software programmes capable of modelling, controlling, and recording the injection process, but has required the development of sophisticated pumping equipment which is capable of responding to the instructed parameters with the required level of sensitivity. Such pumps today are capable of continuously measuring, and responding to, pressure readings taken every 1/100th of a second. The software package which has been developed by Bachy Soletanche consists of a suite of independent but compatible, interactive programmes ♦ ENPASOL is a package of sensors, read-out device, and software
mounted on the drill rig to collect data such as torque, rate of advance, bit pressure, flush pressure, hydraulic feed pressure, etc in real time as drilling progresses. The data is presented as a continuous graphical profile of these parameters plotted against depth. These plots, which are visible to the drill operator during drilling, can be later combined by the software in different ways to highlight variations in ground density & cohesion, giving a measure of the competence and consistency of the ground. These plots are used in planning the injection programme.
♦ CASTAUR is a powerful design tool which creates a 3D model of the
site (soil layers, structures, grouting zones, physical obstructions, etc); optimises the location of grout holes and produces graphical plots and tabulated instructions for the setting out and drilling crews, defines and calculates the theoretical volume of ground to be treated based on the soil or rock characteristics, and established a 3-D structure for the SPHINX database within which the grout injection data can be analysed and presented spatially.
♦ SPHINX organises information into a powerful database which processes data on all aspects of the grouting works (borehole geometry, grout types, injection parameters, grouting records) and provides all the formats for day-to-day management of this huge amount of data. More specifically, it provides for the automatic collation of grout injection data, the preparation of daily production reports in graphical and tabulated format, and the analysis of results and presentation in numeric, graphic, or spatial CAD plot.
♦ SPICE is the software which physically controls all grouting operations from a PC computer installed at the grouting plant, and is linked to a specialised programme which servo controls the electro hydraulic grouting pump. SPICE utilises grouting instructions regularly updated in SPHINX, and transferred to the site injection plant computer on floppy

HUGHES & KETTLE
disk at the commencement of each work shift. SPICE automatically controls grouting flowrate to keep values of grout pressure and grout volume within predetermined limits. Grout injection pressure, flow rate, and volume for each pump are displayed in real time on the injection station monitor, and stored to hard disc. At the end of each individual grout injection a total of 50 categories of data, summarising the complete injection process, is stored in the database.
♦ SCAN 3-D : this highly configurable software produces sectional CAD drawings which display the grouting results and boreholes in the correct spatial position for easy analysis by the grouting engineer.
Special care was taken to design the human interface of this software package to be as approachable as possible. This is peculiarly true for the SPICE software, which is used on site by the plant operators, and therefore designed to require the minimum possible site training, of 1-2 days. This system has been employed on a large number of dam grouting projects, ranging from very large projects such as Piedra del Aguila dam in Patagonia, Argentina (1992) which employed over 100 grout pumps and 6 computerised grouting plants, with 18 PCs for technical supervision, to very small grouting works which require only 1-2 pumps. The main advantages of such a system, apart from considerations detailed above, are ♦ pre determined grouting procedures and parameters are pre programmed
into the software, ♦ local, semi skilled personnel can be quickly trained to an operational
level, requiring the presence of only a limited number of grouting specialists to run the system.
♦ computerisation enables optimisation of design, control, quality control, and production efficiency.
♦ reporting is fast, automatic, and accurate. Easy-to-read analytical diagrams can be produced and updated as frequently as necessary. These features are essential in creating an efficient work team which combines the expertise and resources of the grouting specialist contractor, the client, and the engineer.
In the end the desired effect must be to free the specialist engineer from hours of routine data processing, allowing him to employ analytical tools rapidly, thereby giving him quality engineering time to apply skills and experience to interpret the data and to refine the grouting parameters and programme for maximum effect and efficiency.
IMPROVEMENTS IN RESERVOIRS
Wimbleball Dam - Supplementary Curtain Grouting Employing Latest Technology Wimbleball is a 63m high buttress dam owned by South West Water and built in. During its working life it had been noted that seepages/leakages were increasing through the grout curtain on the left hand end of the dam. A recent project requiring application of many of the most recent technical developments was the supplementary grouting to reduce long-term seepages through the grout curtain of the left bank at Wimbleball Dam in Devon. In order to carry out the grouting works a number of significant problems had to be overcome • The dam geometry was extremely complex. • The reservoir could not be drawn down during the works • Injection work could only be carried out from the downstream backfill
between the downstream buttresses, from up to 20m below top water level, requiring all drilling to be carried out through blow-out preventers
• Known bedrock fissure geometry necessitated boreholes to be inclined across the face of the dam, and access from the downstream fill necessitated boreholes to also be inclined upstream
• Dam geometry, combined with the required borehole orientations, required drilling through the slender face concrete with extremely high accuracy to avoid ‘day-lighting’ into the reservoir
• Bedrock fissures widths and rock quality varied significantly, with some very fine fissures requiring a highly penetrating grout, and some very open fissures allowing extensive grout travel both through and across the face of the original grout curtain. Leakage through the existing curtain was via a network of irregular but discrete seepage paths
• The dam was highly sensitive to hydrostatic uplift, making it essential that the extensive and complex pressure relief well system was not compromised or reduced in efficiency at any time. The pressure relief wells were in direct hydraulic connection with fissures both upstream of the curtain, and traversing the grout curtain. This necessitated that grout injection take place upstream of the existing curtain, but under conditions of extremely close control of pressures and volume
• Environmental constraints of the National Park and fish farms 2 km downstream meant that no significant seepage could be allowed to pass into the river down stream.

HUGHES & KETTLE
To meet the above constraints, an extremely high degree of care and control was required in the planning and execution of the works. Measures adopted included • Preparation of a highly detailed 3-D CAD model of the dam, the
excavation profile, the original curtain geometry, and the foundations • Computer aided design of the grout holes with CASTAUR software,
generating instructions for setting out precise borehole geometry • Careful surveying of initial core holes which were used both as guide
holes and to allow blow out preventers to be sealed into the downstream face of the dam
• All drilling was executed via blow out preventers • Use of C3S - a stabilised & fluidified grout to designed avoid premature
blocking of fissures and ensure grout travel and penetration • Continuous monitoring of all relief well flows for pH and conductivity,
with physical inspection, to observe for grout connections & seepages • Provision for back-pumping of individual wells at critical periods of
grout injection to protect the well from grout contamination • Radio links between injection plant and drain monitoring crews • Use of SPHINX and SPICE equipment and software for real time
computer control of injection parameters - pressure, cumulative volume, flow rate - throughout each injection, with computer analysis of the results in CAD and SCAN-2D format to assist in interpretation of results
• Physical measures down stream for filtering any particulate material, grout or fissure infill, arising during injection
• Provision of facilities for citric acid dosing to correct pH imbalance arising from cement contact with seepage flows
The outcome of the works was a controlled investigation and reduction of seepages, without compromise to dam safety or environmental constraints.

IMPROVEMENTS IN RESERVOIRS
Figures. 4 & 5. SCAN -3D plots of Dam geometry, grout holes and grout injection parameters
Figure 6

HUGHES & KETTLE
CONCLUSIONS The process of grouting injection at dams has progressed greatly in the last few years with the development of computer software to help with the control of grout injected. This coupled with the 3D software available has made the whole process much more reliable and satisfactory from all views – the contractor, the designer and the client.
ACKNOWLEDGEMENT The authors wish to thank South West Water for their permission to publish this paper.