application of remote sensing data in lithological
TRANSCRIPT
227
Application of Remote Sensing Data in Lithological Discrimination of
Kerdous Inlier in the Anti Atlas Belt of Morocco
Amine Jellouli#, Abderrazak El Harti#, Zakaria Adiri#, El Mostafa Bachaoui#, Abderrahmane El Ghmari#
# Department of Earth Sciences, Sultan Moulay Slimane University, Beni Mellal, Morocco
E-mail: [email protected]
Abstract— Remote sensing data reveals a great importance for lithological mapping due to their spatial, spectral and radiometric
characteristics. Lithological mapping using spatial data is a preliminary and important step to mineral mapping. In this work, several
spectral and radiometric transformations methods were applied on Landsat 8 OLI data to enhance lithological units in the study area
situated in the Anti Atlas belt. The methods of Optimum Index Factor (OIF), Decorrelation Stretching (DS), Principal Components
Analysis (PCA) and Band Ratioing (BR) showed good results for lithological mapping in comparison with the existing geological and
field investigation. An RGB color composite of OLI bands 651 was developed for mapping lithological units of the study area by
fusing optimum index factor (OIF) and decorrelation stretching methods. furthermore, Band ratios derived from image spectra were
applied in two RGB color composites (7+4/2, PC1, PC2) and (PC1, 7/6, 3/7) providing good discrimination of the lithological units.
The Landsat-8 OLI data significantly provided satisfied results for lithological mapping.
Keywords— Landsat 8 OLI, OIF, Anti Atlas Belt, PCA, Lithological mapping.
I. INTRODUCTION
The use of remote sensing as an advanced and efficient
technique has shown its advantages in several fields such as
lithological and mineralogical mapping and lineament
mapping [1], [2]. On the one hand, it has reduced the cost
and time of field investigations and on the other hand, it
offers a variety of multispectral and hyperspectral data
covering a large area [3],[2],[4].
The availability of image data, with high or medium
spatial and spectral resolution, opens the door to an easy and
efficient identification of different geological structures such
as lineaments. furthermore, the different techniques and
methods of spatial imaging processing allow to extract
interpretable geological information with better precision [5].
Multispectral imagery data produced by multispectral
sensors such as Landsat 8 OLI, Terra ASTER, Landsat 5 TM,
Sentinel-2A and Landsat 7 ETM + have shown their
efficiency in mapping lithological units at different scales [2]
[4], as well as hyperspectral imagery data from hyperspectral
satellite and airborne sensors such as EO-1 Hyperion and
AVIRIS respectively, which are used for lithological and
mineralogical mapping due to their high spectral resolution
allowing the identification of hydrothermal alterations
minerals [3],[6],[7]. Several studies have been achieved in
lithological mapping by applying different spectral and
radiometric techniques and methods in order to enhance the
lithological structures [8], [9]. In addition, radar remote
sensing has been widely used in geological mapping as it is
extremely operational in the acquisition of images day and
night and even below clouds [10], [11].
Pournamdari et al (2014) demonstrated the utility of Terra
ASTER and Landsat 5 TM data for lithological mapping in
the Soghan ophiolotic complex in Iran. MohsenPournamdari
et al (2014) used several spectral transformation methods
such as band ratioing (BR), Principal Component Analysis
(PCA), Correlation Coefficient (CC) and Optimum Index
Factor (OIF), MohsenPournamdari et al (2014) developed a
RGB band ratio 4/1, 4/5, 4/7 using the ASTER image to
discriminate lithological units in ophiolitic complexes, as
well as the results obtained from ASTER and TM images by
applying the ACP methods. , OIF and CC showed a good
correlation with the pre-existing geological map. Amer et al
(2010) applied Principal Component Analysis (PCA) and
band ratios (BR) on Terra ASTER imagery in the central
eastern Fawakhir Desert in Egypt, Thus, They presented a
new method for lithological mapping in arid environments.
In addition, Amer et al (2010) showed that ASTER data
have important potential for mapping granitic and ophiolitic
rocks by applying band ratios (2 + 4) / 3, (5 + 7) / 6, (7 + 9) /
8. Also, a color composite of the ACP bands (5,4,2) showed
satisfied results to identify ophiolitic rocks
INTERNATIONAL JOURNAL ON INFORMATICS VISUALIZATION
VOL 3 (2019) NO 2-2 e-ISSN : 2549-9904
ISSN : 2549-9610

228
Fig. 1 Geographical setting of the anti atlas belt
II. GEOLOGICAL SETTING OF THE STUDY AREA
The Moroccan Anti-Atlas is a mountain belt in
southwestern Morocco, oriented ENE-WSW about 800 km
long and 200 km wide (Fig. 1). It is located between the
central High Atlas and the Sahara desert and extending south
of the High Atlas Mountains and north of the West African
Craton (WAC)[12], the latter is formed during the phase of
the Eburnean Orogeny which characterized the assembly of
the Precambrian Anti Atlas terrains in the form of twelve
inliers [13].
The Kerdous inlier belongs to the western Anti Atlas,
among the inliers of the Moroccan Anti Atlas, it presents a
complex precambrian basement diversified by the existence
of important structural formations specifically Tanalt, Anzi
and Tafraout [13].
The study area is located between latitudes 28° 4 '20.56 "
N and 32° 7' 0.38" N and longitudes 4° 32 '34.93 " W and
11° 15' 3.93" W. This study area consists of breccias and
volcanic rocks that break off discontinuously along Kerdous
inlier boundaries of the Tanalt Formation in the Ouarzazate
Group [13].
Northeast of Kerdous inlier, the Neoproterozoic quartzites
of Jbel Lkest are truncated by a dip extension NE associated
with conglomerates of the Tanalt Formation. Northeast ofthe
study area, the lower Cambrian is represented by the
sedimentary formations of dolomites and argillites of the
Taroudant group (Adoudou and Iz'riyne formations). The
vulcanites and ryolitic ignimbrites characterize neo-
proterozoic formation Ait-Baha [13]. The geological map
used in this study is the Tanalt geological map (1:50 000),
published in 2001 by the Ministry of Industry, Trade, Energy
and Mining and is prepared by the British Geological
Institute. Survey. The diversely oriented faults and fractures
of the study area reflect the multiple deformation events that
have affected the region through geologic time. in addition,
the study area has to be considered as a promising mineral
exploration zone by several research institutions by reason of
geological history of the Anti Atlas belt and its mineral ore
deposits abundance.
Fig. 2 Lithological map of the study area
229
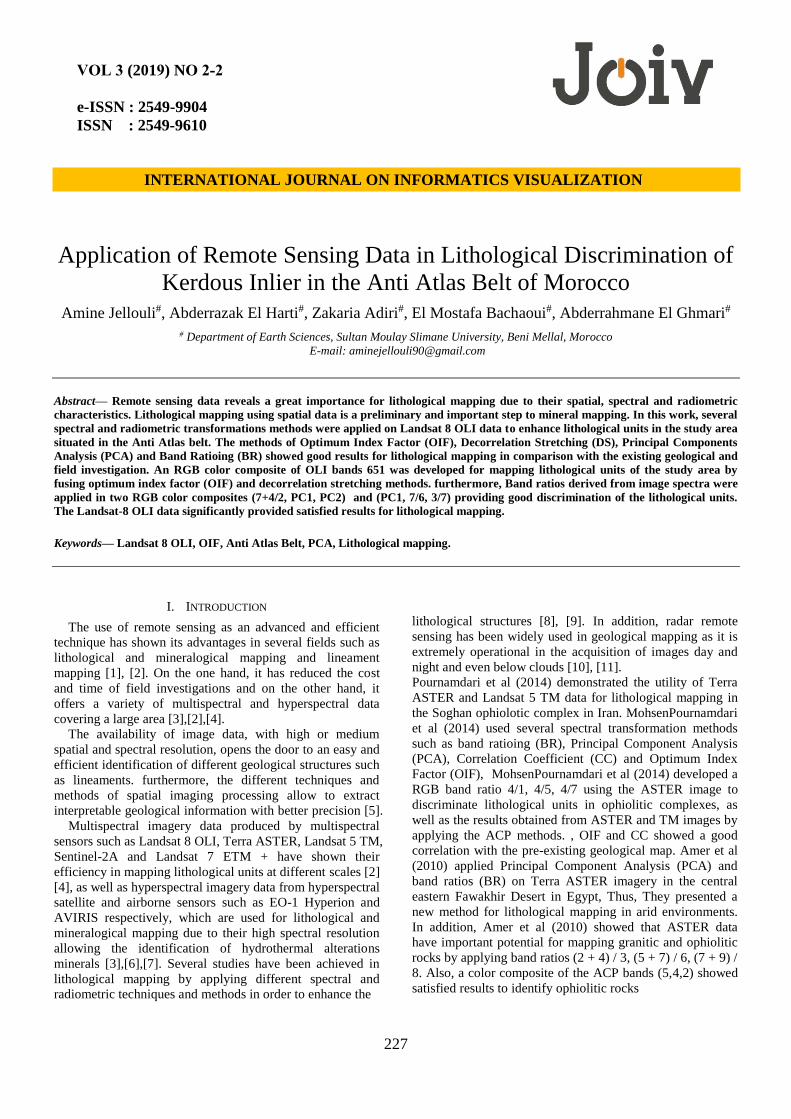
Fig. 1 Field photographs of lithological units: (a) Brown dolomite with
intercalations of marl (b) Quartzite sandstone (c) Intrusions of gabbro (d)
Siltstone and argillite (e) Rhyolitic volcanite and ignimbrite with
epiclastic deposits (f) Volcanic conglomerates
III. MATERIALS AND METHODS
A. Landsat 8 Oli Data
The Landsat 8 satellite was launch on February 11, 2013
and carries both sensors, the Operational Land Imager (OLI)
and Thermal Infrared Sensor (TIRS), these sensors covers
the Visible and Near Infrared (VNIR), Short Wave Infrared
(SWIR) and Thermal Infrared range (TIR) of the
electromagnetic spectrum on 11 bands, including a deep
blue coastal/aerosol band and a short-wave cirrus band [14].
Operational Land Imager (OLI) multispectral sensor
collect data in a range of spectral regions through the
visible and near infrared (VNIR), short wave infrared
(SWIR). OLI has 9 spectral bands, including 5 VNIR
between 0.43 and 0.88 µm including coastal aerosol band,
3 SWIR bands between 1.57 and 2.29 µm including the
Cirrus band (Table I). We used the OLI level-1T
(Corrected Terrain) data product from the Land Processes
Distributed Active Archive Center at NASA. The Landsat
8 OLI image is radiometrically calibrated, geometrically
co-registered and orthorectified. Landsat 8 OLI image
scene are characterized by a high radiometric resolution
(16 bits), and the scenes cover 185 x 180 km, available at
free of charges [14].
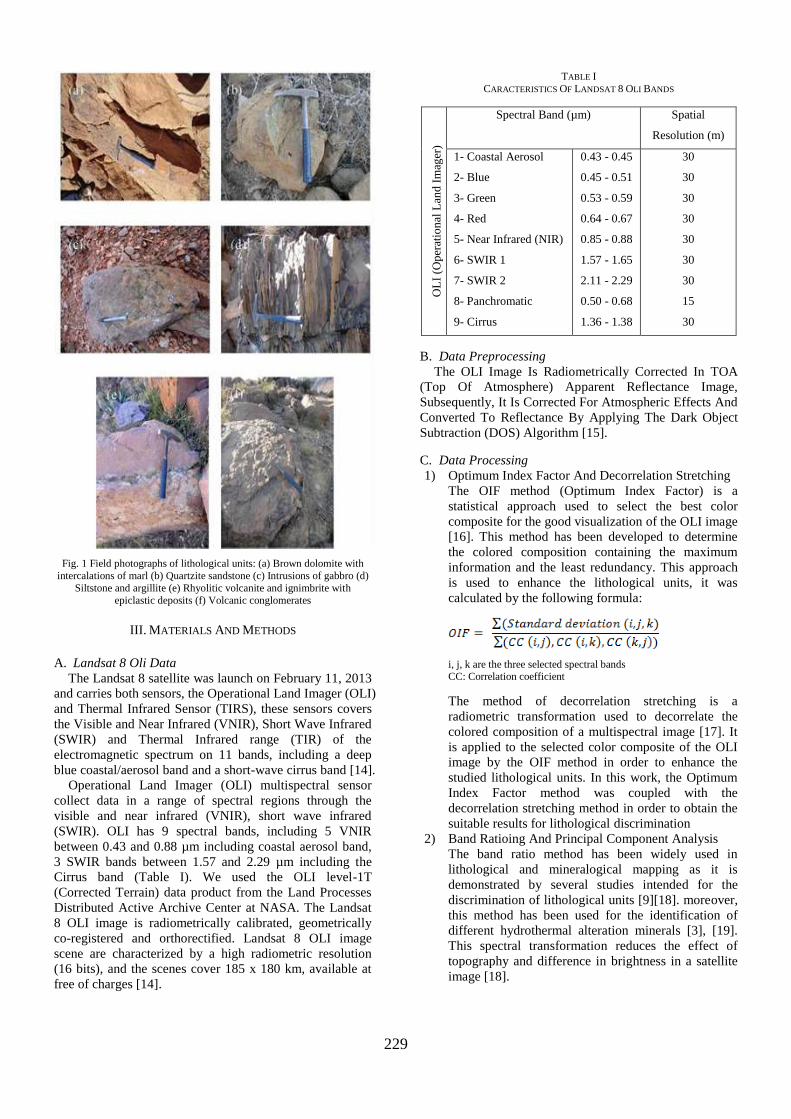
TABLE I
CARACTERISTICS OF LANDSAT 8 OLI BANDS
OL
I (O
per
atio
nal
Lan
d I
mag
er)
Spectral Band (µm) Spatial
Resolution (m)
1- Coastal Aerosol
2- Blue
3- Green
4- Red
5- Near Infrared (NIR)
6- SWIR 1
7- SWIR 2
8- Panchromatic
9- Cirrus
0.43 - 0.45
0.45 - 0.51
0.53 - 0.59
0.64 - 0.67
0.85 - 0.88
1.57 - 1.65
2.11 - 2.29
0.50 - 0.68
1.36 - 1.38
30
30
30
30
30
30
30
15
30
B. Data Preprocessing
The OLI Image Is Radiometrically Corrected In TOA
(Top Of Atmosphere) Apparent Reflectance Image,
Subsequently, It Is Corrected For Atmospheric Effects And
Converted To Reflectance By Applying The Dark Object
Subtraction (DOS) Algorithm [15].
C. Data Processing
1) Optimum Index Factor And Decorrelation Stretching
The OIF method (Optimum Index Factor) is a
statistical approach used to select the best color
composite for the good visualization of the OLI image
[16]. This method has been developed to determine
the colored composition containing the maximum
information and the least redundancy. This approach
is used to enhance the lithological units, it was
calculated by the following formula:
i, j, k are the three selected spectral bands CC: Correlation coefficient
The method of decorrelation stretching is a
radiometric transformation used to decorrelate the
colored composition of a multispectral image [17]. It
is applied to the selected color composite of the OLI
image by the OIF method in order to enhance the
studied lithological units. In this work, the Optimum
Index Factor method was coupled with the
decorrelation stretching method in order to obtain the
suitable results for lithological discrimination
2) Band Ratioing And Principal Component Analysis
The band ratio method has been widely used in
lithological and mineralogical mapping as it is
demonstrated by several studies intended for the
discrimination of lithological units [9][18]. moreover,
this method has been used for the identification of
different hydrothermal alteration minerals [3], [19].
This spectral transformation reduces the effect of
topography and difference in brightness in a satellite
image [18].

230
Principal Component Analysis (PCA) is a statistical
method applied to multispectral and hyperspectral
image in order to reduce the number of spectral bands
containing non-redundant information [20]. It consists
of transforming the set of image data with correlated
variables into new bands called Principal Components
(PCs). It has the advantage of compressing the
information contained in the original bands,
eliminating information redundancy in the image data
and isolating noise, which enhances the targeted
information in the image. this method is extensively
applied in geological mapping and lineaments
mapping as well [21].
IV. RESULTS AND DISCUSSION
A. Optimum Index Factor And Decorrelation Stretching
The Optimum Index Factor (OIF) and Decorrelation
Stretching methods are used to enhance the lithological
units in the study area. The OIF index is calculated for the
OLI image and three RGB color composites are chosen. the
selected RGB color composite of bands 651 (fig. 4)
contains the maximum of information. The tables I and II
show the OIF of the three RGB color composites and
correlation values of OLI image, respectively: TABLE II
OIF VALUES OF THE THREE SELECTED RGB COLOR COMPOSITES
OLI image show that RGB color composites 651 and
751 have almost the same OIF values as a result of high
correlation between bands 6 and 7 (table II). Based on the
results obtained, the selected RGB color composite 651 is
decorrelated by applying the Decorrelation Stretching
method in order to enhance contrast and demonstrate more
details (fig. 4). The RGB color composite 651 shows good
discrimination of the abundant lithological units of
quartzite sandstone (Qs) and intrusions of gabbro (Gb) and
are distinguished by TABLE III
CORRELATION VALUES OF THE OLI IMAGE
Brown-orange and green colors respectively. The
rhyolitic-andesitic volcanite and ignimbrite with epiclastic
deposits and gaps (Ra) is mapped by the cyan color while
rhyolitic volcanite and ignimbrite with sandstone and
conglomerates (Rs) is discriminated by blue-grenat color.
Brown dolomite with intercalations of marl (Di) appears
by red-pink color and siltstone with argillite (Sa) are also
discriminated by pink-orange color. In addition, volcanic
conglomerates unit (Vc) is mapped by the light blue.
Regarding intrusions of basalt unit (B), it appears grenat.
The ryolitic volcanite and ignimbrite with epiclastic
deposits (Re) is mapped by the blue color. Finally, brown
dolomite with stromatolite (Ds) appears in orange-red color.
Fig. 2 Selected RGB color composite 651 of OLI image bands
B. Band Ratioing And Principal Component Analysis
Three bands ratios were derived on the basis of the
corrected OLI image spectra allows identification of
several lithological units of the study area, these bands
ratios were selected to be combined with principal
components analysis bands to reveal the best lithological
discrimination. The bands ratio (7+4/2) is allowed to
discriminate brown dolomite with stromatolite (Ds), since
its spectra shows high reflectance in bands 7 and 4, against
absorption in band 2. additionally, the quartzite sandstone
(Qs) were detected by the ratio (7/6) because its spectra
represents high reflectance in band 7 and absorption in
band 6 (1.6 µm) at the SWIR range which refers to argillic
alteration [21]. The band ratio (3/7) enhanced the
lithological units, volcanic conglomerates (Vc) and
rhyolitic volcanite and ignimbrite with epiclastic deposits
(Re), showing a high reflectance in band 3 and an
absorption in band 7 (2.20 µm) related to Al-OH
absorption due to clay minerals [21].
The principal component analysis (PCA) transformation
has been applied to the OLI spatial subset scene of the
study area. A new PCA image contains 6 new image
components were generated from the original 6 bands
(VNIR + SWIR) of the original OLI image. The principal
component analysis transformation was applied to the 6
VNIR+SWIR bands of OLI image to collect more
information which could not be extracted from the VNIR +
SWIR bands of the original data. the three first components
(PC1, PC2 and PC3) have 99.78% of eigenvalues
Blue Green Red OIF value
Color
Composite
band 1 band 5 band 6 71.42
band 1 band 5 band 7 71.02
band 2 band 5 band 7 69.24
OLI bands Band
1
Band
2
Band
3
Band
4
Band
5
Band
6
Band
7
Band 1 1
Band 2 0.99 1
Band 3 0.96 0.98 1
Band 4 0.93 0.95 0.98 1
Band 5 0.74 0.79 0.85 0.83 1
Band 6 0.78 0.82 0.88 0.91 0.85 1
Band 7 0.85 0.86 0.90 0.93 0.79 0.96 1
231
percentage of all the bands and were fused with Band
Ratios in RGB color composites to enhance lithological
units of the study area. The PC1 has the highest eigenvalue. TABLE IV
Matrix Of Eigenvectors Extracted After Calculating The Pca On Oli Image
percentage of all the bands approximately (97 %) with
all positive contributions. In table IV, the PC2 shows
positive contribution at band 4 and negative contributions
in bands 5 and 6 and the image enhanced well the
intrusions of gabbro (Gb) with vegetation, also, it enhanced
the volcanic conglomerates (Vc). In addition, the rhyolitic-
andesitic volcanite and ignimbrite with epiclastic deposits
and gaps (Ra)
and volcanic conglomerates (Vc) are distinguisged in
PC3 which shows positive contribution at band 3 and
negative contribution in band 5. By analyzing the
characteristics and rate of contributions of PC4, brown
dolomite with intercalations of marl (Di) and quartzite
sandstone (Qs) are detected as brightly pixilated and it
shows extremely negative and positive contributions in
bands 5and 6 respectively. The silstone and argillite (Sa)
can be detected as bright pixels in PC5 because of the
positive contributions in bands 1 and 2 while negative
contributions derived from band 3. For the remaining PC6,
it had not been considered in further processing because it
contain only noise and cannot provide any valuable
information.
In the light of the results obtained from bands ratios and
principal components analysis and after applying different
combinations of bands ratios and PCA, two RGB color
composite (CC) images were generated using the PC1 and
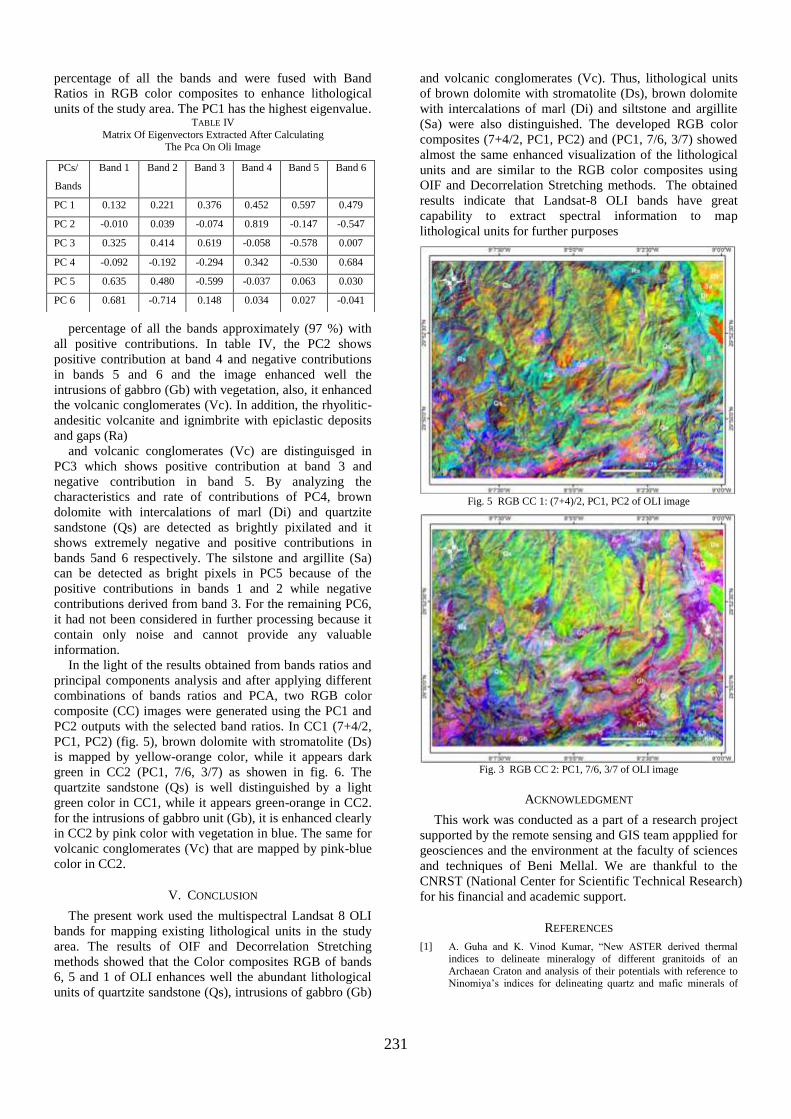
PC2 outputs with the selected band ratios. In CC1 (7+4/2,
PC1, PC2) (fig. 5), brown dolomite with stromatolite (Ds)
is mapped by yellow-orange color, while it appears dark
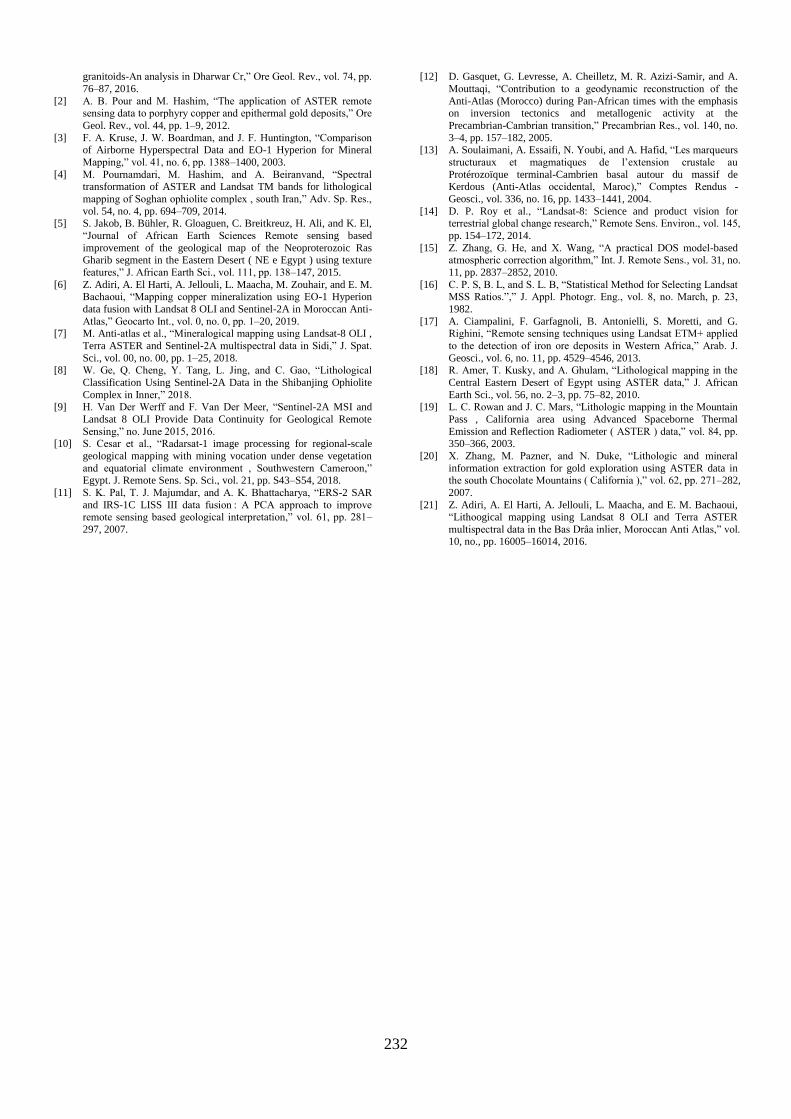
green in CC2 (PC1, 7/6, 3/7) as showen in fig. 6. The
quartzite sandstone (Qs) is well distinguished by a light
green color in CC1, while it appears green-orange in CC2.
for the intrusions of gabbro unit (Gb), it is enhanced clearly
in CC2 by pink color with vegetation in blue. The same for
volcanic conglomerates (Vc) that are mapped by pink-blue
color in CC2.
V. CONCLUSION
The present work used the multispectral Landsat 8 OLI
bands for mapping existing lithological units in the study
area. The results of OIF and Decorrelation Stretching
methods showed that the Color composites RGB of bands
6, 5 and 1 of OLI enhances well the abundant lithological
units of quartzite sandstone (Qs), intrusions of gabbro (Gb)
and volcanic conglomerates (Vc). Thus, lithological units
of brown dolomite with stromatolite (Ds), brown dolomite
with intercalations of marl (Di) and siltstone and argillite
(Sa) were also distinguished. The developed RGB color
composites (7+4/2, PC1, PC2) and (PC1, 7/6, 3/7) showed
almost the same enhanced visualization of the lithological
units and are similar to the RGB color composites using
OIF and Decorrelation Stretching methods. The obtained
results indicate that Landsat-8 OLI bands have great
capability to extract spectral information to map
lithological units for further purposes
Fig. 5 RGB CC 1: (7+4)/2, PC1, PC2 of OLI image
Fig. 3 RGB CC 2: PC1, 7/6, 3/7 of OLI image
ACKNOWLEDGMENT
This work was conducted as a part of a research project
supported by the remote sensing and GIS team appplied for
geosciences and the environment at the faculty of sciences
and techniques of Beni Mellal. We are thankful to the
CNRST (National Center for Scientific Technical Research)
for his financial and academic support.
REFERENCES
[1] A. Guha and K. Vinod Kumar, “New ASTER derived thermal
indices to delineate mineralogy of different granitoids of an
Archaean Craton and analysis of their potentials with reference to Ninomiya’s indices for delineating quartz and mafic minerals of
PCs/
Bands
Band 1 Band 2 Band 3 Band 4 Band 5 Band 6
PC 1 0.132 0.221 0.376 0.452 0.597 0.479
PC 2 -0.010 0.039 -0.074 0.819 -0.147 -0.547
PC 3 0.325 0.414 0.619 -0.058 -0.578 0.007
PC 4 -0.092 -0.192 -0.294 0.342 -0.530 0.684
PC 5 0.635 0.480 -0.599 -0.037 0.063 0.030
PC 6 0.681 -0.714 0.148 0.034 0.027 -0.041
232
granitoids-An analysis in Dharwar Cr,” Ore Geol. Rev., vol. 74, pp.
76–87, 2016.
[2] A. B. Pour and M. Hashim, “The application of ASTER remote sensing data to porphyry copper and epithermal gold deposits,” Ore
Geol. Rev., vol. 44, pp. 1–9, 2012.
[3] F. A. Kruse, J. W. Boardman, and J. F. Huntington, “Comparison of Airborne Hyperspectral Data and EO-1 Hyperion for Mineral
Mapping,” vol. 41, no. 6, pp. 1388–1400, 2003.
[4] M. Pournamdari, M. Hashim, and A. Beiranvand, “Spectral transformation of ASTER and Landsat TM bands for lithological
mapping of Soghan ophiolite complex , south Iran,” Adv. Sp. Res.,
vol. 54, no. 4, pp. 694–709, 2014. [5] S. Jakob, B. Bühler, R. Gloaguen, C. Breitkreuz, H. Ali, and K. El,
“Journal of African Earth Sciences Remote sensing based
improvement of the geological map of the Neoproterozoic Ras Gharib segment in the Eastern Desert ( NE e Egypt ) using texture
features,” J. African Earth Sci., vol. 111, pp. 138–147, 2015.
[6] Z. Adiri, A. El Harti, A. Jellouli, L. Maacha, M. Zouhair, and E. M. Bachaoui, “Mapping copper mineralization using EO-1 Hyperion
data fusion with Landsat 8 OLI and Sentinel-2A in Moroccan Anti-
Atlas,” Geocarto Int., vol. 0, no. 0, pp. 1–20, 2019. [7] M. Anti-atlas et al., “Mineralogical mapping using Landsat-8 OLI ,
Terra ASTER and Sentinel-2A multispectral data in Sidi,” J. Spat.
Sci., vol. 00, no. 00, pp. 1–25, 2018. [8] W. Ge, Q. Cheng, Y. Tang, L. Jing, and C. Gao, “Lithological
Classification Using Sentinel-2A Data in the Shibanjing Ophiolite
Complex in Inner,” 2018. [9] H. Van Der Werff and F. Van Der Meer, “Sentinel-2A MSI and
Landsat 8 OLI Provide Data Continuity for Geological Remote
Sensing,” no. June 2015, 2016. [10] S. Cesar et al., “Radarsat-1 image processing for regional-scale
geological mapping with mining vocation under dense vegetation
and equatorial climate environment , Southwestern Cameroon,” Egypt. J. Remote Sens. Sp. Sci., vol. 21, pp. S43–S54, 2018.
[11] S. K. Pal, T. J. Majumdar, and A. K. Bhattacharya, “ERS-2 SAR
and IRS-1C LISS III data fusion : A PCA approach to improve remote sensing based geological interpretation,” vol. 61, pp. 281–
297, 2007.
[12] D. Gasquet, G. Levresse, A. Cheilletz, M. R. Azizi-Samir, and A.
Mouttaqi, “Contribution to a geodynamic reconstruction of the
Anti-Atlas (Morocco) during Pan-African times with the emphasis on inversion tectonics and metallogenic activity at the
Precambrian-Cambrian transition,” Precambrian Res., vol. 140, no.
3–4, pp. 157–182, 2005. [13] A. Soulaimani, A. Essaifi, N. Youbi, and A. Hafid, “Les marqueurs
structuraux et magmatiques de l’extension crustale au
Protérozoïque terminal-Cambrien basal autour du massif de Kerdous (Anti-Atlas occidental, Maroc),” Comptes Rendus -
Geosci., vol. 336, no. 16, pp. 1433–1441, 2004.
[14] D. P. Roy et al., “Landsat-8: Science and product vision for terrestrial global change research,” Remote Sens. Environ., vol. 145,
pp. 154–172, 2014.
[15] Z. Zhang, G. He, and X. Wang, “A practical DOS model-based atmospheric correction algorithm,” Int. J. Remote Sens., vol. 31, no.
11, pp. 2837–2852, 2010.
[16] C. P. S, B. L, and S. L. B, “Statistical Method for Selecting Landsat MSS Ratios.”,” J. Appl. Photogr. Eng., vol. 8, no. March, p. 23,
1982.
[17] A. Ciampalini, F. Garfagnoli, B. Antonielli, S. Moretti, and G. Righini, “Remote sensing techniques using Landsat ETM+ applied
to the detection of iron ore deposits in Western Africa,” Arab. J.
Geosci., vol. 6, no. 11, pp. 4529–4546, 2013. [18] R. Amer, T. Kusky, and A. Ghulam, “Lithological mapping in the
Central Eastern Desert of Egypt using ASTER data,” J. African
Earth Sci., vol. 56, no. 2–3, pp. 75–82, 2010. [19] L. C. Rowan and J. C. Mars, “Lithologic mapping in the Mountain
Pass , California area using Advanced Spaceborne Thermal
Emission and Reflection Radiometer ( ASTER ) data,” vol. 84, pp. 350–366, 2003.
[20] X. Zhang, M. Pazner, and N. Duke, “Lithologic and mineral
information extraction for gold exploration using ASTER data in the south Chocolate Mountains ( California ),” vol. 62, pp. 271–282,
2007.
[21] Z. Adiri, A. El Harti, A. Jellouli, L. Maacha, and E. M. Bachaoui, “Lithoogical mapping using Landsat 8 OLI and Terra ASTER
multispectral data in the Bas Drâa inlier, Moroccan Anti Atlas,” vol. 10, no., pp. 16005–16014, 2016.