application of rs-gis for flood study of champhone district …€¦ · the 3rd jptm 13-15 march...
TRANSCRIPT

The 3rd JPTM 13-15 March 2007 @ Le Meridien Singapore
Flood Risk Map using RS & GIS:Flood Risk Map using RS & GIS:Case Study of Case Study of ChamphoneChamphone District in District in SavannakhetSavannakhet
Province, Lao PDR.Province, Lao PDR.
Ms. Virany SENGTIANTHREnvironment Research Institute Science Technology and Environment AgencyDepartment of Meteorology and Hydrology Ministry of Agriculture and Forestry E-mail: [email protected]

Contents Contents
1. Introduction2. Objective3. Data used 4. Methodology5. Field survey 6. Result7. Conclusion and Recommendation8. Future Work Plan

IntroductionIntroductionGeographylandlocked
Area: total: 236,800 sq km2 Savannakhet:21,774 square km2Champhone: 1049,759 sq km2 Mekong river flow: 1,860 km border countries: Myanmar 235 km, Cambodia 541 km, China 423 km, Thailand 1,754 km, Vietnam 2,130 kmTotal: Population: 5,800,000 (2004) Champhone pop:102,717 (2005)

IntroductionIntroduction (continue)(continue)
Flooding is the main natural disaster in Lao PDR.There are floods along the Mekong river every year, those areas represent almost a half of the countries surface and agricultureproduction are concentrated. The historic flooding five years were large covering the whole countries (1966, 1971, 1978, 1995 and 2002.)Flooding along the whole countries result from heavy monsoon rainfall and tropical cyclone originating in the south of china sea during the period August and September.Flooding some province in the north is race, because of the sloping area, the flow flood water is strong to the center area and the south.
ObjectiveObjectiveMain Objective:To prepare flood risk map using RS-GIS at Champhone district
1. Prepare flood hazard and vulnerability maps 2. Identify flood risk area.

Study Area and Data Study Area and Data
Lao PDR
SavannakhetProvince,
ChamphoneDistrict
Pop: 102,717
Village: 171
Latitude:16˚ 40"- 15˚ 50“Longitude: 104˚ 45" - 105˚ 45" Source: http://www.faorap-apcas.org/lao/
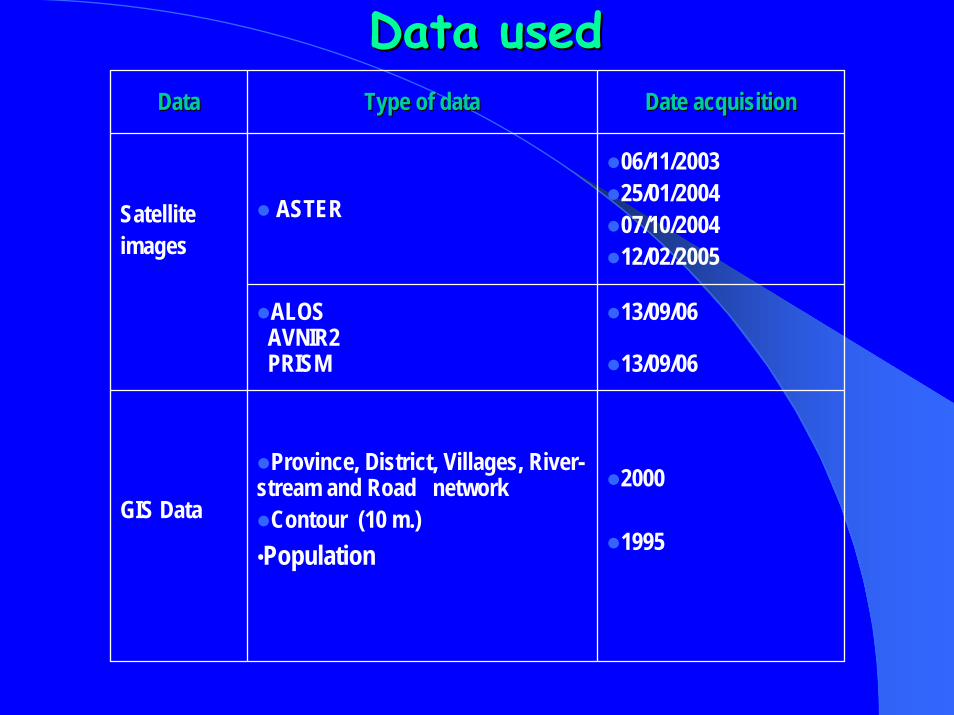
Data usedData usedDataData Type of data Type of data Date acquisitionDate acquisition
ASTER
06/11/200325/01/200407/10/200412/02/2005
ALOSAVNIR2PRISM
13/09/06
13/09/06
Satellite images
GIS Data
Province, District, Villages, River-stream and Road network
Contour (10 m.)•Population
2000
1995

Xe Champhone Basin
Champhone District
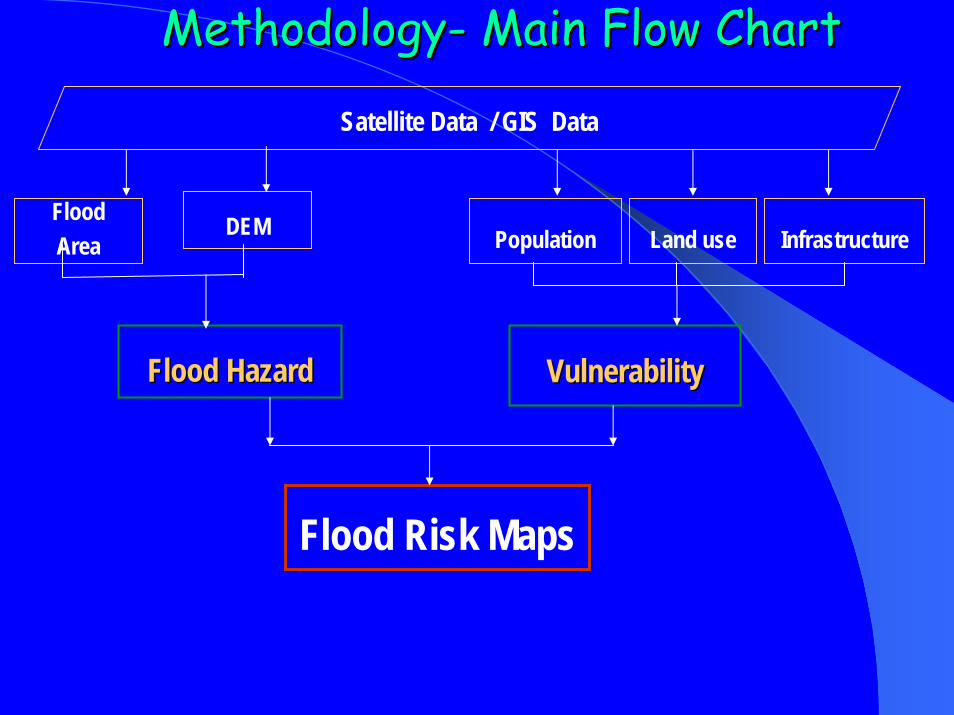
MethodologyMethodology-- Main Flow ChartMain Flow Chart
Satellite Data / GIS Data
Land use
Flood Risk Maps
Flood Area Population
Flood HazardFlood Hazard VulnerabilityVulnerability
DEM Infrastructure

MethodologyMethodology-- Flood Hazard
ASTER10/04 -02/05
Flood Area
Flood Hazard
ALOS09/06
FloodMRC
Classification
Union
GIS Analysis
Fieldsurvey
Flood HazardFlood Hazard
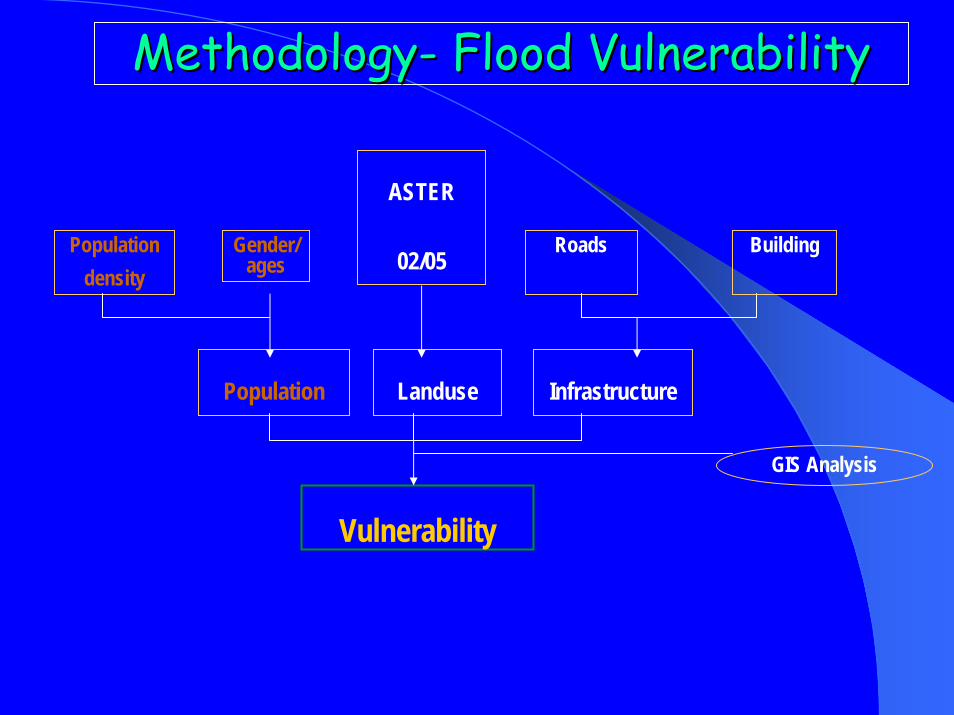
MethodologyMethodology-- Flood VulnerabilityFlood Vulnerability
ASTER
02/05
LandusePopulation
Vulnerability
Infrastructure
GIS Analysis
Populationdensity
Gender/ages
Roads Building

MethodologyMethodology-- Flood RiskFlood Risk
Hazard Vulnerability
GIS Analysis
Flood RiskFlood Risk
(Future work)
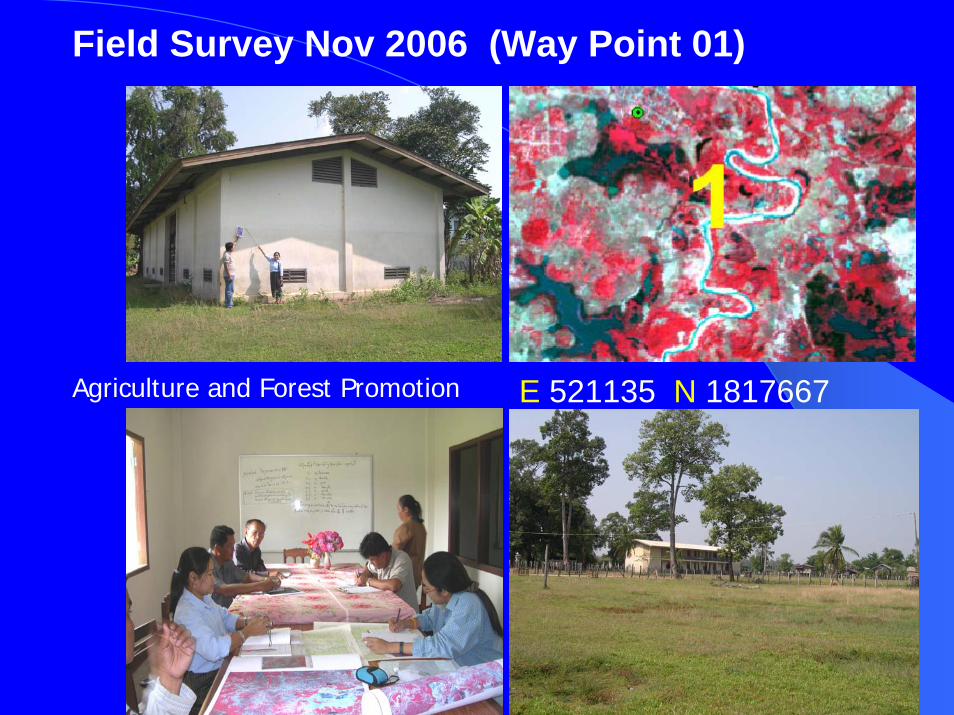
Field Survey Nov 2006 (Way Point 01)
Agriculture and Forest Promotion E 521135 N 1817667
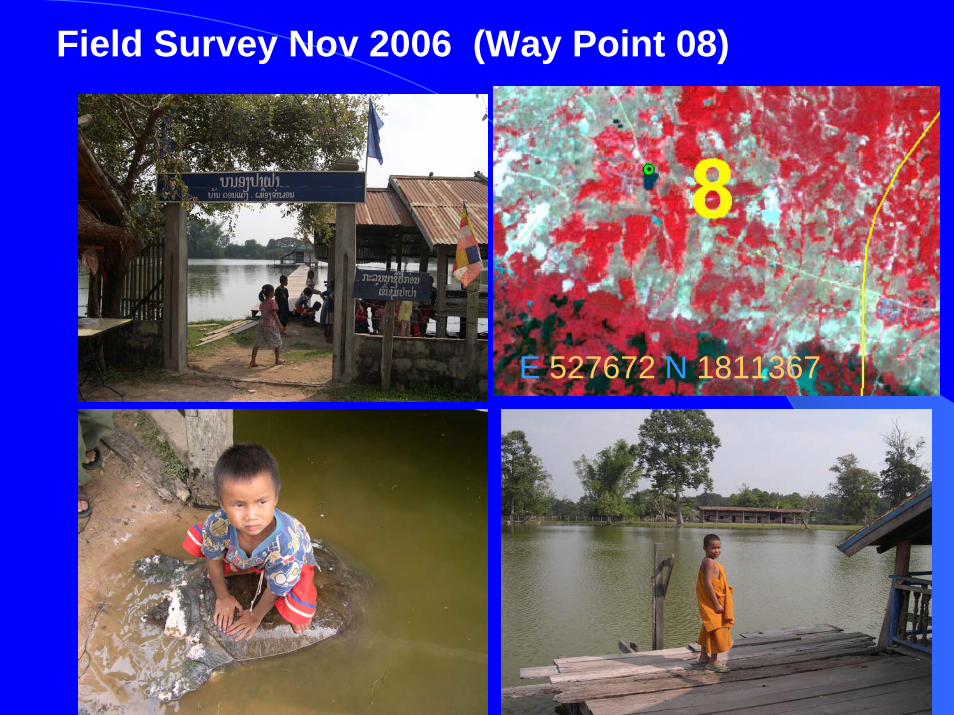
Field Survey Nov 2006 (Way Point 08)
E 527672 N 1811367

Field Survey Nov 2006 (Way Point 12, 13)
12
E 518198 N 1826682
13
E 519826 N 1826390
13
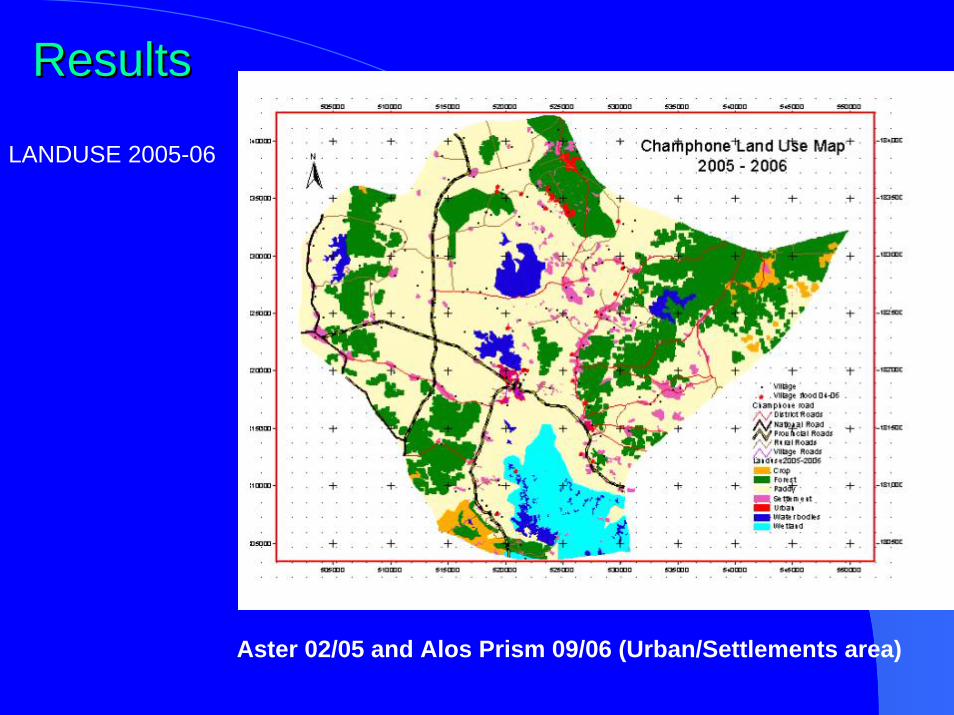
ResultsResults
LANDUSE 2005-06
Aster 02/05 and Alos Prism 09/06 (Urban/Settlements area)
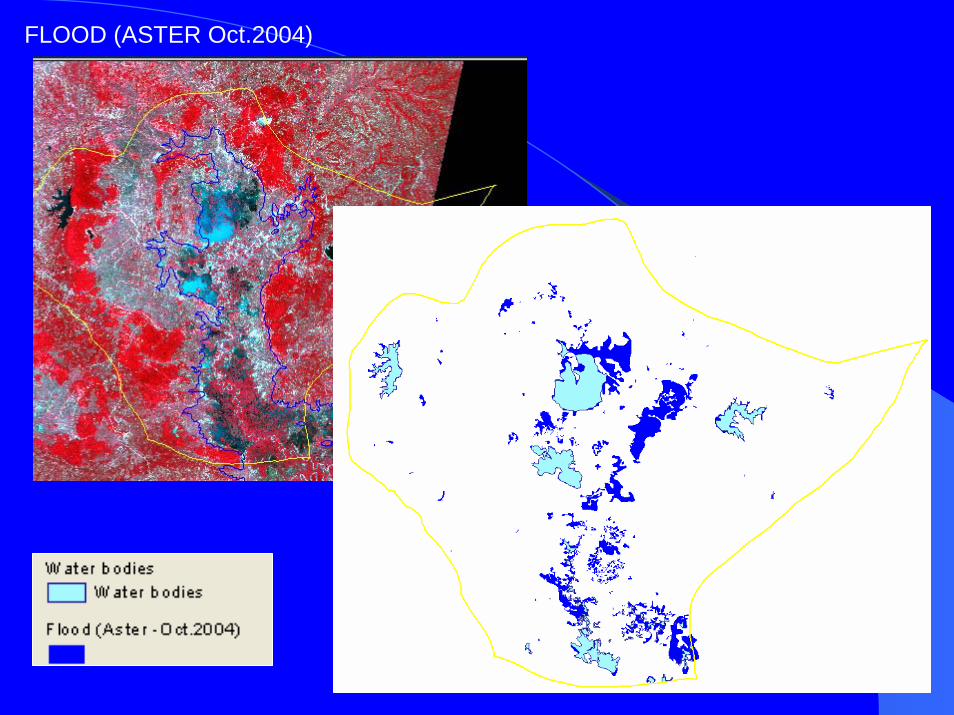
FLOOD (ASTER Oct.2004)

FLOOD (ALOS VNIR Sep.2006)


Flood Hazard Map

ALOS/PRISM 13/09/2006

Building map and Road map from ALOS/ PRISM
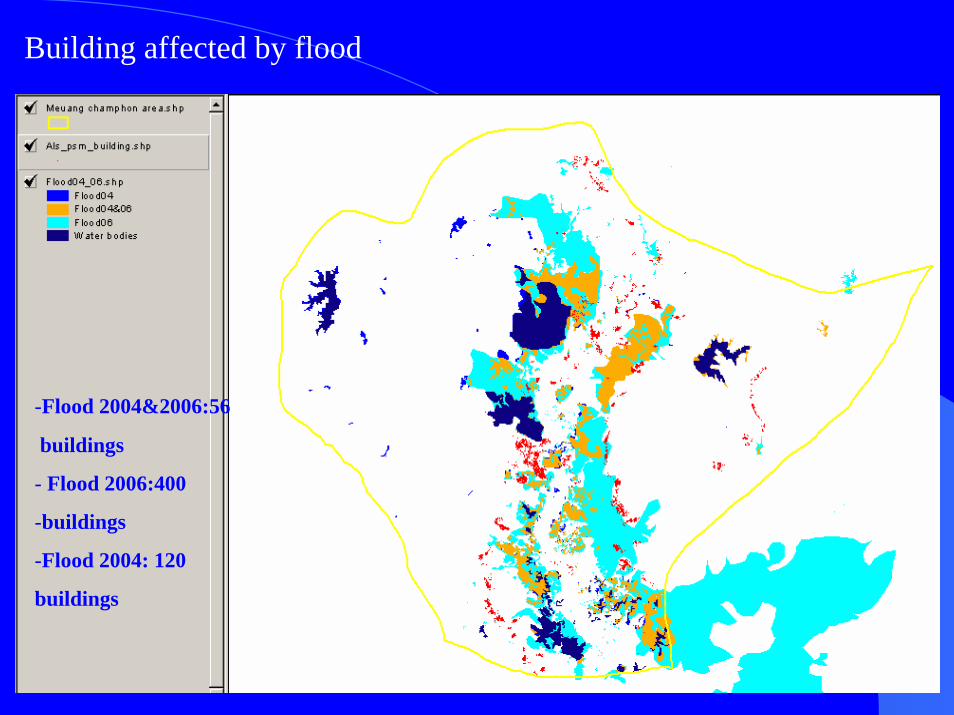
Building affected by flood
-Flood 2004&2006:56
buildings
- Flood 2006:400
-buildings
-Flood 2004: 120
buildings
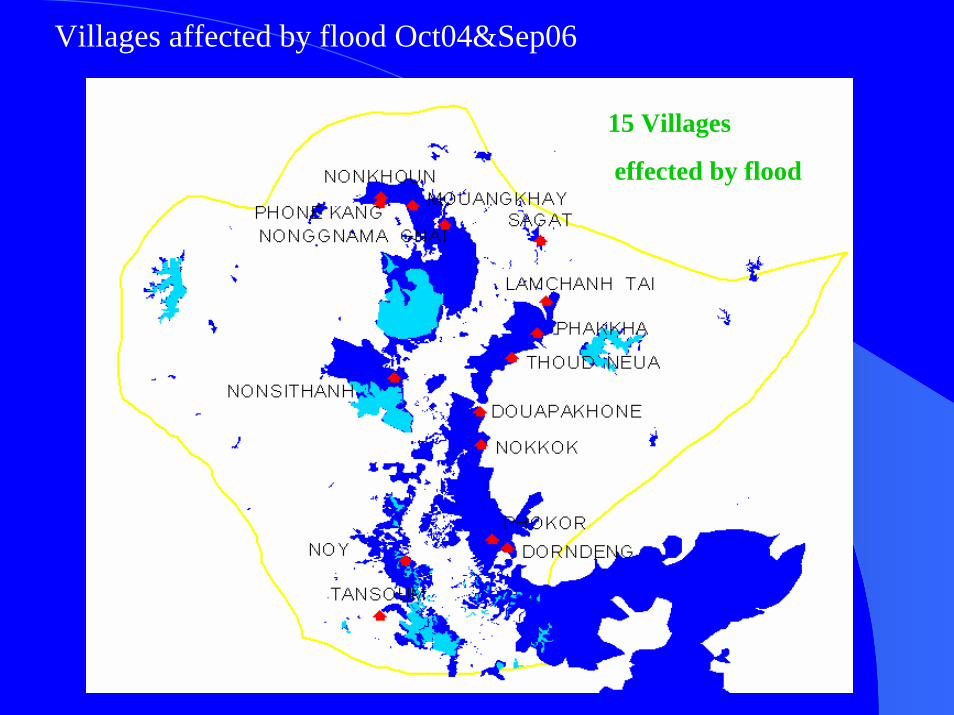
Villages affected by flood Oct04&Sep06
15 Villages
effected by flood

Land use in flood
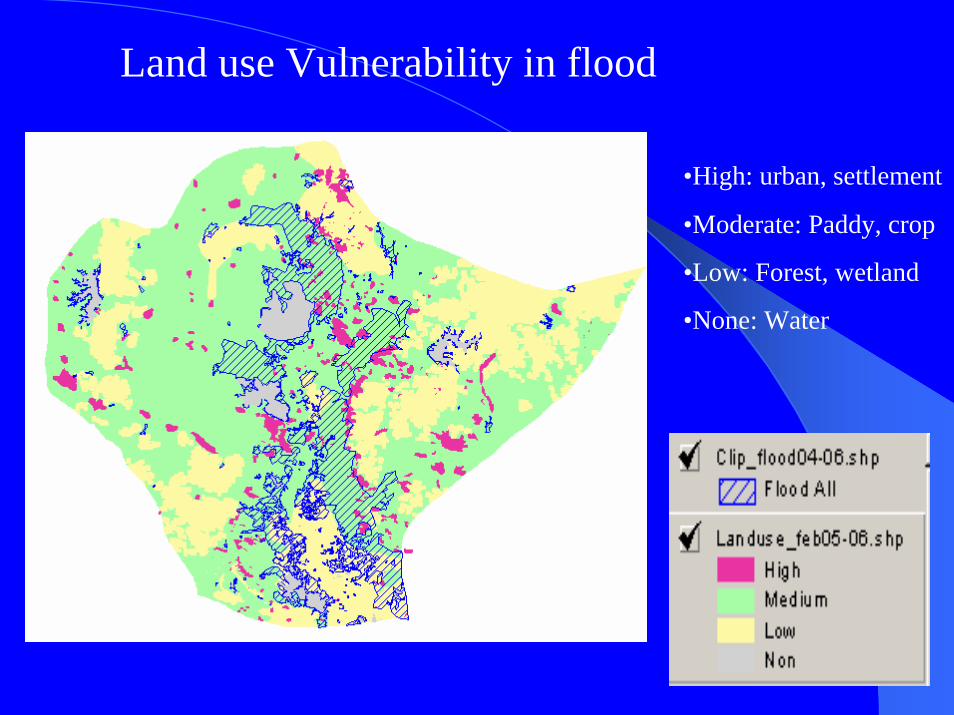
Land use Vulnerability in flood
•High: urban, settlement
•Moderate: Paddy, crop
•Low: Forest, wetland
•None: Water

Roads in flood

Road Vulnerability in flood
H: Rural road
M: District rd
L: National, prov,
urban rd

Conclusion and Recommendation Conclusion and Recommendation RS&GIS are very useful for flood risk mapping (i) Satellite can be use for flood mapping with detail accuracy.(ii) Optical image is good enough for Land use classification /
SAR image would be better for flood mapping in study area(iii) Elevation map need to use PRISM/ ALOS(iv) ASTER/ AVNIR and ALOS VNIR good for Landuse map(v) Flood map prepared by ASTER/ AVNIR and ALOS VNIR is satisfy(vi) GIS process: we can get flood hazard map, flood affected area,
vulnerability map(vii) Flood map (ASTER, ALOS/VNIR), Land use (ASTER/AVNIR),
Building/road/settlement (ALOS/PRISM) (viii) PRISM data: provide high resolution to clearly extract building, road,
river, etc.

RecommendationRecommendationThere is insufficient satellite image in the study area, we need image support: (especially in flood period) ALOS: PRISM, AVNIR and PALSAR
Future Work: 2007Future Work: 2007--20082008Continue: Flood / same area - 2006-2007 Collection population, building (housing, school, hospital, temple) and agriculture statistic (rice production, crop)- PRISM/ ALOS: DEM generation- Flood vulnerability and flood risk mapping (continue)- Field visit: August 2007- Propose future project 2008 for whole watershed area (XeChamphone) Old Agency andPropose Agency involve 2007-2008: LNMC


Thank you very muchThank you very muchfor your kind attention.for your kind attention.