application of well testing in assessing … · well testing 3 sarmiento 2.2 completion test...
TRANSCRIPT
Presented at “Short Course on Geothermal Drilling, Resource Development and Power Plants”, organized by UNU-GTP and LaGeo, in San Tecla, El Salvador, January 16-22, 2011.
1
GEOTHERMAL TRAINING PROGRAMME LaGeo S.A. de C.V.
APPLICATION OF WELL TESTING IN ASSESSING GEOTHERMAL RESOURCES
Zosimo F. Sarmiento FEDCO – Filtech Energy Drilling Corporation
Tesco Compound, RMT Industrial Complex Tunasan, Muntinlupa City, 1773 PHILIPPINES
ABSTRACT
Well testing is a critical component of assessing geothermal resources because it deals with the physical processes occurring inside the well and a portion of the reservoir intersected by the well. Analysis of well test data will reveal the specific physical characteristics of the wells which may be lumped to represent the entire reservoir. When adequate well test data are available, management will be well informed in making crucial decisions. With an informed decision, the level of uncertainty and the risk on resource development is significantly reduced. The early stages of geothermal development in the Philippines set a stage allowing thorough implementation of well testing programs in any geothermal field, making available a geothermal database that allows benchmarking of well performance and historical well response under various operating conditions and circumstances. A catalogue of examples discussed in this paper demonstrates how well testing evaluation addresses the more basic and practical investigation of individual wells from drilling and prior to exploitation.
1. INTRODUCTION Assessment of geothermal resources requires input from various disciplines. During the exploration stage, evaluation of geothermal prospect is based mainly on the results of geological, geochemical and geophysical surveys and investigations. The inputs that are reckoned from surface observations and measurements from these disciplines are examined to infer the nature, characteristics and the probable size of the geothermal system, and if possible construct a conceptual model(s) of the field. The conceptual model usually represents the probable origin and source temperature of fluids that is used in deciding whether the prospect merits drilling and/or additional geoscientific surveys. After the wells are drilled, physical measurements and chemical sampling of the fluids provide more direct evidence of the properties of the reservoir as they could be obtained at more at discretized levels below the surface. This paper discusses the various well testing techniques and methodologies applied in assessing geothermal resources. These aspects include subsurface measurements and discharge tests used in characterizing the reservoir and validate the findings from the geoscientific surface investigations, with the end result of sizing up the capacity of the resource. Many of the contents of this paper were extracted from an earlier lecture at the UNU Geothermal Programme in Iceland by Sarmiento (1993).
Sarmiento 2 Well Testing
2. SUBSURFACE MEASUREMENTS Several types of measurements can be conducted inside the wells depending on the objectives and requirements. Tools are available for measuring temperature and pressure, casing inside diameters, flows from different feed zones and formation properties like density, porosity and resistivity. The application of the downhole temperatures and pressures on routine well and reservoir evaluation will be the focus of this discussion. 2.1 Static Formation Temperature Test (SFTT) Static Formation Temperature refers to the undisturbed or stable temperature at a given depth in the well. When temperature measurements do not show any change with time after drilling and during the recovery or shut-in period of the well, then we can infer that the stable formation temperature is reached. At some points in the wells, it only takes 30-45 days to attain stability, especially in zones with strong inflows or good permeability. On tight wells, this may take several months because of the slow phase of the recovery. Static Formation Temperature is very critical when drilling the first three exploratory wells, when subsurface measurements are nonexistent. In an area already drilled for production, data from existing wells could be used to extrapolate the temperature. The SFTT is programmed to derive an estimate of the formation temperatures while drilling and enable the setting of the production casing shoe (PCS) at desired temperature. The PCS depth is usually set at depth where the temperature is expected to be about 220°C, a desirable temperature for production wells. With the PCS set at this depth and temperature, entry of cold fluids will be mitigated if not fully eliminated. Without the SFTT, temperatures inferred from alteration minerals are used, albeit, with some significant variance and uncertainty. The results of a series of the SFTT at different levels also show if a temperature inversion exists, a
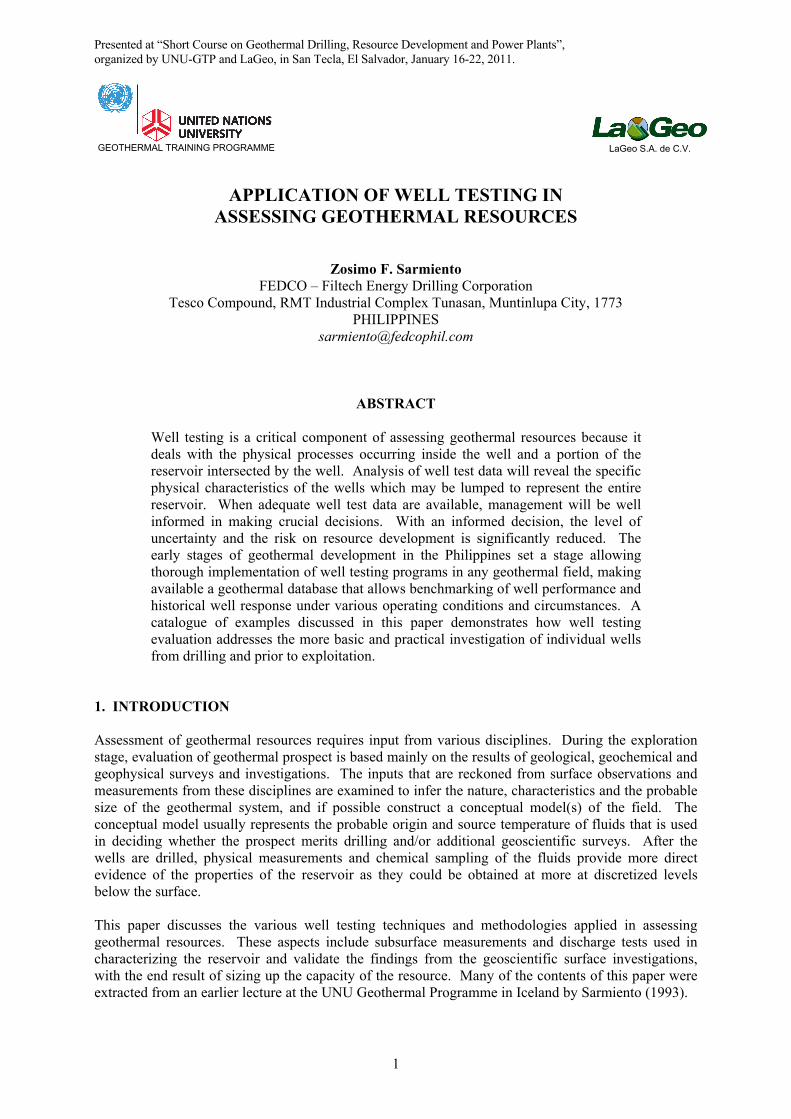
condition that allows the geologist to rationalize whether to modify drilling targets or prematurely terminate drilling. Roux et al, (1979) described the principles involve in the analyses and the conduct of the test. During drilling, SFTT is conducted by circulating for 12 hours at the last bit or reference depth where there is no circulation loss. Then a temperature build-up is monitored for at least 8 hours and the results plotted in a semi-log graph A simplified and empirical technique of analyzing SFTT data was developed by Brennand (1983) based on date from 35 wells in the Philippines. This approach does not require any correction factor as required by Roux et al, (1979) but the results match very well with their methods. Statistics also indicate that the estimated temperatures are within 5°C of actual temperatures – with only 15% of the results deviating by 15°C (Sarit, 1989). Hence, this method is considered the most reliable technique of predicting formation temperatures while drilling. Figure 1 illustrates the static temperature test results based on two methods.
FIGURE 1: Example of a Static Formation Temperature Test (SFTT) result
Well Testing 3 Sarmiento
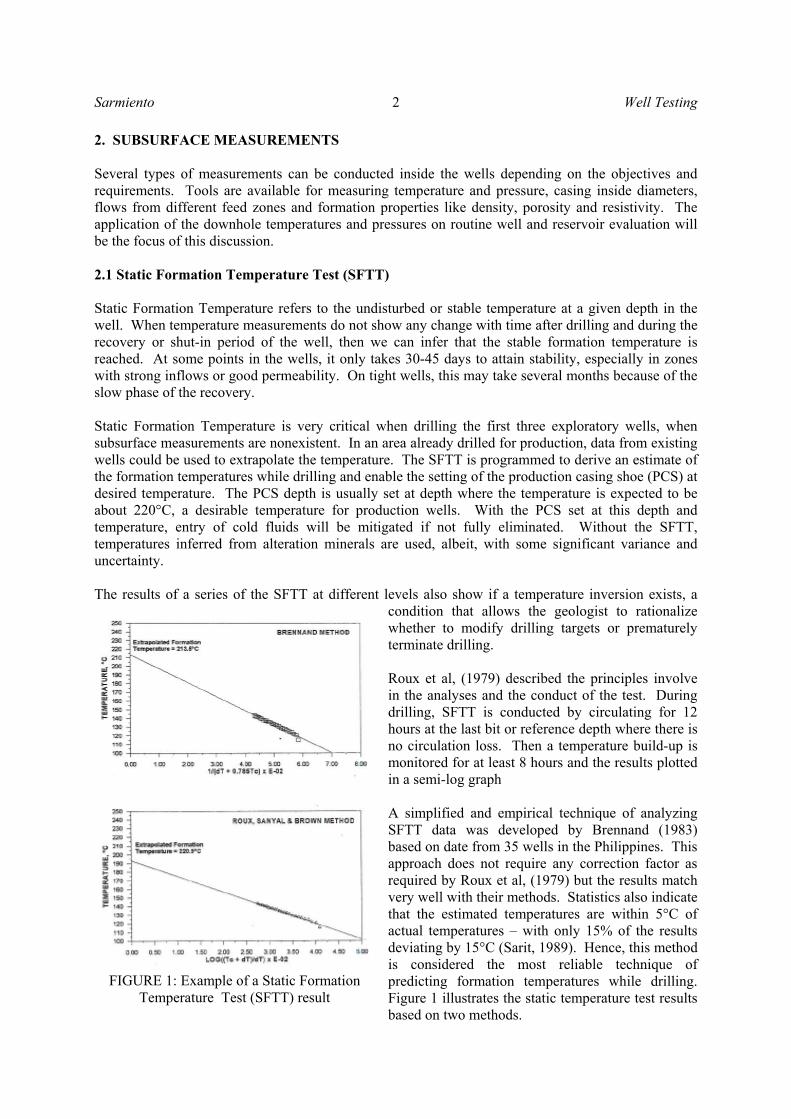
2.2 Completion test Completion tests consist of running waterloss surveys, injectivity tests and transient pressure tests immediately after drilling. Waterloss surveys are conducted by lowering a temperature tool commencing at slightly above the casing shoe throughout the hole while pumping at constant rate. Temperature measurement is done usually every hundred meters if using mechanical gauges and continuously using electronic instruments. Very recently, high temperature memory tools are used and data recording can be conducted at 20 samples per second. The results of the test indicate the depth entries for fluids being pumped which usually correspond to the feed zones during production of the well. The injectivity test is run by lowering a pressure gauge near or across the interpreted major loss zone of the well. The pressure is measured at the zone while pumping at various flow rates for at least 1 hour or until the well pressures stabilized if a real-time electronic wireline pressure instrument is used. The results are plotted in a graph of flowrate vs. pressure which will yield the injectivity index, an overall measure of the permeability of the well. The result of the injectivity test is also used in determining whether hydro-fracturing should be done in a well to improve its permeability. Advantage on the presence of the rig is taken to hydro-fracture the well to make use of the availability of the rig pumps for higher flowrates. Figure 2 shows the injectivity test results before and after conducting hydro-fracturing test. After hydro-fracturing, the well was converted it from a very tight to a permeable or productive well. Pressure fall-off test, a transient pressure test technique, is conducted as a continuation of the injectivity test with the pressure monitored after the cessation of fluid injection. Analysis of the data using Type Curve matching and commercial software yields transmissivity index that also connotes well permeability – expressed in darcy-meters. The results provide a value of skin factor which also indicate whether the formation suffered mud damage during drilling or was stimulated. 2.3 Heat-up surveys
Heat-up surveys refer to the subsurface measurements conducted after the well has undergone pumping or injection tests. This is usually conducted following the completion tests; at interval of 1, 3, 6, 12, 24, 30 and 45 days depending on the temperature recovery required in successfully discharging a well. 2.3.1 Temperature Temperatures around the wellbore cool down as a result of drilling and pumping during completion test. Monitoring the temperature recovery of the well during heat-up period unmasks several characteristics of the well that mirror reservoir condition. This is possible because fluid dynamics during the process and until it attains stable condition will reveal the state of fluids penetrated by the well in the reservoir. Conduction and advection govern the heat transfer between the rock and the fluid, with conduction taking place on impermeable horizons and advection prevalent on permeable
FIGURE 2: Examples of injectivity test results, before and after hydro-fracturing
Sarmiento 4 Well Testing
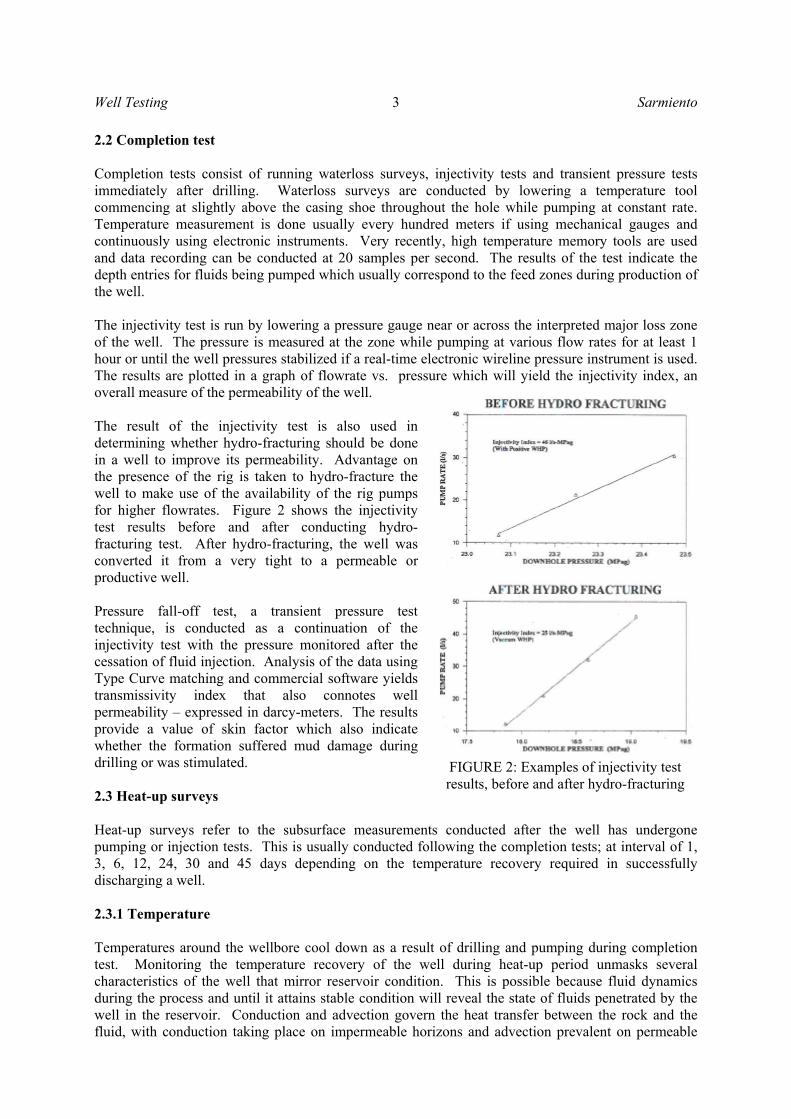
zones. Many times, heating up data confirm permeability indications from water loss surveys but, in some cases, we can also observe more permeable zones than those observed in the completion test (Figure 3). Wells with poor permeability are commonly very slow in recovery, while permeable wells with strong internal flow become heated up after only a few hours. Exception is when the zone accepts bulk of fluid during injection
and the well may take longer time to warm up and generally chases the other zones during the stabilization period. Some of the prominent features observed in the wells during heat-up can be described as follows:
• Upflowing temperature profiles approaching or corresponding to the boiling point curve of water
• Downflowing fluids suggesting isothermal profile from feed point to the exit point • Temperature reversal common in outflow areas • Linear temperature gradient on impermeable zones especially opposite the cased-off section of
the hole
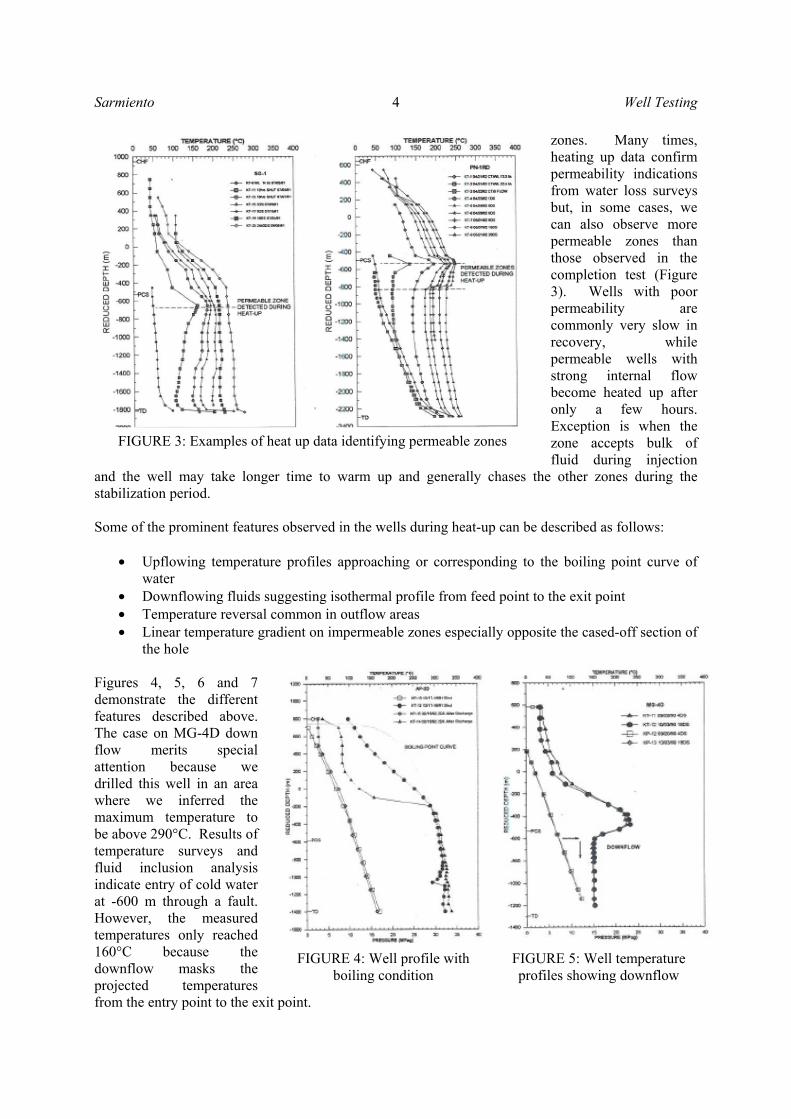
Figures 4, 5, 6 and 7 demonstrate the different features described above. The case on MG-4D down flow merits special attention because we drilled this well in an area where we inferred the maximum temperature to be above 290°C. Results of temperature surveys and fluid inclusion analysis indicate entry of cold water at -600 m through a fault. However, the measured temperatures only reached 160°C because the downflow masks the projected temperatures from the entry point to the exit point.
FIGURE 3: Examples of heat up data identifying permeable zones
FIGURE 4: Well profile with boiling condition
FIGURE 5: Well temperature profiles showing downflow
Well Testing 5 Sarmiento
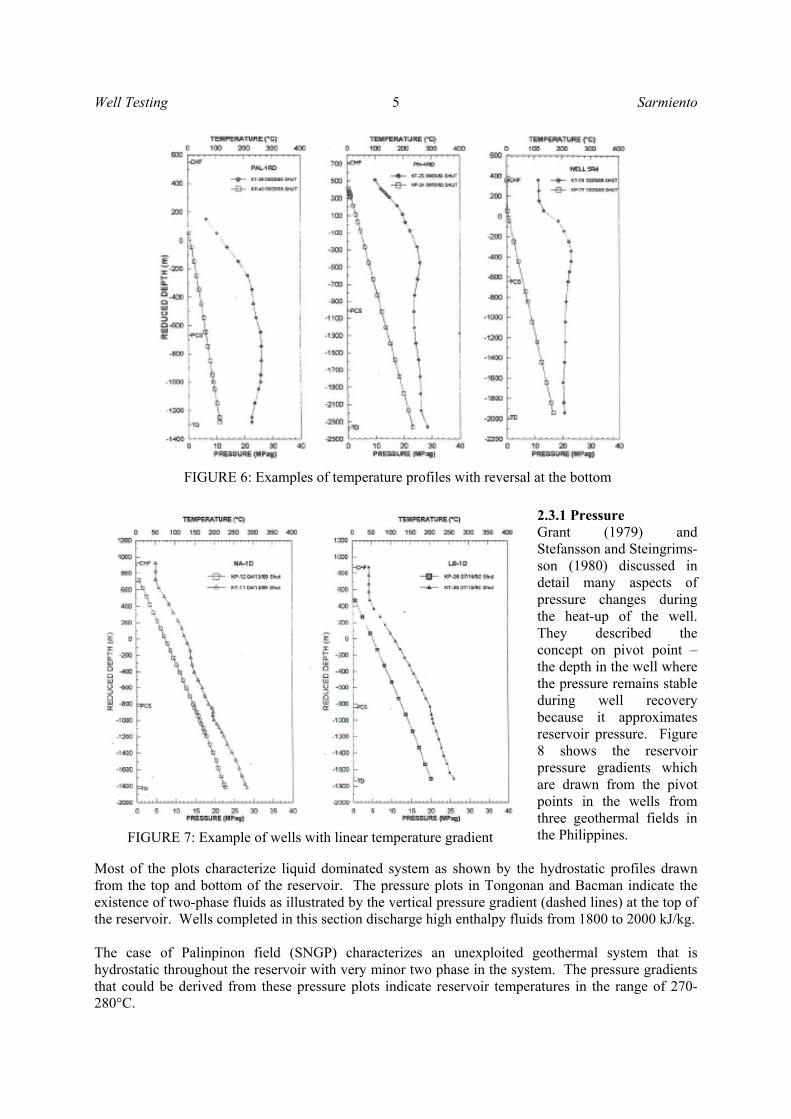
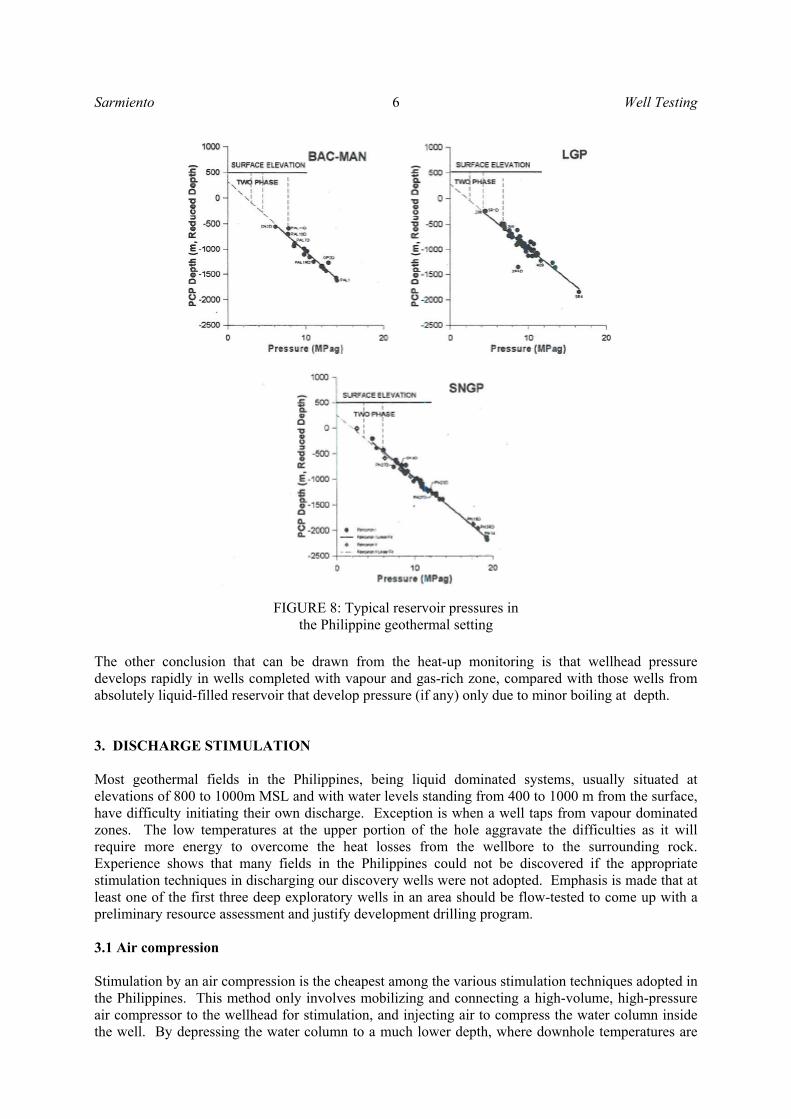
2.3.1 Pressure Grant (1979) and Stefansson and Steingrims-son (1980) discussed in detail many aspects of pressure changes during the heat-up of the well. They described the concept on pivot point – the depth in the well where the pressure remains stable during well recovery because it approximates reservoir pressure. Figure 8 shows the reservoir pressure gradients which are drawn from the pivot points in the wells from three geothermal fields in the Philippines.
Most of the plots characterize liquid dominated system as shown by the hydrostatic profiles drawn from the top and bottom of the reservoir. The pressure plots in Tongonan and Bacman indicate the existence of two-phase fluids as illustrated by the vertical pressure gradient (dashed lines) at the top of the reservoir. Wells completed in this section discharge high enthalpy fluids from 1800 to 2000 kJ/kg. The case of Palinpinon field (SNGP) characterizes an unexploited geothermal system that is hydrostatic throughout the reservoir with very minor two phase in the system. The pressure gradients that could be derived from these pressure plots indicate reservoir temperatures in the range of 270-280°C.
FIGURE 6: Examples of temperature profiles with reversal at the bottom
FIGURE 7: Example of wells with linear temperature gradient
Sarmiento 6 Well Testing
The other conclusion that can be drawn from the heat-up monitoring is that wellhead pressure develops rapidly in wells completed with vapour and gas-rich zone, compared with those wells from absolutely liquid-filled reservoir that develop pressure (if any) only due to minor boiling at depth. 3. DISCHARGE STIMULATION Most geothermal fields in the Philippines, being liquid dominated systems, usually situated at elevations of 800 to 1000m MSL and with water levels standing from 400 to 1000 m from the surface, have difficulty initiating their own discharge. Exception is when a well taps from vapour dominated zones. The low temperatures at the upper portion of the hole aggravate the difficulties as it will require more energy to overcome the heat losses from the wellbore to the surrounding rock. Experience shows that many fields in the Philippines could not be discovered if the appropriate stimulation techniques in discharging our discovery wells were not adopted. Emphasis is made that at least one of the first three deep exploratory wells in an area should be flow-tested to come up with a preliminary resource assessment and justify development drilling program. 3.1 Air compression Stimulation by an air compression is the cheapest among the various stimulation techniques adopted in the Philippines. This method only involves mobilizing and connecting a high-volume, high-pressure air compressor to the wellhead for stimulation, and injecting air to compress the water column inside the well. By depressing the water column to a much lower depth, where downhole temperatures are
FIGURE 8: Typical reservoir pressures in the Philippine geothermal setting
Well Testing 7 Sarmiento
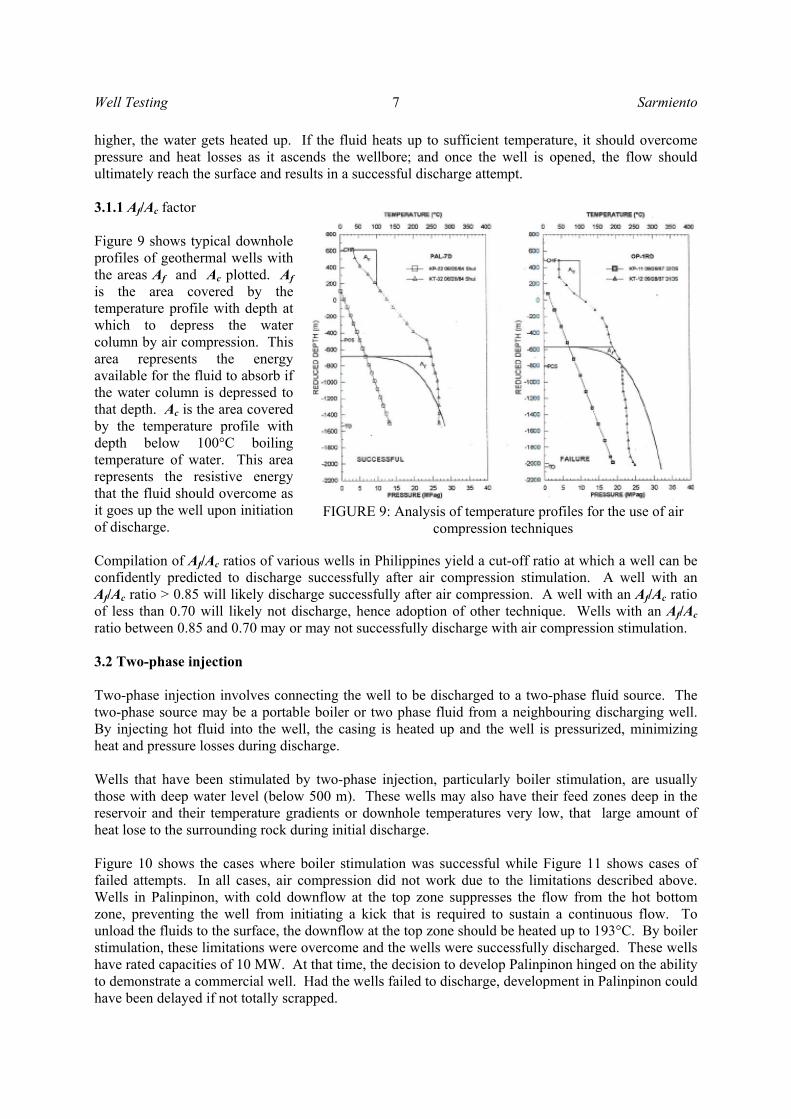
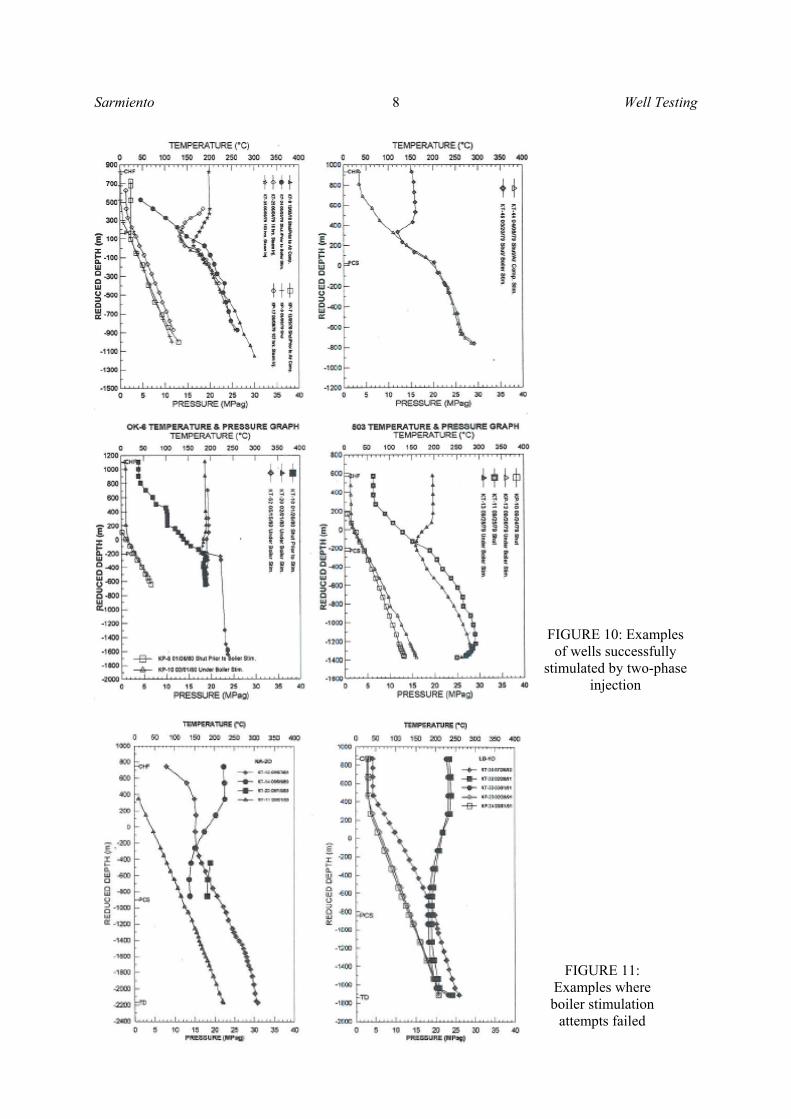
higher, the water gets heated up. If the fluid heats up to sufficient temperature, it should overcome pressure and heat losses as it ascends the wellbore; and once the well is opened, the flow should ultimately reach the surface and results in a successful discharge attempt. 3.1.1 Af/Ac factor Figure 9 shows typical downhole profiles of geothermal wells with the areas Af and Ac plotted. Af is the area covered by the temperature profile with depth at which to depress the water column by air compression. This area represents the energy available for the fluid to absorb if the water column is depressed to that depth. Ac is the area covered by the temperature profile with depth below 100°C boiling temperature of water. This area represents the resistive energy that the fluid should overcome as it goes up the well upon initiation of discharge. Compilation of Af/Ac ratios of various wells in Philippines yield a cut-off ratio at which a well can be confidently predicted to discharge successfully after air compression stimulation. A well with an Af/Ac ratio > 0.85 will likely discharge successfully after air compression. A well with an Af/Ac ratio of less than 0.70 will likely not discharge, hence adoption of other technique. Wells with an Af/Ac ratio between 0.85 and 0.70 may or may not successfully discharge with air compression stimulation. 3.2 Two-phase injection Two-phase injection involves connecting the well to be discharged to a two-phase fluid source. The two-phase source may be a portable boiler or two phase fluid from a neighbouring discharging well. By injecting hot fluid into the well, the casing is heated up and the well is pressurized, minimizing heat and pressure losses during discharge. Wells that have been stimulated by two-phase injection, particularly boiler stimulation, are usually those with deep water level (below 500 m). These wells may also have their feed zones deep in the reservoir and their temperature gradients or downhole temperatures very low, that large amount of heat lose to the surrounding rock during initial discharge. Figure 10 shows the cases where boiler stimulation was successful while Figure 11 shows cases of failed attempts. In all cases, air compression did not work due to the limitations described above. Wells in Palinpinon, with cold downflow at the top zone suppresses the flow from the hot bottom zone, preventing the well from initiating a kick that is required to sustain a continuous flow. To unload the fluids to the surface, the downflow at the top zone should be heated up to 193°C. By boiler stimulation, these limitations were overcome and the wells were successfully discharged. These wells have rated capacities of 10 MW. At that time, the decision to develop Palinpinon hinged on the ability to demonstrate a commercial well. Had the wells failed to discharge, development in Palinpinon could have been delayed if not totally scrapped.
FIGURE 9: Analysis of temperature profiles for the use of air compression techniques
Sarmiento 8 Well Testing
FIGURE 10: Examples of wells successfully
stimulated by two-phase injection
FIGURE 11: Examples where boiler stimulation
attempts failed
Well Testing 9 Sarmiento
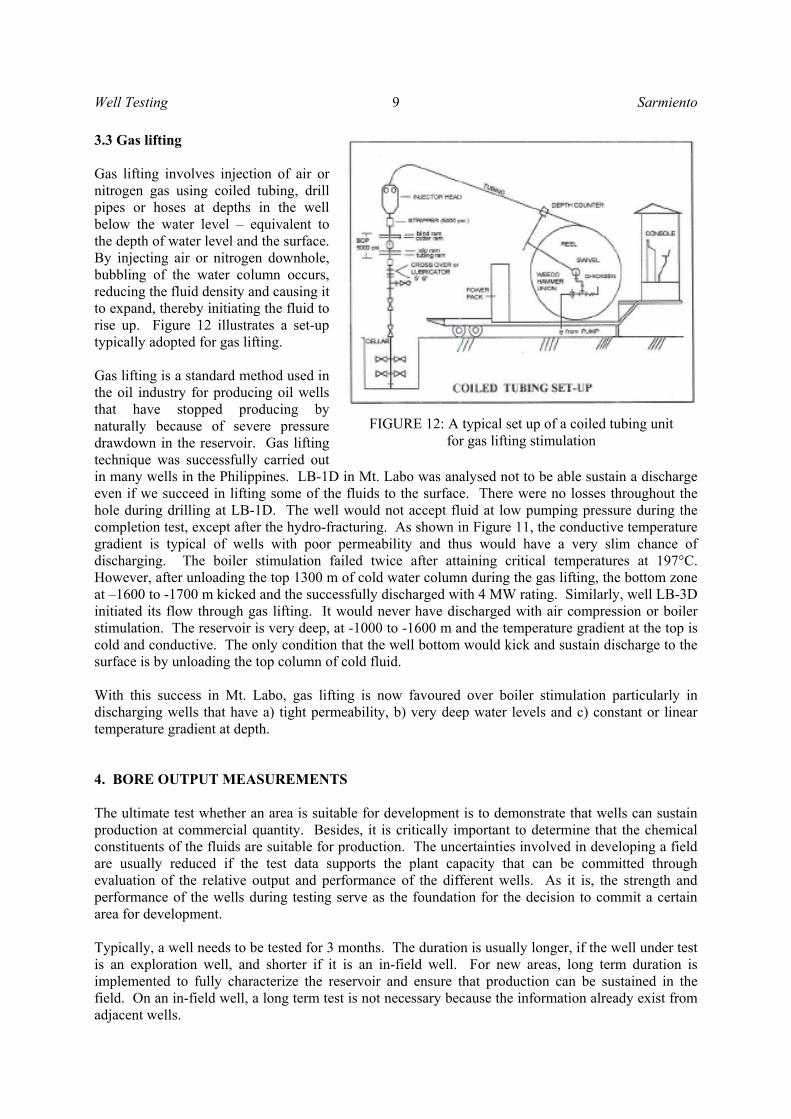
3.3 Gas lifting Gas lifting involves injection of air or nitrogen gas using coiled tubing, drill pipes or hoses at depths in the well below the water level – equivalent to the depth of water level and the surface. By injecting air or nitrogen downhole, bubbling of the water column occurs, reducing the fluid density and causing it to expand, thereby initiating the fluid to rise up. Figure 12 illustrates a set-up typically adopted for gas lifting. Gas lifting is a standard method used in the oil industry for producing oil wells that have stopped producing by naturally because of severe pressure drawdown in the reservoir. Gas lifting technique was successfully carried out in many wells in the Philippines. LB-1D in Mt. Labo was analysed not to be able sustain a discharge even if we succeed in lifting some of the fluids to the surface. There were no losses throughout the hole during drilling at LB-1D. The well would not accept fluid at low pumping pressure during the completion test, except after the hydro-fracturing. As shown in Figure 11, the conductive temperature gradient is typical of wells with poor permeability and thus would have a very slim chance of discharging. The boiler stimulation failed twice after attaining critical temperatures at 197°C. However, after unloading the top 1300 m of cold water column during the gas lifting, the bottom zone at –1600 to -1700 m kicked and the successfully discharged with 4 MW rating. Similarly, well LB-3D initiated its flow through gas lifting. It would never have discharged with air compression or boiler stimulation. The reservoir is very deep, at -1000 to -1600 m and the temperature gradient at the top is cold and conductive. The only condition that the well bottom would kick and sustain discharge to the surface is by unloading the top column of cold fluid. With this success in Mt. Labo, gas lifting is now favoured over boiler stimulation particularly in discharging wells that have a) tight permeability, b) very deep water levels and c) constant or linear temperature gradient at depth. 4. BORE OUTPUT MEASUREMENTS The ultimate test whether an area is suitable for development is to demonstrate that wells can sustain production at commercial quantity. Besides, it is critically important to determine that the chemical constituents of the fluids are suitable for production. The uncertainties involved in developing a field are usually reduced if the test data supports the plant capacity that can be committed through evaluation of the relative output and performance of the different wells. As it is, the strength and performance of the wells during testing serve as the foundation for the decision to commit a certain area for development. Typically, a well needs to be tested for 3 months. The duration is usually longer, if the well under test is an exploration well, and shorter if it is an in-field well. For new areas, long term duration is implemented to fully characterize the reservoir and ensure that production can be sustained in the field. On an in-field well, a long term test is not necessary because the information already exist from adjacent wells.
FIGURE 12: A typical set up of a coiled tubing unit for gas lifting stimulation
Sarmiento 10 Well Testing
In particular, the wells are tested to:
• Have an informed decision in field development and management, strategic planning and problem solving.
• Determine the output characteristics of the well in terms of mass flow, enthalpy, dryness and potential.
• Determine the effects of varying the wellhead pressures on the output characteristics. • Confirm the location of permeable zones obtained from completion test and heat-up period. • Determine the interaction between permeable zones under changing WHP. • Measure the drawdown or changes in the productivity index with the time. • Check the fluid chemistry and non-condensable gases of the well. • Determine the appropriate interface pressure for the power plant.
4.1 Discharge set-up and measurement techniques. Well out put measurements can be carried out using physical and chemical methods. Wells are usually tested by discharging the wells vertically and horizontally using the following:
• Vertical discharge: It is a short term discharge usually carried out for 30-45 minutes to clear the well of mud and debris. It is unreliable but useful for preliminary estimation. The well is discharged thru an end pipe connected at the top of the wellhead.
• Horizontal discharge: This method is usually adopted for wells requiring long term test (3
months) using an atmospheric silencer and portable separators. The atmospheric silencer test is based on the empirical method developed by James (1962) using lip pressure to determine two-phase discharge enthalpy. The basis of this method is that the two-phase flow through discharge pipe must reach critical (supersonic) velocity, and by correlating the specific flow rates over a range of enthalpies (535-2790 kJ/kg), he was able to achieve a simple relationship with the lip pressure, measured water flow (weir flow) and the enthalpy. The silencer method is the most acceptable technique because of their low cost and simple installation. The only drawback is that there is impact in the environment if reinjection of the brine is not adopted. With reinjection, the probability of the injector to scale up is very high unless chemical inhibition is applied. Portable separators make use of the cyclone separators where both the steam and the water flows are measured using orifice plates. In some case, brine measurement can still be done over the weir box. It is the most accurate method of testing the output of the well. This method is preferred over the silencer method if there is a need to reinject the brine without any inhibition technique, and if the well to be used for injection is very close to the discharging well. .
• Tracer dilution method: It involves the simultaneous injection of liquid and gas tracers into the two-phase flow at known rates. Both the gas and the liquid tracers must partition separately into their respective liquid and gas phase before the sampling point to enable accurate analyses of their final concentration. The tracers should be non-reactive and stable at high temperatures. It can be used to measure the output of the production wells connected to the power plant without cutting the well from the system and thus enable continuous monitoring of the well output and field rundown. For steam flow measurement, Sulfur Hexafluoride (SF6) and Alcohol (Isopropanol) are used as tracers, while for brine flow measurements, Sodium Benzoate, Magnesium Chloride and Na-Fluorescein tracers were normally selected. The liquid phase flow is derived by:
Well Testing 11 Sarmiento
= ( − ) where mL = Liquid phase mass rate
mT = Tracer injection mass rate CTL = Liquid phase concentration by weight CBL = Liquid phase background concentration
The vapour mass rate is given by: = ( − )
where mv = Vapour phase mass rate
CV = Vapour phase concentration by weight
4.2 Interpretation of output data
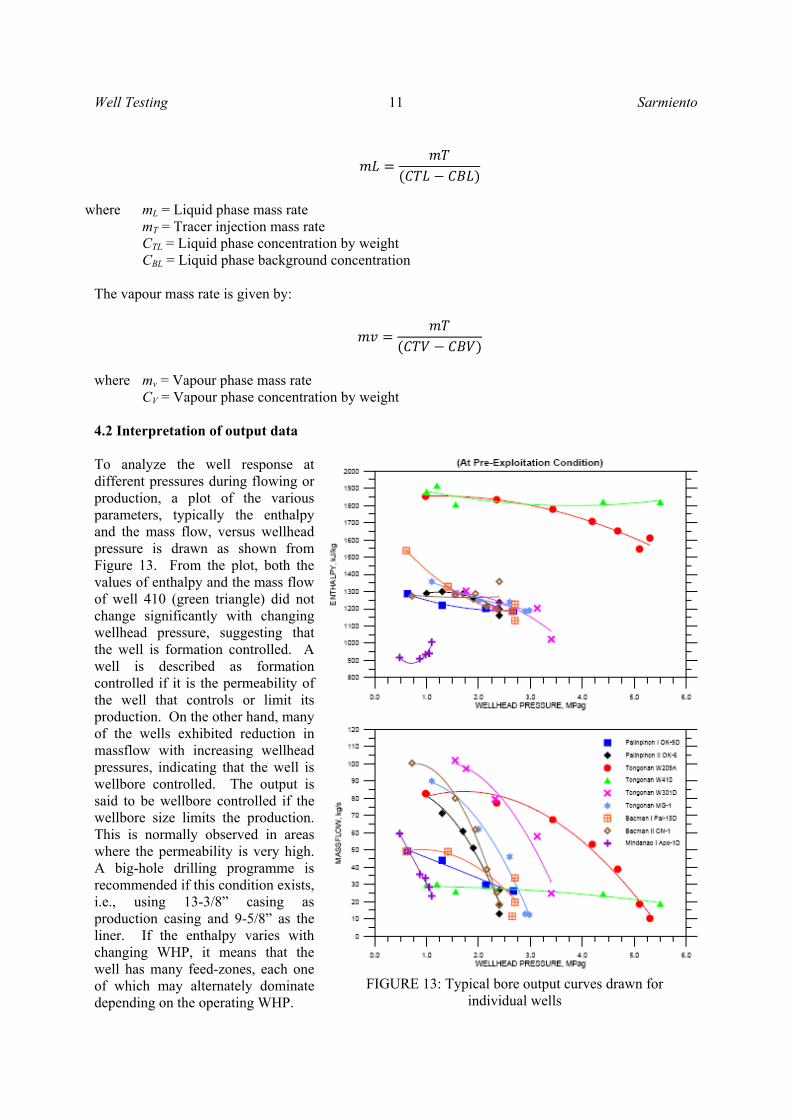
To analyze the well response at different pressures during flowing or production, a plot of the various parameters, typically the enthalpy and the mass flow, versus wellhead pressure is drawn as shown from Figure 13. From the plot, both the values of enthalpy and the mass flow of well 410 (green triangle) did not change significantly with changing wellhead pressure, suggesting that the well is formation controlled. A well is described as formation controlled if it is the permeability of the well that controls or limit its production. On the other hand, many of the wells exhibited reduction in massflow with increasing wellhead pressures, indicating that the well is wellbore controlled. The output is said to be wellbore controlled if the wellbore size limits the production. This is normally observed in areas where the permeability is very high. A big-hole drilling programme is recommended if this condition exists, i.e., using 13-3/8” casing as production casing and 9-5/8” as the liner. If the enthalpy varies with changing WHP, it means that the well has many feed-zones, each one of which may alternately dominate depending on the operating WHP.
FIGURE 13: Typical bore output curves drawn for individual wells
Sarmiento 12 Well Testing
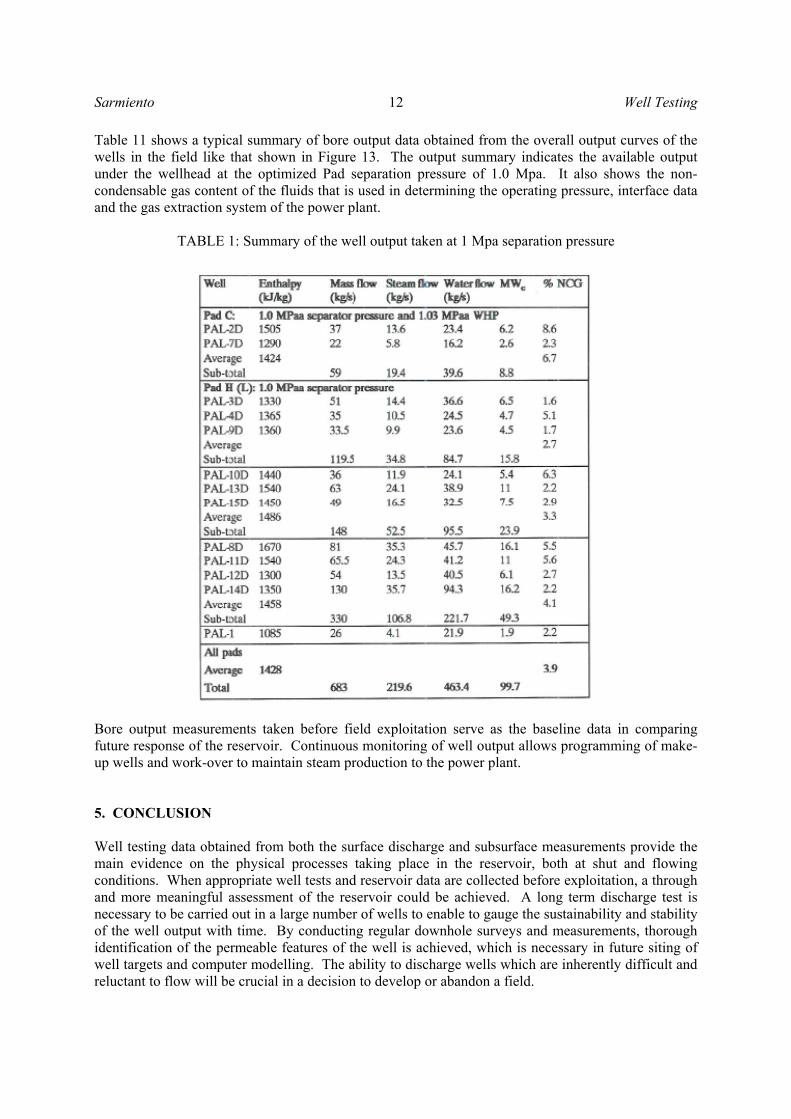
Table 11 shows a typical summary of bore output data obtained from the overall output curves of the wells in the field like that shown in Figure 13. The output summary indicates the available output under the wellhead at the optimized Pad separation pressure of 1.0 Mpa. It also shows the non-condensable gas content of the fluids that is used in determining the operating pressure, interface data and the gas extraction system of the power plant.
TABLE 1: Summary of the well output taken at 1 Mpa separation pressure
Bore output measurements taken before field exploitation serve as the baseline data in comparing future response of the reservoir. Continuous monitoring of well output allows programming of make-up wells and work-over to maintain steam production to the power plant. 5. CONCLUSION Well testing data obtained from both the surface discharge and subsurface measurements provide the main evidence on the physical processes taking place in the reservoir, both at shut and flowing conditions. When appropriate well tests and reservoir data are collected before exploitation, a through and more meaningful assessment of the reservoir could be achieved. A long term discharge test is necessary to be carried out in a large number of wells to enable to gauge the sustainability and stability of the well output with time. By conducting regular downhole surveys and measurements, thorough identification of the permeable features of the well is achieved, which is necessary in future siting of well targets and computer modelling. The ability to discharge wells which are inherently difficult and reluctant to flow will be crucial in a decision to develop or abandon a field.

Well Testing 13 Sarmiento
REFERENCES Grant, M., 1979: Interpretation of Downhole Measuremnts in Geothermal Wells. Applied Mathematics Division. Report 88. Department of Science and Industrial Research (DSIR). New Zealand. James, R., 1962: Steam-water critical flow through pipes. Sarmiento, Z. F., 1993: Geothermal Developemnt in the Philippines. Lectures delivered at UNU-GTP, Report 2. Stefansson, V. and Steingrimsson, B., 1980: Geothermal Logging I. An Introduction to Techniques and Interpretation. Orkustofnun. Iceland Report OS-80017/JHD-09 117 pp.