applications of cavity ring-down spectroscopy to high ...bowling.biology.utah.edu/pdfs - pubs/wahl...
TRANSCRIPT
Isotopes in Environmental and Health StudiesVol. 42, No. 1, March 2006, 21–35
Applications of cavity ring-down spectroscopy to highprecision isotope ratio measurement
of 13C/12C in carbon dioxide
ED H. WAHL†, BERNARD FIDRIC†, CHRIS W. RELLA†, SERGEI KOULIKOV†,BORIS KHARLAMOV†, SZE TAN†, ALEXANDER A. KACHANOV†, BRUCE A.
RICHMAN†, ERIC R. CROSSON†, BARBARA A. PALDUS*†,SHASHI KALASKAR‡ and DAVID R. BOWLING‡
†Picarro Inc., 480 Oakmead Parkway, Sunnyvale, CA 94085, USA‡Department of Biology, University of Utah, 257 S 1400 E, Salt Lake City, UT 84112, USA
(Received 10 January 2005; in final form 16 July 2005)
Recent measurements of carbon isotopes in carbon dioxide using near-infrared, diode-laser-basedcavity ring-down spectroscopy (CRDS) are presented. The CRDS system achieved good precision,often better than 0.2 ‰, for 4 % CO2 concentrations, and also achieved 0.15–0.25 ‰ precision ina 78 min measurement time with cryotrap-based pre-concentration of ambient CO2 concentrations(360 ppmv). These results were obtained with a CRDS system possessing a data rate of 40 ring-downsper second and a loss measurement of 4.0 × 10⁻¹¹ cm−1 Hz−1/2. Subsequently, the measurementtime has been reduced to under 10 min. This standard of performance would enable a variety ofhigh concentration (3–10 %) isotopic measurements, such as medical human breath analysis or animalbreath experiments. The extension of this ring-down to the 2 µm region would enable isotopic analysisat ambient concentrations, which, combined with the small size, robust design, and potential forfrequent measurements at a remote site, make CRDS technology attractive for remote atmosphericmeasurement applications.
Keywords: Atmosphere; Carbon dioxide; Carbon-12; Carbon-13; Cavity ring-down spectroscopy;Infrared diode laser
1. Introduction
For scientists, stable isotope analysis of atmospheric CO2 [1] and biospheric–atmosphericCO2 [2] exchange (both carbon and oxygen isotopes) offer the unique opportunity to assessecosystem physiology (exchange between soils [3], vegetation [4], and the atmosphere [5]),to determine the origin and partitioning of net ecosystem CO2 fluxes [6] (e.g. respiration,photosynthesis, and assimilation), and to identify biospheric imprints onto the atmosphere [7]
*Corresponding author. Skymoon Ventures, 3045 Park Boulevard, Palo Alto, CA 94036, USA. Tel.: +1-408-203-8560; Fax: +1-650-688-3119; Email: [email protected]
Isotopes in Environmental and Health StudiesISSN 1025-6016 print/ISSN 1477-2639 online © 2006 Taylor & Francis
http://www.tandf.co.uk/journalsDOI: 10.1080/10256010500502934

22 Ed H. Wahl et al.
(e.g. carbon sources and sinks). Operating on time scales ranging from hours to thousands ofyears, these processes play significant roles not only in biospheric–atmospheric gas exchange,but also in the global carbon cycle as a whole.
The isotope ratio (13C/12C) is expressed as a ‘delta’ (δ13C) compared with an arbitrarystandard (Vienna Pee Dee Belemnite, VPDB):
δ13C = (13C/12C)measured − (13C/12C)VPDB
(13C/12C)VPDB(1)
This delta value is expressed in parts per million or parts per thousand (‰). The delta of carbondioxide encountered in ambient air generally varies between about −7 and −13 ‰ (relative toVPDB). The resolution of interest for atmospheric science is about 0.01 to 0.3 ‰. The range indelta that one might encounter in a terrestrial environment is about −50 to +5 ‰. Measurementof the isotopic carbon ratio, δ13C, is distinct from the total carbon dioxide concentration, whichis nominally about 370 parts per million by volume (ppmv) in the ambient atmosphere, butcan range from 350 to 700 ppmv locally.
Air sample collection methods and isotope ratio mass spectrometry (IRMS) have evolvedinto a very useful research tool for atmospheric applications since the early studies of Keelingin 1958 [8] and have allowed studies of large-scale short-term and long-term variations in theatmosphere. However, soil and air sampling using IRMS remains a time-consuming process,as does the fact that IRMS is generally not operated in the field, which leads to significanthuman resources being expended to collect, classify, prepare, and measure samples.As a result,there is a need for smaller, portable, less labour-intensive, and relatively cheaper (∼<$50 K)instruments that can operate in the field and make frequent measurements of both the absoluteconcentration of CO2 and its isotopic composition. The ideal desired precision is 0.01 to 0.1 ‰,although this precision may not be required by all applications (some may even be able to usea resolution of 1 ‰). Ideally, an optically-based instrument could operate in situ (e.g. forest,measurement tower, crop field) for several months with minimal attention.
In this article, we describe an optical absorption instrument based on cavity ring-downspectroscopy (CRDS), a trace detection method that can measure absolute optical loss [9] (see,e.g. [9] and references therein). The instrument was developed for high precision measurementsof carbon isotope ratios in carbon dioxide (CO2) and is described in the Experimental setupsection of this article. The instrument was tested first at Picarro and subsequently at theUniversity of Utah for performance, reliability, and robustness. The results from these tests aresummarized in the Results and analysis section. Finally, a discussion of potential improvementsto the instrument for atmospheric measurements is included in the Conclusions section.
2. Cavity ring-down spectroscopy
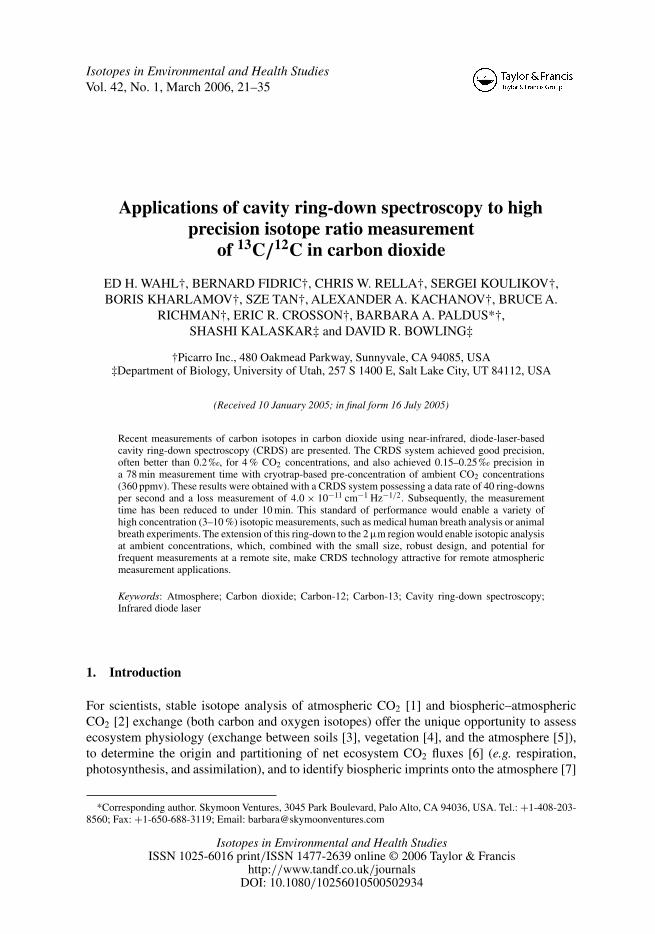
In optical absorption spectroscopy, a spectral feature called an absorption peak of a targetspecies is measured in order to obtain its concentration. Although different species may absorblight at one or more identical wavelengths, their overall spectral profile, consisting of manyabsorption peaks, often called a ‘fingerprint’, is unique. The ability of a spectrometer todistinguish between two different isotopic species that absorb at similar wavelengths is calledselectivity. Figure 1 illustrates the high resolution, near-infrared spectrum of CO2 at 6.7 kPa,which was used in this study to measure the carbon isotopes of CO2. These spectral featuresdepend on sample pressure and sharpen (decreased spectral width) as the sample pressure isdecreased. Therefore, selectivity of isotopic measurements can often be improved by reducingthe sample pressure below atmospheric pressure. However, narrower spectral features are
CRDS of 13C/12C in CO2 23
Figure 1. Near-infrared spectrum of 5 % carbon dioxide (CO2) at 6.7 kPa operating pressure, showing three differentisotopes.
more difficult to measure because they require the instrument to distinguish between closelyspaced wavelengths of light [10]. Continuous wave (CW) laser systems can show significantlybetter spectral resolution when measuring absorption features of isotopic species than theincoherent light sources and filters used by non-dispersive infrared (NDIR) systems to measureentire ro-vibrational bands of isotopes. CW lasers are used in tunable diode laser absorptionspectroscopy (TDLAS) to achieve high selectivity [10].
The second key performance parameter for measuring isotopes is sensitivity. Sensitivity isoften described as the smallest detectable change in 1 cm of path length that a spectrometercan measure during 1 s [11]. If many measurements can be made within 1 s, averaging may beused to further improve (by a factor of the square root of the number of measurements or thesquare root of the data acquisition rate) the achievable sensitivity [11]. Sensitivity has unitsof cm−1 Hz−1/2 [11]. Sensitivity is a well-established figure of merit for any absorption-basedtechnique. Because laser light has extremely long coherence lengths and can stay collimatedto a small beam size over long distances, TDLAS using multi-pass cells can routinely achievetens of metres of path length enhancement [12]. However, multi-pass cell TDLAS still remainslimited by laser intensity fluctuations and interference fringes [12]. Moreover, TDLAS tech-niques do not provide an absolute optical loss measurement. Despite these limitations, TDLAShas been applied successfully to isotopic absorption measurements of carbon dioxide [12, 13],water [14, 15], methane [16], and nitrous oxide [17].
CRDS is a more recently developed TDLAS approach that replaces a multi-pass cell witha stable optical resonator, often called the ring-down cavity (RDC). CRDS is based on theprinciple of measuring the rate of decay of light intensity inside the RDC [9] (see, e.g. [9] andreferences therein). Once sufficient light is injected into the RDC from a laser source, the inputlight is interrupted, and the decay of the stored light transmitted out of the cavity through oneof the RDC mirrors is monitored using a photodetector. The transmitted light, I (t, λ), fromthe RDC is given by
I (t, λ) = I0e−t/τ (λ) (2)

24 Ed H. Wahl et al.
where I0 is the transmitted light at the time the light source is shut off, τ(λ) is the ring-down timeconstant, and 1/τ(λ) is the decay rate. The transmitted light intensity decays exponentially overtime. The total (round-trip) optical loss inside the cavity is L(λ) = [c τ(λ)]−1, where c is thespeed of light. The total optical loss is comprised of the empty cavity optical loss and the sampleoptical loss. CRDS provides an absolute measurement of these optical losses. The emptycavity (round-trip) optical loss, Lempty(λ), is comprised of the scattering and transmissionlosses at the mirrors. In general, better mirrors provide lower empty cavity losses and highersensitivity. The sample (round-trip) optical loss is A(λ) = α(λ)lrt , where lrt is the cavityround-trip length, and A(λ) is simply the difference between total cavity losses and emptycavity losses, namely, A(λ) = L(λ) − Lempty(λ). Once the absorption spectrum, α(λ), of thesample has been measured, then the sample concentration can be readily computed using theabsorption cross-section and line-shape parameters.
The single-shot measurement uncertainty for a CRDS system is defined by
αmin = (�τ/τ)
leff, (3)
where �τ/τ is called the shot-to-shot noise of the system. The effective path length of a CRDSmeasurement is leff = lrt/Lempty. For typical RDC mirrors having a reflectivity of 99.995 %,and scattering losses of <0.0005 %, the path length enhancement can exceed 20,000. For a20 cm long sample cell, the round-trip path length is 40 cm, so that the effective round-trip pathlength is 8 km. A good CRDS system can achieve a shot-to-shot variation of 0.03 %, leadingto a single-shot uncertainty of 3 × 10⁻¹⁰ cm−1. Note also that the CRDS measurement is notdependent on either the initial intensity of the light inside the cavity, provided the signal hasa sufficient signal-to-noise ratio at the detector, or the physical sample path length as in thetraditional absorption spectroscopy.
Moreover, CRDS uses laser sources having narrow line widths and providing high spectralresolution, so that a CRDS system can operate at sub-atmospheric pressures to minimize anyspectral line overlap for the target species. We also note here that a stable optical RDC canaccomplish this sensitivity enhancement for sample volumes as small as 25 ml, compared withtraditional NDIR or TDLAS cells, which require volumes of ≥200 ml. CRDS can thereforeresolve three typical limitations of near-infrared diode laser-based absorption spectroscopy,namely sensitivity, and dependence on intensity noise of the light source. These advantages ofCRDS result directly in improved robustness and reliability of operation for a field deployableinstrument.
The use of CRDS for measuring isotopic ratios is not novel. In earlier work, measurementsof isotopes in methane [18] and carbon dioxide [19] focused primarily on demonstrating thepotential of using CRDS as a laboratory method for isotopic measurement applications. It isimportant to note that for practical field deployment of any optical technology for isotopicmeasurements, all optical components must be both commercially available and robust. ForTDLAS-based instruments, only telecom grade diode lasers designed to operate in the near-infrared satisfy these conditions.
Hence, the instrument reported here was tailored to utilize near-infrared diode lasers, despitethe significantly weaker overtones of the absorption lines compared with mid-infrared ones.This article describes the research performed to better understand the detailed performance,reproducibility, and robustness of near-infrared isotopic CRDS measurements in the contextof atmospheric research. Furthermore, the results obtained in this work represent a new per-formance benchmark for near-infrared CRDS specifically and near-infrared isotopic opticalsystems in general.
CRDS of 13C/12C in CO2 25
3. Experimental setup
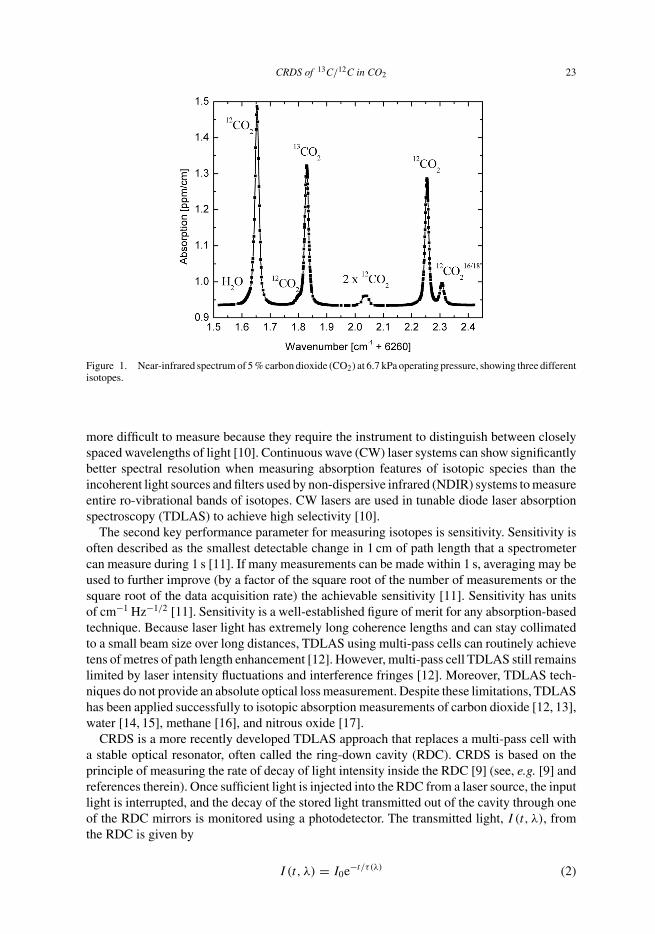
The CRDS instrument was implemented using a triangular ring cavity and a directly modulateddistributed feedback (DFB) diode laser source as shown in figure 2. The DFB laser is pigtailedwith a polarization-maintaining fibre. This fibre attaches to an etalon-based wavelength mon-itor that uses only a small fraction of the incident light. Most of the laser light simply passesthrough the wavelength monitor and is optically isolated before being coupled into the RDCcell. The light leaking out of one of the cavity mirrors is directed to the ring-down detector.The ring-down detector measures cavity power as a function of time. The 14-bit A/D carddigitizes the output of the detector. The DSP card analyses the digital output to determine thering-down time.
The procedure for measuring the spectrum of CO2 and its isotopologues in the cavity is asfollows.
• Set the laser to the starting (n = 1) wavelength λn=1, which is shorter than the wavelengthof the absorption feature of interest.
• Bring the laser and the cavity into resonance by dithering a piezoelectric actuator (PZT) tomove one of the cavity’s end mirrors, thereby adjusting the cavity length.
• Turn the laser off when sufficient light intensity builds up in the cavity.• Monitor the detector signal and record the ring-down curve.• Convert the ring-down time to an absorbance.• Scan the laser wavelength to λn+1 and repeat the process.
By repeating the process several times over a wavelength range that encompasses the absorp-tion feature, the instrument collects a series of ring-down curves to give a measurement of theabsorption spectrum. A ‘scan’ typically measures the 13CO2/
12CO2 isotopic ratio from theabsorption spectrum shown in figure 1 (6261.5 to 6262.4 cm−1).
Figure 2. Schematic diagram of cavity ring-down instrument.
26 Ed H. Wahl et al.
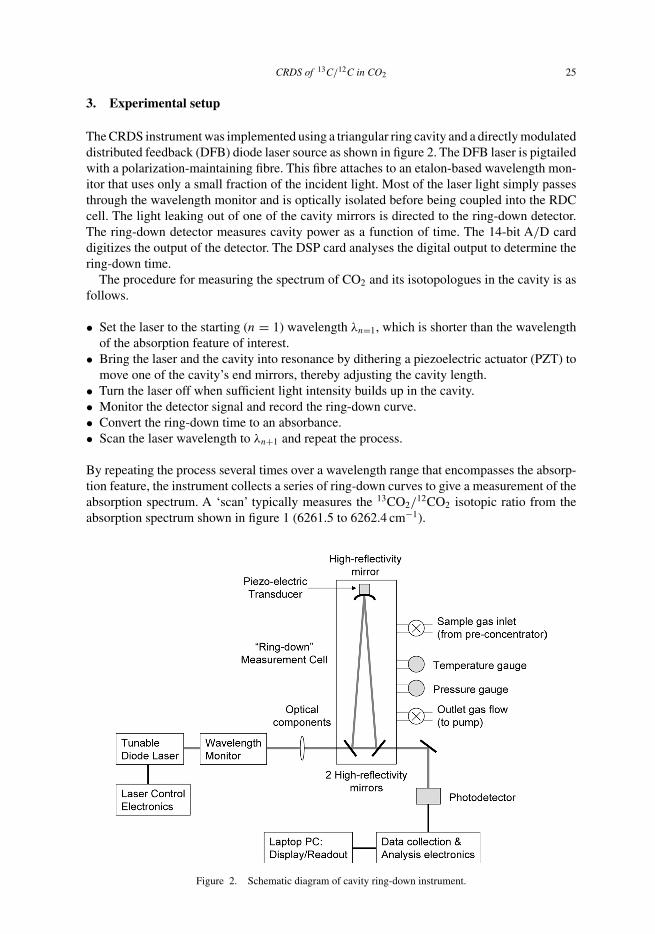
Figure 3. Schematic diagram of pre-concentration system. The diagram shows gas from a cylinder passing througha mass flow controller made by MKS instruments. The gas then passes through a pre-concentrator (inlet A, outlet B)followed by a cold finger (inlet C). The concentrated sample can then pass through a chemical trap (point D) into themeasurement instrument or be directed to the vacuum line (point E). The vacuum line is driven by a small DC pump(point F) and a larger vacuum pump (point G). All portions of the flow line can be purged at any time using purge gassources.
We mounted the optomechanical platform with vibration isolators in a thermally controlledenclosure. Then we integrated this enclosure into a 3U (5.25 in. high) rack. This enclosurealso contained sample-handling valves and electronics boards. Power supplies and a vacuumpump were housed in a second 3U rack. The total weight of the instrument was ∼27 kg. Theinstrument was controlled using a laptop computer, which also stored the data.
Because the instrument used weak, near-infrared overtone transitions of CO2 at 1.6 µm, itrequired at least a 4 % CO2 concentration in order to achieve the target precision. Therefore,the Bowling group at the University of Utah developed and constructed a cryogenic CO2
pre-concentrator to provide 4 % CO2 in air samples to the CRDS instrument. The systemuses stainless steel traps immersed in liquid nitrogen and requires manual operation of valves.A mass flow controller maintained sampling flow at 200 sccm, and samples were collectedfor 8–10 min. The condensed CO2 was allowed to expand in a cold finger where it wasre-condensed by cooling with liquid nitrogen.After evacuating any uncondensed gases, air wasadded to the CO2 in the cold finger until the pressure became equal to the atmospheric pressure.The prepared sample was injected into the CRDS instrument for analysis. The concentrationof CO2 was computed by dividing the pressure of CO2 in the cold finger prior to additionof room air by the atmospheric pressure. The final CO2 concentration was ∼4 %. Figure 3illustrates the pre-concentration system.
4. Results and analysis
We first present results of optical performance tests made on the CRDS system, which ulti-mately determine the overall instrument capability for measuring isotopes. Good performancerequires a high quality cavity and wavelength monitor, excellent temperature and pressure sta-bility, and optical measurement reproducibility. We then present results for four instrument
CRDS of 13C/12C in CO2 27
performance parameters that are important for isotopic applications. These parameters areprecision, accuracy, memory, and measurement time.
Precision is the repeatability of a measurement, defined by the standard deviation of a setof repeated measurements of the same unknown, whereas accuracy is the ability to determinethe exact concentration, defined by the standard deviation of the difference between a set ofmeasured concentrations and the known reference standard concentration. Memory effectsoccur when a measurement outcome is affected by the sample history. The instrument musttherefore be able to purge the previous sample adequately. Measurement time is the totaltime taken by the instrument to input the sample, measure the isotopic composition, and flushout the sample. Once a sample is inserted, the instrument takes multiple absorption spectraand computes the 13CO2/
12CO2 isotopic ratio from each spectrum. Each measured isotopicratio value is called a ‘scan’. The ‘sample’ isotopic ratio is then calculated as the average valueof the isotopic ratio scans.
4.1 CRDS system optical performance
The attainable isotopic measurement performance of a CRDS instrument depends on thefollowing critical optical performance parameters:
• the empty cavity ring-down time;• the shot-to-shot variation in the measured ring-down time;• the precision of the laser wavelength setting and monitoring;• the ring-down system repetition rate;• the system temperature stability;• the cavity pressure measurement precision.
We performed a series of tests in order to measure these performance parameters andbenchmark the CRDS system.
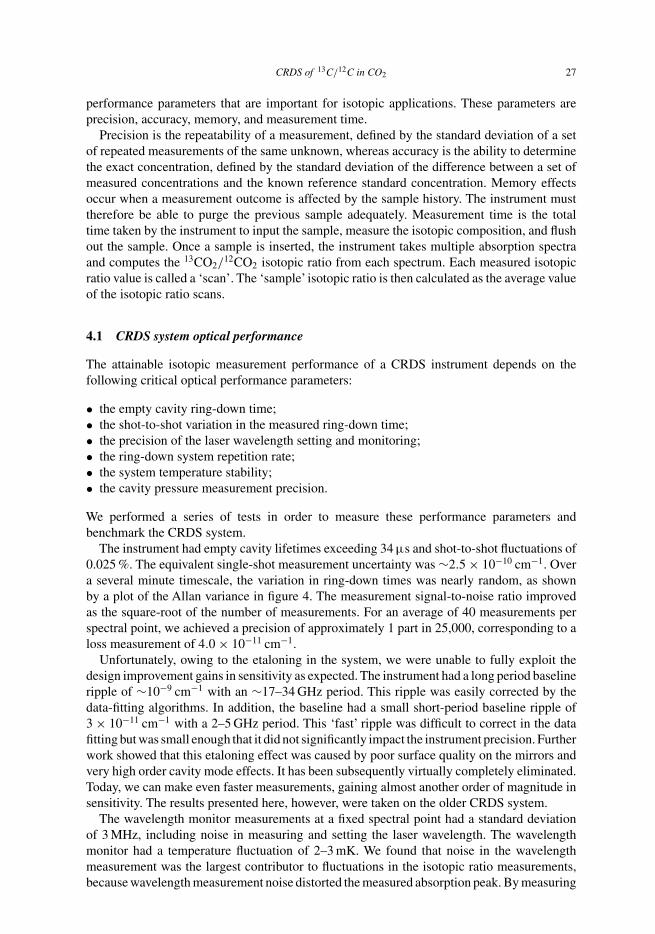
The instrument had empty cavity lifetimes exceeding 34 µs and shot-to-shot fluctuations of0.025 %. The equivalent single-shot measurement uncertainty was ∼2.5 × 10⁻¹⁰ cm−1. Overa several minute timescale, the variation in ring-down times was nearly random, as shownby a plot of the Allan variance in figure 4. The measurement signal-to-noise ratio improvedas the square-root of the number of measurements. For an average of 40 measurements perspectral point, we achieved a precision of approximately 1 part in 25,000, corresponding to aloss measurement of 4.0 × 10⁻¹¹ cm−1.
Unfortunately, owing to the etaloning in the system, we were unable to fully exploit thedesign improvement gains in sensitivity as expected. The instrument had a long period baselineripple of ∼10−9 cm−1 with an ∼17–34 GHz period. This ripple was easily corrected by thedata-fitting algorithms. In addition, the baseline had a small short-period baseline ripple of3 × 10−11 cm−1 with a 2–5 GHz period. This ‘fast’ ripple was difficult to correct in the datafitting but was small enough that it did not significantly impact the instrument precision. Furtherwork showed that this etaloning effect was caused by poor surface quality on the mirrors andvery high order cavity mode effects. It has been subsequently virtually completely eliminated.Today, we can make even faster measurements, gaining almost another order of magnitude insensitivity. The results presented here, however, were taken on the older CRDS system.
The wavelength monitor measurements at a fixed spectral point had a standard deviationof 3 MHz, including noise in measuring and setting the laser wavelength. The wavelengthmonitor had a temperature fluctuation of 2–3 mK. We found that noise in the wavelengthmeasurement was the largest contributor to fluctuations in the isotopic ratio measurements,because wavelength measurement noise distorted the measured absorption peak. By measuring
28 Ed H. Wahl et al.
Figure 4. Plot of the Allan variance over a several-minute timescale, showing the variation in ring-down times asa function of number of samples taken or averaging time period. The variation is nearly random.
enough points around the absorption peak and averaging the peak heights from multiple scans,we reduced the impact of wavelength noise.
Each ring-down waveform was fitted using a fast algorithm similar to that published byHalmer et al. [20]. The measurement repetition rate was ∼40 ring-downs per second and waslimited by the PZT sweep times required to accommodate the shot-to-shot variations in thelaser wavelength. These variations were a result of directly modulating the laser diode whencompared with using an external acousto-optic modulator. Improvements to the wavelengthmonitor and control circuitry could further reduce these wavelength variations and increasethe measurement repetition rate.
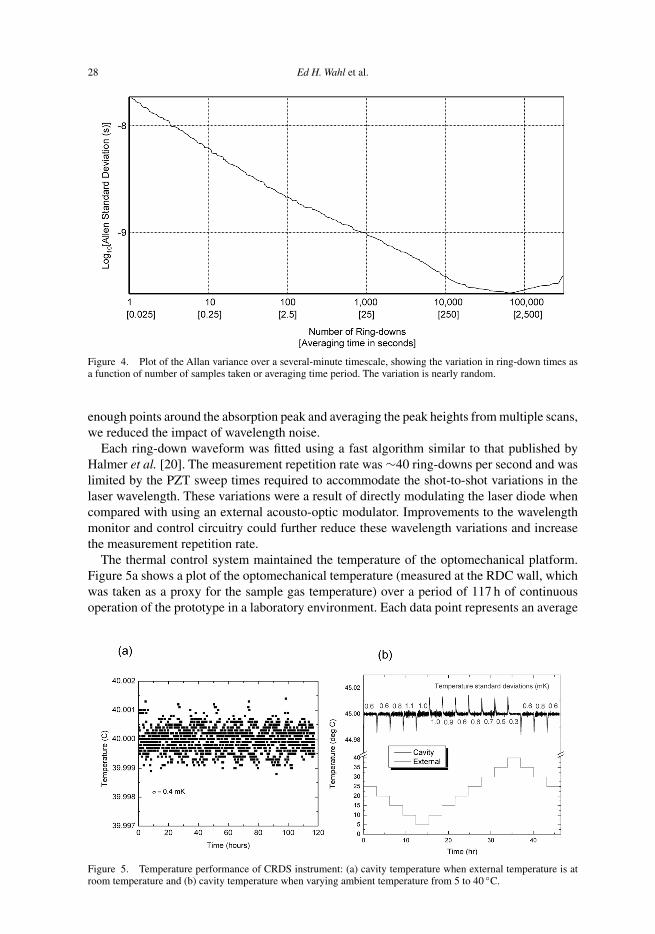
The thermal control system maintained the temperature of the optomechanical platform.Figure 5a shows a plot of the optomechanical temperature (measured at the RDC wall, whichwas taken as a proxy for the sample gas temperature) over a period of 117 h of continuousoperation of the prototype in a laboratory environment. Each data point represents an average
Figure 5. Temperature performance of CRDS instrument: (a) cavity temperature when external temperature is atroom temperature and (b) cavity temperature when varying ambient temperature from 5 to 40 ◦C.

CRDS of 13C/12C in CO2 29
over a 5 min measurement. The standard deviation in temperature over 117 h was 0.4 mK.Figure 5b shows the response of the thermal control system, as measured on the ring-downsystem in an environmental chamber, to changes in external temperature. At temperaturesbetween 5 and 40 ◦C, the control system maintained the temperature with a precision of betterthan 1.1 mK standard deviation and a maximum step excursion not exceeding 20 mK. Theisotopic ratio measurement depends on the cavity temperature at a rate of −18 ‰/K, sothe cavity temperature fluctuations contributed only 0.02 ‰ to the measurement error of theinstrument.
A pressure transducer measured the cavity pressure to a precision of better than 13.4 Pa. Thesystem electronics used this pressure measurement to correct for changes in the cavity pressureduring measurements. An uncertainty of 13.4 Pa in pressure corresponds to a 1 part in 16,000uncertainty in the measured carbon dioxide concentration at 380 ppm (atmospheric concen-tration). Cavity leak rates were <4 Pa/h. The measurements were performed at ∼6.7 kPaand were, therefore, not significantly contaminated by leakage during the measurement time.Figure 6 shows the pressure reproducibility of the system.
The advanced prototype instrument was calibrated to convert the measured 13CO2 to 12CO2
peak height ratios into delta values. The calibration was performed using known isotopic ratiostandards from Cambridge Isotope Laboratories (CIL) to determine the absolute scale at fixedpressure, total CO2 concentration, and temperature. Corrections to the calibration betweenpeak height ratio and delta value were determined for changes in sample pressure, sampleconcentration, RDC temperature, and ring-down engine module internal temperature.
The peak height ratio varied by a change in delta value of 0.0045 ‰/Pa. We measured thesample pressure with a precision of better than 13.4 Pa, resulting in <0.06 ‰ error in the deltameasurement.
The dependence of peak height ratio on total CO2 concentration was equivalent to a deltadependence of 0.7 ‰/(%CO2). Using the 12CO2 peak height, we were easily able to measurethe CO2 concentration to better than 0.01 %, resulting in no significant contribution to themeasurement error from the total CO2 concentration level.
The peak height ratios varied with cavity temperature at a rate which was equivalent to adelta variation of 18 ‰/◦C. Our instruments demonstrated an RMS temperature stability of
Figure 6. Variation of sample pressure in CRDS instrument over a set of 35 samples.
30 Ed H. Wahl et al.
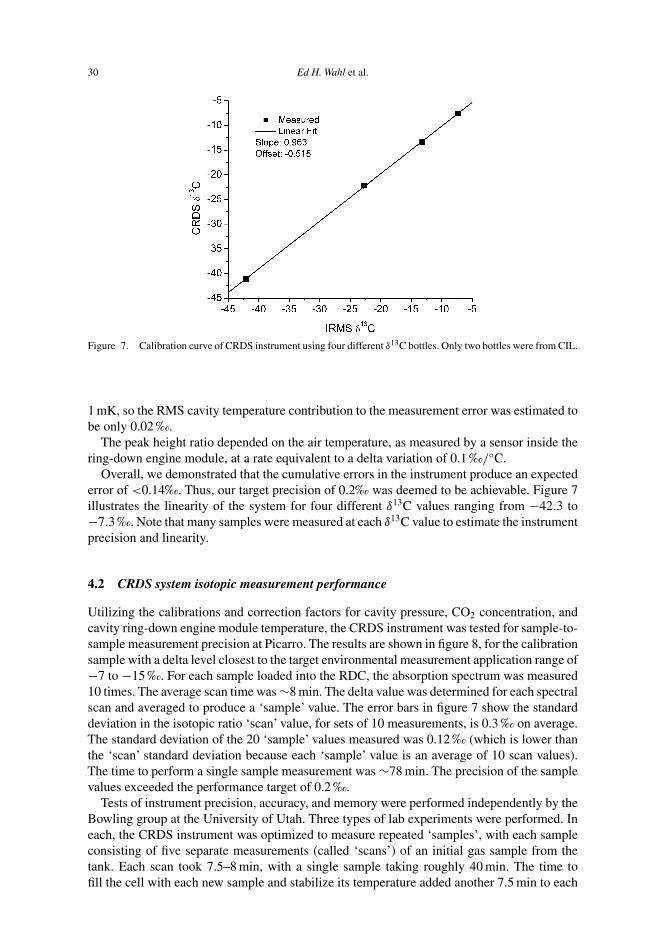
Figure 7. Calibration curve of CRDS instrument using four different δ13C bottles. Only two bottles were from CIL.
1 mK, so the RMS cavity temperature contribution to the measurement error was estimated tobe only 0.02 ‰.
The peak height ratio depended on the air temperature, as measured by a sensor inside thering-down engine module, at a rate equivalent to a delta variation of 0.1 ‰/◦C.
Overall, we demonstrated that the cumulative errors in the instrument produce an expectederror of <0.14‰. Thus, our target precision of 0.2‰ was deemed to be achievable. Figure 7illustrates the linearity of the system for four different δ13C values ranging from −42.3 to−7.3 ‰. Note that many samples were measured at each δ13C value to estimate the instrumentprecision and linearity.
4.2 CRDS system isotopic measurement performance
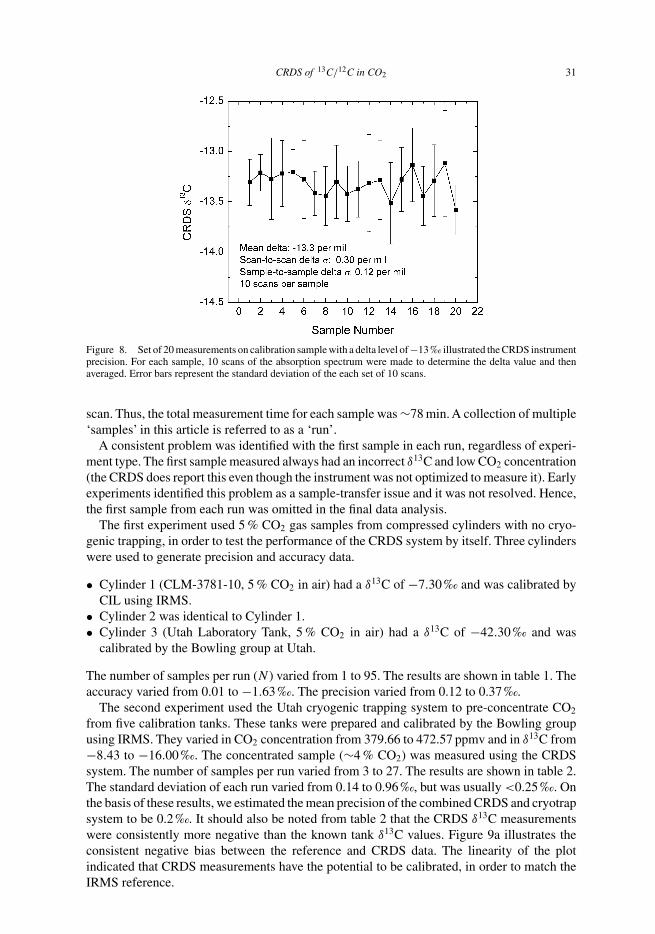
Utilizing the calibrations and correction factors for cavity pressure, CO2 concentration, andcavity ring-down engine module temperature, the CRDS instrument was tested for sample-to-sample measurement precision at Picarro. The results are shown in figure 8, for the calibrationsample with a delta level closest to the target environmental measurement application range of−7 to −15 ‰. For each sample loaded into the RDC, the absorption spectrum was measured10 times. The average scan time was ∼8 min. The delta value was determined for each spectralscan and averaged to produce a ‘sample’ value. The error bars in figure 7 show the standarddeviation in the isotopic ratio ‘scan’ value, for sets of 10 measurements, is 0.3 ‰ on average.The standard deviation of the 20 ‘sample’ values measured was 0.12 ‰ (which is lower thanthe ‘scan’ standard deviation because each ‘sample’ value is an average of 10 scan values).The time to perform a single sample measurement was ∼78 min. The precision of the samplevalues exceeded the performance target of 0.2 ‰.
Tests of instrument precision, accuracy, and memory were performed independently by theBowling group at the University of Utah. Three types of lab experiments were performed. Ineach, the CRDS instrument was optimized to measure repeated ‘samples’, with each sampleconsisting of five separate measurements (called ‘scans’) of an initial gas sample from thetank. Each scan took 7.5–8 min, with a single sample taking roughly 40 min. The time tofill the cell with each new sample and stabilize its temperature added another 7.5 min to each
CRDS of 13C/12C in CO2 31
Figure 8. Set of 20 measurements on calibration sample with a delta level of −13 ‰ illustrated the CRDS instrumentprecision. For each sample, 10 scans of the absorption spectrum were made to determine the delta value and thenaveraged. Error bars represent the standard deviation of the each set of 10 scans.
scan. Thus, the total measurement time for each sample was ∼78 min. A collection of multiple‘samples’ in this article is referred to as a ‘run’.
A consistent problem was identified with the first sample in each run, regardless of experi-ment type. The first sample measured always had an incorrect δ13C and low CO2 concentration(the CRDS does report this even though the instrument was not optimized to measure it). Earlyexperiments identified this problem as a sample-transfer issue and it was not resolved. Hence,the first sample from each run was omitted in the final data analysis.
The first experiment used 5 % CO2 gas samples from compressed cylinders with no cryo-genic trapping, in order to test the performance of the CRDS system by itself. Three cylinderswere used to generate precision and accuracy data.
• Cylinder 1 (CLM-3781-10, 5 % CO2 in air) had a δ13C of −7.30 ‰ and was calibrated byCIL using IRMS.
• Cylinder 2 was identical to Cylinder 1.• Cylinder 3 (Utah Laboratory Tank, 5 % CO2 in air) had a δ13C of −42.30 ‰ and was
calibrated by the Bowling group at Utah.
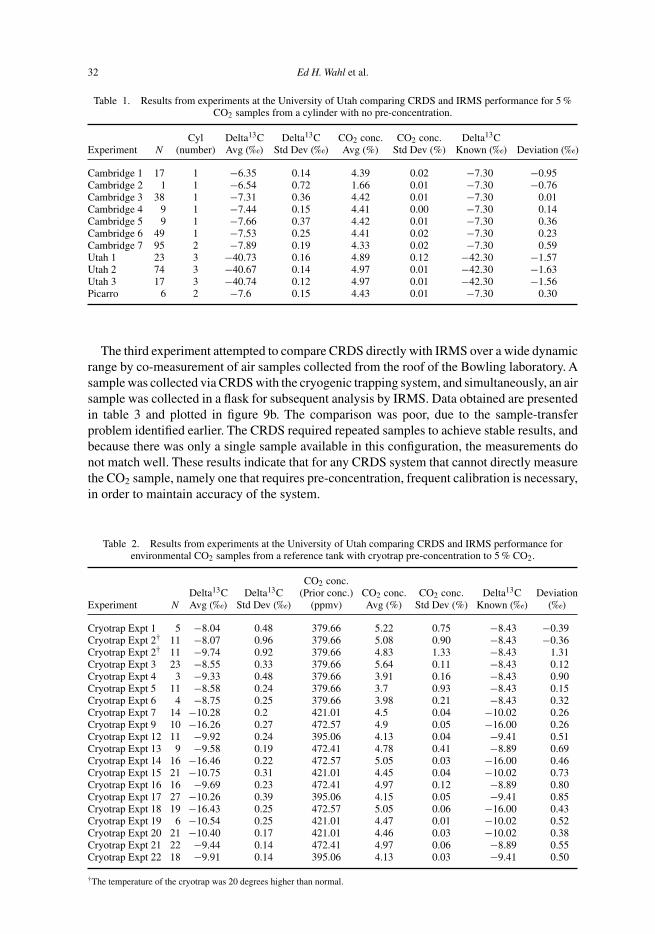
The number of samples per run (N ) varied from 1 to 95. The results are shown in table 1. Theaccuracy varied from 0.01 to −1.63 ‰. The precision varied from 0.12 to 0.37 ‰.
The second experiment used the Utah cryogenic trapping system to pre-concentrate CO2
from five calibration tanks. These tanks were prepared and calibrated by the Bowling groupusing IRMS. They varied in CO2 concentration from 379.66 to 472.57 ppmv and in δ13C from−8.43 to −16.00 ‰. The concentrated sample (∼4 % CO2) was measured using the CRDSsystem. The number of samples per run varied from 3 to 27. The results are shown in table 2.The standard deviation of each run varied from 0.14 to 0.96 ‰, but was usually <0.25 ‰. Onthe basis of these results, we estimated the mean precision of the combined CRDS and cryotrapsystem to be 0.2 ‰. It should also be noted from table 2 that the CRDS δ13C measurementswere consistently more negative than the known tank δ13C values. Figure 9a illustrates theconsistent negative bias between the reference and CRDS data. The linearity of the plotindicated that CRDS measurements have the potential to be calibrated, in order to match theIRMS reference.
32 Ed H. Wahl et al.
Table 1. Results from experiments at the University of Utah comparing CRDS and IRMS performance for 5 %CO2 samples from a cylinder with no pre-concentration.
Cyl Delta13C Delta13C CO2 conc. CO2 conc. Delta13CExperiment N (number) Avg (‰) Std Dev (‰) Avg (%) Std Dev (%) Known (‰) Deviation (‰)
Cambridge 1 17 1 −6.35 0.14 4.39 0.02 −7.30 −0.95Cambridge 2 1 1 −6.54 0.72 1.66 0.01 −7.30 −0.76Cambridge 3 38 1 −7.31 0.36 4.42 0.01 −7.30 0.01Cambridge 4 9 1 −7.44 0.15 4.41 0.00 −7.30 0.14Cambridge 5 9 1 −7.66 0.37 4.42 0.01 −7.30 0.36Cambridge 6 49 1 −7.53 0.25 4.41 0.02 −7.30 0.23Cambridge 7 95 2 −7.89 0.19 4.33 0.02 −7.30 0.59Utah 1 23 3 −40.73 0.16 4.89 0.12 −42.30 −1.57Utah 2 74 3 −40.67 0.14 4.97 0.01 −42.30 −1.63Utah 3 17 3 −40.74 0.12 4.97 0.01 −42.30 −1.56Picarro 6 2 −7.6 0.15 4.43 0.01 −7.30 0.30
The third experiment attempted to compare CRDS directly with IRMS over a wide dynamicrange by co-measurement of air samples collected from the roof of the Bowling laboratory. Asample was collected via CRDS with the cryogenic trapping system, and simultaneously, an airsample was collected in a flask for subsequent analysis by IRMS. Data obtained are presentedin table 3 and plotted in figure 9b. The comparison was poor, due to the sample-transferproblem identified earlier. The CRDS required repeated samples to achieve stable results, andbecause there was only a single sample available in this configuration, the measurements donot match well. These results indicate that for any CRDS system that cannot directly measurethe CO2 sample, namely one that requires pre-concentration, frequent calibration is necessary,in order to maintain accuracy of the system.
Table 2. Results from experiments at the University of Utah comparing CRDS and IRMS performance forenvironmental CO2 samples from a reference tank with cryotrap pre-concentration to 5 % CO2.
CO2 conc.Delta13C Delta13C (Prior conc.) CO2 conc. CO2 conc. Delta13C Deviation
Experiment N Avg (‰) Std Dev (‰) (ppmv) Avg (%) Std Dev (%) Known (‰) (‰)
Cryotrap Expt 1 5 −8.04 0.48 379.66 5.22 0.75 −8.43 −0.39Cryotrap Expt 2† 11 −8.07 0.96 379.66 5.08 0.90 −8.43 −0.36Cryotrap Expt 2† 11 −9.74 0.92 379.66 4.83 1.33 −8.43 1.31Cryotrap Expt 3 23 −8.55 0.33 379.66 5.64 0.11 −8.43 0.12Cryotrap Expt 4 3 −9.33 0.48 379.66 3.91 0.16 −8.43 0.90Cryotrap Expt 5 11 −8.58 0.24 379.66 3.7 0.93 −8.43 0.15Cryotrap Expt 6 4 −8.75 0.25 379.66 3.98 0.21 −8.43 0.32Cryotrap Expt 7 14 −10.28 0.2 421.01 4.5 0.04 −10.02 0.26Cryotrap Expt 9 10 −16.26 0.27 472.57 4.9 0.05 −16.00 0.26Cryotrap Expt 12 11 −9.92 0.24 395.06 4.13 0.04 −9.41 0.51Cryotrap Expt 13 9 −9.58 0.19 472.41 4.78 0.41 −8.89 0.69Cryotrap Expt 14 16 −16.46 0.22 472.57 5.05 0.03 −16.00 0.46Cryotrap Expt 15 21 −10.75 0.31 421.01 4.45 0.04 −10.02 0.73Cryotrap Expt 16 16 −9.69 0.23 472.41 4.97 0.12 −8.89 0.80Cryotrap Expt 17 27 −10.26 0.39 395.06 4.15 0.05 −9.41 0.85Cryotrap Expt 18 19 −16.43 0.25 472.57 5.05 0.06 −16.00 0.43Cryotrap Expt 19 6 −10.54 0.25 421.01 4.47 0.01 −10.02 0.52Cryotrap Expt 20 21 −10.40 0.17 421.01 4.46 0.03 −10.02 0.38Cryotrap Expt 21 22 −9.44 0.14 472.41 4.97 0.06 −8.89 0.55Cryotrap Expt 22 18 −9.91 0.14 395.06 4.13 0.03 −9.41 0.50
†The temperature of the cryotrap was 20 degrees higher than normal.

CRDS of 13C/12C in CO2 33
Figure 9. (a) Comparison between CRDS and IRMS measured values of δ13C for four different reference samplesobtained from reservoir tanks at the University of Utah and (b) comparison between CRDS and IRMS measuredvalues of δ13C for roof air samples taken at the University of Utah laboratory.
Table 3. Results from experiments at the University of Utah comparing CRDS and IRMS performance forenvironmental CO2 samples from roof air with cryotrap pre-concentration to 4 % CO2.
Delta13C Delta13C CO2 conc. Delta13CExperiment N Avg (‰) Std Dev (‰) Avg (‰) IRMS (‰) Deviation (‰)
Roof Air 1 1 −9.86 0.32 3.67 −9.27 0.59Roof Air 2 1 −9.74 0.35 3.80 −8.85 0.89Roof Air 3 1 −9.88 0.40 3.99 −9.26 0.62Roof Air 4 1 −9.89 0.57 3.87 −8.49 1.40Roof Air 5 1 −9.81 0.38 3.8 −8.69 1.12Roof Air 6 1 −10.32 0.82 3.74 −9.72 0.60Roof Air 7 1 −11.01 0.52 4.07 −10.15 0.86Roof Air 8 1 −10.35 0.44 3.95 −9.14 1.21Roof Air 9 1 −10.18 0.59 3.83 −8.85 1.33Roof Air 10 1 −9.42 0.78 3.73 −8.91 0.51Roof Air 11 1 −9.42 0.20 3.9 −8.94 0.48Roof Air 12 1 −9.06 1.44 4.12 −8.97 0.09Roof Air 13 1 −10.17 1.52 4.26 −8.91 1.26Roof Air 14 1 −9.36 0.90 3.69 −9.11 0.25Roof Air 15 1 −10.72 0.32 3.92 −9.55 1.17Roof Air 16 1 −10.69 0.20 3.97 −9.36 1.33Roof Air 17 1 −9.79 0.38 4.12 −9.08 0.71Roof Air 18 1 −9.73 0.39 4.22 −9.06 0.67Roof Air 19 1 −9.79 0.45 3.76 −8.69 1.10Roof Air 20 1 −9.53 0.33 3.76 −8.59 0.94Roof Air 21 1 −9.80 0.90 3.68 −9.33 0.47
5. Conclusions
The plumbing system for sample transfer to the CRDS has subsequently been redesigned toalleviate the sample-transfer problem. For this early work, the sampling problem preventedsuitable measurement of unknown samples. Overall, the CRDS system showed good precision(often better than 0.2 ‰) for 4 % CO2 and, with cryotrapping, also had good precision (0.15–0.25 ‰) for ambient CO2. The measurement time required to achieve this precision was∼78 min. There are a variety of applications that such a CRDS instrument might be suited for
34 Ed H. Wahl et al.
with this precision at higher CO2 concentrations (i.e. 5–10 %), such as medical human breathanalysis or animal breath experiments.
The precision of CRDS for ambient CO2 concentrations (300–400 ppmv) was not as goodas MS, which is presently 0.05 ‰ in many laboratories. A different spectral region for analysiswas subsequently selected, in order to measure lower concentrations of CO2, specifically downto 1 % CO2 for small animal studies, and will be reported elsewhere. This improvement reducesthe requirements and associated fractionation issues for pre-concentration. The advent ofcommercially available, reliable 2.1 µm DFB diode lasers, providing access to absorption linesthat are 60 times stronger than at 1.6 µm, should allow direct measurement of environmentalconcentrations of CO2 with the same precision achieved in this study. With improved mirrorsand cavity designs to minimize etalon effects, and internally designed electronics optimizedfor CRDS data acquisition, we have currently been able to reduce the measurement time to∼5 min for the same precision. These recent results will be reported elsewhere.
The accuracy of the CRDS system without calibration was not sufficient for high-qualitymeasurements. However, the instrument was quite linear, and with frequent measurement ofsuitable calibration gases, CRDS is likely to provide excellent results.
Small size, robust design, and potential for frequent measurements at a remote site makeCRDS technology attractive for remote atmospheric measurement applications. Future exper-iments need to determine the long-term stability of the instrument, in order to minimize thevariability in the mean δ13C measured on separate multi-sample runs of the same sample. Theultimate test of the instrument will be made directly in field applications.
An observation has been made [10] that the adoption of laser spectroscopy to replace tra-ditional IRMS is a ‘chicken-and-egg’ problem, wherein the technology will be adopted onceit is mature, but it cannot mature until it is adopted by the international isotope community.In recent years, commercial isotope measurement systems using lead-salt [21] mid-infraredlasers have become available. The use of these instruments [21, 22] by the isotope commu-nity demonstrates a willingness to consider laser spectroscopy as a real alternative to IRMS.These mid-infrared systems, however, suffer from the same portability and price limitationsas IRMS. It is our hope that with the advent of reliable 2 µm diode lasers, near-infrared CRDStechnology can resolve both of these limitations and improve in sensitivity to make directisotopic measurements of atmospheric CO2 concentration, thereby succeeding in becomingwidely used for isotopic measurements in scientific applications.
Acknowledgements
The authors at Picarro would like to thank the Department of Energy (DOE), which has madethis work possible through their SBIR grant program (Grant no. DE-FG03-01ER83250). Thissupport does not constitute an endorsement by the DOE of the views expressed in this article.The authors would also like to thank Richard Zare and Marc Levenson for their support andguidance over the past 2 years.
References
[1] P.P. Tans, J.A. Berry, R.F. Keeling. Oceanic 13C/12C observations – a new window on ocean CO2 uptake.Global Biogeochem. Cycles, 7, 353–368 (1993).
[2] I.G. Enting, C.M. Trudinger, R.J. Francey. A synthesis inversion of the concentration and δ13C of atmosphericCO2. Tellus B, 47, 35–52 (1995).
[3] P. Ciais, P. Friedlingstein, D.S. Schimel, P.P. Tans. A global calculation of the δ13C of soil respired carbon:implications for the biosphere uptake of anthropogenic CO2. Global Biogeochem. Cycles, 13, 519–530 (1999).
[4] D.R. Bowling, D.D. Baldocchi, R.K. Monson. Dynamics of isotopic exchange of carbon dioxide in a Tennesseedeciduous forest. Global Biogeochem. Cycles, 13, 903–922 (1999).
CRDS of 13C/12C in CO2 35
[5] D. Bowling, N. McDowell, B. Bond, B. Law, J. Ehleringer. 13C content of ecosystem respiration is linked toprecipitation and vapor pressure deficit. Oecologia, 131, 113–124 (2002).
[6] D.R. Bowling, P.P. Tans, R.K. Monson. Partitioning net ecosystem carbon exchange with isotopic fluxes of CO2.Glob. Change Biol., 7, 127–145 (2001).
[7] J.B. Miller, P.P. Tans, J.W.C. White, T.J. Conway, B.W. Vaughn. The atmospheric signal of terrestrial carbonisotopic discrimination and its implication for partitioning carbon fluxes. Tellus B, 55, 197–206 (2003).
[8] C.D. Keeling. The concentration and isotopic abundances of atmospheric carbon dioxide in rural areas. Geochim.Cosmochim. Acta, 13, 322–334 (1958).
[9] G. Berden, R. Peeters, G. Meijer. Cavity ring-down spectroscopy: experimental schemes and applications. Int.Rev. Phys. Chem., 19, 565–607 (2000).
[10] E.R.T. Kerstel. Isotope ratio infrared spectrometry. In Handbook of Stable Isotope Analytical Techniques,Pier de Groot (Ed.), Vol. I, Chapter 34, pp. 759–787, Elsevier, Amsterdam (2004).
[11] T.G. Spence, C.C. Harb, B.A. Paldus, R.N. Zare, B. Willke, R.L. Byer. A laser-locked cavity ring-downspectrometer employing an analog detection scheme. Rev. Sci. Inst., 71, 347–353 (2000).
[12] G. Gagliardi, A. Castrillo, R.Q. Iannone, E.R.T. Kerstel, L. Gianfrani. High-precision determination of the13CO2/
12CO2 isotope ratio using a portable 2.008 µm diode-laser spectrometer. Appl. Phys. B, 77, 119–124(2003).
[13] D.R. Bowling, S.D. Sargent, B.D. Tanner, J.R. Ehleringer. Tunable diode laser absorption spectroscopy forstable isotope studies of ecosystem-atmosphere CO2 exchange. Agr. Forest Meteorol., 118, 1–19 (2003).
[14] E.R.T. Kerstel, G. Gagliardi, L. Gianfrani, H.A.J. Meijer, R. van Trigt, R. Ramaker. Determination of the2H/1H, 17O/16O, and 18O/16O isotope ratios in water by means of tunable diode laser spectroscopy at 1.39 µm.Spectrochim. Acta A, 58, 2389–2396 (2002).
[15] L. Gianfrani, G. Gagliardi, G.M. van Burgel, E.R.T. Kerstel. Isotope analysis of water by means of near infrareddual-wavelength diode laser spectroscopy. Opt. Express, 11, 1566–1576 (2003).
[16] K. Uehara, K. Yamamoto, T. Kikugawa, N. Yoshida. Isotope analysis of environmental substances by a newlaser-spectroscopic method utilizing different pathlengths. Sens. Actuators B, 74, 173–178 (2001).
[17] K. Uehara, K. Yamamoto, T. Kikugawa, S. Toyoda, K. Tsuji, N. Yoshida. Precise isotope abundance ratiomeasurement of nitrous oxide using diode lasers. Sens. Actuators B, 90, 250–255 (2003).
[18] H. Dahnke, D. Kleine, W. Urban, P. Hering, M. Mürtz. Isotopic ratio measurement of methane in ambient airusing mid-infrared cavity leak-out spectroscopy. Appl. Phys. B, 72, 121–125 (2001).
[19] E.R. Crosson, K.N. Ricci, B.A. Richman, F.C. Chilese, T.G. Owano, R.A. Provencal, M.W. Todd, J. Glasser,A.A. Kachanov, B.A. Paldus, T.G. Spence, R.N. Zare. Stable isotope ratios using cavity ring-down spectroscopy:determination of 13C/12C for carbon dioxide in human breath. Anal. Chem., 74, 2003–2007 (2002).
[20] D. Halmer, G. von Basum, P. Hering, M. Mürtz. Fast exponential fitting algorithm for real-time instrumentaluse. Rev. Sci. Instrum., 75, 2187–2191 (2004).
[21] D.R. Bowling, S.D. Sargent, B.D. Tanner, J.R. Ehleringer. Tunable diode laser absorption spectroscopy forstable isotope studies of ecosystem-atmosphere CO2 exchange. Agr. Forest Meteorol., 118, 1–19 (2003).
[22] T.J. Griffis, J.M. Baker, S.D. Sargent, B.D. Tanner, J. Zhang. Measuring field-scale isotopic CO2 fluxes withtunable diode laser absorption spectroscopy and micrometeorological techniques. Agr. Forest Meteorol., 124,15–29 (2004).
