applying coefficients of preference in ranking … · applying coefficients of preference in...
TRANSCRIPT

Yugoslav Journal of Operations Research 13 (2003), Number 2, 175-186
APPLYING COEFFICIENTS OF PREFERENCE IN RANKING (CPR)*
Zoran RADOJI^I], Dragan VUKMIROVI], Nahod VUKOVI], Milo{ VOJINOVI]
Faculty of Organizational Sciences, University of Belgrade, Belgrade, Serbia and Montenegro
Communicated by Byron Papathanassiou
Abstract: In marketing or medical research, especially in psychiatrics, it is very often necessary to define preference of examinees against defined object (persons, products, or phenomena). A question that is related to the object of preference is defined as like degree of like (positive preference) or as like degree of dislike (negative preference), where estimation is done as in scholar system (nominal or ordinal characteristics), with marks 1 through 5. Rank of objects achieved is very often expressed as average, which is not a good measure for realistic object ranking. In this paper, a coefficient of preference is presented as an effort to rank object more efficiently than average or other methods for ranking, especially in the meaning of preference. Preference is essential for humankind for decision making. One of the measures is Coefficients of Preference in Ranking (CPR) as shown.
Keywords: Research, ranking, coefficient, preference.
1. INTRODUCTION
Ranking of specific marks is very often done in a way that its results can cause serious consequences like entering exams, competitions, UN participation, medicine selection and many others.
Ordinary ranking problem is based on: { , ,..., }= 1 2 nE e e e - a group that has to be ranked,
( , ,..., )= 1 2 pX x x x - criteria for a group ranking. E
Group has to be selected, as a smaller sub-group, based on realization of vector on the group .
EX E
* Presented at 6th Balkan Conference on Operational Research

Z. Radoji~i}, D. Vukmirovi}, N. Vukovi}, M. Vojinovi} / Applying Coefficients of Preference 176
There are two linked problems: 1. Ranking, 2. Selection. If = 1p , which means there is just one characteristic (one variable), ranking
problem can be solved in a few different ways, but because of the type of research it is necessary to do ranking that will represent the observed problem in the most realistic way. [6, 10]
2. STATISTICAL METHODS IN RANKING
Let's suppose that with one criteria we can group elements of group . Each element of group
E
iA formed like that is a sub-group of . E
Suppose that D is a given group of sub-groups of . If the union of all parts is equal to the group group can be said to be representing one cover of group .
If not all sub-groups of
E,E D E
D are full, without any interrelation, and their union is equal to the group is said that to be one division of group . For parts of one division,
it is said they are one class of group .
,E D E
ELet's assume that the variable has ordered class and ordered elements in each
class. To each element two indexes can be given so that the first one presents the rank of the class of elements in the class it belongs to. As an example, ije would present the
j element in class. iDivision with class and elements ordered and marked like that is called
classification of group and is marked with E K ;
, ,..., ; , ,... , , ,... ,..., , ,...= =1 2 1 11 12 21 22 1 2k kK A A A K e e e e e ek .
where presents the total number of class, and k is a mark of some ordered group,
ije is not a divided element of group , and for E iA as agreed it is taken that it is not a
divided element of some particular group of group K . If , each class will contain one element, and classification of =k n K will
present one rank-list of elements of group . [6] EIf for the elements of group the mark is measured and if they are
ordered according to the size of that mark, each element will have its own rank in the order formed like that. If the value of an element is marked as i in the order according to the size in the group , that element can be marked as
E X
XE ie and its value
from to X ix . It is:
[ { , , } ]+∀ ∈ … − ⇒ ≥ 11 1i ii n x xi .
In this way the classification list can be formed (rank-list, schedule list) for elements of group related to the value of . The named process presents ranking. The procedure that is used for the ranking process can be organized in many different ways, depending on the mathematical model that forms the rank list [6].
E X

Z. Radoji~i}, D. Vukmirovi}, N. Vukovi}, M. Vojinovi} / Applying Coefficients of Preference 177
2.1. Average Values Method
This is one of the most often used methods in ranking in which average value has been taken as a rank. This method is used in the scholar system where the average mark of students is an index for ranking to be done. Average of that element is reached by the following
k
; ,=
= =∑1
11
kn
k ik i
X x kn
j ,
and rank based on
... ...+ −> > > > > >1 1 1j k k kX X X X X .
In some cases, this method is not a good solution as there are large variations, which mean variance not equal for each kX , or if the values are discreet. [10]
2.2. Method sum of ranking
A method of sum ranking is based on previous determination of schedule classification of group P elements for each mark of group . X
If rank of pP element related to sX characteristic is marked as spi then the
rank matrix can be given as
1X 2X ... kX
1P i11 i21 ... ik1
2P i12 i22 ... ik2
... ... ... ... ...
nP i1n i2n ... ikn
So that
, ,, , [ { ,..., } { , } { ,..., } { ,..., } { ,..., }]∀ ∈ ⊆ ⇒ ≠ ⊆11 and 1 and 1s p sh s s ns p q s k p q n i i i i n .
By summarizing all ranks of jP elements, a number is obtained which is
considered by economists as the mark of factor, that means, F
, { ,...,=
= ∈∑1
1k
j sjs
F i j n}.
This method is easy and simple to understand; still it gives no unique solution, which means that the relation between two elements depends on the third one.
The method that gives no unique solutions and allows it to be misused has no authority and objectivity. Its usage is very dangerous if some important decisions have to be made based on it. [4]

Z. Radoji~i}, D. Vukmirovi}, N. Vukovi}, M. Vojinovi} / Applying Coefficients of Preference 178
2.3. Bennett's method
Bennett's method is used in the UN for comparison of achieved level of standard of examined group of countries based on measuring of some non-monetary values. By giving an index 100 to the country forehead in one characteristic and related to the values of the index in some other countries, global index of standard in a country is defined by sum of indexes of all other chosen characteristics.
If { , ,..., }= 1 2 kX X X X is a group of chosen indexes that gives information
about standard of group of countries { , ,..., }= 1 2 nP P P P , and if ijx is a mark value
for country jX
iP and if
max { }, { ,..., }+
≤ ≤= ∈
11j ij
i nx x j k
life standard of the country iP is defined by Bennett with
, { ,...,+=
= ∈∑1
1001
k
i ijj j
F x j x
}n
This method gives no unique solution. If one or more basic maximal values exposed to some changes are different, contradictory results can come up even if the changeable values are maximal. [2]
2.4. Cseh-Szombathy's method
This method is an advanced Bennett's method. The group of chosen characteristics can be divided into homogeneous groups and then absolute maximum is defined. [4]
2.5. Niewiarski's Method
Niewiarski has given an advanced Bennett's method. He combined different characteristics with the aim to achieve maximal correlation between different effectively used characteristics and global synthetic characteristics. [4]
2.6. Beckerman's methods
The idea of . Beckerman was to establish linear regression between the most important criteria and group of the other chosen criteria, so
W
= + + +0 1 1 2 2 k kX a X a X a X
where is the most important criteria, 0X { ,..., }= 1 kX X X is the group of the other
criteria, and { ,..., }= 1 ka a a is the adequate group of regression coefficients.
If is a viewed group of elements and if , then regression
coefficients can be determined
{ ,..., }= 1 nS P P >n k
,...,1 ka a . As none of criteria, not even the most
important ones, gives no complete information about elements, Beckerman suggests it to be marked through the other criteria.

Z. Radoji~i}, D. Vukmirovi}, N. Vukovi}, M. Vojinovi} / Applying Coefficients of Preference 179
Main deficiency of this method is that it is not sensitive to the most important criteria. If two elements have all criteria equal except the most important ones, then they will have the same rank no matter of the advantages of the one that has higher value of the most important criteria. [4]
2.7. Method of the fixed start
This method is based on theoretical minimum of each criterion and the distant of results from it:
( ) /σ= −∑ 2 2-i k ik kkF a x x k
where ka is a ponder (coefficient of importance) of kX criteria, ikx is realization of
kX at ,i ke x - minimal possible value of kX criteria and σ k is standard deviation of
kX criteria.
Fixed start method gives good results in ranking if all the criteria are considered adequate and chosen ponder of ka criteria. [4]
2.8. Methods of factor analysis
Factor analysis method is very important for the problems of ranking of the same group of viewed elements (companies, countries, and regions) for the most different synthetic indicators (factors) based on the same group of chosen characteristics. Using of this method asks for some conditions to be considered. The main one is total so that it does not depend on all elements. [7]
2.9. One-dimensional cluster analysis
One-dimensional cluster analysis is the one used for ranking with methods of cluster analysis at one variable. A problem occurs related to the process of executing cluster analysis, hierarchical and non-hierarchical classification. [1]
2.10. I-distance method
I-distance (Ivanovic distance) enables making of the rank-list of observed units. It is necessary to fix a unit (entity) that will be a referent point on the scale. One fictive unit is often taken as a referent point with minimal values of variables for the observed group. It is the value defined with:
min { }, { , ,..., }−
≤ ≤= ∈
11 2i ir
r nx x i k
Formula for I-distance is given:
. ...( )σ
− −−
−= =
−= −∑ ∏
1
12 11 1
1ik
ir ir j
ii j
x xD r i j
where . ... −12 1ji jr are partial correlation coefficients.

Z. Radoji~i}, D. Vukmirovi}, N. Vukovi}, M. Vojinovi} / Applying Coefficients of Preference 180
In this way, the distance for each element of the group can be defined. If all elements (entities) are ordered according to the size of their so estimated I-distances, the rank list will be given. [6]
3. PREFERENCE COEFFICIENT
It is very often difficult to choose the adequate methods for ranking in marketing research as an average mark (or value) is used for ranking of answers to the questions asked. Most often a direct question is asked about the degree of preference of the examinee towards the given object, and the scholar system is used by the marks from 1 to 5 (of 1-min., 5-max.), as it is a system which is most understandable to the one asked. This system is often modified by introducing zero (0) in cases when the examinee does not know or cannot do the ranking, as he has not enough information. These marks, because of great oscillations and subjectivity of those being examined do not give quite a clear view of preferences towards the problem [8]. Preference coefficients defined during the panel research of Laboratory for Statistics, STATLAB, try to give adequate solutions to the problem. [5]
Calculation of preference coefficient is done in two steps: 1. For each viewed object, relative frequencies (%) of defined mark presence
are calculated, arranged from the smallest to the biggest mark. ( )iV
2. Calculation is done by the given formulas so the preference coefficient is reached.
Six (6) preference coefficients are defined as it is shown in table 3.1.
Table 3.1: Definition of preference coefficient
Coefficient of maximal preferences CP1 =1
1 nVCP
V,
Coefficient of minimal preferences CP1Ê ' = =1 11
1n
VCP
V CP
Coefficient of maximal average ability of preferences CP2
−
+ −=
−
=
=∑
∑
12
11
12
1
1
2
1
ndev
n ii
ndev
ii
Vi
CP
Vi
Coefficient of minimal average ability of preferences CP2Ê
' =1
22
CPCP
Adjusted coefficient of maximal/minimal average ability of preferences CP3
− ++
= ∗ +
∗ ∗
12 23 2 1
2 100
n nn dev dev
V V
CP CPn
Exclusively coefficient of preferences CPI = ∗ − ∗
03 1100
VCPI CP
r

Z. Radoji~i}, D. Vukmirovi}, N. Vukovi}, M. Vojinovi} / Applying Coefficients of Preference 181
Procedures for calculating are: Marks are i where ,..., ,= 1 n < < n1 . The relative frequencies of marks are and V is the participation
of not given answers.
,...,1 nV V 0
Dev is a full-number division result, and n is a number of possible marks (without 0), while as the exclusive coefficient of preferences is the negative degree of loading of answers that are not given of viewed object from the one being asked for.
r
In summary CPR presents relations of maximal versus minimal preferences of
examinees compared to the observed phenomena. Preference, according to some phenomena very often presents the critical factor for customers to make decisions. [3]
An example for calculating CP and coefficients are given in the table 3.2.
Table 3.2: Example for calculating CP
Marks Frequency Valid Percent 0 26 8.75 1 4 1.35 2 8 2.69 3 32 10.77 4 80 26.94 5 147 49.49
Total 297 100.00 Average 3.94
n (no. of marks)=5
CP1 CP1' CP3
36.75 0.03 23.50
CP2 CP2' CPI
23.38 0.04 21.44 n=5; *r=1
CP1=49.49/1.35
CP2=(1*49.49+0.5*26.94)/(1*1.35+0.5*2.69)
CP3=CP2*(1+((10.77+10.77)/(2*5*100)))
CPI=CP3*(1-(8.75/(*1*100)))
4. CASE STUDY
4.1. Marketing study
For choosing a person who would do advertising for Procter&Gamble products, research is made in SM&MR Institute. Those who have been asked had to answer the question which person would make them buy mentioned products.
The question was: "Please, give mark as in the scholar system to the persons that would make you buy products if you were to do the advertising for (1-Negative, 5-Positive, 0-Can't give any mark)". Based on achieved results and the procedure, the preference coefficient values of coefficients are given in a table just as ranks in the table 4.1.

Z. Radoji~i}, D. Vukmirovi}, N. Vukovi}, M. Vojinovi} / Applying Coefficients of Preference 182
Table 4.1: Preference coefficient values and rank achieved Coefficients of Preference *r=1 Rank
CP1 CP1' CP2 CP2' CP3 CPI* AVERAGE Person CP1R CP2R CP3R CPIR AVGR
110.00 0.01 7.50 0.13 7.55 5.87 3.30 Dragan Jovanovic 1 1 1 1 4
36.75 0.03 6.18 0.16 6.21 5.66 3.94 Branka Katic 3 2 2 2 1
42.00 0.02 6.04 0.17 6.08 5.40 3.93 Anica Dobra 2 3 3 3 2
9.54 0.10 2.07 0.48 2.10 1.85 3.59 Predrag Mijatovic 7 4 4 4 3
10.00 0.10 1.67 0.60 1.69 1.33 3.09 Ana Sofrenovic 6 6 6 5 7
11.80 0.08 2.06 0.48 2.08 1.30 2.37 Igor Milanovic 4 5 5 6 12
10.67 0.09 1.53 0.65 1.56 1.22 3.04 Dubravka Mijatovic 5 7 7 7 8
7.00 0.14 1.34 0.74 1.37 1.05 2.77 Jasna Sekaric 9 8 8 8 10
4.47 0.22 1.10 0.91 1.12 0.98 3.22 Stefan Milenkovic 10 10 10 9 5
2.91 0.34 0.68 1.48 0.69 0.61 3.13 Ivana Bojic 12 12 12 10 6
2.06 0.48 0.65 1.54 0.66 0.55 2.83 Dejan Tomasevic 13 13 13 11 9
7.33 0.14 1.16 0.87 1.16 0.38 1.16 Snezana Dakic 8 9 9 12 16
1.35 0.74 0.43 2.35 0.44 0.24 1.76 Bojana Maljevic 14 14 14 13 14
0.94 1.07 0.25 4.01 0.26 0.22 2.43 Sestre K2 16 16 16 14 11
3.33 0.30 1.00 1.00 1.00 0.19 0.64 Tamara Paunovic 11 11 11 15 18
0.57 1.77 0.21 4.71 0.22 0.17 2.16 Leontina V. 17 17 17 16 13
1.00 1.00 0.39 2.56 0.40 0.14 1.08 Marija Macic 15 15 15 17 17
0.21 4.79 0.07 14.88 0.07 0.04 1.43 Dejan Pantelic 18 18 18 18 15
0.0000
2.0000
4.0000
6.0000
8.0000
10.0000
12.0000
14.0000
16.0000
18.0000
CP1 R CP2 R CP3 R CPi R AVG R
Dragan JovanovicBranka KaticAnica DobraPredrag MijatovicAna SofrenovicIgor MilanovicDubravka MijatovicJasna SekaricStefan MilenkovicIvana BojicDejan TomasevicSnezana DakicBojana MaljevicSestre K2Tamara PaunovicLeontina VukomanovicMarija MacicDejan Pantelic
Figure 4.1: Persons' rank based on the preference coefficient (CPx R) and average (AVG R)
At the Figure 4.1 the values of persons are given based on the rank of Coefficient of preference and fluctuation from average. If the value of coefficient of
Z. Radoji~i}, D. Vukmirovi}, N. Vukovi}, M. Vojinovi} / Applying Coefficients of Preference 183
preference is bigger than one (1) CP>1, it means the phenomenon is much preferred (much like than unlike). Vice versa, if CP<1, it means the phenomenon is not preferred (much unlike than like).
4.2. CPR of medications efficacy - medical research
Considering the pain intensity in different time points through the four categories (0-none, without pain; 1-mild; 2-moderate; 3-severe; 4-very severe), we can obtain coefficient of preference in ranking, which gives us the range of quality of analyzed analgesic agents.
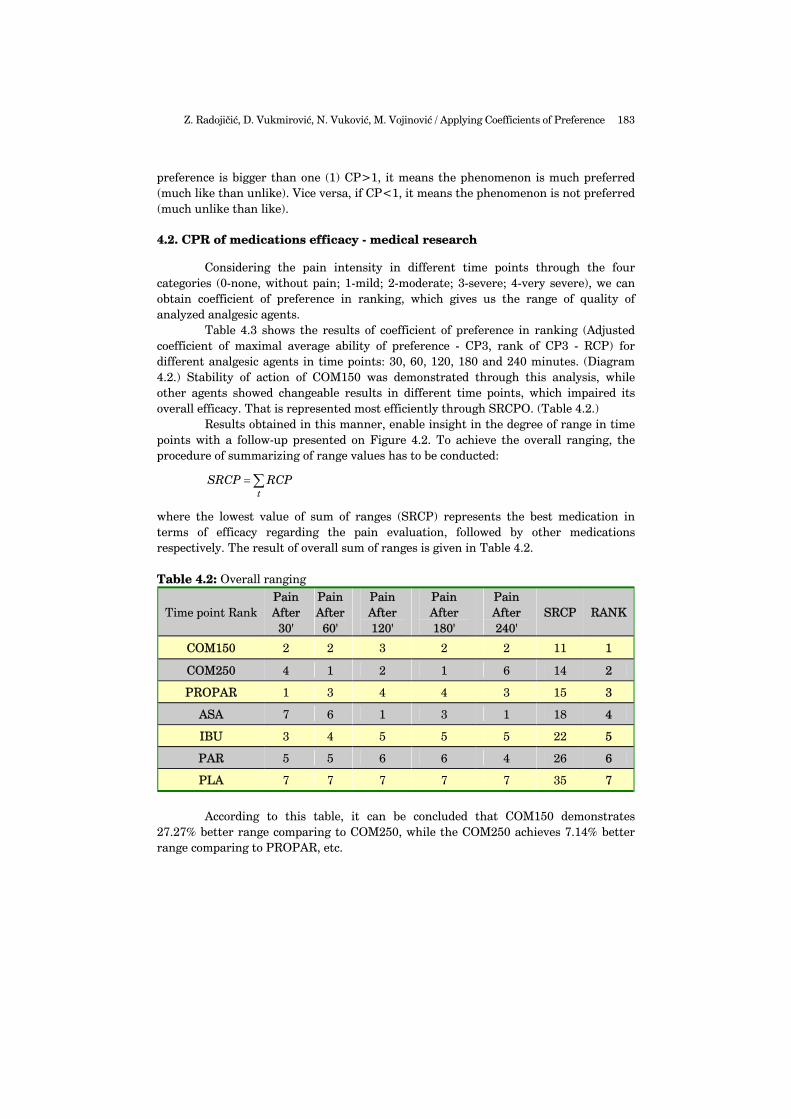
Table 4.3 shows the results of coefficient of preference in ranking (Adjusted coefficient of maximal average ability of preference - CP3, rank of CP3 - RCP) for different analgesic agents in time points: 30, 60, 120, 180 and 240 minutes. (Diagram 4.2.) Stability of action of COM150 was demonstrated through this analysis, while other agents showed changeable results in different time points, which impaired its overall efficacy. That is represented most efficiently through SRCPO. (Table 4.2.)
Results obtained in this manner, enable insight in the degree of range in time points with a follow-up presented on Figure 4.2. To achieve the overall ranging, the procedure of summarizing of range values has to be conducted:
= ∑t
SRCP RCP
where the lowest value of sum of ranges (SRCP) represents the best medication in terms of efficacy regarding the pain evaluation, followed by other medications respectively. The result of overall sum of ranges is given in Table 4.2.
Table 4.2: Overall ranging
Time point Rank Pain After
30'
Pain After
60'
Pain After 120'
Pain After 180'
Pain After 240'
SRCP RANK
COM150 2 2 3 2 2 11 1
COM250 4 1 2 1 6 14 2
PROPAR 1 3 4 4 3 15 3
ASA 7 6 1 3 1 18 4
IBU 3 4 5 5 5 22 5
PAR 5 5 6 6 4 26 6
PLA 7 7 7 7 7 35 7
According to this table, it can be concluded that COM150 demonstrates
27.27% better range comparing to COM250, while the COM250 achieves 7.14% better range comparing to PROPAR, etc.

Z. Radoji~i}, D. Vukmirovi}, N. Vukovi}, M. Vojinovi} / Applying Coefficients of Preference 184
0
1
2
3
4
5
6
7
8
Pain After 30 min Pain After 60 min Pain After 120 min Pain After 180 min Pain After 240 min
Time
Rank
COM150COM250PROPARASAIBUPARPLA
Figure 4.2: Rank of medication in time (pain after minutes) based on CP3
Table 4.3: Coefficient of preference in ranging regarding to time points
Drugs PA CP3 RANK
PROPAR Pain After 30 min 2.86 1
COM150 Pain After 30 min 1.04 2 IBU Pain After 30 min 0.68 3
COM250 Pain After 30 min 0.44 4 PAR Pain After 30 min 0.34 5 PLA Pain After 30 min 0.24 6 ASA Pain After 30 min 0.00 7
COM250 Pain After 60 min 7.63 1 COM150 Pain After 60 min 3.69 2 PROPAR Pain After 60 min 3.42 3
IBU Pain After 60 min 1.76 4 PAR Pain After 60 min 0.75 5 ASA Pain After 60 min 0.61 6 PLA Pain After 60 min 0.25 7
ASA Pain After 120 min 7.42 1
COM250 Pain After 120 min 4.88 2 COM150 Pain After 120 min 3.77 3 PROPAR Pain After 120 min 2.34 4
IBU Pain After 120 min 2.10 5 PAR Pain After 120 min 1.03 6 PLA Pain After 120 min 0.20 7

Z. Radoji~i}, D. Vukmirovi}, N. Vukovi}, M. Vojinovi} / Applying Coefficients of Preference 185
Table 4.3 (Cont.): Coefficient of preference in ranging regarding to time points
Drugs PA CP3 RANK
COM250 Pain After 180 min 5.01 1
COM150 Pain After 180 min 2.49 2 ASA Pain After 180 min 2.19 3
PROPAR Pain After 180 min 1.35 4 IBU Pain After 180 min 0.78 5 PAR Pain After 180 min 0.66 6 PLA Pain After 180 min 0.10 7
ASA Pain After 240 min 3.60 1 COM150 Pain After 240 min 1.18 2 PROPAR Pain After 240 min 0.63 3
PAR Pain After 240 min 0.60 4 IBU Pain After 240 min 0.36 5
COM250 Pain After 240 min 0.31 6 PLA Pain After 240 min 0.10 7
5. CONCLUSION
In marketing research or in social sciences, giving marks to examinees as a establish system to appraise is an obstacle in some occasions. Preference coefficients (CP) are not the final and the best solution for ranking in these cases but offer high level of reality in problem consideration. By now, they have been used in many marketing, political and medical research and have given good results in situation examination.
Coefficient of preference in ranking (CPR) represents the relationship between the categories of answers with categorical or ordinal character. In this study, all relations between appearance of certain answer categories were taken into account with the purpose of achieving unique value i.e. coefficient, which shows preference regarding the observed phenomenon.
REFERENCES
[1] Anderberg, M.R., Cluster Analysis for Applications, Academic Press, New York, 1973. [2] Bennet, M.K., "International disparities in consumption levels", Am. Economic Review, New
York, 1991. [3] Bogosavljevi}, S., Vukmirovi}, D., and Radoji~i}, Z., "Election typology", Monograph of
Statistical Classification '93., Federal Bureau of Statistics, Belgrade, 1993 (in Serbian). [4] Bogosavljevi}, S., "Statistical methods in ranking", Seminar of Department for Mathematics
and Information Systems, FON, Belgrade, 1997.

Z. Radoji~i}, D. Vukmirovi}, N. Vukovi}, M. Vojinovi} / Applying Coefficients of Preference 186
[5] Gace, N., "Researching of popularity of politicians in the FR Yugoslavia", Nedeljna Borba, Belgrade, 1992 (in Serbian).
[6] Ivanovi}, B., Classification Theory, Institute for Industrial Economic, Belgrade, 1977. [7] Kova~evi}, M., "200 Biggest", Economic politics, Belgrade, 1997. [8] Bogosavljević, S., Radoji~i}, Z., Vukmirovi}, D., Vukovi}, Mamula, T., "Applying Coefficients of
Preference in Ranking", Proceedings of SYM-OP-IS'98, Herceg Novi, 1998, 691-694 (in Serbian).
[9] Radoji~i}, Z., "Comparative pooled statistical analysis of the efficacy and safety of Saridon, combination of Propyphenazone 150mg, Paracetamol 250mg and Caffeine 50mg in comparison to other analgesics in subjects suffering from acute postoperative dental pain", Clinical Study, H. la Roche, Basel, Swiss, 2000.
[10] Radoji~i}, Z., "Statistical Measuring of the Phenomena Intensity", Faculty of Organizational Sciences, Belgrade, 2001 (in Serbian).