applying green chemistry to the photochemical … · 1 applying green chemistry to the...
TRANSCRIPT

1
Applying Green Chemistry to the Photochemical Route toArtemisinin
Zacharias Amara,a Jessica F. B. Bellamy,a Raphael Horvath,a Samuel J. Miller,a Andrew
Beeby,b Andreas Burgard,c Kai Rossen,*c Martyn Poliakoff*a and Michael W. George*a,d
a School of Chemistry, University of Nottingham, University Park, Nottingham, NG7 2RD, UK. b Department of
Chemistry, University of Durham, South Rd, Durham DH1 3LE, UK. c Sanofi-Aventis Deutschland GMBH,
C&BD Frankfurt Chemistry, Process research, Industriepark Hoechst. D-65926 Frankfurt am Main, Germany. d
4Department of Chemical and Environmental Engineering, University of Nottingham Ningbo China, 199
Talking East Road, Ningbo, 315100, China.
1NATURE CHEMISTRY | www.nature.com/naturechemistry
SUPPLEMENTARY INFORMATIONDOI: 10.1038/NCHEM.2261
© 2015 Macmillan Publishers Limited. All rights reserved

2
Table of Contents
1. Materials and methods (3-5)
1.1. General (3)
1.2. Characterization (4)
1.3. Spectroscopic Measurements (4)
2. Synthesis of artemisinin in CO2 (5-15)
2.1. High pressure continuous flow equipment (5)
2.2. Photo-oxidation of dihydroartemisinic acid in CO2 (8)
2.3. Synthesis of artemisinin from dihydroartemisinic acid in CO2 (10)
2.3.1. Method A: One pot homogeneous synthesis of artemisinin in CO2 (10)
2.3.2. Method B: Sequential synthesis of artemisinin in CO2 (10)
2.3.3. Method C: One pot heterogeneous synthesis of artemisinin in CO2 (11)
Preparation of porphyrins immobilized on Amberlyst-15 (11)
Characterization of Catalyst Systems (12)
Results Table S2 (14)
Leaching measurements (16)
3. Batch synthesis of artemisinin in aqueous mixtures (17)
3.1. Equipment for carrying batch photo-oxidation experiments (17)
3.2. Temperature selectivity study of the Schenk ene reaction at 30 oC and at -10 oC (17)
3.3. One pot batch procedure in dichloromethane (20)
3.4. One pot batch aqueous procedure for photo-sensitizer, solvent and acid screening (20)
Results Table S4 (22)
3.5. Procedure for the gram scale batch artemisinin synthesis with recycling of the
aqueous phase (24)
4. Continuous flow experiments in aqueous mixtures (27-31)
4.1. High Pressure Continuous Flow Equipment (27)
4.2. Adjustments of the reaction parameters for photo-oxygenation (28)
Results Table S6 (30)
5. Green Metrics Calculations (32-34)
6. Characterization (36-45)
7. Crystal data (46-48)
8. Analysis of impurities from reaction mixture table S4, entry 16 (49-53)
2NATURE CHEMISTRY | www.nature.com/naturechemistry
© 2015 Macmillan Publishers Limited. All rights reserved

3
1. Materials and methods
1.1. General
Reagents and solvents were used as received, without further purification, unless otherwise
noted. Oxygen (>99.5%) and carbon dioxide (food grade) were obtained from BOC and used
as received. Photosensitizers, PS (Figure S1) and trifluoroacetic acid were purchased from
Sigma Aldrich. Amberlyst® 15 (dry) was purchased from Acros Organics, sulfuric acid
(>95%) was purchased from Fisher Chemicals and ortho-phosphoric acid (85%) was
purchased from Fluka analytical. Dihydroartemisinic acid (3) was supplied by Sanofi-Aventis.
Solvents were purchased from VWR Prolabo and used without further purification.
Photochemical experiments were carried out using a bank of Citizen Electronics Co. Ltd 1000
lumen white light LEDs (arranged in 3 sets of 5 diode arrays).
Figure S1: Structures of the photosensitizers (PS) tested in this study.
3NATURE CHEMISTRY | www.nature.com/naturechemistry
© 2015 Macmillan Publishers Limited. All rights reserved

4
1.2. Characterization
1H spectra were recorded on a Bruker DPX300, or Bruker AV(III)400 spectrometer at 300
MHz and 400 MHz respectively. 13C spectra were recorded on a Bruker AV(III)500
spectrometer at 125 MHz respectively. The analysis was carried out using ACD/SpecManager
software version 12 and spectra were referenced to CDCl3 (7.27 ppm for 1H-NMR, 77.00 ppm
for 13C-NMR), C6D6 (7.16 ppm for 1H-NMR) or Acetone-d6 (2.05 ppm for 1H-NMR). The pH
measurements were carried out using a Metrohm 785 DMP Trinito pH meter. Mass
spectrometry analyses were performed using Bruker microTOF equipped with an Electron
Spray Ionization method and with a Bruker Ultraflex III equipped with a Matrix Laser
Desorption Ionization source.
1.3. Spectroscopic measurements
Diffuse reflectance measurements of the immobilized porphyrins were acquired using an
Ocean Optics USB2000+ UV-vis spectrometer, equipped with an Ocean Optics UV-Vis-NIR
light source (DT-MINI-2-GS) fitted with a fiber optic (part number P200-2-VIS-NIR).
Spectra were collected using Ocean Optics SpectraSuite (version 6.1) against a silicon zero
diffraction plate. The ethyl acetate solution spectra of the protonated porphyrins were
recorded using a Perkin Elmer Lambda 25 UV-visible spectrometer.
Singlet oxygen emission measurements were carried out on air-equilibrated solutions of
CH2Cl2, EtOH, and 1:1 mixtures of EtOH:H2O. Oxygenation of solutions with photosensitizer
was found to increase the emission intensity while negligibly affecting the excited state
lifetimes. Additional oxygenation of the samples containing 3 was not performed in order to
maintain better control over the concentration of each solution. The sample was held in a 10
mm quartz cuvette with the concentration of photosensitizer adjusted to give an absorbance at
4NATURE CHEMISTRY | www.nature.com/naturechemistry
© 2015 Macmillan Publishers Limited. All rights reserved
5
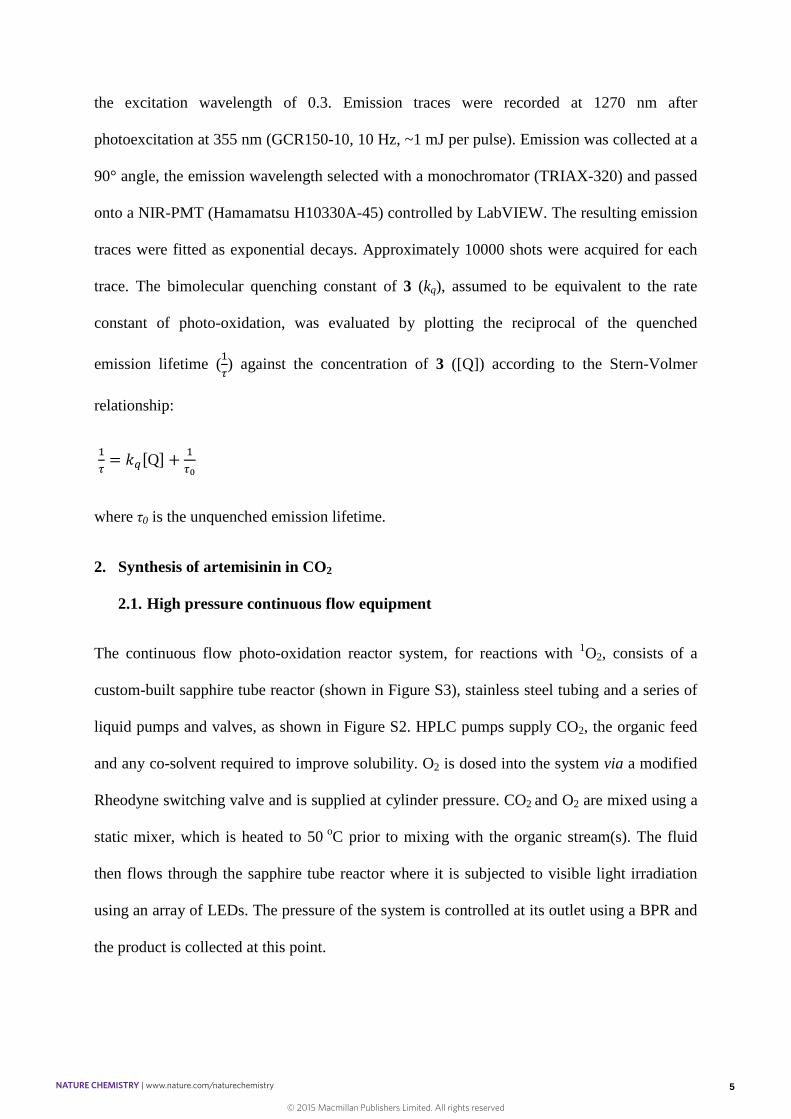
the excitation wavelength of 0.3. Emission traces were recorded at 1270 nm after
photoexcitation at 355 nm (GCR150-10, 10 Hz, ~1 mJ per pulse). Emission was collected at a
90° angle, the emission wavelength selected with a monochromator (TRIAX-320) and passed
onto a NIR-PMT (Hamamatsu H10330A-45) controlled by LabVIEW. The resulting emission
traces were fitted as exponential decays. Approximately 10000 shots were acquired for each
trace. The bimolecular quenching constant of 3 (kq), assumed to be equivalent to the rate
constant of photo-oxidation, was evaluated by plotting the reciprocal of the quenched
emission lifetime (ଵ
ఛ) against the concentration of 3 ([Q]) according to the Stern-Volmer
relationship:
ଵ
ఛ= [Q] +
ଵ
ఛబ
where τ0 is the unquenched emission lifetime.
2. Synthesis of artemisinin in CO2
2.1. High pressure continuous flow equipment
The continuous flow photo-oxidation reactor system, for reactions with 1O2, consists of a
custom-built sapphire tube reactor (shown in Figure S3), stainless steel tubing and a series of
liquid pumps and valves, as shown in Figure S2. HPLC pumps supply CO2, the organic feed
and any co-solvent required to improve solubility. O2 is dosed into the system via a modified
Rheodyne switching valve and is supplied at cylinder pressure. CO2 and O2 are mixed using a
static mixer, which is heated to 50 oC prior to mixing with the organic stream(s). The fluid
then flows through the sapphire tube reactor where it is subjected to visible light irradiation
using an array of LEDs. The pressure of the system is controlled at its outlet using a BPR and
the product is collected at this point.
5NATURE CHEMISTRY | www.nature.com/naturechemistry
© 2015 Macmillan Publishers Limited. All rights reserved

6
PP
T
T
T
T
P P
BPR
R
Org 1
Org 2
CO2 O2
Rheodyne
P:CO2
P:Org 1
P: Org 2
M1
M2
T
T
P
P
1/16" stainless steel tube
1/16" K-type thermocouple
Pressure transducer
Heater controller
Temperature trip
Pressure trip
Picologger
Aluminium heating block
Coolant
T1 T2 T3 T4
T5
T6
LEDs
Product
Figure S2: Schematic of the CO2 reactor used. CO2 is delivered by P:CO2 (a JascoTM PU-1580-CO2 HPLC
pump), O2 is added using a modified Rheodyne dosage unit. Org 1: 3 is dissolved in the required co-solvent (+
PS and acid as required) which is pumped by P:Org 1 (a JascoTM PU-980 HPLC pump); Org 2: co-solvent
added in systems which are subject to blockage pumped via P:Org 2 (a JascoTM PU-980 HPLC pump); M1 &
M2: static mixers (stainless steel tubing ¼” o.d., 75 mm in length packed with sand and heated via temperature
controlled aluminium blocks); R: sapphire tube reactor which is temperature controlled via a circulating
water/ethylene glycol bath (Grant LTD6/20); LEDs: light source (3 × 5 × Citizen Electronics Co. Ltd CL-L233-
C13 N mounted on water cooled stainless steel blocks); BPR: back pressure regulator (model JascoTM BP 1580-
81); TN: (where N is a number) manual valve. Where a heterogeneous acid was required, a stainless steel tube
(1/4” o.d., 75 mm length) packed with acid was inserted following R and prior to P:Org 2 and the temperature
was controlled via aluminium heating blocks. Picologger monitors system and oxygen pressures, internal
reactor, mixers and cooling bath temperatures.
6NATURE CHEMISTRY | www.nature.com/naturechemistry
© 2015 Macmillan Publishers Limited. All rights reserved

7
Figure S3: Picture of the sapphire tube reactors used for high pressure photo-oxidations. A sapphire tube (Saint-
Gobain Crystals, 10 mm o.d., 120 or 240 mm long, 1 mm wall thickness) is held in place and sealed with two
EPDM O-rings. A LexanTM polycarbonate tube surrounds the sapphire tube and coolant is flowed in the space
between the two tubes from bottom to top. The high pressure fluid enters the sapphire tube through the top of the
reactor and leaves through the bottom.
7NATURE CHEMISTRY | www.nature.com/naturechemistry
© 2015 Macmillan Publishers Limited. All rights reserved

8
2.2. Photo-oxidation of dihydroartemisinic acid in CO2
Scheme S1: Photo-oxidation of 3.
10 g of 3 (42.4 mmol) was dissolved in ethyl acetate (75 mL) together with the desired
amount of TPFPP. This solution was then pumped and mixed into a flowing stream of CO2/O2
prior to irradiation in the sapphire tube photoreactor. The effect of flow rate, oxygen and
TPFPP concentrations on the conversion of 3 was investigated. For all experiments, the
system pressure was maintained at 180 bar and the concentration of 3 in the high pressure
system was 0.10 M. Initially, the photoreactor temperature was maintained at 40 oC, to ensure
supercritical conditions, but it was found that lowering the temperature to 5 oC was beneficial
in terms of selectivity towards the desired product 4. The crude product, collected directly
following depressurization, was dried under vacuum and analyzed by 1H-NMR, with CDCl3
as the solvent.
8NATURE CHEMISTRY | www.nature.com/naturechemistry
© 2015 Macmillan Publishers Limited. All rights reserved
9
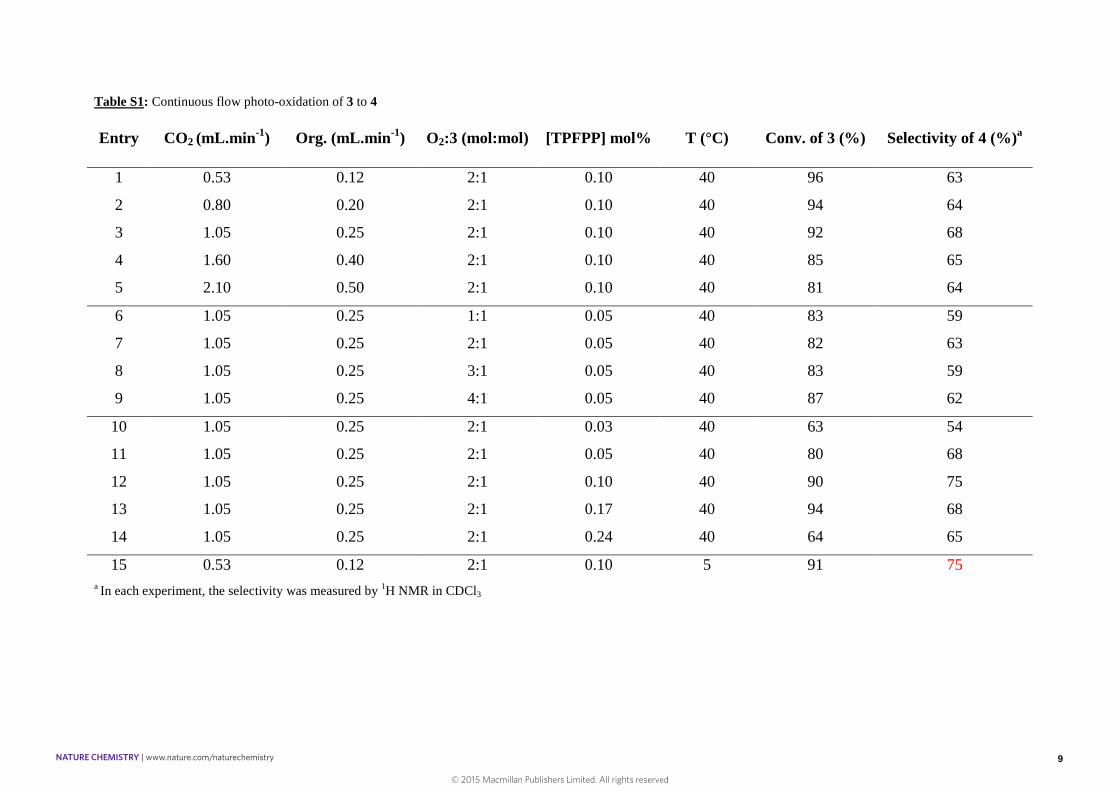
Table S1: Continuous flow photo-oxidation of 3 to 4
Entry CO2 (mL.min-1) Org. (mL.min-1) O2:3 (mol:mol) [TPFPP] mol% T (°C) Conv. of 3 (%) Selectivity of 4 (%)a
1 0.53 0.12 2:1 0.10 40 96 63
2 0.80 0.20 2:1 0.10 40 94 64
3 1.05 0.25 2:1 0.10 40 92 68
4 1.60 0.40 2:1 0.10 40 85 65
5 2.10 0.50 2:1 0.10 40 81 64
6 1.05 0.25 1:1 0.05 40 83 59
7 1.05 0.25 2:1 0.05 40 82 63
8 1.05 0.25 3:1 0.05 40 83 59
9 1.05 0.25 4:1 0.05 40 87 62
10 1.05 0.25 2:1 0.03 40 63 54
11 1.05 0.25 2:1 0.05 40 80 68
12 1.05 0.25 2:1 0.10 40 90 75
13 1.05 0.25 2:1 0.17 40 94 68
14 1.05 0.25 2:1 0.24 40 64 65
15 0.53 0.12 2:1 0.10 5 91 75a In each experiment, the selectivity was measured by 1H NMR in CDCl3
9NATURE CHEMISTRY | www.nature.com/naturechemistry
© 2015 Macmillan Publishers Limited. All rights reserved
10
2.3. Synthesis of artemisinin from dihydroartemisinic acid in CO2
For the synthesis of artemisinin (1) from 3 using the high pressure CO2 system, three different
strategies were explored: Methods A, B and C as described below. For all experiments, the
photo-oxidation was carried out in the sapphire tube reactor (figure S3), the system pressure
was maintained at 180 bar and the temperature was 5 oC and the O2:3 molar ratio was 2:1.
Samples were analyzed by 1H NMR in CDCl3 after removal of the volatiles under reduced
pressure. The results are summarized in Table S2 below.
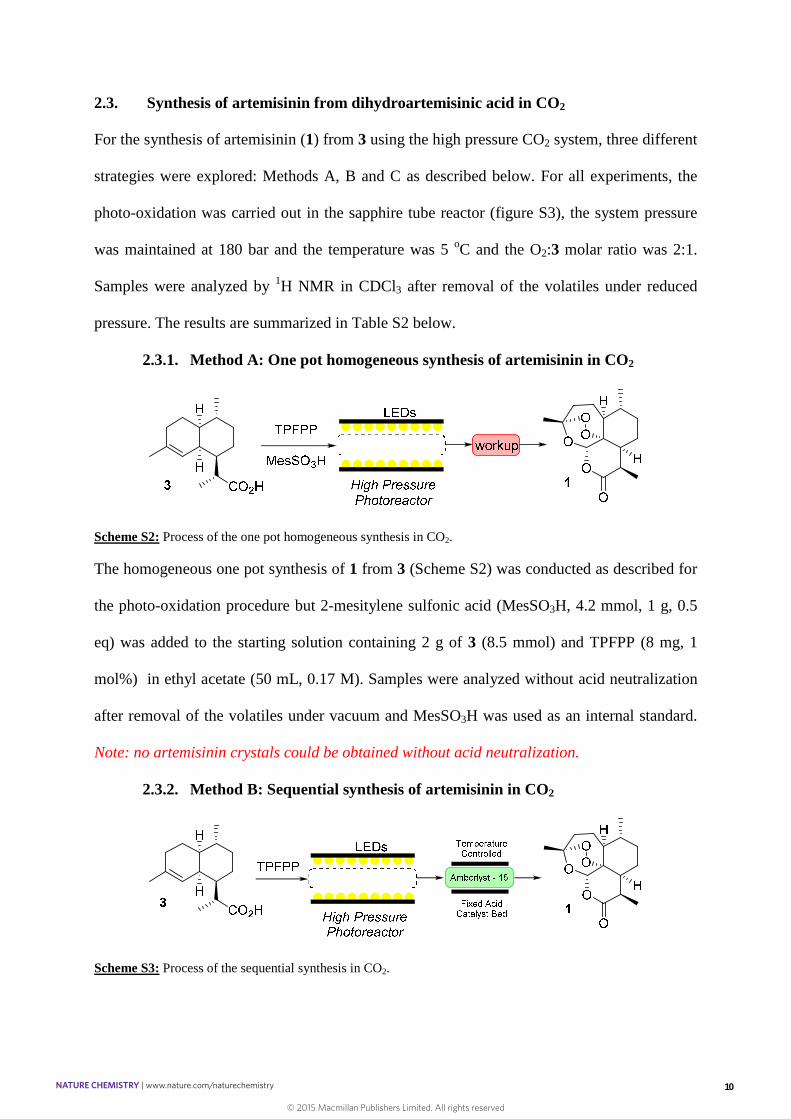
2.3.1. Method A: One pot homogeneous synthesis of artemisinin in CO2
Scheme S2: Process of the one pot homogeneous synthesis in CO2.
The homogeneous one pot synthesis of 1 from 3 (Scheme S2) was conducted as described for
the photo-oxidation procedure but 2-mesitylene sulfonic acid (MesSO3H, 4.2 mmol, 1 g, 0.5
eq) was added to the starting solution containing 2 g of 3 (8.5 mmol) and TPFPP (8 mg, 1
mol%) in ethyl acetate (50 mL, 0.17 M). Samples were analyzed without acid neutralization
after removal of the volatiles under vacuum and MesSO3H was used as an internal standard.
Note: no artemisinin crystals could be obtained without acid neutralization.
2.3.2. Method B: Sequential synthesis of artemisinin in CO2
Scheme S3: Process of the sequential synthesis in CO2.
10NATURE CHEMISTRY | www.nature.com/naturechemistry
© 2015 Macmillan Publishers Limited. All rights reserved

11
The sequential homogeneous/heterogeneous synthesis of 1 from 3 (Scheme S3) was
conducted as described for the photo-oxidation procedure but a second reactor (stainless steel
tubing, ¼” o.d., 75 mm length), packed with amberlyst-15 (dry, beads, ca. 1 g), was added
downstream. The temperature of this reactor was maintained via heating blocks at 25 OC. A
starting solution of 3 (4 g, 17 mmol) and TPFPP (16 mg, 1 mol%) in ethyl acetate (30 mL,
0.5M) was used.
2.3.3. Method C: One pot heterogeneous synthesis of artemisinin in CO2
Scheme S4: Process of the one pot heterogeneous synthesis in CO2
1 g of 3 (4.2 mmol) was dissolved in either ethyl acetate (8 mL) or toluene (8 mL) and the
solution was pumped at 0.125 mL.min-1 into a CO2/O2 stream (0.525 mL.min-1, 2.3% O2) at
180 bar pressure. The molar ratio of O2:3 was maintained at 5:1. The reaction stream was
passed through the photoreactor containing a porphyrin immobilized on Amberlyst-15 (see
below). In order to realize full conversion of 3, the product solution following
depressurization was collected and re-passed through the reactor multiple times. The results
are presented in Table S2.
Preparation of porphyrins immobilized on Amberlyst-15
In an opened round bottom flask equipped with a magnetic stirrer, 100 mg of TPP or TPFPP
(0.16 or 0.10 mmol) was dissolved in EtOAc (50 mL) and added with Amberlyst-15 beads (3
g). The heterogeneous mixture was slowly agitated at room temperature for 24 h. The
resulting heterogeneous mixture was then filtered and washed with EtOAc (3 x 10 mL) to
11NATURE CHEMISTRY | www.nature.com/naturechemistry
© 2015 Macmillan Publishers Limited. All rights reserved

12
yield green beads that were dried under vacuum. Loading of TPFPP was calculated to be 18
mg.g-1. Loading of TPP was calculated to be 17 mg.g-1.
Characterization of catalyst systems
The porphyrin-Amberlyst-15 systems were characterized by UV-visible absorption
spectroscopy and spectra were compared to the protonated 2-mesitylenesulfonate salts (see
Figure S4). The diffuse reflectance spectra of TPP and TPFPP bound to Amberlyst show
absorption peaks at ca. 660 nm and 575/630 nm respectively, which is indicative of the
protonated porphyrin species, as indicated by the solution spectra. Similarly, major bands at
512 nm and 504 nm in the solution spectra of neutral TPP and TPFPP respectively are absent
in the corresponding diffuse reflectance spectra.
Figure S4: Anchoring of photosensitizers investigated by UV-visible spectroscopy. Blue: The diffuse
reflectance spectra obtained for TPP (A) and TPFPP (B) immobilized on Amberlyst-15, with applied Kubelka
Munk correction (offset). Red: The solution spectrum of protonated TPP (A) and TPFPP (B) at a concentration
of 1.5 x 10⁻⁴ molL-1 recorded in ethyl acetate with a path length of 400 m. Black: The solution spectrum of
neutral TPP (A) and TPFPP (B) at a concentration of 1.5 x 10⁻⁴ molL-1 recorded in ethyl acetate with a path
length of 400 m.
12NATURE CHEMISTRY | www.nature.com/naturechemistry
© 2015 Macmillan Publishers Limited. All rights reserved

13
Figure S5: Picture of Amberlyst-15 and supported porphyrin systems, showing the differences in color.
13NATURE CHEMISTRY | www.nature.com/naturechemistry
© 2015 Macmillan Publishers Limited. All rights reserved

14
Table S2: Results for the one pot CO2 synthesis of artemisinin (the organic feed containing 3 is at a concentration of 0.5M, the concentrations in this table are calculated by
taking CO2 into account).
EntryCo-
SolventMethoda PS
CO2
(mL.min-1)
Org.
(mL.min-1)
[3]
(mol.L-3)Pass Conv (%) Yieldb (%)
Reactor
Blockage
1 EtOAc A TPFPP 1.05 0.25 0.1 - - - Yes
2 EtOAc A TPFPP 1.05 0.25 0.03 1 67 47c No
3 EtOAc A TPFPP 0.53 0.12 0.03 1 80 56c No
4 EtOAc B TPFPP 1.05 0.25 0.1 1 77 50 No
5 EtOAc C TPFPP 0.53 0.12 0.1 1 75 47 Yes
6d EtOAc C TPFPP 0.53 0.05 0.05 1 92 50 No
7 Toluene C TPFPP 0.53 0.12 0.1 1 50 33 No
8 Toluene C TPP 0.53 0.12 0.1 1 63 25 No
9 Toluene C TPP 0.53 0.12 0.1 2 82 39 No
10 Toluene C TPP 0.53 0.12 0.1 3 93 48 No
11 Toluene C TPP 0.53 0.12 0.1 4 98 51 No
12e Toluene C TPP 0.53 0.12 0.1 1 >98% 49 No
a In each experiment, the pressure was 180 bar with a concentration of O2 of 2 mol.%. The photoreactor temperature was 5 oC during operation. In the case of Methods A and
B, TPFPP was used as the homogeneous photosensitizer at a concentration of 0.1 mol%. b In each experiment, yields were measured by 1H NMR in CDCl3.c 2-
14NATURE CHEMISTRY | www.nature.com/naturechemistry
© 2015 Macmillan Publishers Limited. All rights reserved

15
mesitylenesulfonic acid was used as an internal standard . d Mesitylene was added following depressurization to the dried samples and used as an internal standard. d This
experiment used a higher CO2:3 ratio to prevent system blockage. 3 dissolved in EtOAc (0.5 M) was pumped at 0.05 mL.min-1 into the CO2/O2 stream (0.53 mL.min-1). e This
experiment was carried out using a double length reactor described in picture S3.
15NATURE CHEMISTRY | www.nature.com/naturechemistry
© 2015 Macmillan Publishers Limited. All rights reserved

16
Leaching measurements
UV-visible absorption spectra of the product solutions collected following reaction using the
relevant porphyrin-Amberlyst-15 system were recorded (Figure S7). In both cases, 16.8 g of
the crude product was dissolved in 10 ml of ethyl acetate. From these spectra, it can clearly be
seen that TPFPP leeches from the Amberlyst-15 support but TPP remains immobilized
throughout the experiment. It is interesting to note that the majority of leached porphyrin
exists in the free base form. Using Beer’s law, the leeching of TPFPP was approximated as
2.3 mg per 1 g of product formed. At a catalyst loading of 18 mg.g-1 this corresponds to
approximately 5% of photosensitizer lost per 1 g of product formed. Although no porphyrin
bands are visible for the TPP system (expected at 414 nm for the free base form) the
absorbance of the polymer byproduct was used to establish an upper limit of leeching of ca.
10 µg under the same conditions as for TPFPP. Taking catalyst loading into account, this
corresponds to a maximum of 0.2 % of photosensitizer lost per 1 g of product formed;
however, it should be noted that the actual amount of photosensitizer lost is likely to be
significantly lower.
400 500 600 7000.00
0.25
0.50
0.75
1.00
Abso
rban
ce
Wavelength / nm
Leeching from Amb-TPPLeeching from Amb-TPFPP
x10
Figure S6: UV-visible spectroscopy of crude products following flow experiments using the system of
photocatalyst bound to Amberlyst-15 measured at a pathlength of 1 cm. In both cases the same amount of
product was dissolved in ethyl acetate and measured at a pathlength of 1 cm. Red: The Amb-TPFPP system
(Entry 6 in Table S2). Black: The Amb-TPP system; the y-axis is multiplied by 10 for clarity (Entry 11 in Table
S2).
16NATURE CHEMISTRY | www.nature.com/naturechemistry
© 2015 Macmillan Publishers Limited. All rights reserved

17
3. Batch synthesis of artemisinin in aqueous mixtures
3.1. Equipment for carrying batch photo-oxidation experiments
Batch photo-oxidation reactions are carried out in a three-necked flask, equipped with a
magnetic stirrer, a reflux condenser. A thermometer and a gas inlet tube extend into the lower
half of the flask. The gas inlet tube is attached to the inlet tube of a gas-washing bottle which
serves as a safety trap to prevent liquid from being drawn into the oxygen source. The gas-
washing bottle is connected to a commercial cylinder of oxygen (BOC) and maintains a
continuous stream of gas. Photolysis is carried out with one or two (symmetrically positioned
on each side of the reactor) banks of LED lamps.
3.2. Temperature selectivity study of the Schenk ene reaction at 30 oC and at -10 oC
In a 2 necked round bottom flask, 3 (250 mg, 1.06 mmol) and a suitable photosensitizer (0.7
mg, 0.001 mmol) are dissolved in 20 mL of 4:1 ethanol:water. The reaction mixture is heated
to 30 oC using an oil-bath or cooled to -10 oC using a cooling bath. Internal reaction
temperature is monitored using a thermocouple. In case of heating, an additional reflux
condenser is added to prevent partial evaporation of the solvent. The solution is oxygenated
by continuous bubbling of O2 at atmospheric pressure. The flask is irradiated with LED lamps
for 6 hours. The conversion and selectivity to the desired isomer are monitored by 1H NMR
by taking regular aliquots concentrated under high vacuum.
17NATURE CHEMISTRY | www.nature.com/naturechemistry
© 2015 Macmillan Publishers Limited. All rights reserved
18
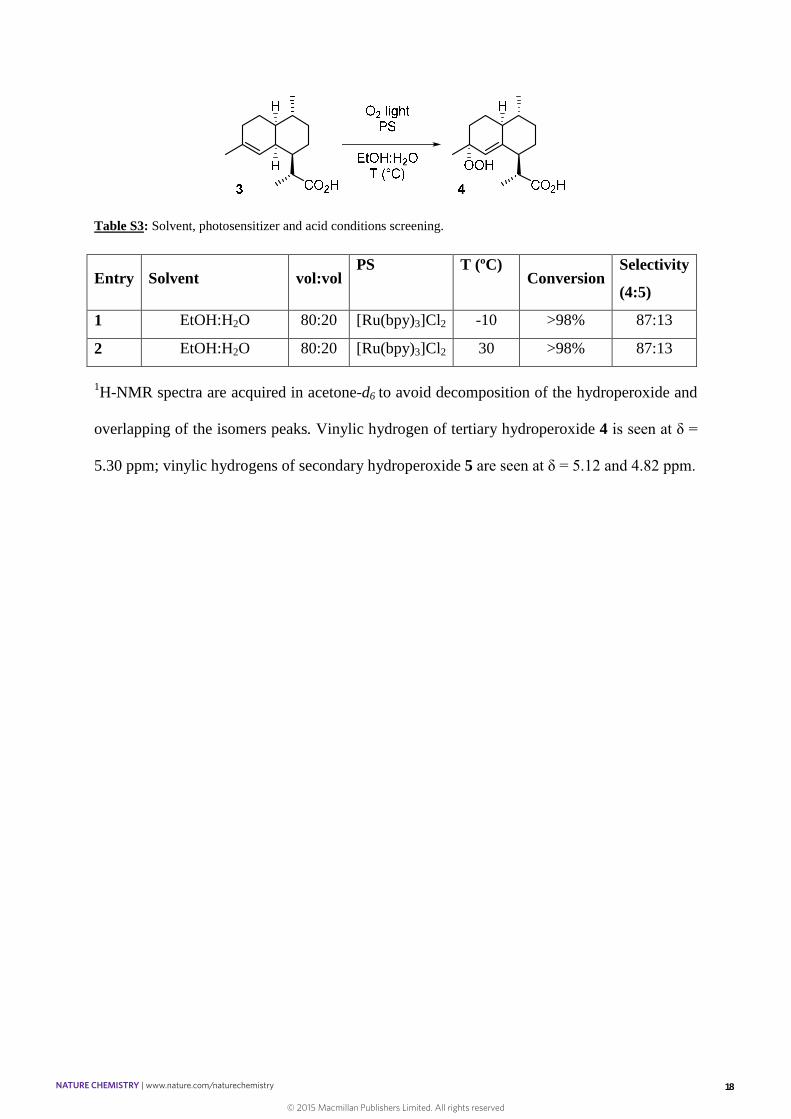
Table S3: Solvent, photosensitizer and acid conditions screening.
Entry Solvent vol:volPS T (ºC)
ConversionSelectivity
(4:5)
1 EtOH:H2O 80:20 [Ru(bpy)3]Cl2 -10 >98% 87:13
2 EtOH:H2O 80:20 [Ru(bpy)3]Cl2 30 >98% 87:13
1H-NMR spectra are acquired in acetone-d6 to avoid decomposition of the hydroperoxide and
overlapping of the isomers peaks. Vinylic hydrogen of tertiary hydroperoxide 4 is seen at δ =
5.30 ppm; vinylic hydrogens of secondary hydroperoxide 5 are seen at δ = 5.12 and 4.82 ppm.
18NATURE CHEMISTRY | www.nature.com/naturechemistry
© 2015 Macmillan Publishers Limited. All rights reserved

19
CO2H
OHO
H
HH
CO2H
H
HO
OH
H
HHH
A t 3 0 o C :
A t - 1 0 o C :
6.0 5.5 5.0 4.5 4.0Chemical Shift (ppm)
12.7687.24
5.5
7
5.3
65
.33
5.3
0
5.2
2 5.1
2
4.8
1
4.7
34
.70
6.0 5.5 5.0 4.5 4.0Chemical Shift (ppm)
13.4086.60
5.8
0
5.5
7
5.3
5 5.3
35
.30
5.1
2
4.8
2
4.7
34
.70
Figure S7: A zoomed in 1H NMR in acetone-d6 after photo-oxidation of 3 in ethanol:water mixtures at 30 and -
10 ºC showing the relevant vinylic H groups from the different isomers. The 2 isomers generated in reasonable
quantity (4 and 5) are highlighted in color.
19NATURE CHEMISTRY | www.nature.com/naturechemistry
© 2015 Macmillan Publishers Limited. All rights reserved
20
3.3. One pot batch procedure in dichloromethane (control experiment Table S4,
entry 1)
3 (250 mg, 1.06 mmol), biphenyl (163 mg, 1.06 mmol) and tetraphenylporphyrin (0.6 mg.
0.001 mmol) are dissolved in dichloromethane (50 mL). The reaction mixture is cooled down
to 0ºC in an ice-brine bath, trifluoroacetic acid (80 μL) is added dropwise under vigorous
stirring and O2 is slowly bubbled through the solution. The flask is irradiated with LED lamps
for 2 hours. The conversion is monitored by 1H NMR by taking regular aliquots and the
mixture is allowed to warm up to room temperature and O2 is kept bubbling continuously for
another 5 hours. After removal of the volatiles, conversion and selectivity to 1 is measured by
1H NMR in CDCl3 using biphenyl as an internal standard.
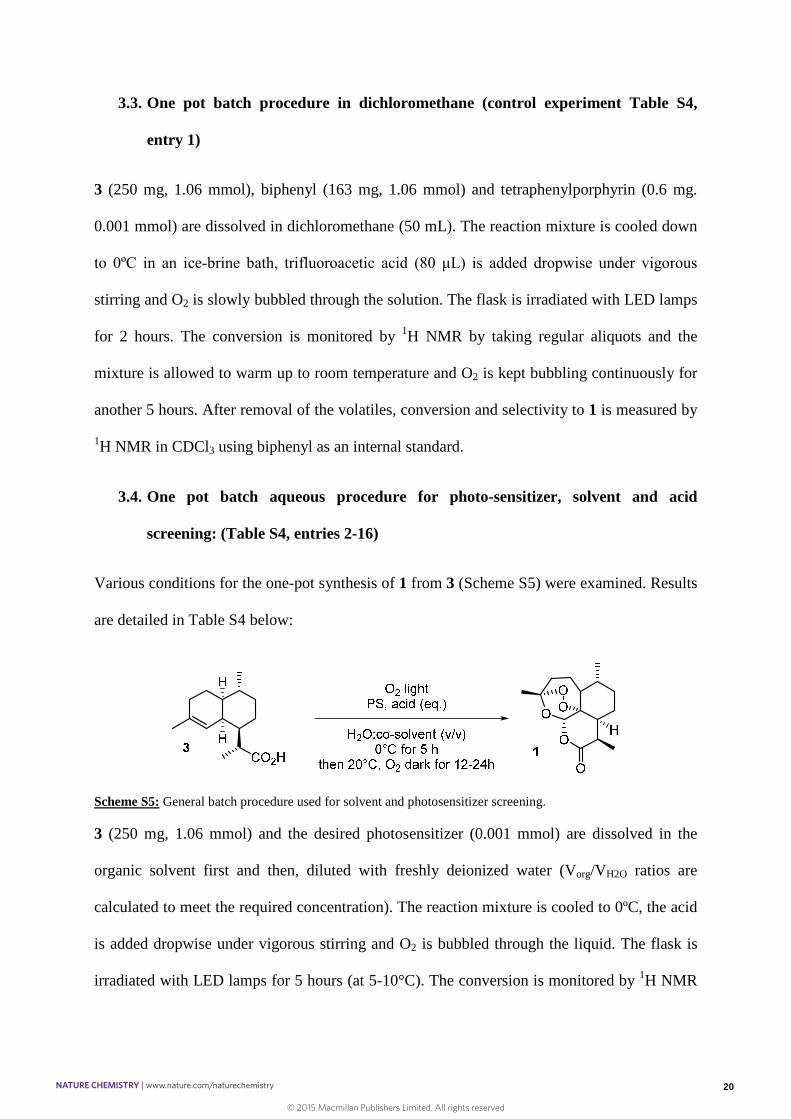
3.4. One pot batch aqueous procedure for photo-sensitizer, solvent and acid
screening: (Table S4, entries 2-16)
Various conditions for the one-pot synthesis of 1 from 3 (Scheme S5) were examined. Results
are detailed in Table S4 below:
Scheme S5: General batch procedure used for solvent and photosensitizer screening.
3 (250 mg, 1.06 mmol) and the desired photosensitizer (0.001 mmol) are dissolved in the
organic solvent first and then, diluted with freshly deionized water (Vorg/VH2O ratios are
calculated to meet the required concentration). The reaction mixture is cooled to 0ºC, the acid
is added dropwise under vigorous stirring and O2 is bubbled through the liquid. The flask is
irradiated with LED lamps for 5 hours (at 5-10°C). The conversion is monitored by 1H NMR
20NATURE CHEMISTRY | www.nature.com/naturechemistry
© 2015 Macmillan Publishers Limited. All rights reserved

21
by taking regular aliquots extracted with diethyl ether. Once the starting material is entirely
consumed, the mixture is allowed to warm to room temperature and O2 is kept bubbling
continuously for another 24 hours. The organics are extracted with diethyl ether (3 x 100 mL).
The organic layer is then washed with brine (100 mL) and dried over Na2SO4. After removal
of the volatiles, conversion and selectivity to 1 is measured by 1H NMR in CDCl3 by adding
147 μL of mesitylene as an internal standard.
21NATURE CHEMISTRY | www.nature.com/naturechemistry
© 2015 Macmillan Publishers Limited. All rights reserved

22
Table S4: Solvent, photosensitizer and acid conditions screening for the one-pot batch synthesis of artemisinin.
Entry Solvent vol:vol [3] mol.L-1 PS Temp (°C) Acid Eq.Conversion
(%)a
Yield
(%)a
1 DCM 100 2.1 x10⁻² TPP 10°C TFA 0.5 100 54
2 PEG:H2O 50:50 2.1 x 10⁻² RB 10°C TFA 0.5 0 0
3 THF:H2O 50:50 2.1 x10⁻² RB 10°C TFA 0.5 > 98 < 5
4 THF:H2O 60:40 5.3 x10⁻² RB 10°C TFA 6.3 13 53
5 THF:H2O 60:40 5.3 x10⁻² TPP 10°C TFA 0.5 98 56
6 EtOH:H2O 60:40 5.3 x10⁻² TPP 10°C TFA 0.5 0 0
7 EtOH:H2O 60:40 5.3 x10⁻² [Ru(bpy)3]Cl2 10°C TFA 0.5 > 98 50
8 EtOH:H2O 60:40 2.1 x10⁻²
[Ru(bpy)3]Cl210°C TFA 0.5 > 98 50
9 THF:H2O 60:40 5.3 x 10⁻²
[Ru(bpy)3]Cl20°C H3PO4
0.5 > 98 52
10 EtOH:H2O 60:40 5.3 x10⁻²
[Ru(bpy)3]Cl210°C TFA 1.0 > 98 55
11 THF:H2O 60:40 5.3 x10⁻²
[Ru(bpy)3]Cl2 10°C TFA 0.5 > 98 66
12 THF:H2O 60:40 5.3 x10⁻²
[Ru(bpy)3]Cl2 30°C TFA 0.5 > 98 59
22NATURE CHEMISTRY | www.nature.com/naturechemistry
© 2015 Macmillan Publishers Limited. All rights reserved

23
12 THF:H2O 60:40 5.3 x10⁻²
[Ru(bpy)3]Cl2 10°C TFA 6.3 > 98 58
13 EtOH:H2O 50:50 2.1 x10⁻² [Ru(bpy)3]Cl2 10°C TFA 1.0 > 98 43
14 EtOH:H2O 50:50 2.1 x10⁻² [Ru(bpy)3]Cl2 10°C H2SO4 1.0 > 98 40
15 EtOH:H2O 60:40 2.1 x 10⁻² [Ru(bpy)3]Cl2 10°C H2SO4 0.5 > 98 47
16b EtOH:H2O 80:20 1.7 x 10⁻¹ [Ru(bpy)3]Cl20°C H2SO4 0.5 > 98 50c
17 EtOH:H2O 80:20 5.3 x 10⁻² [Ru(bpy)3]Cl230°C H2SO4 0.5 > 98 39
18iPrOH:H2O 60:40 5.3 x 10⁻²
[Ru(bpy)3]Cl2 0°C TFA 0.5 > 98 59
19 THF:EtOH:H2O 5:75:20 2.1 x 10⁻²
[Ru(bpy)3]Cl2 10°C TFA 0.5 > 98 62
20 EtOH:H2O 60:40 2.1 x 10⁻² TMPyP 10°C H2SO4 0.5 > 98 53
a Conversion and yields are obtained by 1H NMR analysis. b Reaction is conducted on a 6 g (0.025 mol) scale using 10 mg of photosensitizer in 150 mL solvent volume.Photo-irradiation was carried out for 8 hours at 0°C. c Yield is measured by adding 3.53 mL (0.025 mol) of mesitylene after extraction and evaporation of the volatiles.
23NATURE CHEMISTRY | www.nature.com/naturechemistry
© 2015 Macmillan Publishers Limited. All rights reserved

24
3.5. Procedure for the gram scale batch artemisinin synthesis with recycling of the
aqueous phase
Scheme S6: Synthesis of 1 in batch using recycled acid and photocatalysts.
First reaction cycle:
The recycling of acid and photocatalyst is summarized in Scheme S6. A 500 mL three-necked
flask is charged with 3 (1.0 g, 4.24 mmol) which is dissolved in ethanol (120 mL, 8.3 g.L-1).
The solution is then diluted with freshly deionized water to a total volume of 200 mL (60/40
VEtOH/VH2O, 5.0 g.L-1). The hexahydrate of [Ru(bpy)3]Cl2 (10 mg, 0.013 mmol) is added and
the reaction mixture is immersed in an ice bath to allow cooling to 0°C (internal temperature).
Once the reaction temperature is reached, sulfuric acid (112 μL, 0.5 eq) is added dropwise
under vigorous stirring and the solution is oxygenated by continuous oxygen bubbling. The
mixture is irradiated for 9 hours after which the oxygenation is allowed to continue for 24
hours. The reaction is monitored by 1H NMR in CDCl3 by taking regular aliquots (0.3 mL).
After a total reaction time of 33 hours, ethanol is removed from the crude mixture by heating
to 50 °C under reduced pressure until a white precipitate is observed. The mixture is allowed
to cool to room temperature under air and to sit overnight. White crystalline needles of 1 are
recovered by filtration and washed with deionized water (40 mL) (see Figure S9). The crystals
are dried under vacuum and 1H NMR analysis revealed over 98% purity at this stage. More
product (m= 450 mg) can be isolated by fractional crystallization from the aqueous mother
liquor with the same purity.
24NATURE CHEMISTRY | www.nature.com/naturechemistry
© 2015 Macmillan Publishers Limited. All rights reserved

25
Second reaction cycle:
A new reaction batch is prepared to recycle the liquid phases, including ethanol, the combined
aqueous mother liquor and the washings. 3 (1.5 g) is dissolved in used and fresh ethanol (Vtot
= 180 mL). The mixture is diluted with the mother liquor (V = 120 mL) and the reaction is
carried out using the same set up as previously described. Irradiation is maintained for 10
hours and conversion is monitored by 1H NMR in CDCl3. After a total reaction time of 35
hours, the crude mixture is purified as described above, using 45 mL of deionized water (m=
690 mg of isolated product).
Third recycling:
3 (2.2 g) is dissolved with used and fresh ethanol (Vtot = 263 mL). The mixture is diluted with
the mother liquor (Vtot = 175 mL) and the reaction is carried out using the same set up as
previously described. Irradiation is maintained for 17 hours and conversion is monitored by
1H NMR. After a total reaction time of 48 hours, the crude mixture is purified as described
above, using 50 mL of deionized water (m = 954 mg).
Table S5: Recycling of the mother liquor
Aqueous SolutionH2O +H2SO4
H2O + H2SO4
+ Ru(bpy)3
motherliquor afterthe 1st pass
motherliquor afterthe 2nd pass
motherliquor afterthe 3rd pass
pH 1.58 1.51 1.63 1.92 2.25
Mass 450 mg 690 mg 954 mg
ArtemisininPurity (measured by
1H NMR)> 98 % > 98 % > 98 %
The isolated solid materials are combined (mtot= 2.094 g, 37% isolated yield). The 1H NMR
spectra is recorded in CDCl3 to observe exclusively the desired product 1, which is identical
to natural (+)-artemisinin: m.p. 155-6°C, (Sanofi product 158-9°C); [α]D25 +66.7 (c 1, CHCl3),
(Sanofi product +66.8 (c 1, CHCl3).
25NATURE CHEMISTRY | www.nature.com/naturechemistry
© 2015 Macmillan Publishers Limited. All rights reserved

26
Figure S8: Crude 1 isolated after filtration and aqueous washing. The water soluble photo and acid-catalysts
remain in the aqueous solution.
26NATURE CHEMISTRY | www.nature.com/naturechemistry
© 2015 Macmillan Publishers Limited. All rights reserved

27
4. Continuous flow experiments in aqueous mixtures
4.1. High Pressure Continuous Flow Equipment
Continuous flow experiments involving aqueous mixtures are performed using a modified
version of the high pressure photo-oxidation reactor and equipment as described above (see
Figures S3 and S10). The reactor system is operated in upflow mode such that the flow rates
of O2 and the solution of 3 are essentially independent and, in each experiment, the feed
solution is saturated with O2 prior to use. Glass balls (6 mm) are loaded into the sapphire tube
(Saint-Gobain crystals, 10 mm o.d., 120 mm long, 1 mm wall thickness) so as to reduce inner
filter effects upon irradiation by reducing the path length.
P
P
BPR
R
Subs O 2
Rheodyne
P: Subs
P
P
1/16" stainless steel tube
1/16" K-type thermocouple
Pressure transducer
Pressure trip
Picologger
Coolant
T2 T3T1
LEDs
Product
P
P
M
Figure S9: Reactor schematic for the flow synthesis of 1, using an aqueous mixture as the reaction solvent.
Subs: 3 dissolved in the aqueous solvent system, with [Ru(bpy)3]Cl2 as photosensitizer and H2SO4 as the
homogenous acid, which is pumped by P:Org 1 (a JascoTM PU-980 HPLC pump); O2 is added using a modified
Rheodyne dosage unit. M: micromixer (IMM, Mainz) to allow thorough mixing of the aqueous solution and O2;
R: sapphire tube reactor which is temperature controlled via a circulating water/ethylene glycol bath and filled
with glass balls (6 mm); LEDs: light source (3 × 5 × Citizen Electronics Co. Ltd CL-L233-C13 N mounted on
27NATURE CHEMISTRY | www.nature.com/naturechemistry
© 2015 Macmillan Publishers Limited. All rights reserved

28
water cooled stainless steel blocks); BPR: back pressure regulator (model JascoTM BP 1580-81); TN: (where N
is a number) manual valve.
4.2. Adjustments of the reaction parameters for photo-oxygenation
Various conditions for the photo-oxidation of 3 to 1 are examined (Scheme S7). The relevant
results are detailed in Table S5.
Scheme S7: General procedure used for solvent and photosensitizer optimization.
3 is dissolved in the organic solvent first and the solution is diluted with freshly deionized
water (Vorg/VH2O ratio are calculated to meet the required concentration). [Ru(bpy)3]Cl2 and
H2SO4 (> 95%, 0.56 µL per mL of solution) are then added to the mixture. This solution is
subsequently pumped and mixed with O2 in a micro mixer M (Figure S10), and irradiated in
the photoreactor at 5 oC. The product is collected at the outlet of the BPR and analyzed with
no further work up. To calculate reaction conversion, 1 mL of the product solution is collected
directly from the photoreactor, the solvent is removed under vacuum and 1 equivalent of
mesitylene is added prior to obtaining the 1H-NMR spectrum. The conversion of 3 is obtained
relative to the relevant peak corresponding to mesitylene and the results are presented in
Table S5.
To calculate the yields of 1, aliquots (1 mL) are collected after the photoreactor and allowed
to warm up to room temperature under air for an additional 24 hours. Then, the solvent is
removed under vacuum and an equivalent of mesitylene is added prior to analysis by 1H-
NMR in CDCl3. Additional experiments have been conducted using THF as a co-solvent. For
28NATURE CHEMISTRY | www.nature.com/naturechemistry
© 2015 Macmillan Publishers Limited. All rights reserved

29
experiment entry 32 Table S5, the stream was collected from the photoreactor in a stainless
steel autoclave at 10 bar O2 for ca. 16 hours.
29NATURE CHEMISTRY | www.nature.com/naturechemistry
© 2015 Macmillan Publishers Limited. All rights reserved

30
Table S6: results for the flow synthesis of artemisinin in aqueous mixtures
Entry Solvent Solvent
Ratio
vol:vol
[3] mol.L-1 [PS] mol.L-1 Pressure
(bar)
Flow rate
mL.min-1
Conversion of 3
NMR (%)
Yield of 1
NMR (%)
1
EtOH:H2O 60:40 0.02 1.0 x 10⁻⁴ 1
0.25 99 N/A
2 0.50 93
3 2.00 69
4
EtOH:H2O 60:40 0.02 2.0 x 10⁻⁴ 1
0.25 99 38
5 0.50 96
6 1.00 80
7 2.00 69
8
EtOH:H2O 60:40 0.02 1.0 x 10⁻⁴ 10
0.50 100 28
9 1.00 96
10 2.00 90
11 4.00 68
12
EtOH:H2O 80:20 0.02 1.0 x 10⁻⁴ 1
0.25 96 29
13 0.50 90
14 1.00 84
15 2.00 80
16 4.00 38
17
EtOH:H2O 80:20 0.04 1.0 x 10⁻⁴ 1
0.25 94 23
18 0.50 67
19 1.00 61
20 2.00 43
21 4.00 33
22 0.25 98 21
23 0.50 98
30NATURE CHEMISTRY | www.nature.com/naturechemistry
© 2015 Macmillan Publishers Limited. All rights reserved

31
24 EtOH:H2O 80:20 0.04 1.0 x 10⁻⁴ 10 1.00 93
25 2.00 77
26 4.00 56
27
EtOH:H2O:THF 75:20:5 0.02 1.0 x 10⁻⁴ 10
0.25 99 46
28 0.50 98
29 1.00 96
30 2.00 92
31 4.00 54
For the following experiment, the sample was left under a 10 bar pressure of oxygen for a further 16 hours, in a stainless steel vessel, prior to
analysis
32 EtOH:H2O:THF 75:20:5 0.02 1.0 x 10⁻⁴ 10 0.25 99 16
33 THF:H2O 60:40 0.21 1.0 x 10⁻⁴ 1 0.12 98 38
0.25 92
0.50 87
34 THF:H2O 60:40 0.21 1.0 x 10⁻⁴ 10 0.12 98 36
0.25 98
0.50 90
a Conversion and yields are obtained by 1H NMR in CDCl3 in comparison to mesitylene as an internal standard
31NATURE CHEMISTRY | www.nature.com/naturechemistry
© 2015 Macmillan Publishers Limited. All rights reserved

32
5. Green Metrics Calculations
The E-Factors presented were calculated using Sheldon's approach,39 who defined the E-
Factor as the ratio of the mass of waste produced over the mass of product obtained (equation
1). The side-products (SP) produced are assumed to possess the same molecular weight as the
starting material (SM).
�ܧ =ݎݐ�ݏݏܯ ݐݏݓ�
ܯ �ݏݏ ݎ� ݑ ݐ(1)
Separate E-Factor values, including (E factor 1) or excluding (E factor 2) the mass of the
reaction solvent, are calculated. For all processes the masses of components of the as-
performed reactions were initially determined and then normalised to 1 kg of artemisinin
product. These are summarised in Table S7.
1. In the Sanofi process, the calculated values include the mass of waste obtained from
the activation step and the photo-oxygenation step. The mass of the side-product was
calculated as (SP) = (SM)/(1 − ݕ ). The data have been obtained from
reference 10.
- For the activation step: we take into account the masses of HCl, EtOH and CO2
generated as well as the base (K2CO3) used.
- For the photo-oxygenation step: we take into account the mass of acid (TFA),
photocatalyst (TPP) and base (Na2CO3).
- The mass of solvent (DCM) calculated includes both steps as this is a one pot
process. Recrystallization solvents (Heptane and EtOH) and charcoal used for
purification are also taken into account.
32NATURE CHEMISTRY | www.nature.com/naturechemistry
© 2015 Macmillan Publishers Limited. All rights reserved

33
Scheme S8: E-Factor calculations for the Sanofi process.
2. In our processes, namely the heterogeneous bi-functional catalysis in liquid CO2
(strategy 1) and the binary aqueous solvent system (strategy 2), the calculated values
include the mass of waste obtained from the photo-oxygenation step. This takes into
account the amounts of acid catalyst (solid or homogeneous), the organic solvents and
the photocatalysts (TPP or Ru(bpy)3Cl2). As above, the masses of the side-products
have been calculated as (SP) = (SM)/(1 − ݕ ).
- The CO2 process values have been obtained from table S2 entry 11 (short reactor)
and entry 12 (long reactor) in Section 4.5 in the supplementary information.
- The values for the EtOH/H2O processes have been obtained from the reaction
described in Section 4.5 in the supplementary information. For the process
involving three cycles we have considered the total amount of product and waste
produced over all cycles. The values for the THF/H2O process have been obtained
from Entry 11, Table S4. In this experiment, the isolated yield is estimated.
33NATURE CHEMISTRY | www.nature.com/naturechemistry
© 2015 Macmillan Publishers Limited. All rights reserved
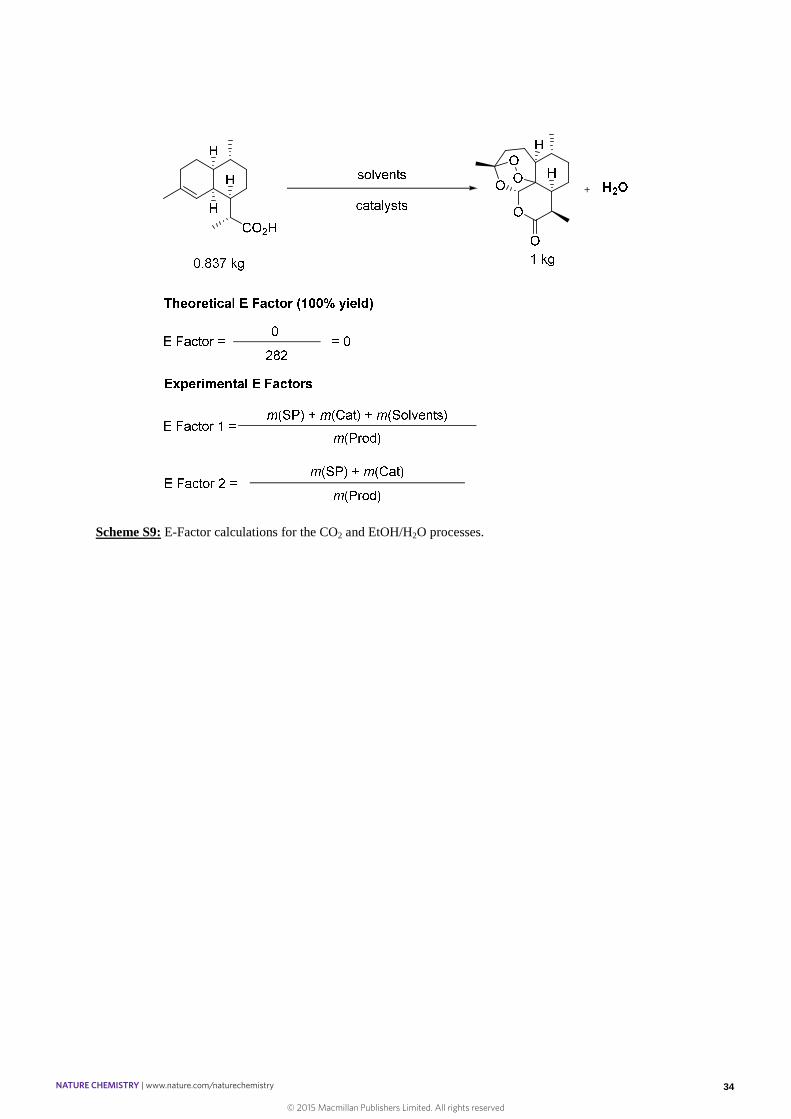
34
Scheme S9: E-Factor calculations for the CO2 and EtOH/H2O processes.
34NATURE CHEMISTRY | www.nature.com/naturechemistry
© 2015 Macmillan Publishers Limited. All rights reserved
35
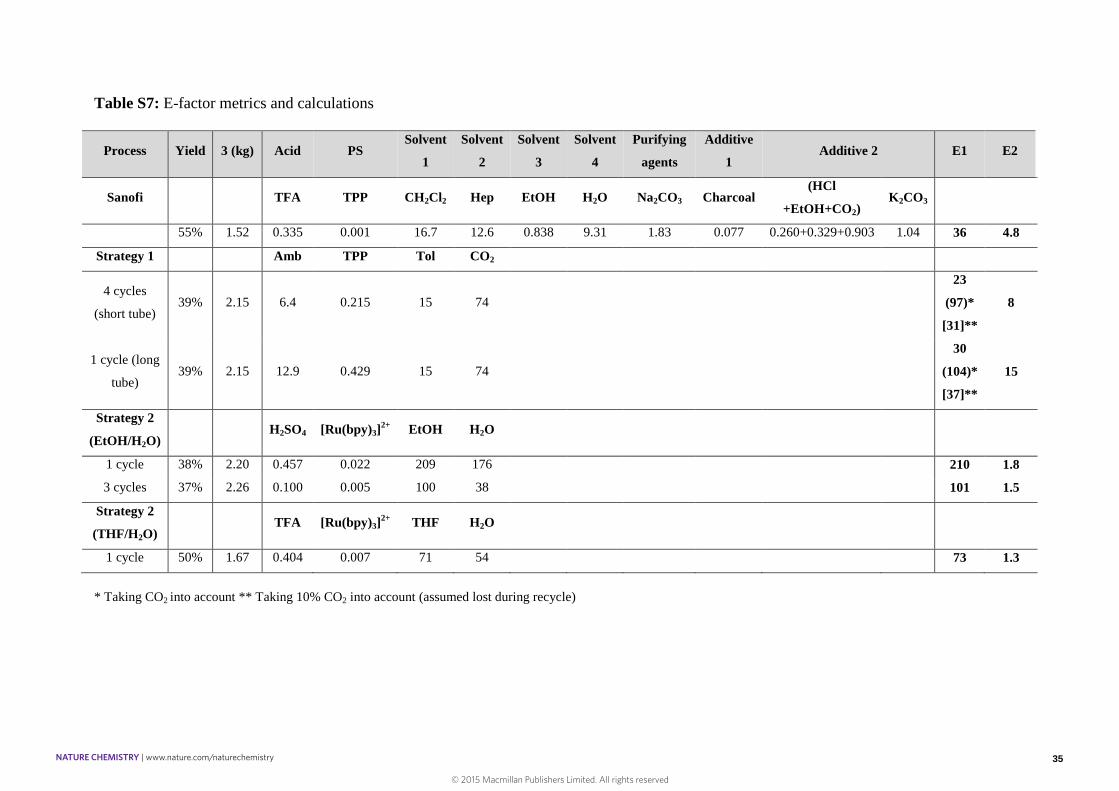
Table S7: E-factor metrics and calculations
Process Yield 3 (kg) Acid PSSolvent
1
Solvent
2
Solvent
3
Solvent
4
Purifying
agents
Additive
1Additive 2 E1 E2
Sanofi TFA TPP CH2Cl2 Hep EtOH H2O Na2CO3 Charcoal(HCl
+EtOH+CO2)K2CO3
55% 1.52 0.335 0.001 16.7 12.6 0.838 9.31 1.83 0.077 0.260+0.329+0.903 1.04 36 4.8
Strategy 1 Amb TPP Tol CO2
4 cycles
(short tube)39% 2.15 6.4 0.215 15 74
23
(97)*
[31]**
8
1 cycle (long
tube)39% 2.15 12.9 0.429 15 74
30
(104)*
[37]**
15
Strategy 2
(EtOH/H2O)H2SO4 [Ru(bpy)3]
2+ EtOH H2O
1 cycle 38% 2.20 0.457 0.022 209 176 210 1.8
3 cycles 37% 2.26 0.100 0.005 100 38 101 1.5
Strategy 2
(THF/H2O)TFA [Ru(bpy)3]
2+ THF H2O
1 cycle 50% 1.67 0.404 0.007 71 54 73 1.3
* Taking CO2 into account ** Taking 10% CO2 into account (assumed lost during recycle)
35NATURE CHEMISTRY | www.nature.com/naturechemistry
© 2015 Macmillan Publishers Limited. All rights reserved
36
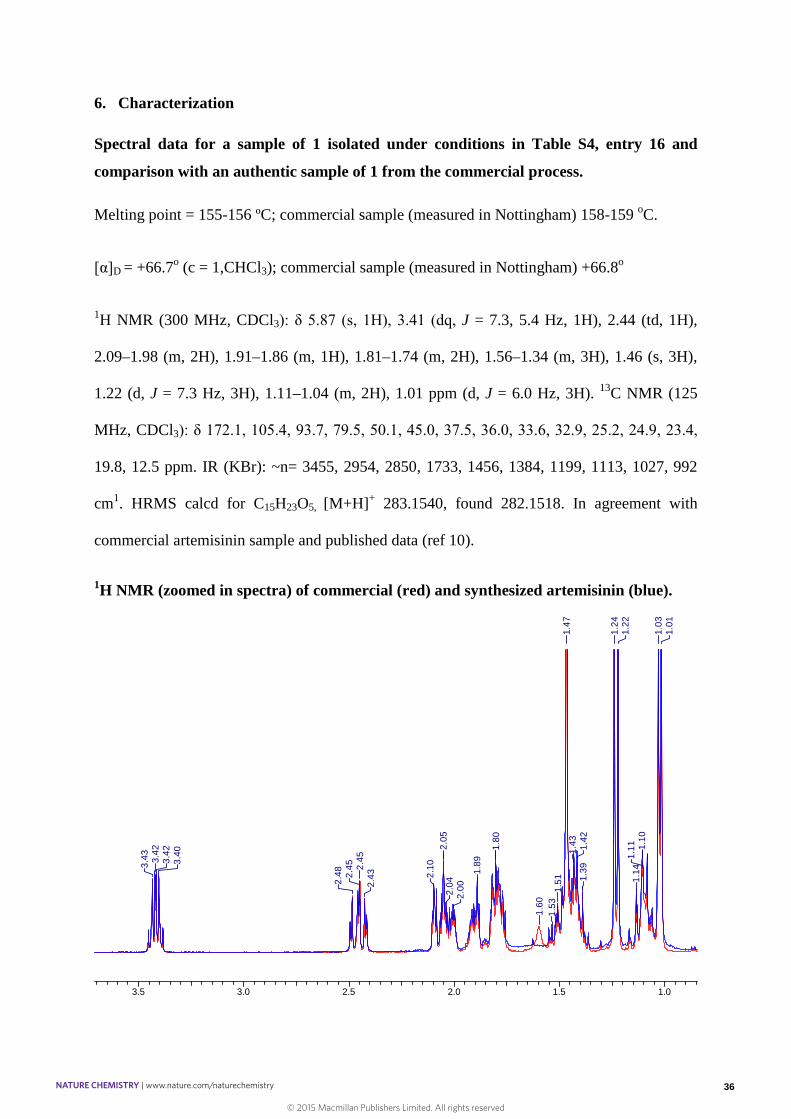
6. Characterization
Spectral data for a sample of 1 isolated under conditions in Table S4, entry 16 and
comparison with an authentic sample of 1 from the commercial process.
Melting point = 155-156 ºC; commercial sample (measured in Nottingham) 158-159 oC.
[α]D = +66.7o (c = 1,CHCl3); commercial sample (measured in Nottingham) +66.8o
1H NMR (300 MHz, CDCl3): δ 5.87 (s, 1H), 3.41 (dq, J = 7.3, 5.4 Hz, 1H), 2.44 (td, 1H),
2.09–1.98 (m, 2H), 1.91–1.86 (m, 1H), 1.81–1.74 (m, 2H), 1.56–1.34 (m, 3H), 1.46 (s, 3H),
1.22 (d, J = 7.3 Hz, 3H), 1.11–1.04 (m, 2H), 1.01 ppm (d, J = 6.0 Hz, 3H). 13C NMR (125
MHz, CDCl3): δ 172.1, 105.4, 93.7, 79.5, 50.1, 45.0, 37.5, 36.0, 33.6, 32.9, 25.2, 24.9, 23.4,
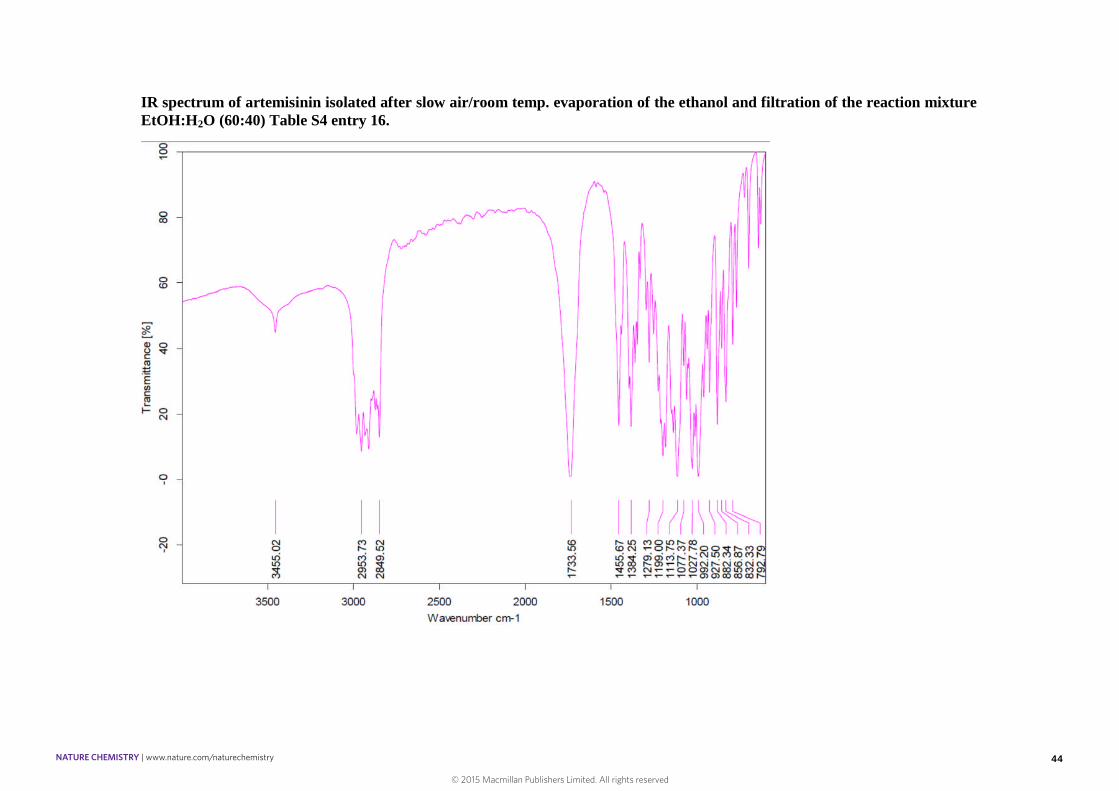
19.8, 12.5 ppm. IR (KBr): ~n= 3455, 2954, 2850, 1733, 1456, 1384, 1199, 1113, 1027, 992
cm1. HRMS calcd for C15H23O5, [M+H]+ 283.1540, found 282.1518. In agreement with
commercial artemisinin sample and published data (ref 10).
1H NMR (zoomed in spectra) of commercial (red) and synthesized artemisinin (blue).
3.5 3.0 2.5 2.0 1.5 1.0
3.4
33
.42
3.4
23
.40
2.4
82
.45
2.4
52
.43 2.1
0
2.0
52
.04
2.0
0
1.8
9
1.8
0
1.6
0
1.5
31
.51
1.4
71
.43
1.4
21
.39
1.2
41
.22
1.1
41
.11 1.1
0
1.0
31
.01
36NATURE CHEMISTRY | www.nature.com/naturechemistry
© 2015 Macmillan Publishers Limited. All rights reserved

37
The same 1H NMR spectra but with greater zoom of commercial (1) and synthesizedartemisinin (2).
3.0 2.5 2.0 1.5 1.0
4.962.946.001.910.971.980.970.94
3.4
2 3.4
13
.40
3.3
9
2.4
72
.44 2.4
4 2.4
32
.41
2.0
8
2.0
4
1.8
8
1.8
01
.79
1.7
8 1.7
81
.77
1.7
71
.76
1.4
91
.47
1.4
51
.42
1.4
01
.37
1.2
21
.21
1.1
21
.091
.09
1.0
21
.00
3.0 2.5 2.0 1.5 1.0
5.032.986.002.031.021.980.950.91
3.4
2 3.4
13
.40
3.3
9
2.4
7 2.4
4 2.4
4 2.4
3
2.0
8
2.0
4
1.8
8
1.8
11
.79
1.7
81
.78
1.7
71
.76
1.4
71
.45
1.4
21
.40
1.3
8
1.2
31
.21
1.1
21
.09 1
.09
1.0
21
.00
Commercial artemisinin (1)
Nottingham artemisinin (2)
37NATURE CHEMISTRY | www.nature.com/naturechemistry
© 2015 Macmillan Publishers Limited. All rights reserved

38
The full range of these 1H NMR spectra of commercial and synthesized artemisinin.
38NATURE CHEMISTRY | www.nature.com/naturechemistry
© 2015 Macmillan Publishers Limited. All rights reserved

39
Crude 1H NMR after removal of toluene from the fourth pass the continuous flow synthesis of 1 in CO2, as shown in Table S2,entry 11. Mesitylene is used as an internal standard (1.0 eq.).
9 8 7 6 5 4 3 2 1 0Chemical Shift (ppm)
0.510.513.00
0.8
5
0.8
70.8
9
0.9
11.0
1
1.0
21.2
2
1.2
41.4
11.4
61.7
8
1.7
9
1.8
1
2.0
4
2.4
5
2.4
8
2.4
9
3.3
83.4
0
3.4
1
3.4
2
3.4
3
3.4
5
3.5
4
4.8
6
4.9
3
5.0
2
5.0
5
5.7
15.8
7
6.8
2
7.2
7
39NATURE CHEMISTRY | www.nature.com/naturechemistry
© 2015 Macmillan Publishers Limited. All rights reserved

40
Crude 1H NMR (400MHz, CDCl3) after removal of volatiles with reaction conditions shown in Table S4, entry 11 (THF:H2O60:40). Biphenyl is used as an internal standard (0.1 eq).
9.0 8.5 8.0 7.5 7.0 6.5 6.0 5.5 5.0 4.5 4.0 3.5 3.0 2.5 2.0 1.5 1.0 0.5
0.700.680.40
8.0
4 7.5
97.5
77.4
3 7.2
7
5.8
6
3.4
03.3
83.3
7
2.4
62.4
52.4
22.4
12.3
82.1
72.0
82.0
11.7
8 1.7
71.7
61.7
3
1.4
31.4
01.3
41.2
01.1
81.0
70.9
90.9
80.9
70.9
30.9
20.8
6
40NATURE CHEMISTRY | www.nature.com/naturechemistry
© 2015 Macmillan Publishers Limited. All rights reserved

41
Crude 13C NMR (125MHz, CDCl3) after removal of volatiles with reaction conditions shown in Table S4, entry 11 (THF:H2O60:40). Biphenyl is used as an internal standard (0.1 eq).
200 180 160 140 120 100 80 60 40 20
172.3
1
141.0
9
128.6
5127.0
3
105.3
3
93.7
1
79.4
277.2
5 77.0
076.7
5
56.5
0
49.9
544.8
4
40.0
537.4
135.7
933.4
932.8
230.8
425.0
924.7
523.3
019.7
319.5
9
12.4
5
41NATURE CHEMISTRY | www.nature.com/naturechemistry
© 2015 Macmillan Publishers Limited. All rights reserved

42
Crude 1H NMR (300 MHz, CDCl3) of artemisinin 1 isolated after slow air evaporation of the ethanol at room temperature and
filtration of the reaction mixture (Table S4 entry 16). Mesitylene was added as an internal standard (1.0 eq.)
9.0 8.5 8.0 7.5 7.0 6.5 6.0 5.5 5.0 4.5 4.0 3.5 3.0 2.5 2.0 1.5 1.0 0.5
0.980.983.00
7.2
7
6.8
1
5.8
7
3.4
33.4
13.4
13.3
9
2.4
42.4
42.2
92.0
42.0
31.8
11.7
8
1.4
61.4
21.2
31.2
11.0
9
1.0
21.0
0
42NATURE CHEMISTRY | www.nature.com/naturechemistry
© 2015 Macmillan Publishers Limited. All rights reserved

43
13C NMR (125 MHz, CDCl3) of artemisinin isolated after slow air/room temp. evaporation of the ethanol and filtration of thereaction mixture EtOH:H2O (60:40) Table S4 entry 16.
170 160 150 140 130 120 110 100 90 80 70 60 50 40 30 20 10
17
2.0
6
10
5.3
7 93
.70
79
.48
77
.26
77
.00
76
.75
50
.05
44
.96
37
.52
35
.89
33
.59
32
.88
25
.19
24
.84
23
.39
19
.82
12
.55
43NATURE CHEMISTRY | www.nature.com/naturechemistry
© 2015 Macmillan Publishers Limited. All rights reserved
44
IR spectrum of artemisinin isolated after slow air/room temp. evaporation of the ethanol and filtration of the reaction mixtureEtOH:H2O (60:40) Table S4 entry 16.
44NATURE CHEMISTRY | www.nature.com/naturechemistry
© 2015 Macmillan Publishers Limited. All rights reserved

45
Crude 1H NMR (400 MHz, CDCl3) after removal of volatiles with reaction conditions shown in Table S5, entry 4 (EtOH:H2O
60:40), following continuous flow photo-oxidation and allowing mixture to stand in air for 24 h. Mesitylene was added as an
internal standard (1.0 eq.)
9 8 7 6 5 4 3 2 1 0Chemical Shift (ppm)
0.420.383.00
7.2
7
6.8
1
5.8
7
3.7
6
3.7
4
3.4
2
3.4
1
3.4
1
3.3
9
2.4
5
2.4
4
1.8
1
1.8
0
1.7
9
1.7
71
.46
1.2
61
.23
1.2
11
.02
1.0
00
.96
0.9
5
0.9
4
0.9
3
45NATURE CHEMISTRY | www.nature.com/naturechemistry
© 2015 Macmillan Publishers Limited. All rights reserved

7. Crystal data of artemisinin isolated from Table S4, entry 16
Single crystals of C15H22O5 artemisinin were taken directly from the reaction vessel. A
suitable crystal was selected and mounted in fomblin film on a micromount on a GV1000, Atlas
diffractometer. The crystal was kept at 120(2)K during data collection. Using Olex2,43 the
structure was solved with the olex2.solve structure solution program using Charge Flipping and
refined with the ShelXL44 refinement package using Least Squares minimization.
Crystal structure determination of artemisinin
Crystal Data for C15H22O5 (M =282.32): orthorhombic, space group P212121 (no. 19), a =
6.32081(9) Å, b = 9.31057(18) Å, c = 23.9696(4) Å, V = 1410.62(4) Å3, Z = 4, T = 120(2) K,
μ(CuKα) = 0.817 mm-1, Dcalc = 1.329 g/mm3, 35814 reflections measured (7.376 ≤ 2Θ ≤
152.53), 2925 unique (Rint = 0.0317, Rsigma = 0.0119) which were used in all calculations. The
final R1 was 0.0252 (I > 2σ(I)) and wR2 was 0.0668 (all data). Absolute structure parameter -
0.01(3).
Structure of artemisinin, as determined by single crystal X-ray diffraction.
46NATURE CHEMISTRY | www.nature.com/naturechemistry
© 2015 Macmillan Publishers Limited. All rights reserved

47
Le Bail fitting of the single crystal structure of 1 against the bulk phase of 1. The final R wp was 8.791.
47NATURE CHEMISTRY | www.nature.com/naturechemistry
© 2015 Macmillan Publishers Limited. All rights reserved

48
Le Bail fitting of the single crystal structure of 1 against a commercial sample of artemisinin. The final R wp was 9.610.
48NATURE CHEMISTRY | www.nature.com/naturechemistry
© 2015 Macmillan Publishers Limited. All rights reserved

8. Analysis of impurities from reaction mixture table S4, entry 16
Scheme S10: reaction scheme showing the major products and remaining impurities obtained from conditions
described in Table S4, entry 16.
Our model studies described earlier in table S4 showed no products other than 1 and 5
distinguishable by NMR analysis with yields approximating 50% and 10% respectively.
Therefore we carried out a full purification of a batch experiment (Table S4, entry 16) which
allowed to isolate 1 and the stable minor hydroperoxide isomer 5 by crystallization and column
chromatography (silica gel, cyclohexane:EtOAc, 90:10). The same column chromatography was
then flushed with pure EtOAc and then EtOH to afford a light yellow oily residue after removal
of the volatiles, the characterization of which was not possible by 1H and 13C NMR analysis and
was further assigned as an oligomeric compound by MALDI analysis (see below).
49NATURE CHEMISTRY | www.nature.com/naturechemistry
© 2015 Macmillan Publishers Limited. All rights reserved
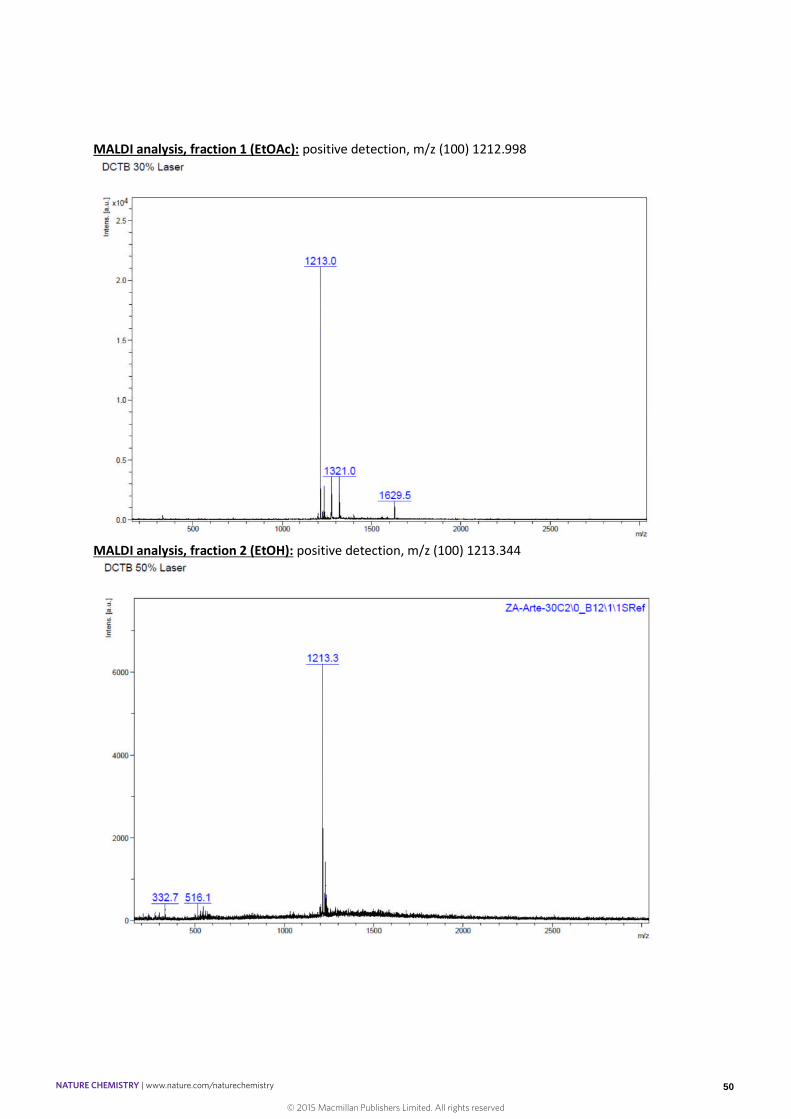
MALDI analysis, fraction 1 (EtOAc): positive detection, m/z (100) 1212.998
MALDI analysis, fraction 2 (EtOH): positive detection, m/z (100) 1213.344
50NATURE CHEMISTRY | www.nature.com/naturechemistry
© 2015 Macmillan Publishers Limited. All rights reserved

51
1H NMR experiment (C6D6, 300MHz) to attempt dissection of the reaction cascade and
trapping of intermediate 6 before second oxidation with 3O2 occurs:
Based on the preceding experimental results from Sy and Brown,15 it was possible to trap
compound 6 in the presence of an internal standard (biphenyl, 0.1 eq.) and to measure the
selectivity after the Hock cleavage step (4 to 6) before oxidation to 1. The experiment was
carried out as described below in THF as the reaction solvent and was monitored by 1H NMR
in C6D6 after careful degas and evaporation of the volatiles.
Scheme S11: One pot trapping experiment of Hock cleavage product 6 from 3
In a 2 necked round bottom flask, 3 (500 mg, 2.12 mmol), TPP (2 mg, 0.003 mmol) and
biphenyl (32.7 mg, 0.212 mmol) are dissolved in 25 mL of THF. The reaction mixture is
cooled to -45 oC using an acetonitrile dry-ice cooling bath. The solution is oxygenated by
continuous bubbling of O2 at atmospheric pressure with LED irradiation for 2.5 hours. The
conversion and selectivity to the desired product 6 are monitored by 1H NMR by taking
regular aliquots concentrated under high vacuum. Oxygen bubbling was ceased and the
mixture was degassed by freeze pump thaw and dried by evaporation of the volatiles at -20
oC. Final yield of 6 is measured by integration against internal standard by 1H NMR (C6D6,
300MHz)
51NATURE CHEMISTRY | www.nature.com/naturechemistry
© 2015 Macmillan Publishers Limited. All rights reserved

52
10.5 10.0 9.5 9.0 8.5 8.0 7.5 7.0 6.5 6.0 5.5 5.0 4.5 4.0 3.5 3.0 2.5 2.0 1.5 1.0 0.5 0Chemical Shift (ppm)
48.7840.00
0.2
8
0.6
70.7
00.7
20.8
00.9
91.0
01.0
3
1.1
5
1.3
21.3
51.3
91.6
81.7
0
1.9
11.9
82.0
52.0
6
2.3
82.4
12.4
3
5.8
35.8
4
7.1
67.2
2
7.4
47.4
7
Figure S10: Selectivity before triplet oxygen oxygenation
As mentioned in the literature, enol 6 is a relatively unstable compound that reacts with O2 to
produce 1. Existence of 6 has been proved and assigned by Sy and Brown in CDCl315 and
several competitive pathways have been proposed to occur once 6 is formed. We provide
further evidence that the formation of oligomers can occur before the formation of 6 which in
our hands turned to be stable at room temperature in C6D6 and in solvent free conditions at -
10 ºC. We found that 6 only reacted when subjected to air to form 1. The step from 6 to 1 was
shown to be quantitative. Even if the selectivity measured at that stage corresponds to the one
observed in the experimental conditions from 3 to 1, more in depth studies in deuterated
solvents should help to ascertain the fact that loss of material occur during the formation of 6
(Scheme S10).
Minor isomer 5Oligomers
TFA
C6D6
52NATURE CHEMISTRY | www.nature.com/naturechemistry
© 2015 Macmillan Publishers Limited. All rights reserved
53
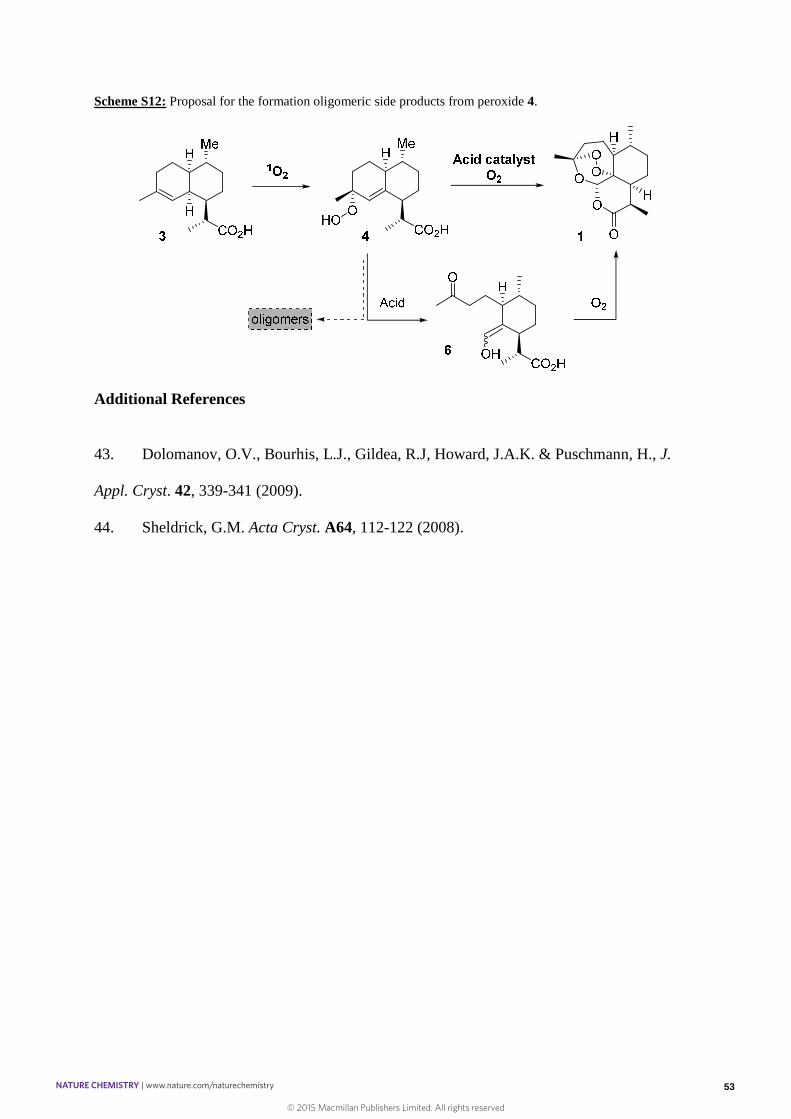
Scheme S12: Proposal for the formation oligomeric side products from peroxide 4.
Additional References
43. Dolomanov, O.V., Bourhis, L.J., Gildea, R.J, Howard, J.A.K. & Puschmann, H., J.
Appl. Cryst. 42, 339-341 (2009).
44. Sheldrick, G.M. Acta Cryst. A64, 112-122 (2008).
53NATURE CHEMISTRY | www.nature.com/naturechemistry
© 2015 Macmillan Publishers Limited. All rights reserved