appraisal report - santa fe, new mexico
TRANSCRIPT
APPRAISAL REPORT SANTA FE UNIVERSITY OF ART & DESIGN 1600 St Michael's Drive Santa Fe, Santa Fe County, New Mexico 87505 CBRE, Inc. File No. 17-271PH-1125-1 Client Reference No. Item# / 17-0328
Kelley A. Brennan & Matthew O’Reilly, P.E. City Attorney Director of Asset Development CITY OF SANTA FE 200 Lincoln Avenue Santa Fe, New Mexico 87504
www.cbre.com/valuation
© 2017 CBRE, Inc.

VALUATION & ADVISORY SERVICES
6100 Uptown Boulevard NE, Suite 300 Albuquerque, NM 87110
T 505-837-4999 F 505-837-4994
www.cbre.com
June 5, 2017 Kelley A. Brennan Matthew O’Reilly, P.E. City Attorney Director of Asset Development CITY OF SANTA FE City of Santa Fe 200 Lincoln Avenue P.O. Box 909 Santa Fe, New Mexico 87504-0909 Santa Fe, New Mexico 87504-0909 RE: Appraisal of Santa Fe University of Art & Design 1600 St Michael's Drive Santa Fe, Santa Fe County, New Mexico 87505 CBRE, Inc. File No. 17-271PH-1125-1 Client Reference No. Item# / 17-0328
Dear Ms. Brennan and Mr. O’Reilly:
At your request and authorization, CBRE, Inc. has prepared an appraisal of the market value of the referenced property. Our analysis is presented in the following Appraisal Report.
The subject is a 498,384-square-foot, college campus located at 1600 St. Michael's Drive in Santa Fe, New Mexico. It was constructed over numerous years ranging from 1945-2005. The entire campus sits on an approximate 64.222-acre site. The property consists of approximately 32 various buildings, which are comprised of dormitories, classrooms, administrative buildings, library, a fitness center, film studio, and a theatre. The subject is well located within the City of Santa Fe and is considered to be a Class C property in this market. The subject has received over $16,600,000 in renovations, upgrades and repairs between 2009 and 2014. The subject is more fully described, legally and physically, within the enclosed report. It should be noted the property is known as the Santa Fe University of Art and Design. The Campus is owned by the City of Santa Fe and is leased to Santa Fe Higher Education, LLC, a subsidiary of Laureate Education, and operating as Santa Fe University of Art and Design, which will be vacating the property in the summer of 2018. For the purpose of this report, we were asked to provide the fee simple estate value. It should also be noted the tenant has an option to purchase the property under the current lease agreement. The right to purchase will be fully described within the body of this report.
Based on the analysis contained in the following report, the market value of the subject is concluded as follows:
© 2017 CBRE, Inc.
Ms. Kelley A. Brennan Page 2
MARKET VALUE CONCLUSION
Appraisal Premise Interest Appraised Date of Value Value Conclusion
As Is Fee Simple Estate May 24, 2017 $36,100,000
Compiled by CBRE
The report, in its entirety, including all assumptions and limiting conditions, is an integral part of, and inseparable from, this letter.
The following appraisal sets forth the most pertinent data gathered, the techniques employed, and the reasoning leading to the opinion of value. The analyses, opinions and conclusions were developed based on, and this report has been prepared in conformance with, the guidelines and recommendations set forth in the Uniform Standards of Professional Appraisal Practice (USPAP), the requirements of the Code of Professional Ethics and Standards of Professional Appraisal Practice of the Appraisal Institute. It also conforms to Title XI Regulations and the Financial Institutions Reform, Recovery, and Enforcement Act of 1989 (FIRREA) updated in 1994 and further updated by the Interagency Appraisal and Evaluation Guidelines promulgated in 2010.
The intended use and user of our report are specifically identified in our report as agreed upon in our contract for services and/or reliance language found in the report. No other use or user of the report is permitted by any other party for any other purpose. Dissemination of this report by any party to any non-intended users does not extend reliance to any such party, and CBRE will not be responsible for any unauthorized use of or reliance upon the report, its conclusions or contents (or any portion thereof).
It has been a pleasure to assist you in this assignment. If you have any questions concerning the analysis, or if CBRE can be of further service, please contact us.
Respectfully submitted, CBRE - VALUATION & ADVISORY SERVICES
Stephen Wilson Jo Dance, MAI, CCIM Vice President Managing Director New Mexico Certified General Real Estate Appraiser No. 03364G
New Mexico Certified General Real Estate Appraiser No. 03242G
Phone: +1 505 837 4935 Fax: +1 505 837 4990 Email: [email protected]
Phone: +1 602 735 5686 Fax: +1 602 735 5613 Email: [email protected]
© 2017 CBRE, Inc.
Certification
i
Certification
We certify to the best of our knowledge and belief:
1. The statements of fact contained in this report are true and correct. 2. The reported analyses, opinions, and conclusions are limited only by the reported assumptions and
limiting conditions and are our personal, impartial and unbiased professional analyses, opinions, and conclusions.
3. We have no present or prospective interest in or bias with respect to the property that is the subject of this report and have no personal interest in or bias with respect to the parties involved with this assignment.
4. Our engagement in this assignment was not contingent upon developing or reporting predetermined results.
5. Our compensation for completing this assignment is not contingent upon the development or reporting of a predetermined value or direction in value that favors the cause of the client, the amount of the value opinion, the attainment of a stipulated result, or the occurrence of a subsequent event directly related to the intended use of this appraisal.
6. This appraisal assignment was not based upon a requested minimum valuation, a specific valuation, or the approval of a loan.
7. Our analyses, opinions, and conclusions were developed, and this report has been prepared, in conformity with the Uniform Standards of Professional Appraisal Practice, as well as the requirements of the State of New Mexico.
8. The reported analyses, opinions, and conclusions were developed, and this report has been prepared, in conformity with the requirements of the Code of Professional Ethics and Standards of Professional Appraisal Practice of the Appraisal Institute.
9. The use of this report is subject to the requirements of the Appraisal Institute relating to review by its duly authorized representatives.
10. As of the date of this report, Stephen Wilson and Jo Dance, MAI, CCIM have completed the continuing education program for Designated Members of the Appraisal Institute.
11. Stephen Wilson has and Jo Dance, MAI, CCIM has not made a personal inspection of the property that is the subject of this report.
12. Brittany Umbrage provided significant real property appraisal assistance to the persons signing this report. Brittany assisted in the research and development of this report.
13. Valuation & Advisory Services operates as an independent economic entity within CBRE, Inc. Although employees of other CBRE, Inc. divisions may be contacted as a part of our routine market research investigations, absolute client confidentiality and privacy were maintained at all times with regard to this assignment without conflict of interest.
14. Stephen Wilson and Jo Dance, MAI, CCIM have not provided any services, as an appraiser or in any other capacity, regarding the property that is the subject of this report within the three-year period immediately preceding acceptance of this assignment.
Stephen Wilson Jo Dance, MAI, CCIM New Mexico Certified General Real Estate Appraiser No. 03364G
New Mexico Certified General Real Estate Appraiser No. 03242G
© 2017 CBRE, Inc.
Subject Photographs
ii
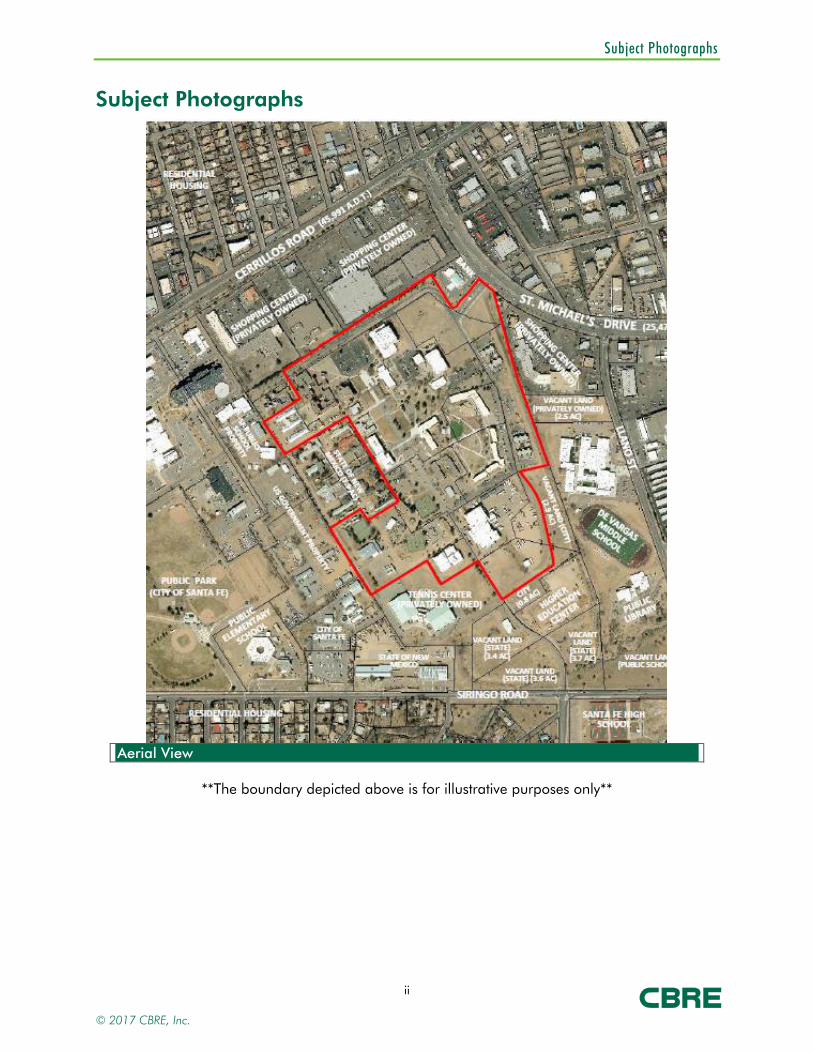
Subject Photographs
Aerial View
**The boundary depicted above is for illustrative purposes only**
© 2017 CBRE, Inc.

Subject Photographs
iii
Forum and Fogelson Library Administrative Building Front
Administrative Building Interior The Greer Garson Theater seating
Student Apartments Typical Dorms (Kennedy Hall)
© 2017 CBRE, Inc.
Subject Photographs
iv
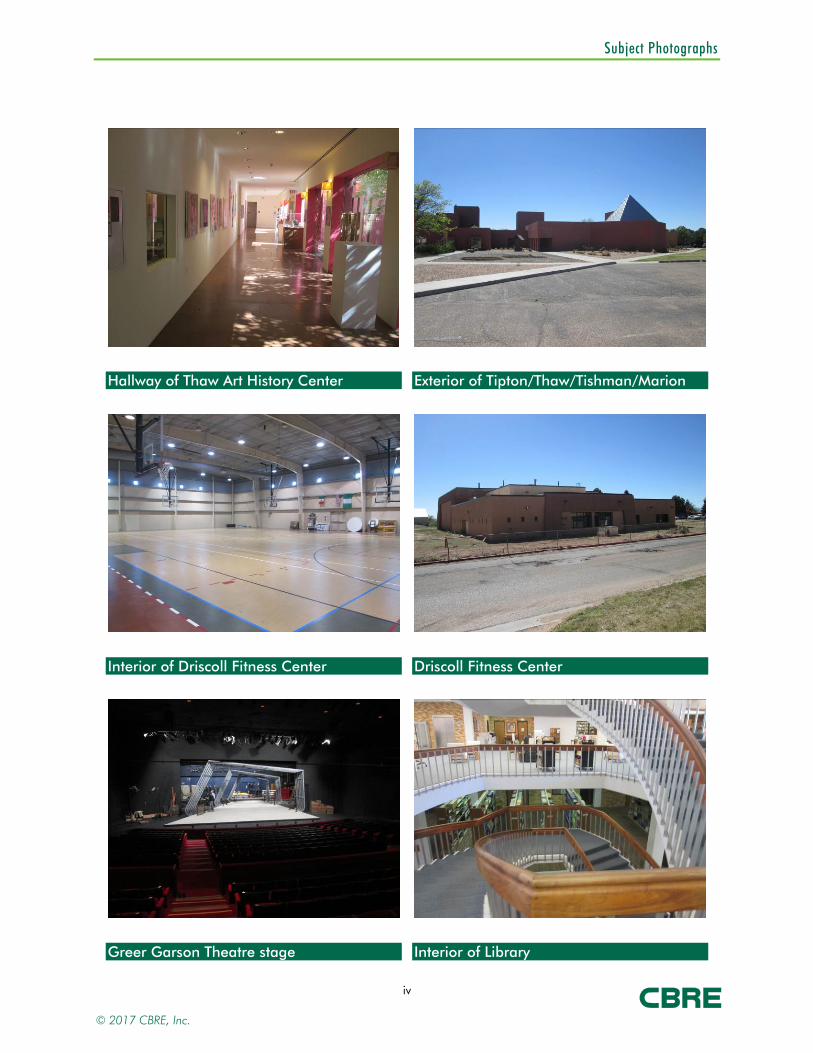
Hallway of Thaw Art History Center Exterior of Tipton/Thaw/Tishman/Marion
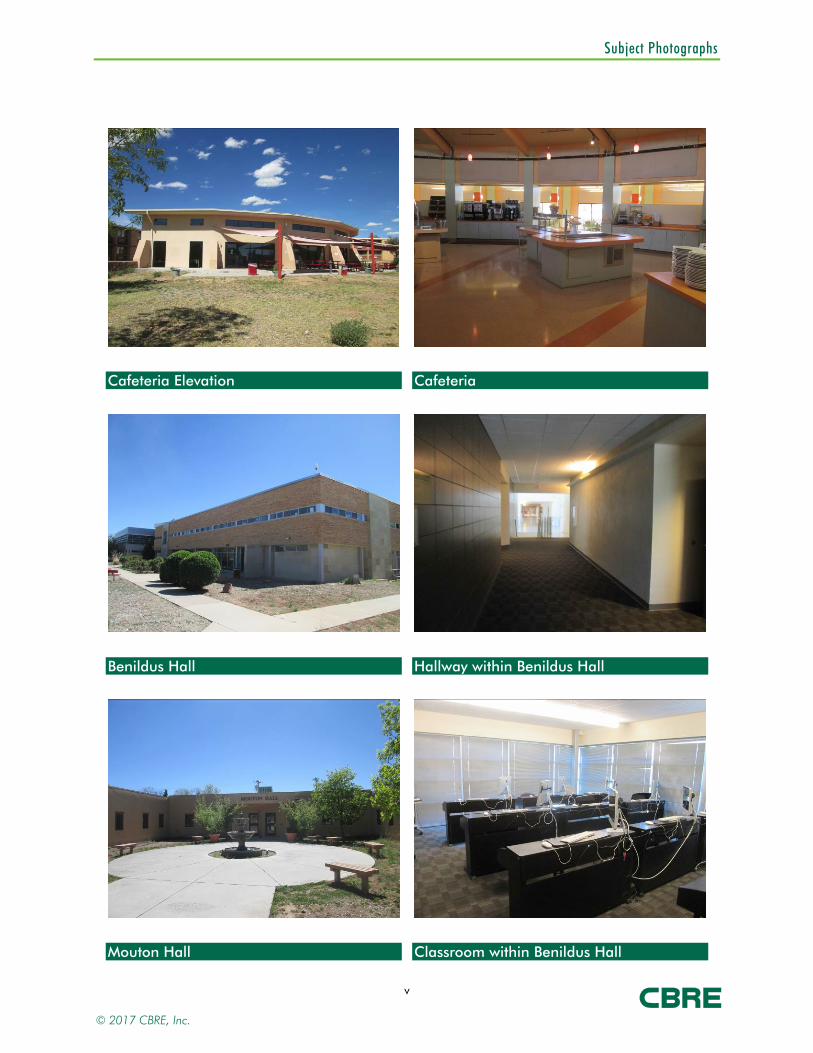
Interior of Driscoll Fitness Center Driscoll Fitness Center
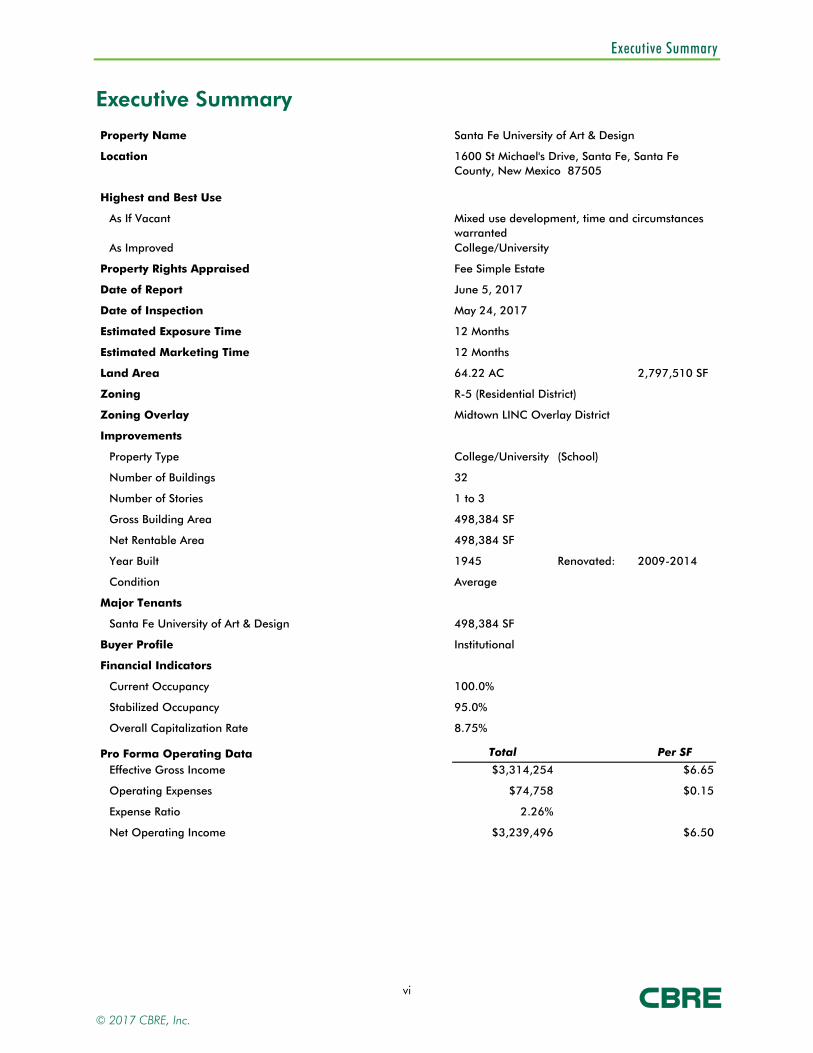
Greer Garson Theatre stage Interior of Library
© 2017 CBRE, Inc.
Subject Photographs
v
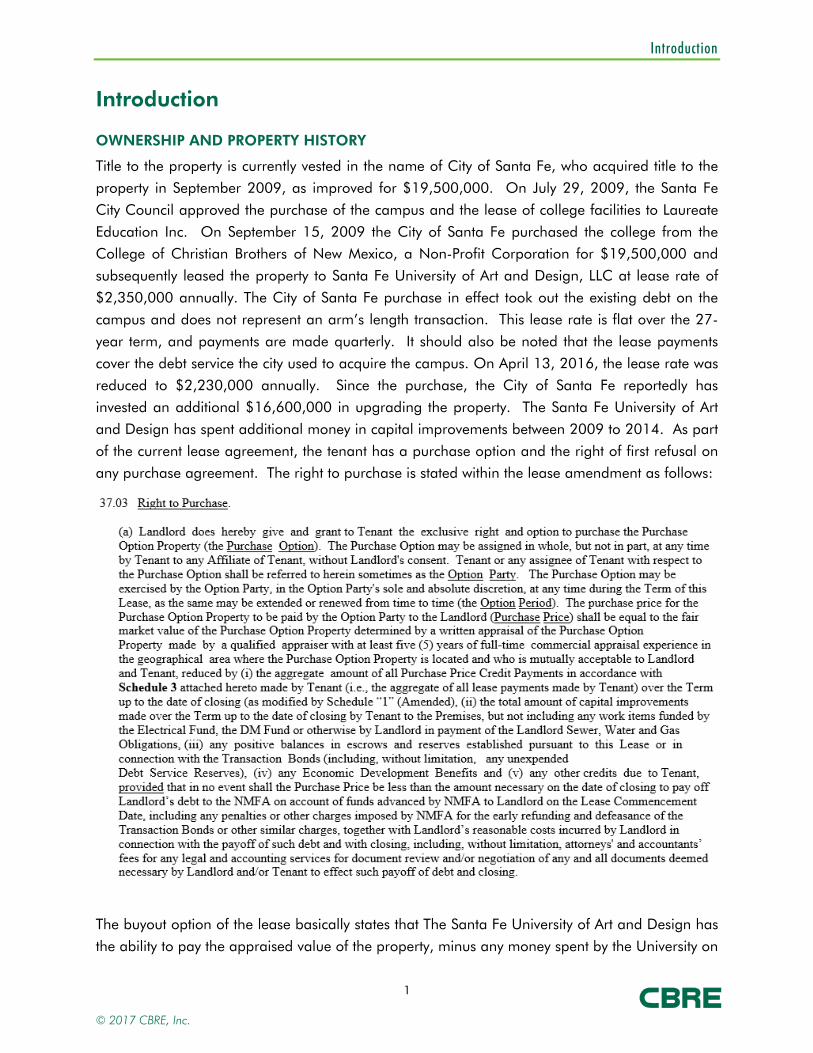
Cafeteria Elevation Cafeteria
Benildus Hall Hallway within Benildus Hall
Mouton Hall Classroom within Benildus Hall
© 2017 CBRE, Inc.
Executive Summary
vi
Executive Summary
Property Name
Location
Highest and Best Use
As If Vacant
As Improved
Property Rights Appraised
Date of Report
Date of Inspection
Estimated Exposure Time
Estimated Marketing Time
Land Area 64.22 AC 2,797,510 SF
Zoning
Zoning Overlay
Improvements
Property Type College/University
Number of Buildings
Number of Stories
Gross Building Area
Net Rentable Area
Year Built 1945 Renovated: 2009-2014
Condition
Major Tenants
Santa Fe University of Art & Design
Buyer Profile
Financial Indicators
Current Occupancy 100.0%
Stabilized Occupancy 95.0%
Overall Capitalization Rate 8.75%
Pro Forma Operating Data Total Per SF
Effective Gross Income $3,314,254 $6.65
Operating Expenses $74,758 $0.15
Expense Ratio 2.26%
Net Operating Income $3,239,496 $6.50
12 Months
12 Months
498,384 SF
R-5 (Residential District)
Midtown LINC Overlay District
32
498,384 SF
Santa Fe University of Art & Design
May 24, 2017
Fee Simple Estate
College/University
Mixed use development, time and circumstances warranted
1600 St Michael's Drive, Santa Fe, Santa Fe County, New Mexico 87505
June 5, 2017
(School)
Institutional
Average
1 to 3
498,384 SF
© 2017 CBRE, Inc.

Executive Summary
vii
VALUATION Total Per SF
Land Value $7,550,000 $2.70
Market Value As Is On May 24, 2017Cost Approach $22,050,000 $44.24
Sales Comparison Approach $36,100,000 $72.43
Income Capitalization Approach $36,200,000 $72.63
CONCLUDED MARKET VALUE
Appraisal Premise Interest Appraised Value
As Is Fee Simple Estate $36,100,000
Compiled by CBRE
Date of Value
May 24, 2017
STRENGTHS, WEAKNESSES, OPPORTUNITIES AND THREATS (SWOT)
Strengths/ Opportunities
• The subject is a large college campus in the heart of Santa Fe, New Mexico • The majority of the buildings are generally in good condition • The subject has an overlay district which allows for high density mixed use development
Weaknesses/ Threats
• The subject’s improvements consist of older age improvements • Santa Fe, New Mexico is a tertiary market
EXTRAORDINARY ASSUMPTIONS
An extraordinary assumption is defined as “an assumption directly related to a specific
assignment, as of the effective date of the assignment results, which if found to be false, could alter the appraiser’s opinions or conclusions.” 1
• None noted
HYPOTHETICAL CONDITIONS
A hypothetical condition is defined as “a condition, directly related to a specific assignment, which is contrary to what is known by the appraiser to exist on the effective date of the
assignment results, but is used for the purposes of analysis.” 2
• None noted
1 The Appraisal Foundation, USPAP, 2016-2017 ed., 3.
2 The Appraisal Foundation, USPAP, 2016-2017 ed., 3.
© 2017 CBRE, Inc.

Table of Contents
viii
Table of Contents
Certification ......................................................................................................................... i
Subject Photographs ............................................................................................................ ii
Executive Summary ............................................................................................................. vi
Table of Contents .............................................................................................................. viii
Introduction ........................................................................................................................ 1
Area Analysis ...................................................................................................................... 5
Neighborhood Analysis ....................................................................................................... 8
Site Analysis ...................................................................................................................... 14
Improvements Analysis ...................................................................................................... 17
Zoning .............................................................................................................................. 45
Tax and Assessment Data .................................................................................................. 48
Market Analysis ................................................................................................................. 49
Highest and Best Use ........................................................................................................ 57
Appraisal Methodology ..................................................................................................... 59
Land Value ........................................................................................................................ 60
Cost Approach .................................................................................................................. 65
Sales Comparison Approach ............................................................................................. 74
Income Capitalization Approach ........................................................................................ 81
Reconciliation of Value ...................................................................................................... 90
Assumptions and Limiting Conditions ................................................................................ 91
ADDENDA A Land Sale Data Sheets B Improved Sale Data Sheets C Rent Comparable Data Sheets D Legal Description from lease E Client Contract Information F Appraiser Qualifications
© 2017 CBRE, Inc.
Introduction
1
Introduction
OWNERSHIP AND PROPERTY HISTORY
Title to the property is currently vested in the name of City of Santa Fe, who acquired title to the
property in September 2009, as improved for $19,500,000. On July 29, 2009, the Santa Fe
City Council approved the purchase of the campus and the lease of college facilities to Laureate
Education Inc. On September 15, 2009 the City of Santa Fe purchased the college from the College of Christian Brothers of New Mexico, a Non-Profit Corporation for $19,500,000 and
subsequently leased the property to Santa Fe University of Art and Design, LLC at lease rate of
$2,350,000 annually. The City of Santa Fe purchase in effect took out the existing debt on the campus and does not represent an arm’s length transaction. This lease rate is flat over the 27-
year term, and payments are made quarterly. It should also be noted that the lease payments
cover the debt service the city used to acquire the campus. On April 13, 2016, the lease rate was
reduced to $2,230,000 annually. Since the purchase, the City of Santa Fe reportedly has invested an additional $16,600,000 in upgrading the property. The Santa Fe University of Art
and Design has spent additional money in capital improvements between 2009 to 2014. As part
of the current lease agreement, the tenant has a purchase option and the right of first refusal on any purchase agreement. The right to purchase is stated within the lease amendment as follows:
The buyout option of the lease basically states that The Santa Fe University of Art and Design has
the ability to pay the appraised value of the property, minus any money spent by the University on
© 2017 CBRE, Inc.
Introduction
2
capital improvements during their lease term, as long as it is no less than what the City of Santa
Fe owes on the property.
The Santa Fe University of Art and Design has given notice that they will be vacating the facility in
the summer of 2018. The amount of money spent by The Santa Fe University of Art and Design
in capital improvements during their lease term was not provided to the appraisers and is
unknown.
INTENDED USE OF REPORT
This appraisal is to be used for internal decision making purposes, and no other use is permitted.
INTENDED USER OF REPORT
This appraisal is to be used by the City of Santa Fe, and no other user may rely on our report unless as specifically indicated in the report.
Intended Users - the intended user is the person (or entity) who the appraiser intends will use the results of the appraisal. The client may provide the appraiser with information about other potential users of the appraisal, but the appraiser ultimately determines who the appropriate users are given the appraisal problem to be solved. Identifying the intended users is necessary so that the appraiser can report the opinions and conclusions developed in the appraisal in a manner that is clear and understandable to the intended users. Parties who receive or might receive a copy of the appraisal are not necessarily intended users. The appraiser’s responsibility is to the intended users identified in the report, not to all readers of the appraisal report. 3
PURPOSE OF THE APPRAISAL
The purpose of this appraisal is to estimate the market value of the subject property.
DEFINITION OF VALUE
The current economic definition of market value agreed upon by agencies that regulate federal
financial institutions in the U.S. (and used herein) is as follows:
The most probable price which a property should bring in a competitive and open market under all conditions requisite to a fair sale, the buyer and seller each acting prudently and
knowledgeably, and assuming the price is not affected by undue stimulus. Implicit in this
definition is the consummation of a sale as of a specified date and the passing of title from seller to buyer under conditions whereby:
1. buyer and seller are typically motivated; 2. both parties are well informed or well advised, and acting in what they consider their own
best interests; 3. a reasonable time is allowed for exposure in the open market;
3 Appraisal Institute, The Appraisal of Real Estate, 14th ed. (Chicago: Appraisal Institute, 2013), 50.
© 2017 CBRE, Inc.

Introduction
3
4. payment is made in terms of cash in U.S. dollars or in terms of financial arrangements comparable thereto; and
5. the price represents the normal consideration for the property sold unaffected by special or creative financing or sales concessions granted by anyone associated with the sale. 4
INTEREST APPRAISED
The values estimated represent fee simple estate interest and are defined as follows:
Fee Simple Estate - Absolute ownership unencumbered by any other interest or estate, subject only to the limitations imposed by the governmental powers of taxation, eminent domain, police power and escheat. 5
SCOPE OF WORK
This Appraisal Report is intended to comply with the reporting requirements set forth under Standards Rule 2 of USPAP. The scope of the assignment relates to the extent and manner in
which research is conducted, data is gathered and analysis is applied. CBRE, Inc. completed the
following steps for this assignment:
Extent to Which the Property is Identified
The property is identified through the following sources:
• postal address • assessor’s records • legal description
Extent to Which the Property is Inspected
Stephen Wilson, MAI, SRA inspected the subject property and its surrounding environs.
Type and Extent of the Data Researched
CBRE reviewed the following:
• applicable tax data • zoning requirements • flood zone status • demographics • income and expense data • comparable data
Type and Extent of Analysis Applied
CBRE, Inc. analyzed the data gathered through the use of appropriate and accepted appraisal methodology to arrive at a probable value indication via each applicable approach to value. The
steps required to complete each approach are discussed in the methodology section.
4 Interagency Appraisal and Evaluation Guidelines; December 10, 2010, Federal Register, Volume 75 Number 237, Page 77472.
5 Dictionary of Real Estate Appraisal, 78.
© 2017 CBRE, Inc.
Introduction
4
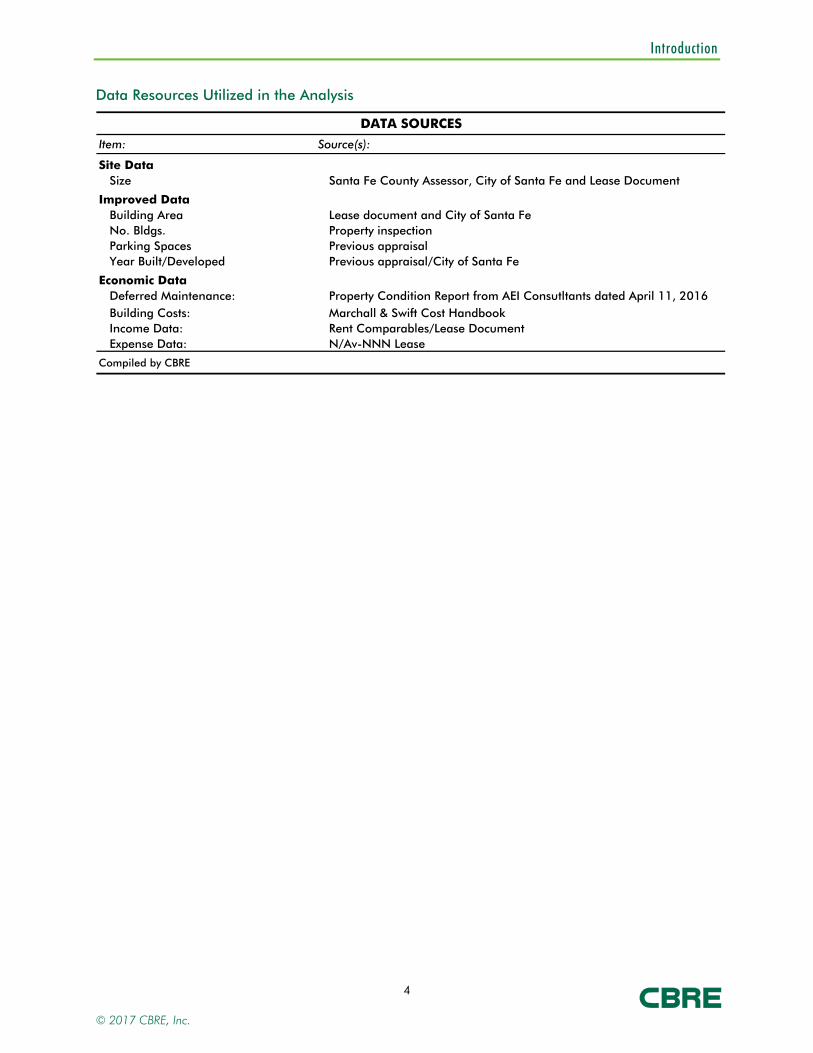
Data Resources Utilized in the Analysis
DATA SOURCES
Item: Source(s):
Site DataSize Santa Fe County Assessor, City of Santa Fe and Lease Document
Improved DataBuilding Area Lease document and City of Santa Fe No. Bldgs. Property inspectionParking Spaces Previous appraisalYear Built/Developed Previous appraisal/City of Santa Fe
Economic DataDeferred Maintenance: Property Condition Report from AEI Consutltants dated April 11, 2016Building Costs: Marchall & Swift Cost HandbookIncome Data: Rent Comparables/Lease DocumentExpense Data: N/Av-NNN Lease
Compiled by CBRE
© 2017 CBRE, Inc.
Area Analysis
5
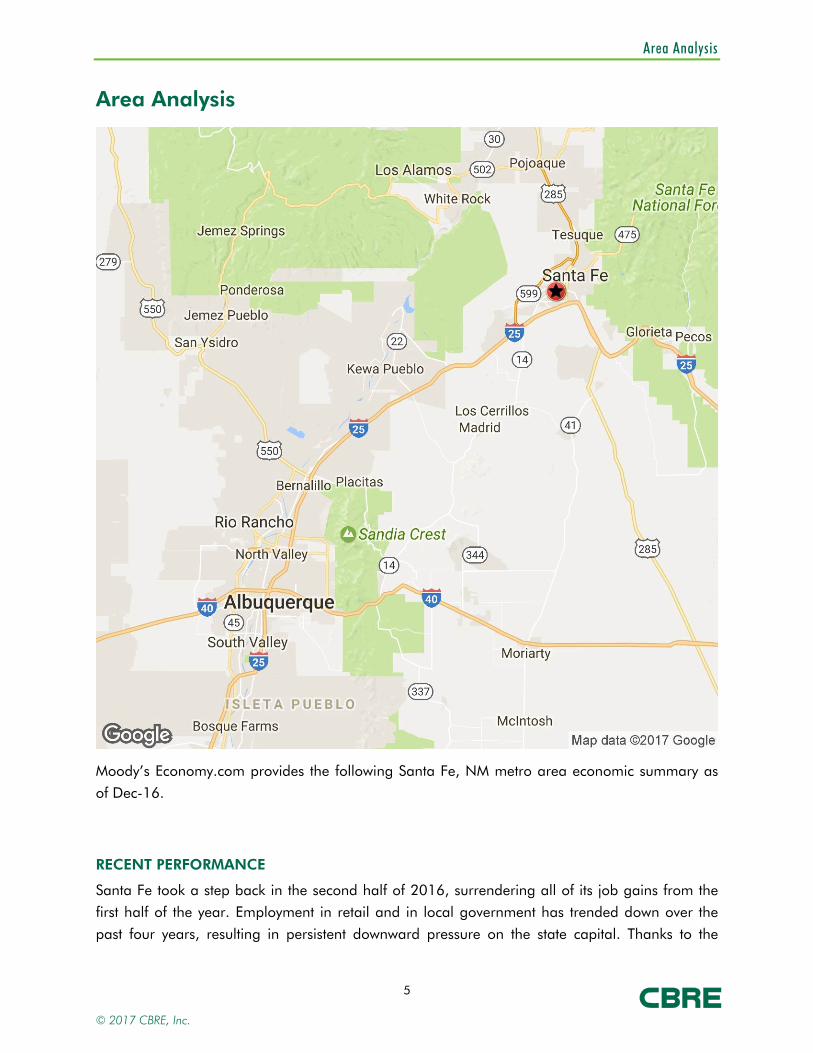
Area Analysis
Moody’s Economy.com provides the following Santa Fe, NM metro area economic summary as
of Dec-16.
RECENT PERFORMANCE
Santa Fe took a step back in the second half of 2016, surrendering all of its job gains from the first half of the year. Employment in retail and in local government has trended down over the
past four years, resulting in persistent downward pressure on the state capital. Thanks to the
© 2017 CBRE, Inc.

Area Analysis
6
recent job losses and the lack of positive momentum in higher-paying services such as finance
and professional services as well as state government, real household income has been flat over the past year. Home sales have grown slowly, and residential construction is still stuck at the
bottom. More encouraging is that severance tax revenue in New Mexico is no longer contracting,
though the state has to make significant rescissions in order to balance its fiscal 2017 budget.
STATE BUDGET
SFE will go through further pain in the short term due to New Mexico's fiscal retrenchment. The
good news is that the recovery of oil prices and the increase in active rigs throughout the state
has ended the decline in severance tax revenues. But the rescissions needed to bring the budget in line will do real damage; they include a likely merger of state agency human resource
departments that will lead to layoffs, and a reduction in state funds going to public school
reserves. The effects on SFE will likely include mild declines in state employment for the next two
years and belt-tightening for Santa Fe Community College and other state-funded institutions. Given the shortage of state aid to local governments, the downward effect on local government
spending is also likely to persist for another full year, putting more of the onus on private
industries to pick up the slack.
HEALTHCARE
SFE's healthcare facilities will have to undergo a radical transformation in order for the industry to
contribute positively to growth. Healthcare and social assistance already make up an above-
average 15% of employment, and jobs at doctors' offices account for the largest slice of metro area wage income. Given the recent slowdown in SFE population growth, it is likely that the
state's ambulatory care facilities have some excess capacity. But what stands out for SFE's
healthcare industry are population projections, which peg the metro area as a retiree haven rivaling some Florida metro areas: Thirty years from now, just over one-third of SFE's population
is forecast to be age 65 and older, compared with just over one-fifth for the U.S. Residential care
facilities will expand substantially in order to meet rising demand.
HOUSING
The housing market is slowly regaining its pace from the previous decade and will make a small
contribution to the metro area's expansion in coming years. Unlike in other parts of New Mexico,
the population in SFE has not contracted, and household formation has been steady over the past
five years. Single-family sales are still well below last decade's average but have risen substantially since bottoming in late 2010. With inventory also falling, the conditions are in place
for more residential construction, assuming that the rate of household formation picks up with
growth in the economy.
© 2017 CBRE, Inc.
Area Analysis
7
CONCLUSION
Despite short-term drag from state and local government, job growth in Santa Fe will resume in 2017 as a combination of improved tourism and stronger demand for housing push up on
investment and consumer spending. Thanks to in-migration, population in the state capital will
also resume growing. SFE's continued popularity as a tourist destination, combined with multiplier
effects from neighboring Los Alamos National Laboratory, will help household income growth edge out the U.S. growth rate over the extended forecast horizon.
© 2017 CBRE, Inc.
Neighborhood Analysis
8
Neighborhood Analysis
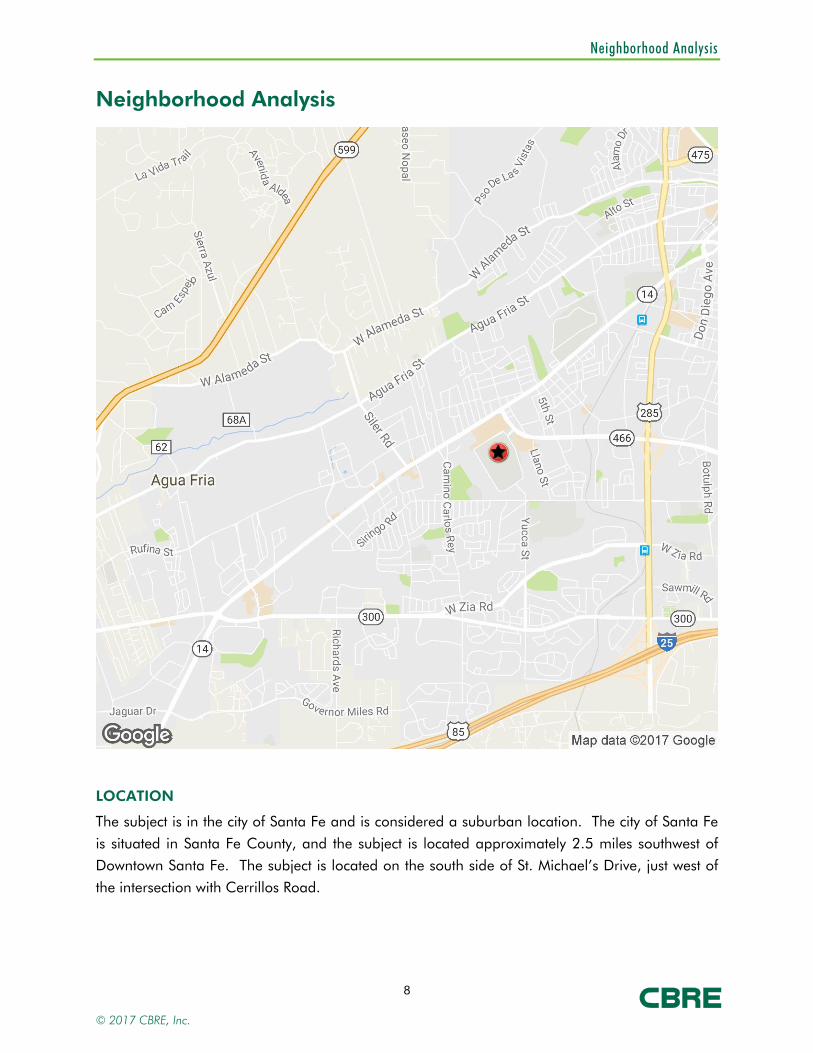
LOCATION
The subject is in the city of Santa Fe and is considered a suburban location. The city of Santa Fe
is situated in Santa Fe County, and the subject is located approximately 2.5 miles southwest of
Downtown Santa Fe. The subject is located on the south side of St. Michael’s Drive, just west of
the intersection with Cerrillos Road.
© 2017 CBRE, Inc.
Neighborhood Analysis
9
BOUNDARIES
The neighborhood boundaries are detailed as follows:
North: Agua Fria Street South: West Rodeo Road East: Saint Francis Drive West: Lopez Lane
LAND USE
Land uses within the subject neighborhood consist of a mixture of commercial, industrial and
residential development. Additional land uses include several schools and colleges. The immediate area surrounding the subject is an older area of development, consisting primarily of
retail and residential uses with the majority of the development being built in the 1960’s, 1970’s,
and 1980’s. The single-family residential development within a one-mile radius of the subject
may be described as tract homes in the $150,000-$400,000 range.
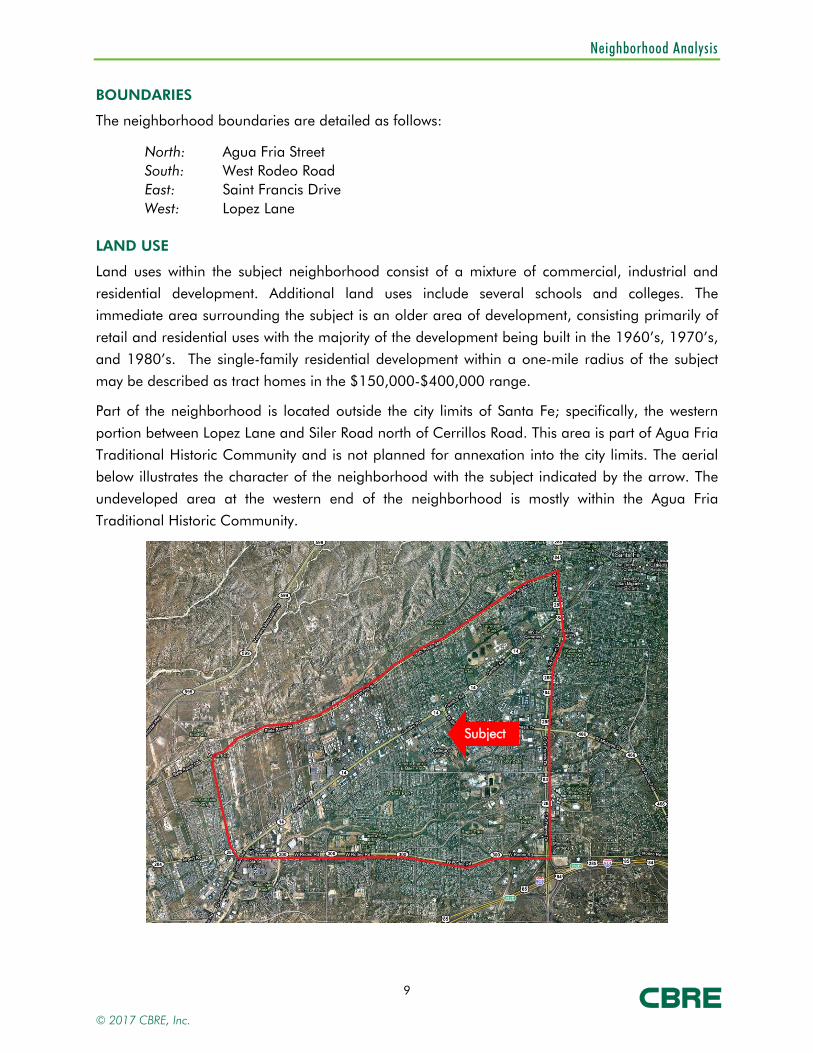
Part of the neighborhood is located outside the city limits of Santa Fe; specifically, the western
portion between Lopez Lane and Siler Road north of Cerrillos Road. This area is part of Agua Fria
Traditional Historic Community and is not planned for annexation into the city limits. The aerial below illustrates the character of the neighborhood with the subject indicated by the arrow. The
undeveloped area at the western end of the neighborhood is mostly within the Agua Fria
Traditional Historic Community.
Subject
© 2017 CBRE, Inc.
Neighborhood Analysis
10
Santa Fe Place Mall is the only regional mall in northern New Mexico and is located at the
southeast corner of Cerrillos Road and West Rodeo Road, just outside the neighborhood boundaries. The mall was built in 1985 and renovated in November of 2005. The mall features
75 stores with Dillard’s, Sears, and JC Penny as the major anchor tenants. The mall sits on a 57-
acre site and features 571,240 square feet of retail area. Some of the better known retailers
include Hollister, Gap, PacSun, Victoria’s Secret, Christopher & Banks, Wet Seal, The Children’s Place, The Shoe Pavilion, Bath & Body Works, Sports Authority, Zales, and United Artists Theaters.
Additional significant commercial uses in the neighborhood include the Plaza Santa Fe, a
430,000 square foot power center developed between 1999 and 2002 at the northwest corner of West Rodeo Road and Cerrillos Road. The center includes major retailers such as Best Buy,
Target, Albertsons and others. Additionally, a Lowe’s Home Improvement store, and 14-screen
Regal Cinema Theater are located in the area. There are multiple other major commercial
developments along Cerrillos Road and St. Michael’s Drive including several big-box stores such as Wal-Mart, Home Depot, and Sam’s Club. There are also several large neighborhood and
community shopping centers, as well as various retail and service uses.
GROWTH PATTERNS
Growth patterns have occurred along primary commercial thoroughfares such as Cerrillos Road
and St. Michael’s Drive. Cerrillos Road, a primary east-west arterial, is Santa Fe’s most densely
developed commercial corridor, and is the primary route for travelers and employees commuting
within Santa Fe.
Recent development within the neighborhood has been limited due to the scarcity of developable
sites. Most growth has occurred around the edges of the city, especially the southwest edge which
represents the main path of growth for the city.
The immediate neighborhood is generally in the stable phase of the typical neighborhood life-
cycle. Some areas are experiencing redevelopment, particularly along Cerrillos Road where some
sites contain improvements that are reaching the end of their economic life. The recent
redevelopment of a site at the northwest corner of Cerrillos Road and Siler road for a CVS/pharmacy is an example. Another corner site on Cerrillos Road that housed a restaurant
was demolished for construction of a new express car wash that opened in April 2015. Although
there is still some vacant land available for development in the neighborhood it is relatively scarce and generally not suitable for commercial development.
ACCESS
Cerrillos Road runs generally southwest to northeast connecting Interstate Highway 25 to St.
Francis Drive (Highway 285/84). Paralleling this street to the north is Agua Fria Street. The main north-south arterial in the neighborhood is St. Francis Drive while the main east-west arterials are
© 2017 CBRE, Inc.
Neighborhood Analysis
11
St. Michael’s Drive and West Rodeo Road. Secondary access roads include Lopez Lane and Siler
Road, both of which cross the Santa Fe River just north of the neighborhood.
The City of Santa Fe has recently been reconstructing Cerrillos Road southwest of the subject. The
most recent phase ended at Camino Carlos Rey, approximately 0.6 miles southwest of the
subject. The current phase which began in 2015, continues the reconstruction northeast to just
Llano Street, just past St. Michael’s Drive. According to a website for the project, improvements will include: new roadway pavement, curb and gutter, sidewalks, bike lanes, bus stops and bus
shelters, median landscaping, storm drains, and street lighting.
Access to and from the subject’s neighborhood is considered good by way of state highways that connect with Interstate 25. Major highways serving Santa Fe include Interstate 25 and U.S.
Highways 84, 85, 285 and 64. The City of Albuquerque is situated 60 miles to the southwest of
Santa Fe along Interstate 25, which is the only north/south interstate highway in the State.
DEMOGRAPHICS
Selected neighborhood demographics in 1-, 3-, and 5-mile radii from the subject are shown in
the following table:
© 2017 CBRE, Inc.
Neighborhood Analysis
12
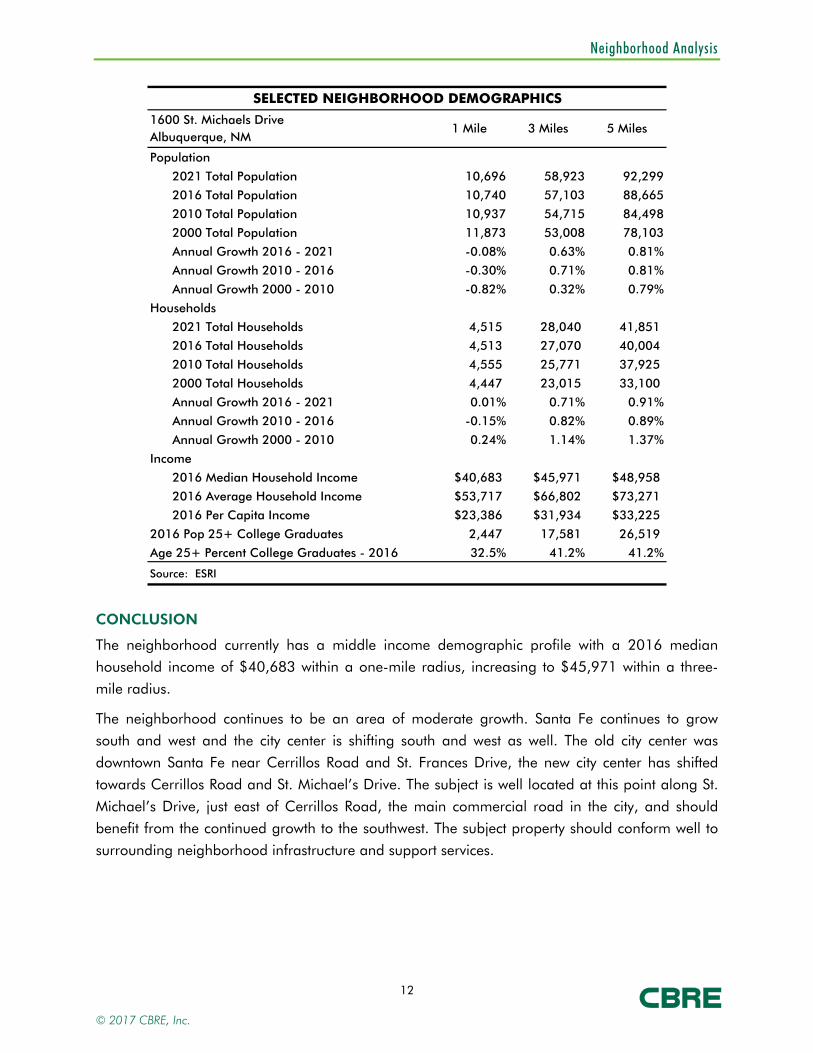
SELECTED NEIGHBORHOOD DEMOGRAPHICS
1600 St. Michaels DriveAlbuquerque, NM
Population
2021 Total Population 10,696 58,923 92,299
2016 Total Population 10,740 57,103 88,665
2010 Total Population 10,937 54,715 84,498
2000 Total Population 11,873 53,008 78,103
Annual Growth 2016 - 2021 -0.08% 0.63% 0.81%
Annual Growth 2010 - 2016 -0.30% 0.71% 0.81%
Annual Growth 2000 - 2010 -0.82% 0.32% 0.79%
Households
2021 Total Households 4,515 28,040 41,851
2016 Total Households 4,513 27,070 40,004
2010 Total Households 4,555 25,771 37,925
2000 Total Households 4,447 23,015 33,100
Annual Growth 2016 - 2021 0.01% 0.71% 0.91%
Annual Growth 2010 - 2016 -0.15% 0.82% 0.89%
Annual Growth 2000 - 2010 0.24% 1.14% 1.37%
Income
2016 Median Household Income $40,683 $45,971 $48,958
2016 Average Household Income $53,717 $66,802 $73,271
2016 Per Capita Income $23,386 $31,934 $33,225
2016 Pop 25+ College Graduates 2,447 17,581 26,519
Age 25+ Percent College Graduates - 2016 32.5% 41.2% 41.2%
Source: ESRI
1 Mile 3 Miles 5 Miles
CONCLUSION
The neighborhood currently has a middle income demographic profile with a 2016 median household income of $40,683 within a one-mile radius, increasing to $45,971 within a three-
mile radius.
The neighborhood continues to be an area of moderate growth. Santa Fe continues to grow south and west and the city center is shifting south and west as well. The old city center was
downtown Santa Fe near Cerrillos Road and St. Frances Drive, the new city center has shifted
towards Cerrillos Road and St. Michael’s Drive. The subject is well located at this point along St.
Michael’s Drive, just east of Cerrillos Road, the main commercial road in the city, and should benefit from the continued growth to the southwest. The subject property should conform well to
surrounding neighborhood infrastructure and support services.
© 2017 CBRE, Inc.

Site Analysis
13
PLAT MAP
© 2017 CBRE, Inc.
Site Analysis
14
Site Analysis
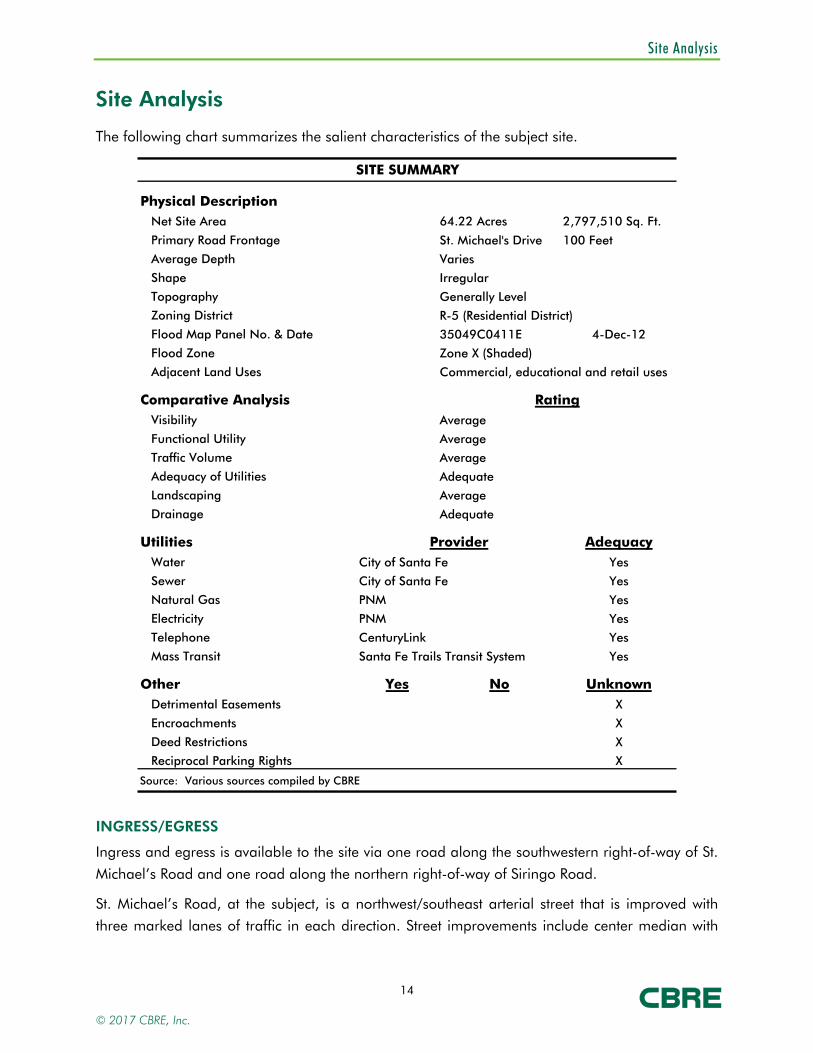
The following chart summarizes the salient characteristics of the subject site.
SITE SUMMARY
Physical DescriptionNet Site Area 64.22 Acres 2,797,510 Sq. Ft.
Primary Road Frontage St. Michael's Drive 100 Feet
Average Depth Varies
Shape
Topography
Zoning District
Flood Map Panel No. & Date 35049C0411E 4-Dec-12
Flood Zone Zone X (Shaded)
Adjacent Land Uses
Comparative AnalysisVisibility
Functional Utility
Traffic Volume
Adequacy of Utilities
Landscaping
Drainage
Utilities AdequacyWater Yes
Sewer Yes
Natural Gas Yes
Electricity Yes
Telephone Yes
Mass Transit Yes
Other Yes No UnknownDetrimental Easements X
Encroachments X
Deed Restrictions X
Reciprocal Parking Rights X
Source: Various sources compiled by CBRE
RatingAverage
Average
Average
Irregular
Generally Level
R-5 (Residential District)
Commercial, educational and retail uses
Santa Fe Trails Transit System
City of Santa Fe
PNM
PNM
CenturyLink
Adequate
Average
ProviderCity of Santa Fe
Adequate
INGRESS/EGRESS
Ingress and egress is available to the site via one road along the southwestern right-of-way of St.
Michael’s Road and one road along the northern right-of-way of Siringo Road.
St. Michael’s Road, at the subject, is a northwest/southeast arterial street that is improved with three marked lanes of traffic in each direction. Street improvements include center median with
© 2017 CBRE, Inc.
Site Analysis
15
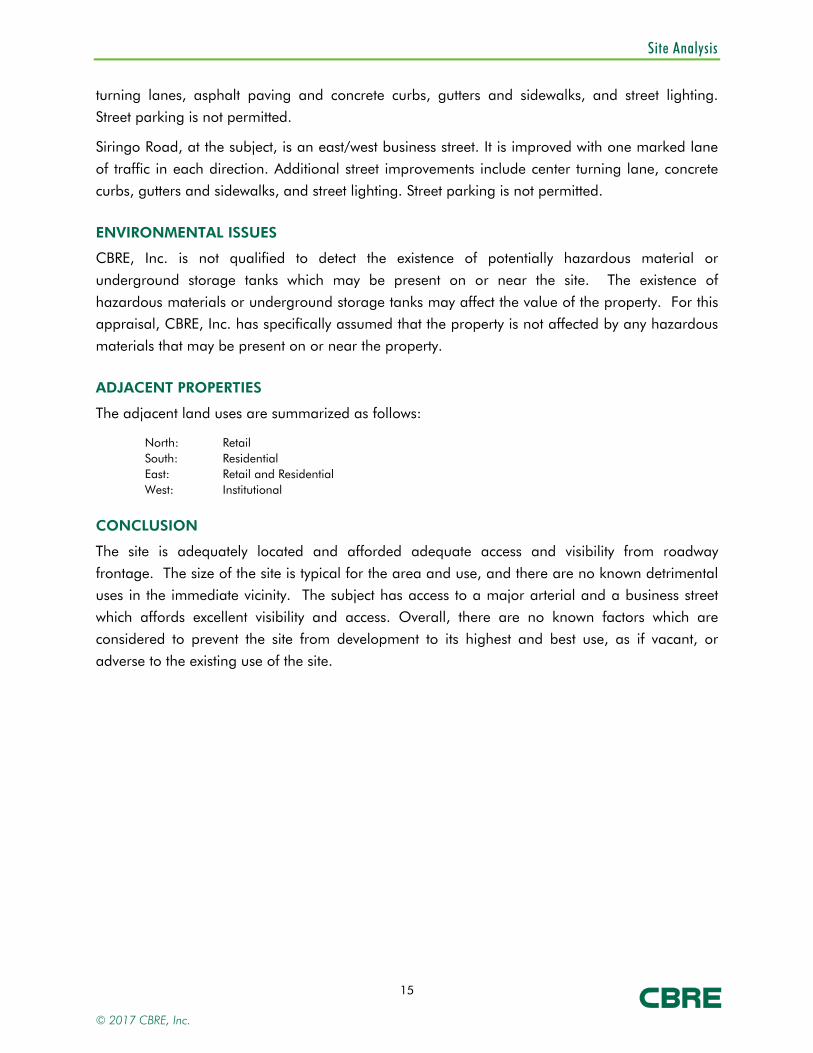
turning lanes, asphalt paving and concrete curbs, gutters and sidewalks, and street lighting.
Street parking is not permitted.
Siringo Road, at the subject, is an east/west business street. It is improved with one marked lane
of traffic in each direction. Additional street improvements include center turning lane, concrete
curbs, gutters and sidewalks, and street lighting. Street parking is not permitted.
ENVIRONMENTAL ISSUES
CBRE, Inc. is not qualified to detect the existence of potentially hazardous material or
underground storage tanks which may be present on or near the site. The existence of
hazardous materials or underground storage tanks may affect the value of the property. For this appraisal, CBRE, Inc. has specifically assumed that the property is not affected by any hazardous
materials that may be present on or near the property.
ADJACENT PROPERTIES
The adjacent land uses are summarized as follows:
North: Retail South: Residential East: Retail and Residential West: Institutional
CONCLUSION
The site is adequately located and afforded adequate access and visibility from roadway
frontage. The size of the site is typical for the area and use, and there are no known detrimental uses in the immediate vicinity. The subject has access to a major arterial and a business street
which affords excellent visibility and access. Overall, there are no known factors which are
considered to prevent the site from development to its highest and best use, as if vacant, or
adverse to the existing use of the site.
© 2017 CBRE, Inc.

Site Analysis
16
FLOOD PLAIN MAP
© 2017 CBRE, Inc.
Improvements Analysis
17
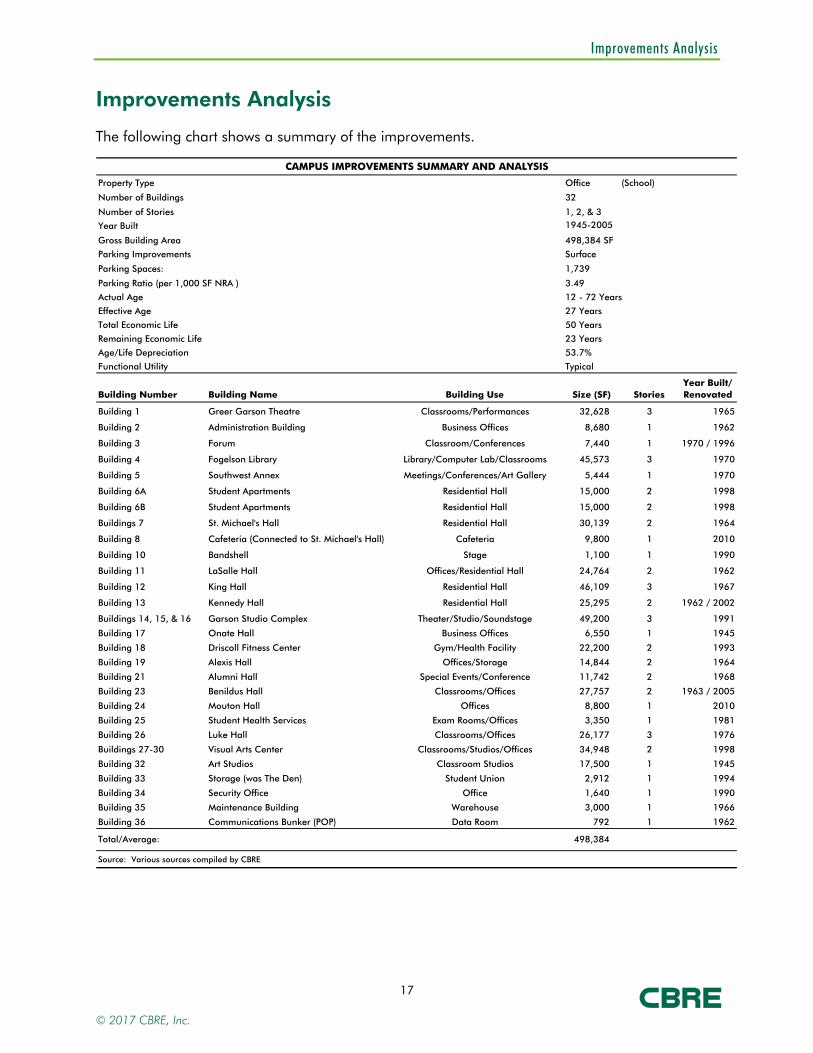
Improvements Analysis
The following chart shows a summary of the improvements.
CAMPUS IMPROVEMENTS SUMMARY AND ANALYSIS
Office
1945-2005 2013
Building Number Building Name Building Use Size (SF) StoriesYear Built/ Renovated
Building 1 Greer Garson Theatre Classrooms/Performances 32,628 3 1965
Building 2 Administration Building Business Offices 8,680 1 1962
Building 3 Forum Classroom/Conferences 7,440 1 1970 / 1996
Building 4 Fogelson Library Library/Computer Lab/Classrooms 45,573 3 1970
Building 5 Southwest Annex Meetings/Conferences/Art Gallery 5,444 1 1970
Building 6A Student Apartments Residential Hall 15,000 2 1998
Building 6B Student Apartments Residential Hall 15,000 2 1998
Buildings 7 St. Michael's Hall Residential Hall 30,139 2 1964
Building 8 Cafeteria (Connected to St. Michael's Hall) Cafeteria 9,800 1 2010
Building 10 Bandshell Stage 1,100 1 1990
Building 11 LaSalle Hall Offices/Residential Hall 24,764 2 1962
Building 12 King Hall Residential Hall 46,109 3 1967
Building 13 Kennedy Hall Residential Hall 25,295 2 1962 / 2002
Buildings 14, 15, & 16 Garson Studio Complex Theater/Studio/Soundstage 49,200 3 1991
Building 17 Onate Hall Business Offices 6,550 1 1945
Building 18 Driscoll Fitness Center Gym/Health Facility 22,200 2 1993
Building 19 Alexis Hall Offices/Storage 14,844 2 1964
Building 21 Alumni Hall Special Events/Conference 11,742 2 1968
Building 23 Benildus Hall Classrooms/Offices 27,757 2 1963 / 2005
Building 24 Mouton Hall Offices 8,800 1 2010
Building 25 Student Health Services Exam Rooms/Offices 3,350 1 1981
Building 26 Luke Hall Classrooms/Offices 26,177 3 1976
Buildings 27-30 Visual Arts Center Classrooms/Studios/Offices 34,948 2 1998
Building 32 Art Studios Classroom Studios 17,500 1 1945
Building 33 Storage (was The Den) Student Union 2,912 1 1994
Building 34 Security Office Office 1,640 1 1990
Building 35 Maintenance Building Warehouse 3,000 1 1966
Building 36 Communications Bunker (POP) Data Room 792 1 1962
Total/Average: 498,384
Source: Various sources compiled by CBRE
(School)Property Type
32
498,384 SF
1, 2, & 3
Number of Buildings
Number of Stories
Gross Building Area
Year Built
Total Economic Life
Parking Spaces:
Functional Utility
Remaining Economic Life
Actual Age
Age/Life Depreciation
Effective Age
3.49Parking Ratio (per 1,000 SF NRA )
1,739
23 Years
53.7%
27 Years
Parking Improvements
50 Years
12 - 72 Years
Typical
Surface
© 2017 CBRE, Inc.

Improvements Analysis
18
CAMPUS IMPROVEMENTS SUMMARY AND ANALYSIS
Property Type #1 Greer Garson Theatre (School)
1965
Comparative RatingImprovement Summary Description Good Avg. Fair Poor
Foundation Reinforced concrete perimeter / column pad footing
X
Frame Masonry / concrete X
Exterior Walls Exposed concrete X
Interior Walls Brick / wood / painted drywall & X
Roof Single layer rubber membrane X
Ceiling Acoustical tile / wood / painted X
HVAC System Roof mounted HVAC /
X
Exterior Lighting Incandescent fixtures X
Interior Lighting Surface mounted & hanging
X
Flooring Carpet / terrazzo / vinyl tile X
Plumbing Assumed adequate X
Elevators/Stairwells Stairway (1) X
Fire Protection Smoke detectors/sprinklers X
Furnishings Personal property excluded N/A
Source: Various sources compiled by CBRE
Classrooms/Performance
Age/Life Depreciation 80%
Functional Utility Average
Effective Age 40 Years
Total Economic Life 50 Years
Remaining Economic Life 10 Years
Year Built
Actual Age 52 Years
Gross Building Area 32,628 SF
Number of Buildings 1
Number of Stories 3
© 2017 CBRE, Inc.
Improvements Analysis
19
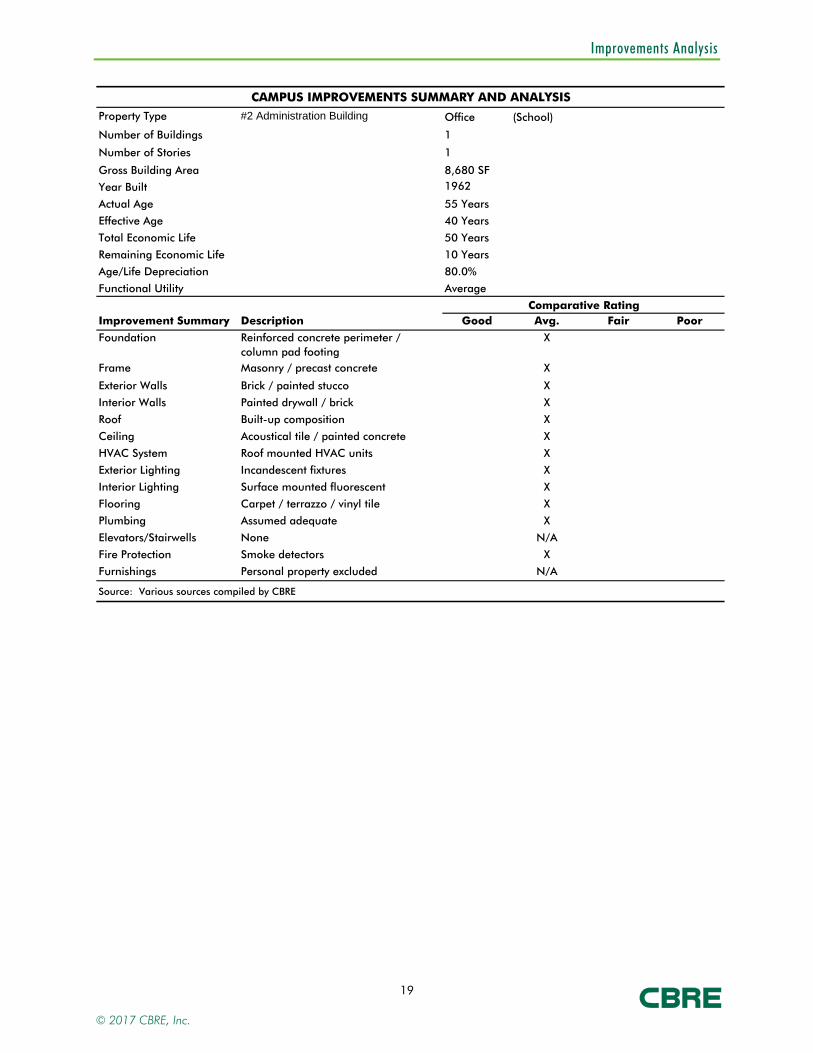
CAMPUS IMPROVEMENTS SUMMARY AND ANALYSIS
Property Type #2 Administration Building Office
1962
Comparative RatingImprovement Summary Description Good Avg. Fair Poor
Foundation Reinforced concrete perimeter / column pad footing
X
Frame Masonry / precast concrete X
Exterior Walls Brick / painted stucco X
Interior Walls Painted drywall / brick X
Roof Built-up composition X
Ceiling Acoustical tile / painted concrete X
HVAC System Roof mounted HVAC units X
Exterior Lighting Incandescent fixtures X
Interior Lighting Surface mounted fluorescent X
Flooring Carpet / terrazzo / vinyl tile X
Plumbing Assumed adequate X
Elevators/Stairwells None N/A
Fire Protection Smoke detectors X
Furnishings Personal property excluded N/A
Source: Various sources compiled by CBRE
Age/Life Depreciation 80.0%
Functional Utility Average
Effective Age 40 Years
Total Economic Life 50 Years
Remaining Economic Life 10 Years
Year Built
Actual Age 55 Years
Gross Building Area 8,680 SF
(School)
Number of Buildings 1
Number of Stories 1
© 2017 CBRE, Inc.
Improvements Analysis
20
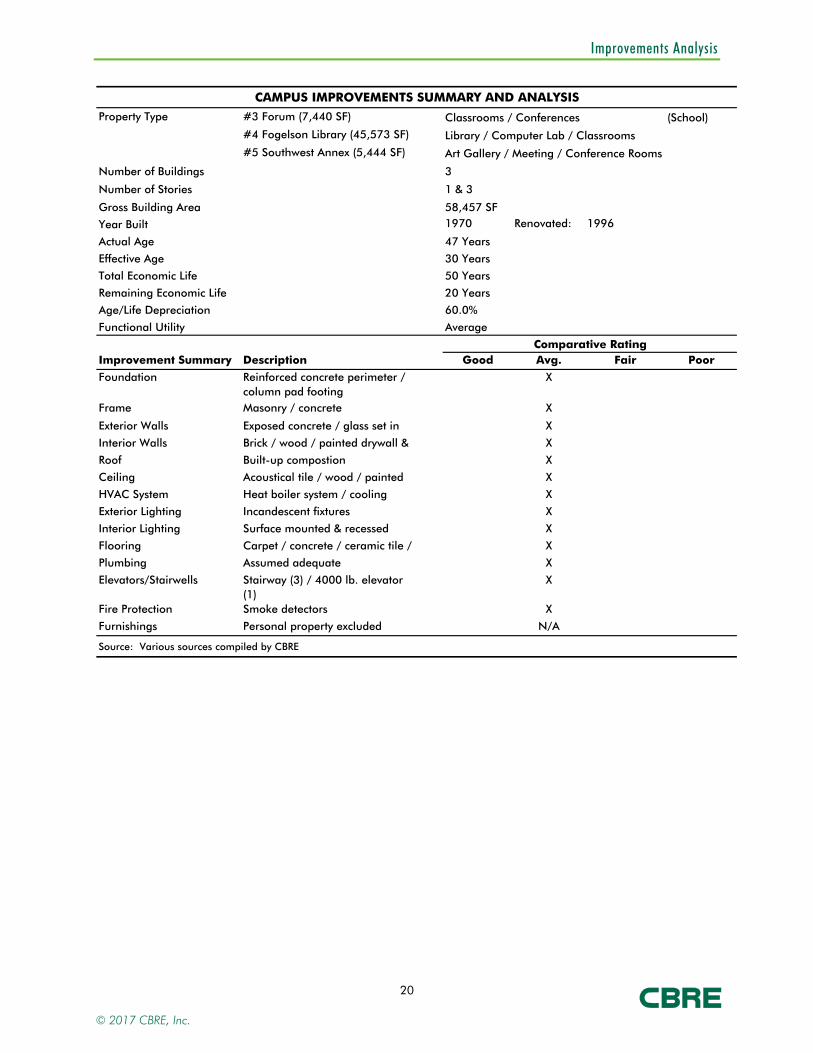
CAMPUS IMPROVEMENTS SUMMARY AND ANALYSIS
Property Type #3 Forum (7,440 SF) Classrooms / Conferences (School)
#4 Fogelson Library (45,573 SF) Library / Computer Lab / Classrooms
#5 Southwest Annex (5,444 SF) Art Gallery / Meeting / Conference Rooms
1970 Renovated:
1996
Comparative RatingImprovement Summary Description Good Avg. Fair Poor
Foundation Reinforced concrete perimeter / column pad footing
X
Frame Masonry / concrete X
Exterior Walls Exposed concrete / glass set in
X
Interior Walls Brick / wood / painted drywall & X
Roof Built-up compostion X
Ceiling Acoustical tile / wood / painted X
HVAC System Heat boiler system / cooling
X
Exterior Lighting Incandescent fixtures X
Interior Lighting Surface mounted & recessed
X
Flooring Carpet / concrete / ceramic tile /
X
Plumbing Assumed adequate X
Elevators/Stairwells Stairway (3) / 4000 lb. elevator (1)
X
Fire Protection Smoke detectors X
Furnishings Personal property excluded N/A
Source: Various sources compiled by CBRE
Number of Buildings 3
Number of Stories 1 & 3
Gross Building Area 58,457 SF
Year Built
Actual Age 47 Years
Age/Life Depreciation 60.0%
Functional Utility Average
Effective Age 30 Years
Total Economic Life 50 Years
Remaining Economic Life 20 Years
© 2017 CBRE, Inc.
Improvements Analysis
21
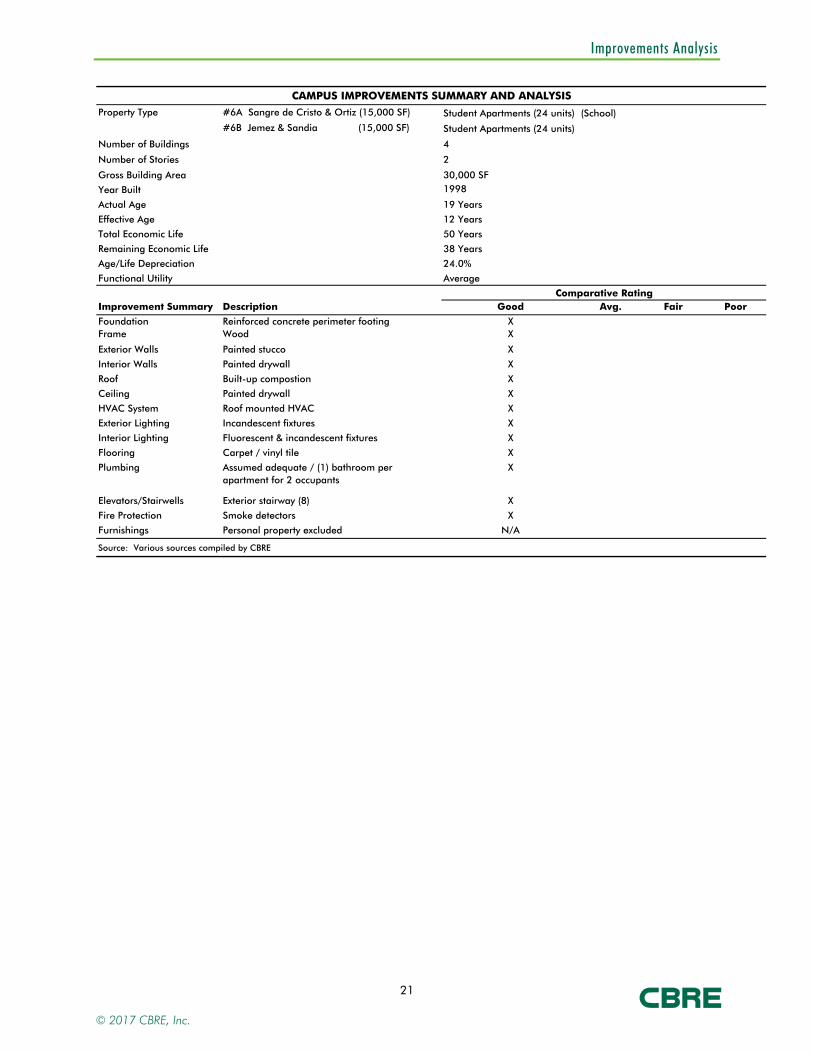
CAMPUS IMPROVEMENTS SUMMARY AND ANALYSIS
Property Type #6A Sangre de Cristo & Ortiz (15,000 SF) Student Apartments (24 units)
#6B Jemez & Sandia (15,000 SF) Student Apartments (24 units)
1998
Comparative RatingImprovement Summary Description Good Avg. Fair Poor
Foundation Reinforced concrete perimeter footing X Frame Wood X
Exterior Walls Painted stucco X
Interior Walls Painted drywall X
Roof Built-up compostion X
Ceiling Painted drywall X
HVAC System Roof mounted HVAC X
Exterior Lighting Incandescent fixtures X
Interior Lighting Fluorescent & incandescent fixtures X
Flooring Carpet / vinyl tile X
Plumbing Assumed adequate / (1) bathroom per apartment for 2 occupants
X
Elevators/Stairwells Exterior stairway (8) X
Fire Protection Smoke detectors X
Furnishings Personal property excluded N/A
Source: Various sources compiled by CBRE
(School)
Number of Buildings 4
Number of Stories 2
Gross Building Area 30,000 SF
Year Built
Actual Age 19 Years
Age/Life Depreciation 24.0%
Functional Utility Average
Effective Age 12 Years
Total Economic Life 50 Years
Remaining Economic Life 38 Years
© 2017 CBRE, Inc.
Improvements Analysis
22
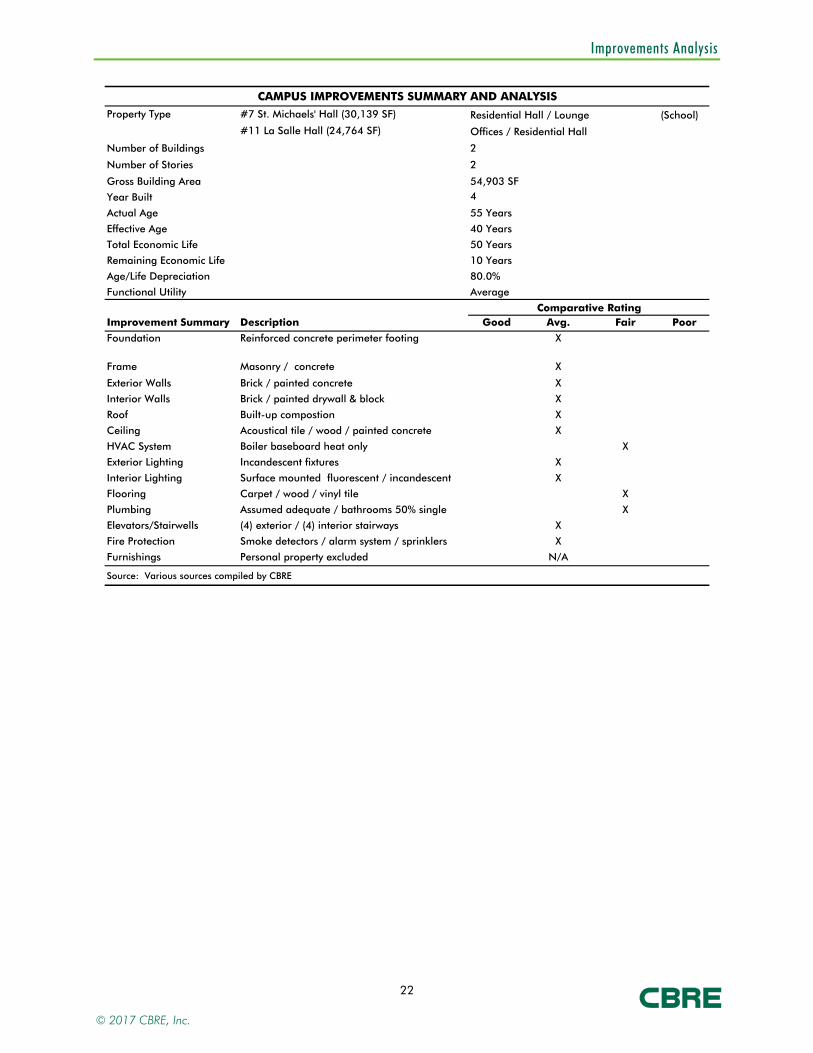
CAMPUS IMPROVEMENTS SUMMARY AND ANALYSIS
Property Type #7 St. Michaels' Hall (30,139 SF) Residential Hall / Lounge (School)
#11 La Salle Hall (24,764 SF) Offices / Residential Hall
4
Comparative RatingImprovement Summary Description Good Avg. Fair Poor
Foundation Reinforced concrete perimeter footing X
Frame Masonry / concrete X
Exterior Walls Brick / painted concrete X
Interior Walls Brick / painted drywall & block X
Roof Built-up compostion X
Ceiling Acoustical tile / wood / painted concrete X
HVAC System Boiler baseboard heat only X
Exterior Lighting Incandescent fixtures X
Interior Lighting Surface mounted fluorescent / incandescent X
Flooring Carpet / wood / vinyl tile X
Plumbing Assumed adequate / bathrooms 50% single
X
Elevators/Stairwells (4) exterior / (4) interior stairways X
Fire Protection Smoke detectors / alarm system / sprinklers X
Furnishings Personal property excluded N/A
Source: Various sources compiled by CBRE
Age/Life Depreciation 80.0%
Functional Utility Average
Effective Age 40 Years
Total Economic Life 50 Years
Remaining Economic Life 10 Years
Year Built
Actual Age 55 Years
Gross Building Area 54,903 SF
Number of Buildings 2
Number of Stories 2
© 2017 CBRE, Inc.
Improvements Analysis
23
CAMPUS IMPROVEMENTS SUMMARY AND ANALYSIS
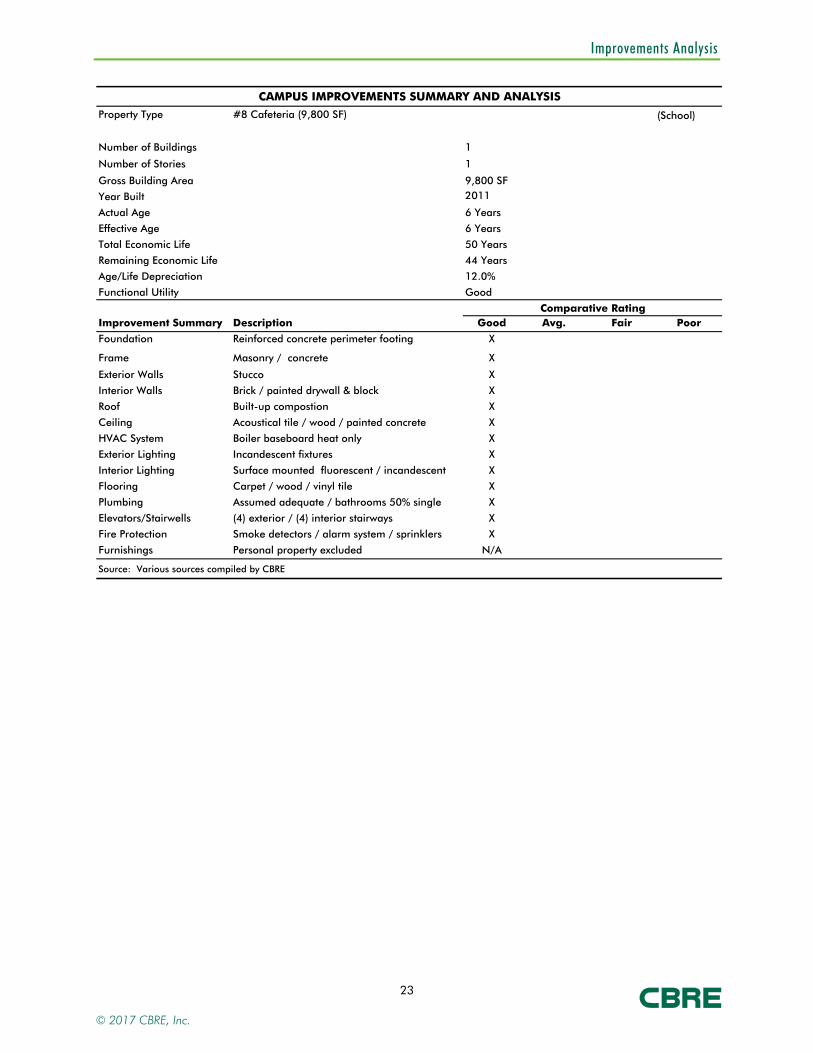
Property Type #8 Cafeteria (9,800 SF) (School)
2011
Comparative RatingImprovement Summary Description Good Avg. Fair Poor
Foundation Reinforced concrete perimeter footing X
Frame Masonry / concrete X
Exterior Walls Stucco X
Interior Walls Brick / painted drywall & block X
Roof Built-up compostion X
Ceiling Acoustical tile / wood / painted concrete X
HVAC System Boiler baseboard heat only X
Exterior Lighting Incandescent fixtures X
Interior Lighting Surface mounted fluorescent / incandescent X
Flooring Carpet / wood / vinyl tile X
Plumbing Assumed adequate / bathrooms 50% single
X
Elevators/Stairwells (4) exterior / (4) interior stairways X
Fire Protection Smoke detectors / alarm system / sprinklers X
Furnishings Personal property excluded N/A
Source: Various sources compiled by CBRE
Number of Buildings 1
Number of Stories 1
Gross Building Area 9,800 SF
Remaining Economic Life 44 Years
Age/Life Depreciation 12.0%
Functional Utility Good
Year Built
Actual Age 6 Years
Effective Age 6 Years
Total Economic Life 50 Years
© 2017 CBRE, Inc.
Improvements Analysis
24
CAMPUS IMPROVEMENTS SUMMARY AND ANALYSIS
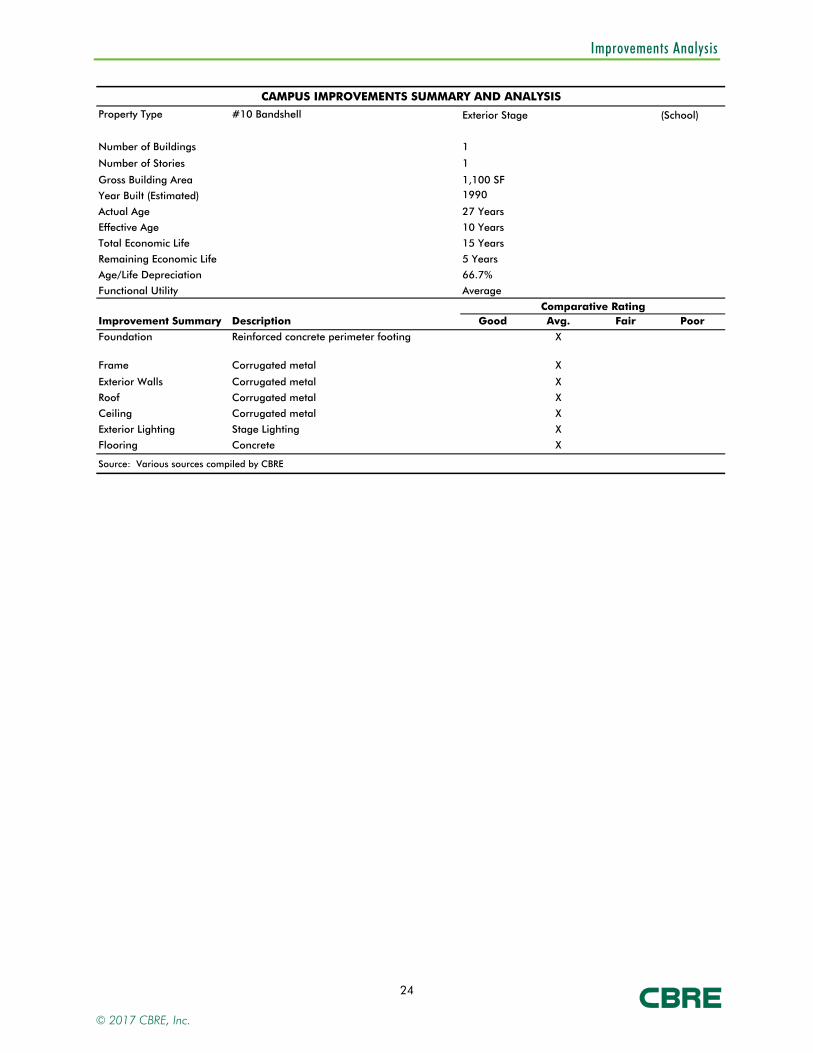
Property Type #10 Bandshell Exterior Stage (School)
1990 Estimated
Comparative RatingImprovement Summary Description Good Avg. Fair Poor
Foundation Reinforced concrete perimeter footing X
Frame Corrugated metal X
Exterior Walls Corrugated metal X
Roof Corrugated metal X
Ceiling Corrugated metal X
Exterior Lighting Stage Lighting X
Flooring Concrete X
Source: Various sources compiled by CBRE
Number of Buildings 1
Number of Stories 1
Gross Building Area 1,100 SF
Remaining Economic Life 5 Years
Age/Life Depreciation 66.7%
Functional Utility Average
Year Built (Estimated)
Actual Age 27 Years
Effective Age 10 Years
Total Economic Life 15 Years
© 2017 CBRE, Inc.
Improvements Analysis
25
CAMPUS IMPROVEMENTS SUMMARY AND ANALYSIS
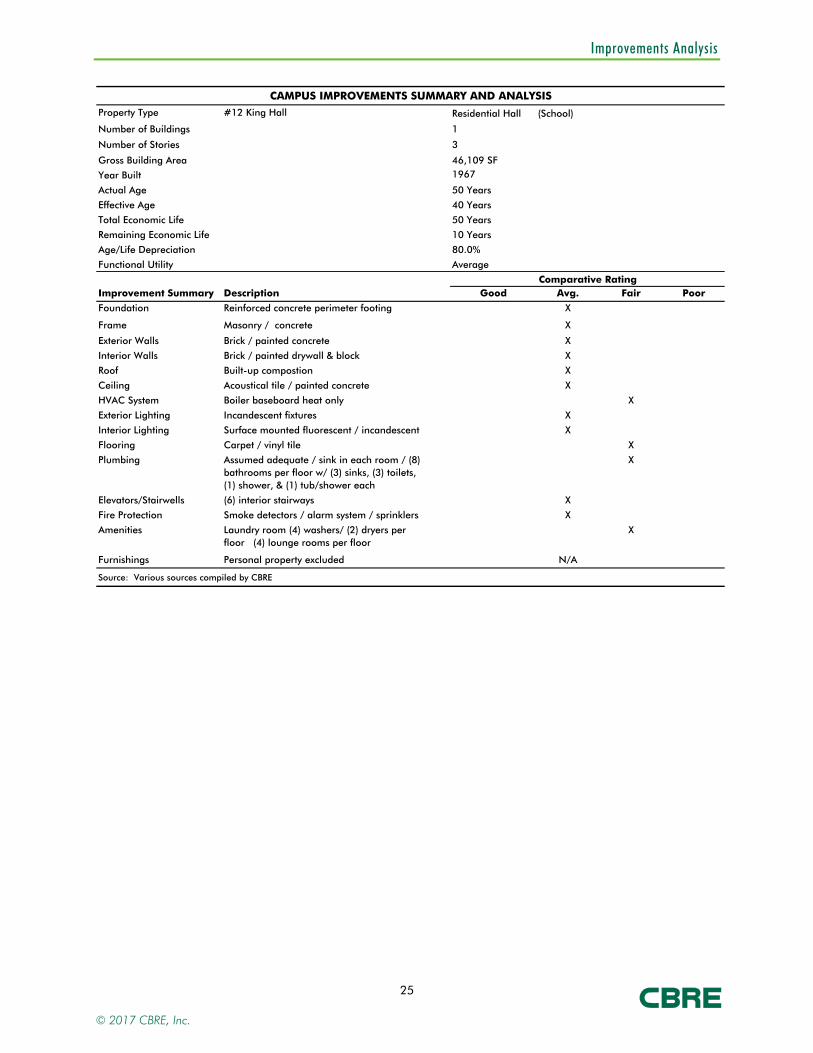
Property Type #12 King Hall Residential Hall
1967
Comparative RatingImprovement Summary Description Good Avg. Fair Poor
Foundation Reinforced concrete perimeter footing X
Frame Masonry / concrete X
Exterior Walls Brick / painted concrete X
Interior Walls Brick / painted drywall & block X
Roof Built-up compostion X
Ceiling Acoustical tile / painted concrete X
HVAC System Boiler baseboard heat only X
Exterior Lighting Incandescent fixtures X
Interior Lighting Surface mounted fluorescent / incandescent X
Flooring Carpet / vinyl tile X
Plumbing Assumed adequate / sink in each room / (8) bathrooms per floor w/ (3) sinks, (3) toilets, (1) shower, & (1) tub/shower each
X
Elevators/Stairwells (6) interior stairways X
Fire Protection Smoke detectors / alarm system / sprinklers X
Amenities Laundry room (4) washers/ (2) dryers per floor (4) lounge rooms per floor
X
Furnishings Personal property excluded N/A
Source: Various sources compiled by CBRE
Age/Life Depreciation 80.0%
Functional Utility Average
Effective Age 40 Years
Total Economic Life 50 Years
Remaining Economic Life 10 Years
Year Built
Actual Age 50 Years
Gross Building Area 46,109 SF
(School)
Number of Buildings 1
Number of Stories 3
© 2017 CBRE, Inc.

Improvements Analysis
26
CAMPUS IMPROVEMENTS SUMMARY AND ANALYSIS
Property Type #13 Kennedy Hall Residential Hall
1962 Renovated: 2002
Comparative RatingImprovement Summary Description Good Avg. Fair Poor
Foundation Reinforced concrete perimeter footing XFrame Masonry / concrete X
Exterior Walls Painted stucco X
Interior Walls Brick / painted drywall & block X
Roof Built-up compostion X
Ceiling Suspended & glue-on acoustical tile / painted
X
HVAC System Roof mounted HVAC for community space /
X
Exterior Lighting Incandescent fixtures X
Interior Lighting Surface mounted fluorescent / incandescent X
Flooring Carpet / vinyl tile X
Plumbing Assumed adequate / sink in each room / (4) bathrooms per floor w/ (3) sinks, (5) toilets, & (4) showers each
X
Elevators/Stairwells (2) interior / (2) exterior stairways X
Fire Protection Smoke detectors / alarm system / fire sprinkler X
Amenities (2) lounge rooms / 2 washers & dryers per floor X
Furnishings Personal property excluded N/A
Source: Various sources compiled by CBRE
Age/Life Depreciation 70.0%
Functional Utility Average
Effective Age 35 Years
Total Economic Life 50 Years
Remaining Economic Life 15 Years
Year Built
Actual Age 55 Years
Gross Building Area 25,295 SF
(School)
Number of Buildings 1
Number of Stories 2
© 2017 CBRE, Inc.

Improvements Analysis
27
CAMPUS IMPROVEMENTS SUMMARY AND ANALYSIS
Property Type #14, 15, & 16 Garson Studio Complex Theater/Studio/Soundstage
1991
Comparative RatingImprovement Summary Description Good Avg. Fair Poor
Foundation Reinforced concrete perimeter / column pad footing X
Frame Masonry / concrete / steel X
Exterior Walls Painted stucco X
Interior Walls Painted drywall & block / acoustical panels X
Roof Built-up composition X
Ceiling Suspended acoustical tile / exposed structure X
HVAC System Roof mounted HVAC units X
Exterior Lighting Incandescent fixtures X
Interior Lighting Recessed & hanging fluorescent / incandescent / PAR theaterical / HID fixtures
X
Flooring Carpet / wood / vinyl tile X
Plumbing Assumed adequate X
Elevators/Stairwells Stairway (2) / elevator 2,100 lb. (1) X
Fire Protection Smoke detectors / sprinklers X Amenities Movie theater / (2) sound stages / showers / laundry
/ observation booth / sound booth / TV control roomX
Furnishings Personal property excluded N/A
Source: Various sources compiled by CBRE
(School)
Number of Buildings 1
Number of Stories 3
Gross Building Area 49,200 SF
Year Built
Actual Age 26 Years
Age/Life Depreciation 40.0%
Functional Utility Average
Effective Age 20 Years
Total Economic Life 50 Years
Remaining Economic Life 30 Years
© 2017 CBRE, Inc.

Improvements Analysis
28
CAMPUS IMPROVEMENTS SUMMARY AND ANALYSISProperty Type #17 Onate Hall (6,550 SF) Business Offices (School)
1945 Renovated: 2013
IMPROVEMENT DESCRIPTION & RATINGOnate Hall Comparative RatingImprovement Summary Description Good Avg. Fair Poor
Foundation Reinforced concrete perimeter footing X
Frame Wood X
Exterior Walls Painted transite (w/ asbestos) & stucco X
Interior Walls Painted drywall and wood panels X
Roof Built-up compsition / rolled asphalt X
Ceiling Painted drywall / wood X
HVAC System Gas heaters / evaporative cooler X
Exterior Lighting Incandescent fixtures X
Interior Lighting Surface mounted & hanging fluorescent / incandescent track fixtures
X
Flooring Carpet / vinyl & ceramic tile / wood X
Plumbing Assumed adequate X
Elevators/Stairwells None N/A
Fire Protection Smoke detectors X
Furnishings Personal property excluded N/A
Source: Various sources compiled by CBRE
Year BuiltGross Building Area 6,550 SF
Number of Buildings 1
Number of Stories 1
© 2017 CBRE, Inc.
Improvements Analysis
29
CAMPUS IMPROVEMENTS SUMMARY AND ANALYSIS
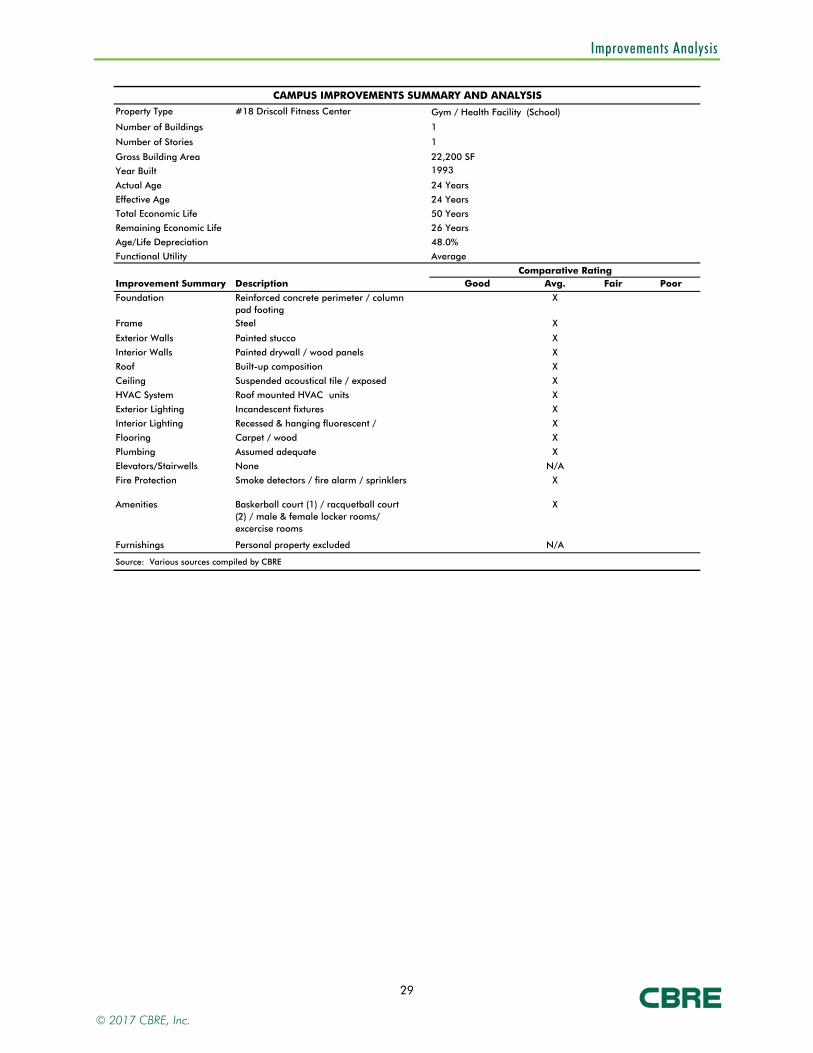
Property Type #18 Driscoll Fitness Center Gym / Health Facility
1993
Comparative RatingImprovement Summary Description Good Avg. Fair Poor
Foundation Reinforced concrete perimeter / column pad footing
X
Frame Steel X
Exterior Walls Painted stucco X
Interior Walls Painted drywall / wood panels X
Roof Built-up composition X
Ceiling Suspended acoustical tile / exposed X
HVAC System Roof mounted HVAC units X
Exterior Lighting Incandescent fixtures X
Interior Lighting Recessed & hanging fluorescent /
X
Flooring Carpet / wood X
Plumbing Assumed adequate X
Elevators/Stairwells None N/A
Fire Protection Smoke detectors / fire alarm / sprinklers X
Amenities Baskerball court (1) / racquetball court (2) / male & female locker rooms/ excercise rooms
X
Furnishings Personal property excluded N/A
Source: Various sources compiled by CBRE
Age/Life Depreciation 48.0%
Functional Utility Average
Effective Age 24 Years
Total Economic Life 50 Years
Remaining Economic Life 26 Years
Year Built
Actual Age 24 Years
Gross Building Area 22,200 SF
(School)
Number of Buildings 1
Number of Stories 1
© 2017 CBRE, Inc.

Improvements Analysis
30
CAMPUS IMPROVEMENTS SUMMARY AND ANALYSIS
Property Type #19 Alexis Hall Offices/Art Studio/Computer lab
1964
Comparative RatingImprovement Summary Description Good Avg. Fair Poor
Foundation Reinforced concrete perimeter footing
X
Frame Masonry X
Exterior Walls Painted concrete / brick X
Interior Walls Painted drywall X
Roof Built-up composition X
Ceiling Suspended acoustical grid X
HVAC System Ground mounted HVAC units X
Exterior Lighting Incandescent fixtures X
Interior Lighting Recessed fluorescent &
X
Flooring Concrete / carpet X
Plumbing Assumed adequate X
Elevators/Stairwells Stairways (2) X
Fire Protection Smoke detectors X
Amenities Basement X
Furnishings Personal property excluded N/A
Source: Various sources compiled by CBRE
Age/Life Depreciation 80.0%
Functional Utility Average
Effective Age 40 Years
Total Economic Life 50 Years
Remaining Economic Life 10 Years
Year Built
Actual Age 53 Years
Gross Building Area 14,844 SF
(School)
Number of Buildings 1
Number of Stories 3
© 2017 CBRE, Inc.

Improvements Analysis
31
CAMPUS IMPROVEMENTS SUMMARY AND ANALYSIS
Property Type #21 Alumni Hall Special Events/Conference
1968
Comparative RatingImprovement Summary Description Good Avg. Fair Poor
Foundation Reinforced concrete perimeter / column pad footing
X
Frame Steel / masonry X
Exterior Walls Corrugated metal / brick X
Interior Walls Painted drywall / corrugated metal
X
Roof Corrugated metal X
Ceiling Suspended acoustical tile / exposed structure
X
HVAC System Gas space heaters / roof mounted evaporative coolers
X
Exterior Lighting Incandescent fixtures X
Interior Lighting Hanging fluorescent / HID fixtures
X
Flooring Ceramic & vinyl tile X
Plumbing Assumed adequate X
Elevators/Stairwells None N/A
Fire Protection Smoke detectors / dry sprinkler in cooking hood
X
Amenities Kitchen facility X
Furnishings Personal property excluded N/A
Source: Various sources compiled by CBRE
Age/Life Depreciation 80.0%
Functional Utility Average
Effective Age 40 Years
Total Economic Life 50 Years
Remaining Economic Life 10 Years
Year Built
Actual Age 49 Years
Gross Building Area 11,742 SF
(School)
Number of Buildings 1
Number of Stories 1
© 2017 CBRE, Inc.

Improvements Analysis
32
CAMPUS IMPROVEMENTS SUMMARY AND ANALYSIS
Property Type #23 Benildus Hall Classrooms/Offices
1963 / 2005
Comparative RatingImprovement Summary Description Good Avg. Fair Poor
Foundation Reinforced concrete perimeter / column pad footing
X
Frame Masonry X
Exterior Walls Painted stucco / stone / brick X
Interior Walls Painted drywall / glazed block X
Roof Built-up compostion X
Ceiling Painted drywall / suspended
X
HVAC System Roof mounted HVAC units X
Exterior Lighting Incandescent fixtures X
Interior Lighting Recessed fluorescent &
X
Flooring Terrazzo / carpet X
Plumbing Assumed adequate X
Elevators/Stairwells Stairway (4) / elevator 2,500 lb. (1) X
Fire Protection Smoke detectors / sprinklers / alarm system
X
Amenities Multi-purpose room / music studios
X
Furnishings Personal property excluded N/A
Source: Various sources compiled by CBRE
(School)
Number of Buildings 1
Number of Stories 2
Gross Building Area 27,757 SF
Year Built
Actual Age 12/54 Years
Age/Life Depreciation 40.0%
Functional Utility Good
Effective Age 20 Years
Total Economic Life 50 Years
Remaining Economic Life 30 Years
© 2017 CBRE, Inc.
Improvements Analysis
33
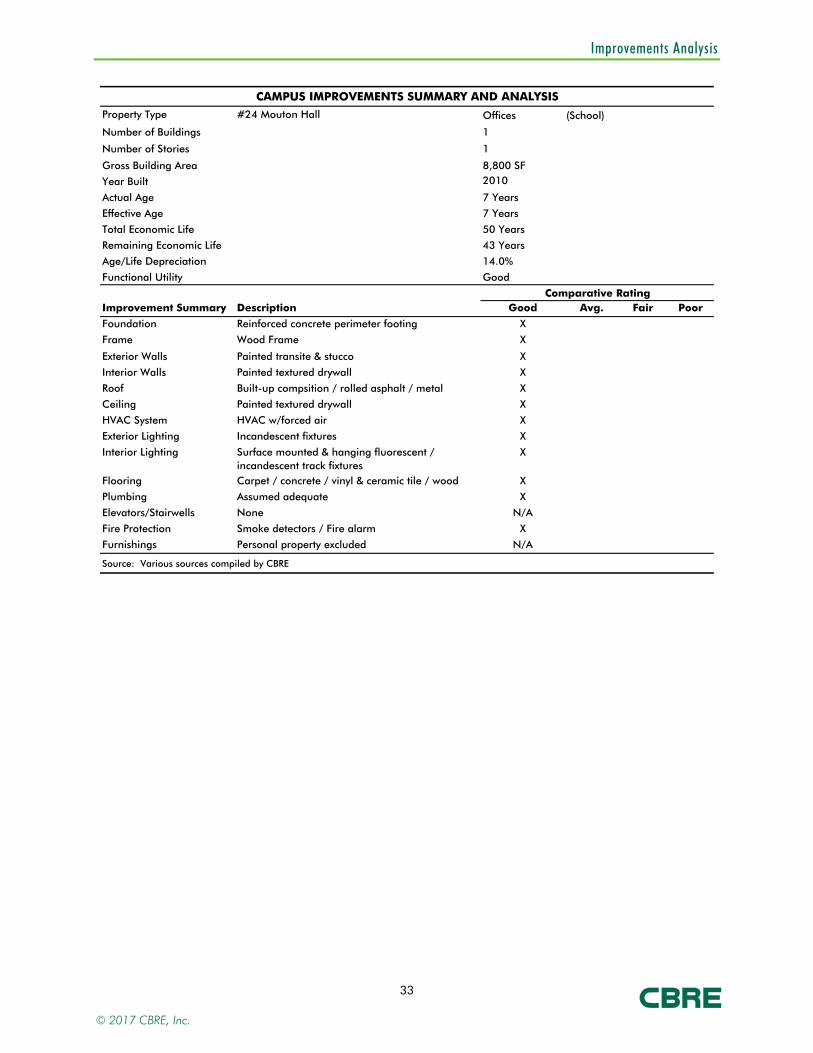
CAMPUS IMPROVEMENTS SUMMARY AND ANALYSIS
Property Type #24 Mouton Hall Offices (School)
2010
Comparative RatingImprovement Summary Description Good Avg. Fair Poor
Foundation Reinforced concrete perimeter footing X
Frame Wood Frame X
Exterior Walls Painted transite & stucco X
Interior Walls Painted textured drywall X
Roof Built-up compsition / rolled asphalt / metal X
Ceiling Painted textured drywall X
HVAC System HVAC w/forced air X
Exterior Lighting Incandescent fixtures X
Interior Lighting Surface mounted & hanging fluorescent / incandescent track fixtures
X
Flooring Carpet / concrete / vinyl & ceramic tile / wood X
Plumbing Assumed adequate X
Elevators/Stairwells None N/A
Fire Protection Smoke detectors / Fire alarm X
Furnishings Personal property excluded N/A
Source: Various sources compiled by CBRE
Age/Life Depreciation 14.0%
Functional Utility Good
Effective Age 7 Years
Total Economic Life 50 Years
Remaining Economic Life 43 Years
Year Built
Actual Age 7 Years
Gross Building Area 8,800 SF
Number of Buildings 1
Number of Stories 1
© 2017 CBRE, Inc.
Improvements Analysis
34
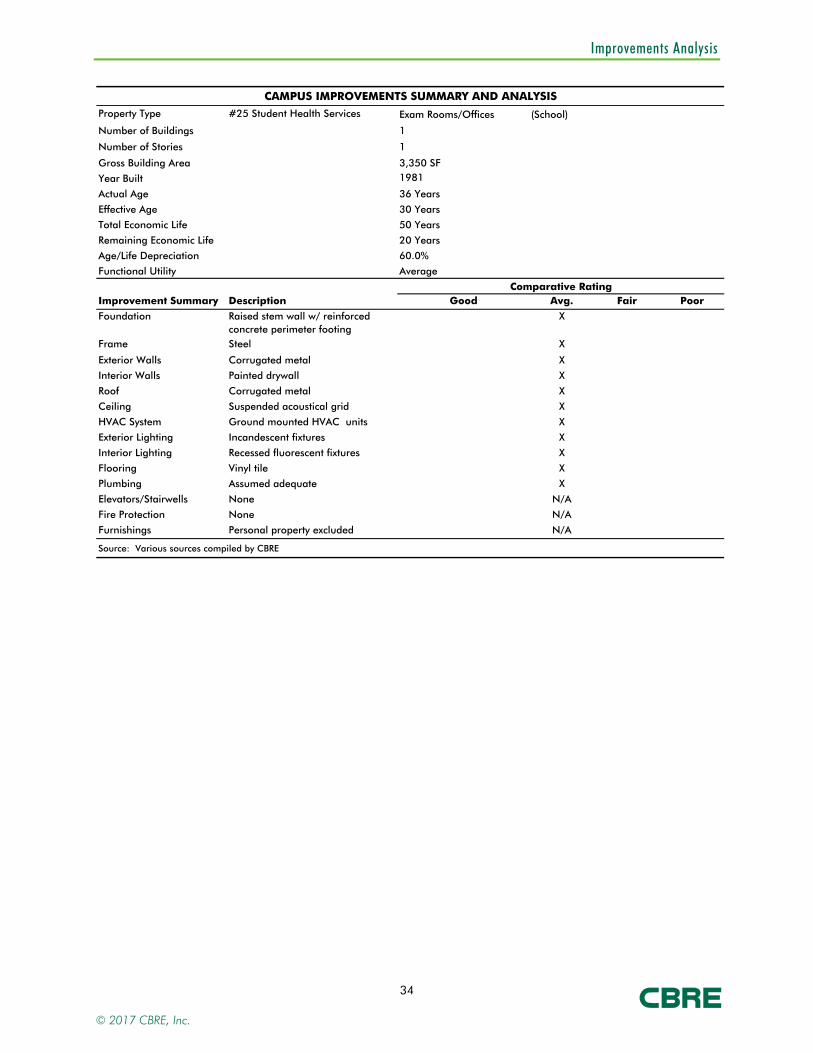
CAMPUS IMPROVEMENTS SUMMARY AND ANALYSIS
Property Type #25 Student Health Services Exam Rooms/Offices
1981
Comparative RatingImprovement Summary Description Good Avg. Fair Poor
Foundation Raised stem wall w/ reinforced concrete perimeter footing
X
Frame Steel X
Exterior Walls Corrugated metal X
Interior Walls Painted drywall X
Roof Corrugated metal X
Ceiling Suspended acoustical grid X
HVAC System Ground mounted HVAC units X
Exterior Lighting Incandescent fixtures X
Interior Lighting Recessed fluorescent fixtures X
Flooring Vinyl tile X
Plumbing Assumed adequate X
Elevators/Stairwells None N/A
Fire Protection None N/A
Furnishings Personal property excluded N/A
Source: Various sources compiled by CBRE
Age/Life Depreciation 60.0%
Functional Utility Average
Effective Age 30 Years
Total Economic Life 50 Years
Remaining Economic Life 20 Years
Year Built
Actual Age 36 Years
Gross Building Area 3,350 SF
(School)
Number of Buildings 1
Number of Stories 1
© 2017 CBRE, Inc.

Improvements Analysis
35
CAMPUS IMPROVEMENTS SUMMARY AND ANALYSIS
Property Type #26 Luke Hall Art Studios / Offices
1976
Comparative RatingImprovement Summary Description Good Avg. Fair Poor
Foundation Reinforced concrete perimeter / column pad footing
X
Frame Concrete / masonry X
Exterior Walls Textured concrete / painted stucco X
Interior Walls Painted drywall X
Roof Built-up composition X
Ceiling Suspended acoustical grid X
HVAC System Boiler heat / chiller cooling X
Exterior Lighting Incandescent fixtures X
Interior Lighting Recessed fluorescent fixtures X
Flooring Vinyl tile / carpet / painted X
Plumbing Assumed adequate X
Elevators/Stairwells Stairways (2) / elevator 2,100 lb. (1)
X
Fire Protection Smoke detectors / alarm system X
Furnishings Personal property excluded N/A
Source: Various sources compiled by CBRE
(School)
Number of Buildings 1
Number of Stories 3
Gross Building Area 26,177 SF
Year Built
Actual Age 41 Years
Age/Life Depreciation 80.0%
Functional Utility Poor
Effective Age 40 Years
Total Economic Life 50 Years
Remaining Economic Life 10 Years
© 2017 CBRE, Inc.
Improvements Analysis
36
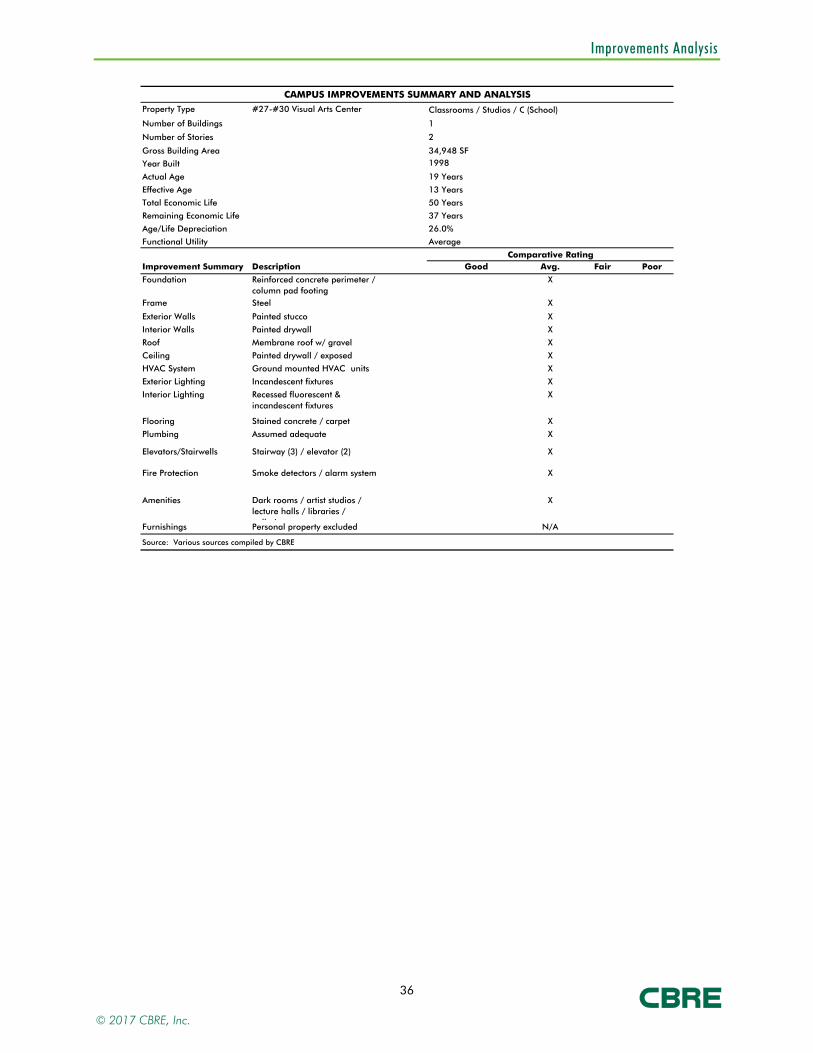
CAMPUS IMPROVEMENTS SUMMARY AND ANALYSIS
Property Type #27-#30 Visual Arts Center Classrooms / Studios / O
1998
Comparative RatingImprovement Summary Description Good Avg. Fair Poor
Foundation Reinforced concrete perimeter / column pad footing
X
Frame Steel X
Exterior Walls Painted stucco X
Interior Walls Painted drywall X
Roof Membrane roof w/ gravel X
Ceiling Painted drywall / exposed X
HVAC System Ground mounted HVAC units X
Exterior Lighting Incandescent fixtures X
Interior Lighting Recessed fluorescent & incandescent fixtures
X
Flooring Stained concrete / carpet X
Plumbing Assumed adequate X
Elevators/Stairwells Stairway (3) / elevator (2) X
Fire Protection Smoke detectors / alarm system X
Amenities Dark rooms / artist studios / lecture halls / libraries /
ll i
X
Furnishings Personal property excluded N/A
Source: Various sources compiled by CBRE
(School)
Number of Buildings 1
Number of Stories 2
Gross Building Area 34,948 SF
Year Built
Actual Age 19 Years
Age/Life Depreciation 26.0%
Functional Utility Average
Effective Age 13 Years
Total Economic Life 50 Years
Remaining Economic Life 37 Years
© 2017 CBRE, Inc.
Improvements Analysis
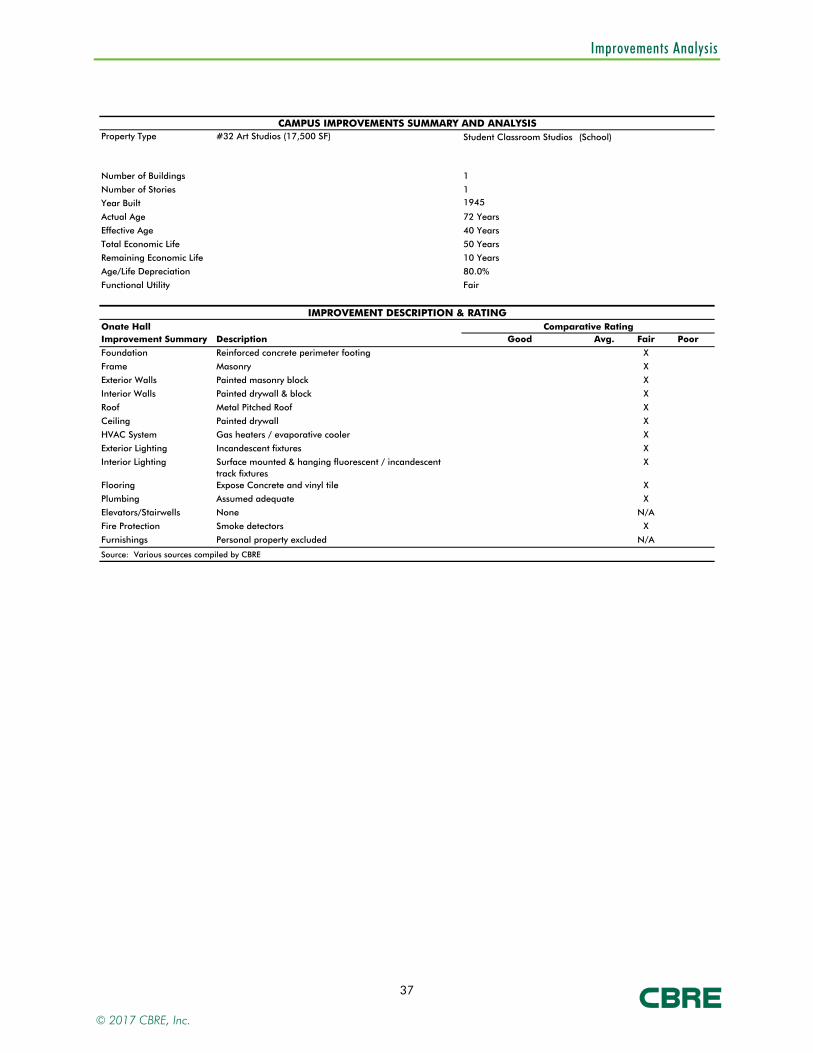
37
CAMPUS IMPROVEMENTS SUMMARY AND ANALYSISProperty Type #32 Art Studios (17,500 SF) Student Classroom Studios (School)
1945
IMPROVEMENT DESCRIPTION & RATINGOnate Hall Comparative RatingImprovement Summary Description Good Avg. Fair Poor
Foundation Reinforced concrete perimeter footing X
Frame Masonry X
Exterior Walls Painted masonry block X
Interior Walls Painted drywall & block X
Roof Metal Pitched Roof X
Ceiling Painted drywall X
HVAC System Gas heaters / evaporative cooler X
Exterior Lighting Incandescent fixtures X
Interior Lighting Surface mounted & hanging fluorescent / incandescent track fixtures
X
Flooring Expose Concrete and vinyl tile X
Plumbing Assumed adequate X
Elevators/Stairwells None N/A
Fire Protection Smoke detectors X
Furnishings Personal property excluded N/A
Source: Various sources compiled by CBRE
Total Economic Life 50 Years
Remaining Economic Life 10 Years
Age/Life Depreciation 80.0%
Functional Utility Fair
Year Built
Actual Age 72 Years
Effective Age 40 Years
Number of Buildings 1
Number of Stories 1
© 2017 CBRE, Inc.

Improvements Analysis
38
CAMPUS IMPROVEMENTS SUMMARY AND ANALYSIS
Property Type #33 Storage ( formerly The Den) Storage
1994
Comparative RatingImprovement Summary Description Good Avg. Fair Poor
Foundation Raised floor on reinforced concrete column pad footing
X
Frame Wood X
Exterior Walls Painted wood X
Interior Walls Wood paneling X
Roof Corrugated metal X
Ceiling Suspended acoustical tile X
HVAC System Wall mounted HVAC units X
Exterior Lighting Incandescent fixtures X
Interior Lighting Recessed fluorescent fixtures X
Flooring Carpet / vinyl tile X
Plumbing Assumed adequate X
Elevators/Stairwells None N/A
Fire Protection Fire extinguishers X
Furnishings Personal property excluded N/A
Source: Various sources compiled by CBRE
(School)
Number of Buildings 1
Number of Stories 1
Gross Building Area 2,912 SF
Year Built
Actual Age 23 Years
Age/Life Depreciation 57.5%
Functional Utility Fair
Effective Age 23 Years
Total Economic Life 40 Years
Remaining Economic Life 17 Years
© 2017 CBRE, Inc.
Improvements Analysis
39
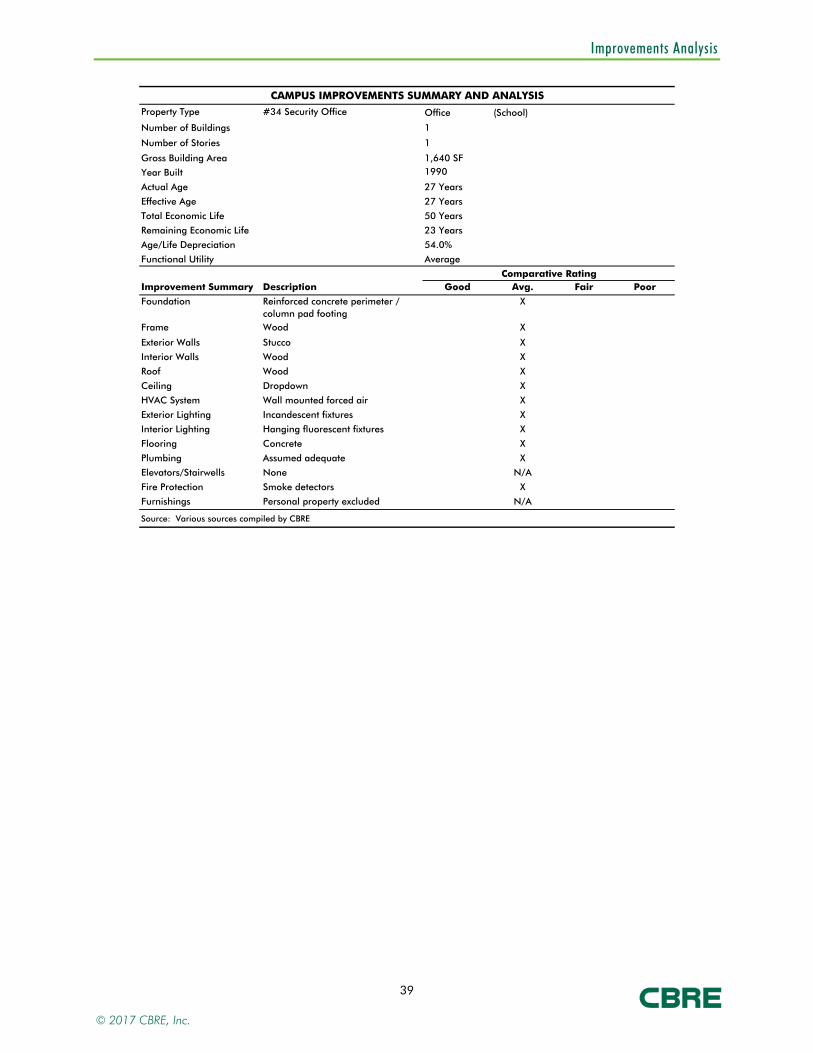
CAMPUS IMPROVEMENTS SUMMARY AND ANALYSIS
Property Type #34 Security Office Office
1990
Comparative RatingImprovement Summary Description Good Avg. Fair Poor
Foundation Reinforced concrete perimeter / column pad footing
X
Frame Wood X
Exterior Walls Stucco X
Interior Walls Wood X
Roof Wood X
Ceiling Dropdown X
HVAC System Wall mounted forced air
X
Exterior Lighting Incandescent fixtures X
Interior Lighting Hanging fluorescent fixtures X
Flooring Concrete X
Plumbing Assumed adequate X
Elevators/Stairwells None N/A
Fire Protection Smoke detectors X
Furnishings Personal property excluded N/A
Source: Various sources compiled by CBRE
(School)
Number of Buildings 1
Number of Stories 1
Gross Building Area 1,640 SF
Year Built
Actual Age 27 Years
Age/Life Depreciation 54.0%
Functional Utility Average
Effective Age 27 Years
Total Economic Life 50 Years
Remaining Economic Life 23 Years
© 2017 CBRE, Inc.

Improvements Analysis
40
CAMPUS IMPROVEMENTS SUMMARY AND ANALYSIS
Property Type #35 Maintenance Building Storage/Maintenance Service
1966
Comparative RatingImprovement S Description Good Avg. Fair Poor
Foundation Reinforced concrete perimeter / column pad footing
X
Frame Steel X
Exterior Walls Corrugated metal X
Interior Walls Corrugated metal X
Roof Corrugated metal X
Ceiling Exposed structure X
HVAC System Wall mounted HVAC units X
Exterior Lighting Incandescent fixtures X
Interior Lighting Hanging fluorescent fixtures X
Flooring Concrete X
Plumbing Assumed adequate X
Elevators/StairweNone N/A
Fire Protection Smoke detectors N/A
Furnishings Personal property excluded N/A
Source: Various sources compiled by CBRE
(School)
Number of Buildings 1
Number of Stories 1
Gross Building Area 3,000 SF
Year Built
Actual Age 51 Years
Age/Life Depreciation 72.0%
Functional Utility Fair
Effective Age 18 Years
Total Economic Life 25 Years
Remaining Economic Life 7 Years
© 2017 CBRE, Inc.

Improvements Analysis
41
CAMPUS IMPROVEMENTS SUMMARY AND ANALYSIS
Property Type #36 Communications Bunker (POP) Subterrenian Data Room
1962
Comparative RatingImprovement Summary Description Good Avg. Fair Poor
Foundation Reinforced concrete perimeter / column pad footing
X
Frame Concrete X
Exterior Walls Rock over Concrete X
Interior Walls Exposed Concrete X
Roof Builtup insulation over Concrete X
Ceiling Exposed Concrete X
HVAC System Ceiling unit X
Exterior Lighting None X
Interior Lighting Incandescent fixtures X
Flooring Concrete X
Plumbing None X
Elevators/Stairwells Stairs N/A
Fire Protection None N/A
Furnishings Personal property excluded N/A
Source: Various sources compiled by CBRE
(School)
Number of Buildings 1
Number of Stories 1
Gross Building Area 792 SF
Year Built (estimated)
Actual Age 55 Years
Age/Life Depreciation 70.0%
Functional Utility Average
Effective Age 35 Years
Total Economic Life 50 Years
Remaining Economic Life 15 Years
© 2017 CBRE, Inc.

Improvements Analysis
42
IMPROVEMENTS LAYOUT
Please note that the numbers the appraisers use for the buildings that are the subject of this
report do not match the building numbers as they appear on the map listed above. In addition,
there are also building that are the subject of this report that are not listed on the map detailed above.
© 2017 CBRE, Inc.
Improvements Analysis
43
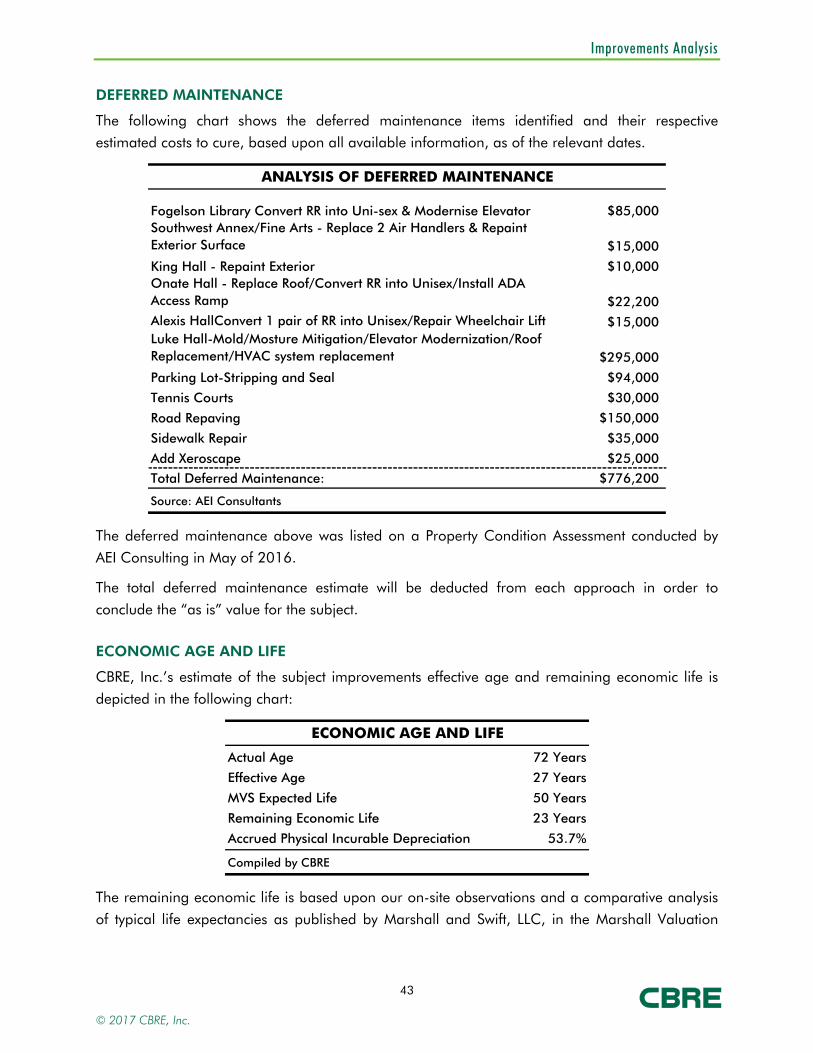
DEFERRED MAINTENANCE
The following chart shows the deferred maintenance items identified and their respective estimated costs to cure, based upon all available information, as of the relevant dates.
ANALYSIS OF DEFERRED MAINTENANCE
Fogelson Library Convert RR into Uni-sex & Modernise Elevator $85,000Southwest Annex/Fine Arts - Replace 2 Air Handlers & Repaint Exterior Surface $15,000
King Hall - Repaint Exterior $10,000Onate Hall - Replace Roof/Convert RR into Unisex/Install ADA Access Ramp $22,200Alexis HallConvert 1 pair of RR into Unisex/Repair Wheelchair Lift $15,000Luke Hall-Mold/Mosture Mitigation/Elevator Modernization/Roof Replacement/HVAC system replacement $295,000
Parking Lot-Stripping and Seal $94,000
Tennis Courts $30,000
Road Repaving $150,000
Sidewalk Repair $35,000
Add Xeroscape $25,000
Total Deferred Maintenance: $776,200
Source: AEI Consultants
The deferred maintenance above was listed on a Property Condition Assessment conducted by
AEI Consulting in May of 2016.
The total deferred maintenance estimate will be deducted from each approach in order to conclude the “as is” value for the subject.
ECONOMIC AGE AND LIFE
CBRE, Inc.’s estimate of the subject improvements effective age and remaining economic life is
depicted in the following chart:
ECONOMIC AGE AND LIFE
Actual Age 72 Years
Effective Age 27 Years
MVS Expected Life 50 Years
Remaining Economic Life 23 Years
Accrued Physical Incurable Depreciation 53.7%
Compiled by CBRE
The remaining economic life is based upon our on-site observations and a comparative analysis
of typical life expectancies as published by Marshall and Swift, LLC, in the Marshall Valuation
© 2017 CBRE, Inc.

Improvements Analysis
44
Service cost guide. While CBRE, Inc. did not observe anything to suggest a different economic
life, a capital improvement program could extend the life expectancy.
CONCLUSION
The improvements are in average to good overall condition with over $16,600,000 spent on
renovations to many improvements from 2009 to 2014. The depreciation calculated within the
Cost Approach to value is after repair of the deferred maintenance items listed being within this section of the report. Overall, there are no known factors that adversely impact the marketability
of the improvements.
© 2017 CBRE, Inc.
Zoning
45
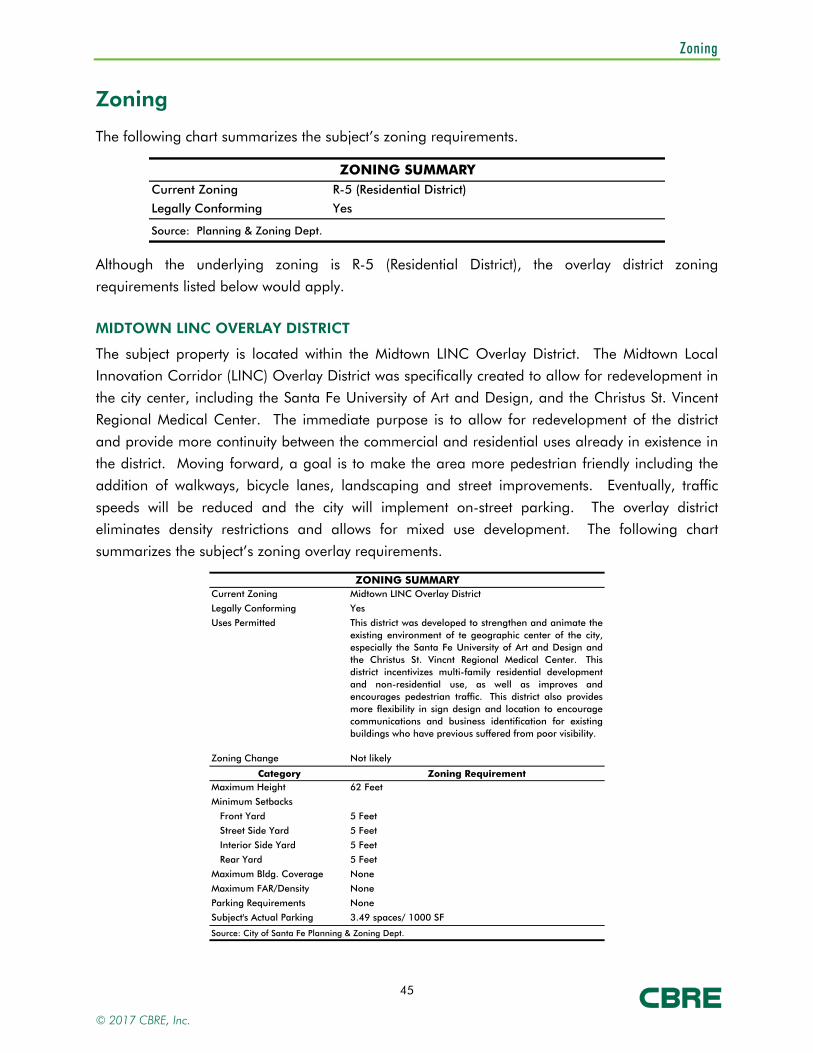
Zoning
The following chart summarizes the subject’s zoning requirements.
ZONING SUMMARYCurrent Zoning R-5 (Residential District)
Legally Conforming Yes
Source: Planning & Zoning Dept.
Although the underlying zoning is R-5 (Residential District), the overlay district zoning
requirements listed below would apply.
MIDTOWN LINC OVERLAY DISTRICT
The subject property is located within the Midtown LINC Overlay District. The Midtown Local Innovation Corridor (LINC) Overlay District was specifically created to allow for redevelopment in
the city center, including the Santa Fe University of Art and Design, and the Christus St. Vincent
Regional Medical Center. The immediate purpose is to allow for redevelopment of the district
and provide more continuity between the commercial and residential uses already in existence in the district. Moving forward, a goal is to make the area more pedestrian friendly including the
addition of walkways, bicycle lanes, landscaping and street improvements. Eventually, traffic
speeds will be reduced and the city will implement on-street parking. The overlay district eliminates density restrictions and allows for mixed use development. The following chart
summarizes the subject’s zoning overlay requirements.
ZONING SUMMARYCurrent Zoning Midtown LINC Overlay District
Legally Conforming Yes
Uses Permitted This district was developed to strengthen and animate theexisting environment of te geographic center of the city,especially the Santa Fe University of Art and Design andthe Christus St. Vincnt Regional Medical Center. Thisdistrict incentivizes multi-family residential developmentand non-residential use, as well as improves andencourages pedestrian traffic. This district also providesmore flexibility in sign design and location to encouragecommunications and business identification for existingbuildings who have previous suffered from poor visibility.
Zoning Change Not likely
Category Zoning RequirementMaximum Height 62 Feet
Minimum Setbacks
Front Yard 5 Feet
Street Side Yard 5 Feet
Interior Side Yard 5 Feet
Rear Yard 5 Feet
Maximum Bldg. Coverage None
Maximum FAR/Density None
Parking Requirements None
Subject's Actual Parking 3.49 spaces/ 1000 SF
Source: City of Santa Fe Planning & Zoning Dept.
© 2017 CBRE, Inc.
Zoning
46
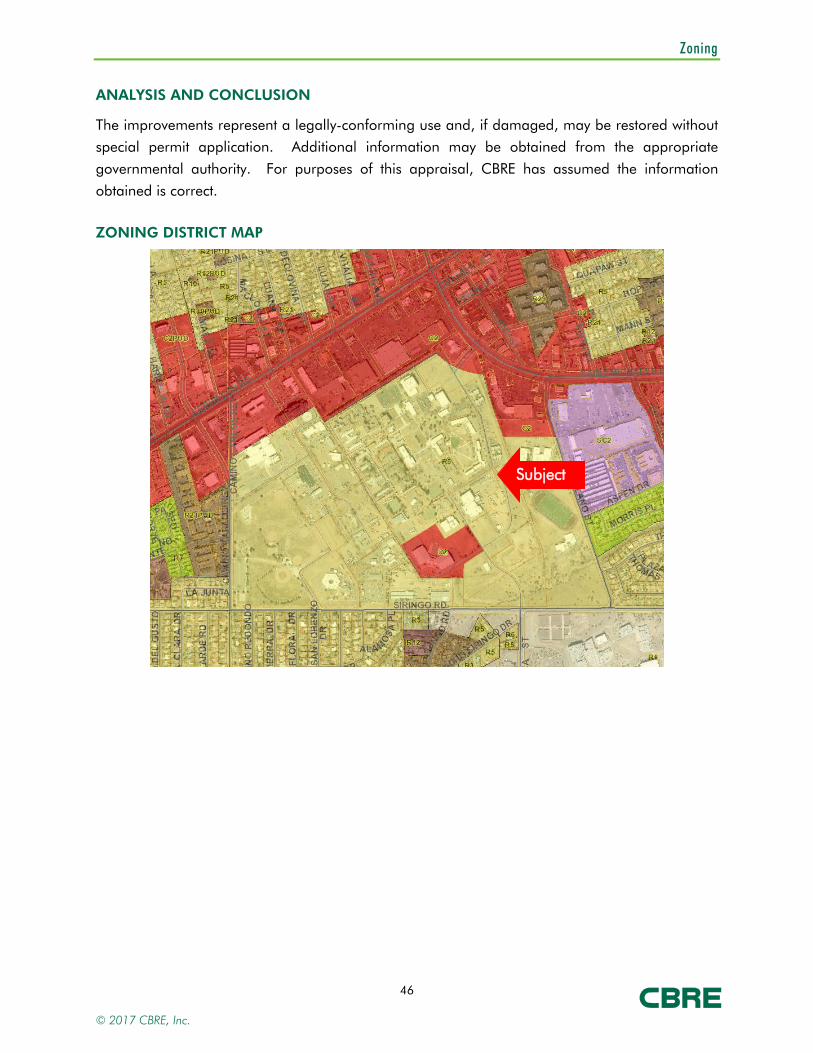
ANALYSIS AND CONCLUSION
The improvements represent a legally-conforming use and, if damaged, may be restored without special permit application. Additional information may be obtained from the appropriate
governmental authority. For purposes of this appraisal, CBRE has assumed the information
obtained is correct.
ZONING DISTRICT MAP
Subject
© 2017 CBRE, Inc.

Zoning
47
MIDTOWN LINC OVERLAY DISTRICT MAP
Subject
© 2017 CBRE, Inc.
Tax and Assessment Data
48
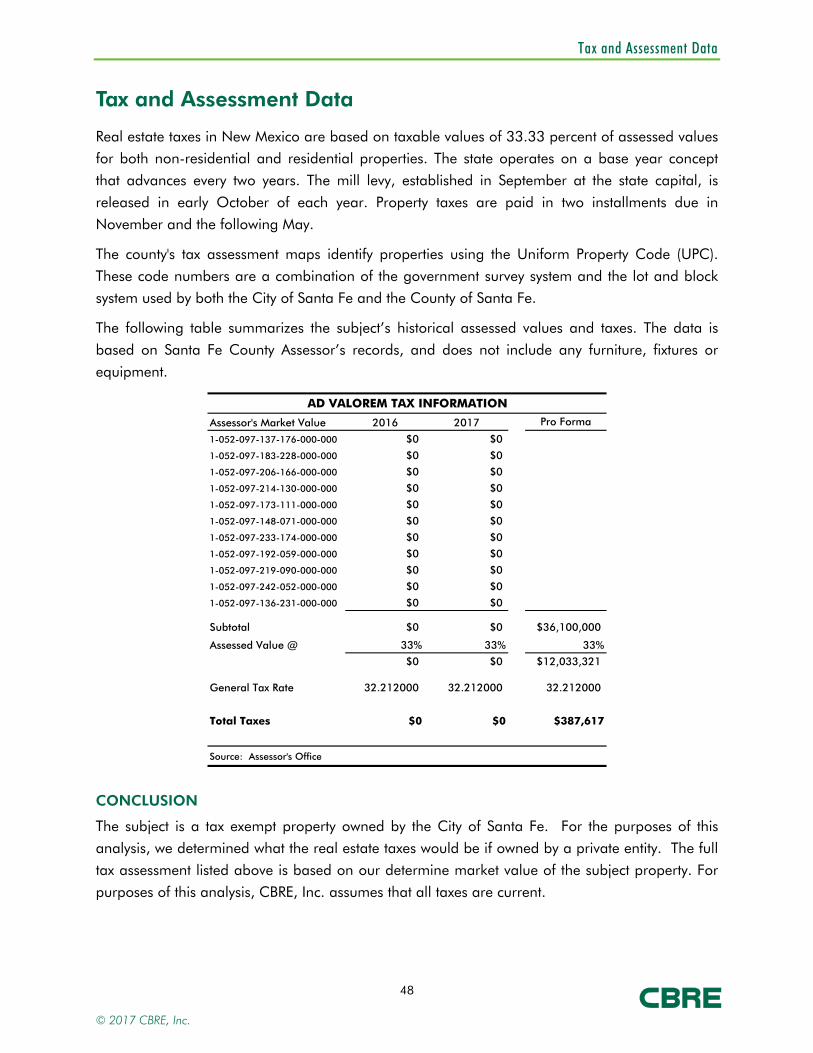
Tax and Assessment Data
Real estate taxes in New Mexico are based on taxable values of 33.33 percent of assessed values for both non-residential and residential properties. The state operates on a base year concept
that advances every two years. The mill levy, established in September at the state capital, is
released in early October of each year. Property taxes are paid in two installments due in
November and the following May.
The county's tax assessment maps identify properties using the Uniform Property Code (UPC).
These code numbers are a combination of the government survey system and the lot and block
system used by both the City of Santa Fe and the County of Santa Fe.
The following table summarizes the subject’s historical assessed values and taxes. The data is
based on Santa Fe County Assessor’s records, and does not include any furniture, fixtures or
equipment.
AD VALOREM TAX INFORMATION
Assessor's Market Value 2016 2017 Pro Forma
1-052-097-137-176-000-000 $0 $0
1-052-097-183-228-000-000 $0 $0
1-052-097-206-166-000-000 $0 $0
1-052-097-214-130-000-000 $0 $0
1-052-097-173-111-000-000 $0 $0
1-052-097-148-071-000-000 $0 $0
1-052-097-233-174-000-000 $0 $0
1-052-097-192-059-000-000 $0 $0
1-052-097-219-090-000-000 $0 $0
1-052-097-242-052-000-000 $0 $0
1-052-097-136-231-000-000 $0 $0
Subtotal $0 $0 $36,100,000
Assessed Value @ 33% 33% 33%
$0 $0 $12,033,321
General Tax Rate 32.212000 32.212000 32.212000
Total Taxes $0 $0 $387,617
Source: Assessor's Office
CONCLUSION
The subject is a tax exempt property owned by the City of Santa Fe. For the purposes of this
analysis, we determined what the real estate taxes would be if owned by a private entity. The full
tax assessment listed above is based on our determine market value of the subject property. For
purposes of this analysis, CBRE, Inc. assumes that all taxes are current.
© 2017 CBRE, Inc.

Market Analysis
49
Market Analysis
The market analysis forms a basis for assessing market area boundaries, supply and demand factors, and indications of financial feasibility. Primary data sources utilized for this analysis
include the National Center for Educational Statistics and the U.S. Department of Education.
DEMAND OVERVIEW
The following section provides an overview of general demand and enrollment trends.
Nationwide College Enrollment
According to the National Center for Education Statistics, in fall 2015, total undergraduate
enrollment in degree-granting postsecondary institutions was 17.0 million students, an increase of 30 percent from 2000, when enrollment was 13.2 million students. While total undergraduate
enrollment increased by 37 percent between 2000 and 2010, enrollment decreased by 6 percent
between 2010 and 2015. Undergraduate enrollment is projected to increase by 14 percent (from
17.0 million to 19.3 million students) between 2015 and 2026.
In fall 2015, female students made up 56 percent of total undergraduate enrollment at 9.5
million, and male students made up 44 percent at 7.5 million. Between 2000 and 2015,
enrollment for both groups showed similar patterns of change: female enrollment increased by 29 percent and male enrollment increased by 30 percent. Most of these increases occurred
between 2005 and 2010, when female enrollment increased by 20 percent and male enrollment
© 2017 CBRE, Inc.
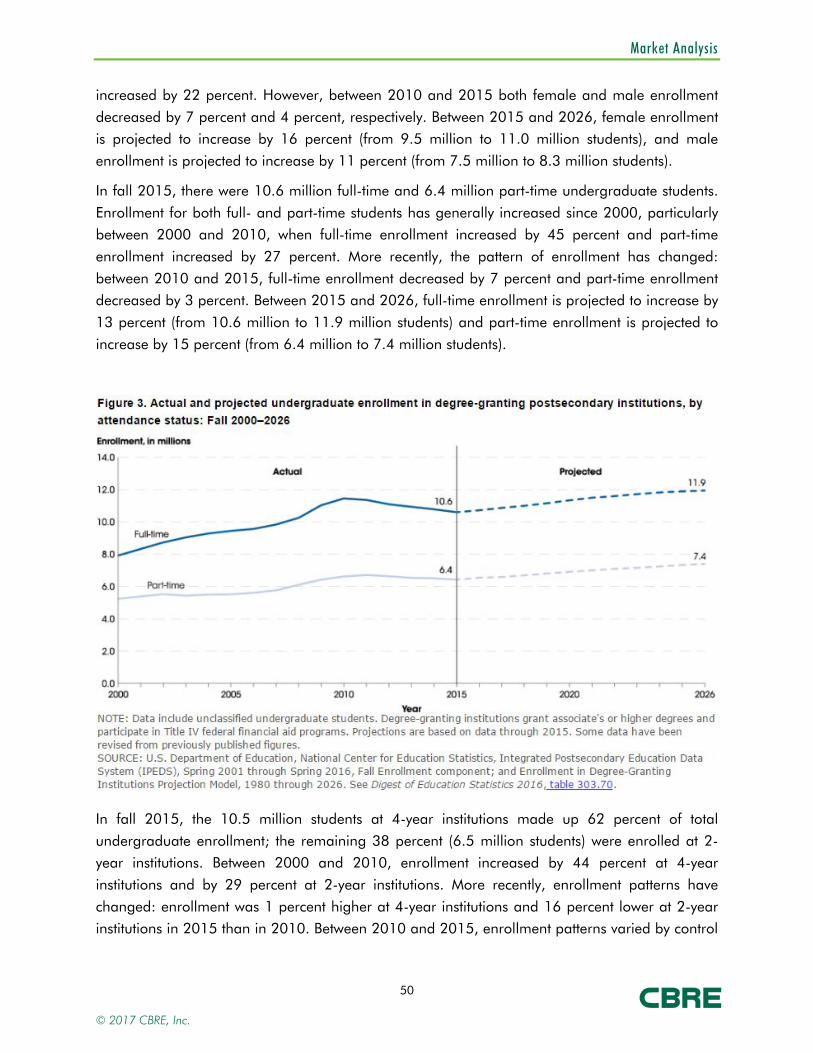
Market Analysis
50
increased by 22 percent. However, between 2010 and 2015 both female and male enrollment
decreased by 7 percent and 4 percent, respectively. Between 2015 and 2026, female enrollment is projected to increase by 16 percent (from 9.5 million to 11.0 million students), and male
enrollment is projected to increase by 11 percent (from 7.5 million to 8.3 million students).
In fall 2015, there were 10.6 million full-time and 6.4 million part-time undergraduate students.
Enrollment for both full- and part-time students has generally increased since 2000, particularly between 2000 and 2010, when full-time enrollment increased by 45 percent and part-time
enrollment increased by 27 percent. More recently, the pattern of enrollment has changed:
between 2010 and 2015, full-time enrollment decreased by 7 percent and part-time enrollment decreased by 3 percent. Between 2015 and 2026, full-time enrollment is projected to increase by
13 percent (from 10.6 million to 11.9 million students) and part-time enrollment is projected to
increase by 15 percent (from 6.4 million to 7.4 million students).
In fall 2015, the 10.5 million students at 4-year institutions made up 62 percent of total
undergraduate enrollment; the remaining 38 percent (6.5 million students) were enrolled at 2-year institutions. Between 2000 and 2010, enrollment increased by 44 percent at 4-year
institutions and by 29 percent at 2-year institutions. More recently, enrollment patterns have
changed: enrollment was 1 percent higher at 4-year institutions and 16 percent lower at 2-year institutions in 2015 than in 2010. Between 2010 and 2015, enrollment patterns varied by control
© 2017 CBRE, Inc.
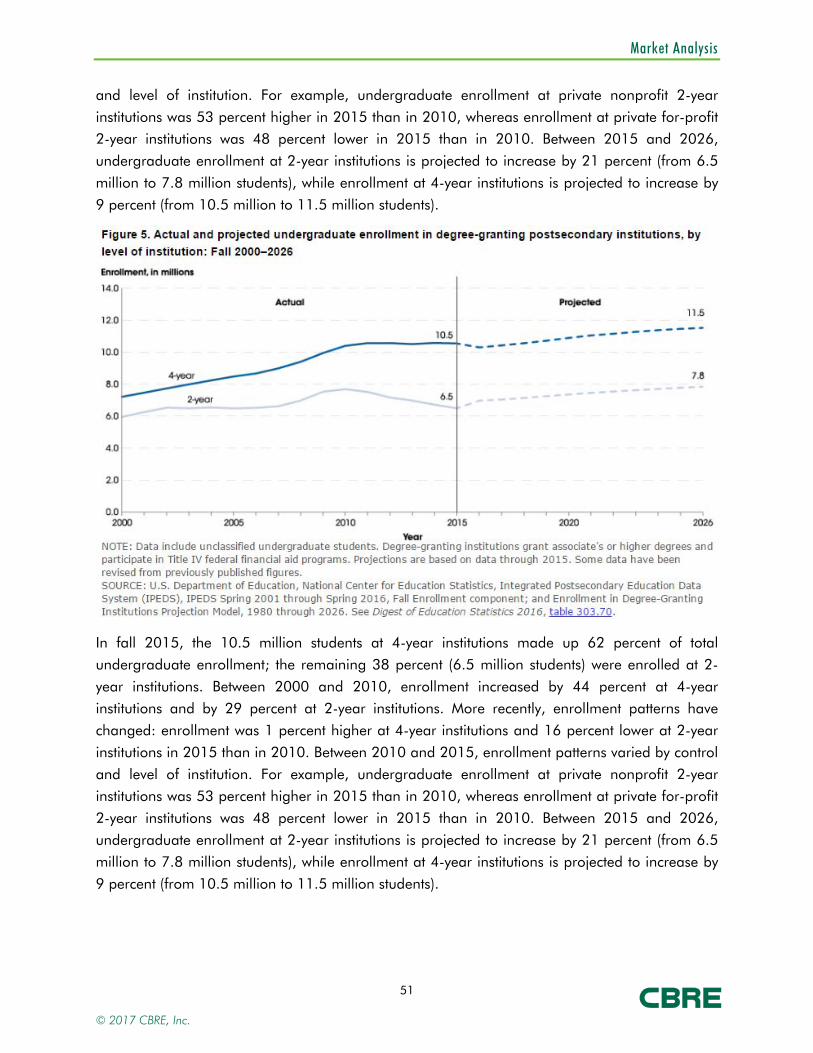
Market Analysis
51
and level of institution. For example, undergraduate enrollment at private nonprofit 2-year
institutions was 53 percent higher in 2015 than in 2010, whereas enrollment at private for-profit 2-year institutions was 48 percent lower in 2015 than in 2010. Between 2015 and 2026,
undergraduate enrollment at 2-year institutions is projected to increase by 21 percent (from 6.5
million to 7.8 million students), while enrollment at 4-year institutions is projected to increase by
9 percent (from 10.5 million to 11.5 million students).
In fall 2015, the 10.5 million students at 4-year institutions made up 62 percent of total
undergraduate enrollment; the remaining 38 percent (6.5 million students) were enrolled at 2-
year institutions. Between 2000 and 2010, enrollment increased by 44 percent at 4-year institutions and by 29 percent at 2-year institutions. More recently, enrollment patterns have
changed: enrollment was 1 percent higher at 4-year institutions and 16 percent lower at 2-year
institutions in 2015 than in 2010. Between 2010 and 2015, enrollment patterns varied by control
and level of institution. For example, undergraduate enrollment at private nonprofit 2-year institutions was 53 percent higher in 2015 than in 2010, whereas enrollment at private for-profit
2-year institutions was 48 percent lower in 2015 than in 2010. Between 2015 and 2026,
undergraduate enrollment at 2-year institutions is projected to increase by 21 percent (from 6.5 million to 7.8 million students), while enrollment at 4-year institutions is projected to increase by
9 percent (from 10.5 million to 11.5 million students).
© 2017 CBRE, Inc.
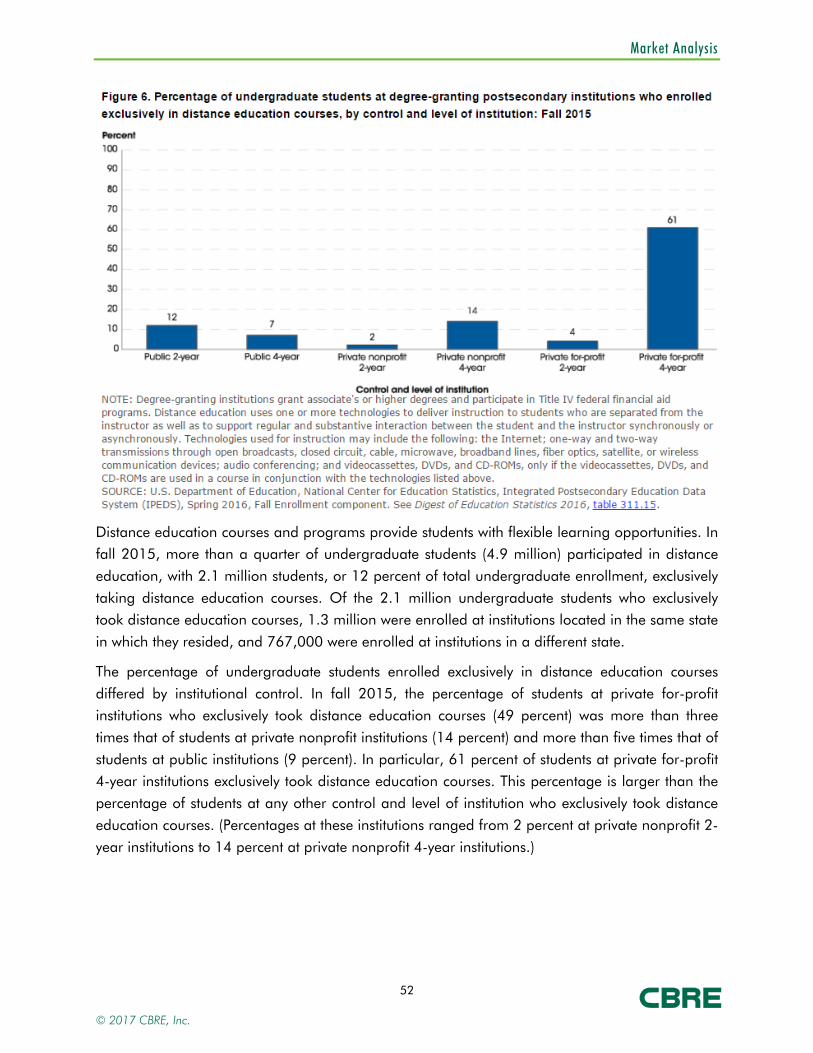
Market Analysis
52
Distance education courses and programs provide students with flexible learning opportunities. In fall 2015, more than a quarter of undergraduate students (4.9 million) participated in distance
education, with 2.1 million students, or 12 percent of total undergraduate enrollment, exclusively
taking distance education courses. Of the 2.1 million undergraduate students who exclusively took distance education courses, 1.3 million were enrolled at institutions located in the same state
in which they resided, and 767,000 were enrolled at institutions in a different state.
The percentage of undergraduate students enrolled exclusively in distance education courses
differed by institutional control. In fall 2015, the percentage of students at private for-profit institutions who exclusively took distance education courses (49 percent) was more than three
times that of students at private nonprofit institutions (14 percent) and more than five times that of
students at public institutions (9 percent). In particular, 61 percent of students at private for-profit 4-year institutions exclusively took distance education courses. This percentage is larger than the
percentage of students at any other control and level of institution who exclusively took distance
education courses. (Percentages at these institutions ranged from 2 percent at private nonprofit 2-
year institutions to 14 percent at private nonprofit 4-year institutions.)
© 2017 CBRE, Inc.

Market Analysis
53
State Funded New Mexico Colleges & Universities
According to the Albuquerque Journal in March 2017, the state of New Mexico has approximately 7 four-year public colleges/universities which sponsor their own 10 two-year
branch community colleges, as well as 8 independent two-year community colleges, and 3 tribal
colleges. These institutions equal a postsecondary school enrollment of approximately 131, 534 students. This number represents a significant decline, -15.17% in enrollment from 2010 to
2016. New Mexico saw the steepest enrollment decline in the nation from 2014 to 2015, with a
single year decrease of 8.3%. University officials across the state seem to be in agreement about
the decline in enrollment. Enrollment seemed to peak during the Great Recession especially with students over the age of 24; however, as the economy improved, and unemployment dropped,
enrollment followed suit implying that people are returning to work. That being said, New Mexico
has been slower to recover than the rest of the country. As a result, population in New Mexico is also declining as people leave the state for stronger economies with more jobs. This trend is
especially prevalent with young, college aged people. Postsecondary educational reform is being
considered with a lot of opposition from the smaller colleges. New Mexico has a unique
program in place where most schools lead themselves independently with their own boards, as opposed to be dictated by the state. This allows for program diversity specific to the locale.
Small schools fear the education reform could take programs out of their hands and they could
no longer appeal to their own student base. In recent years, programs have been initiated to provide more continuity between schools. Classes have been renumbered and are more
transferable from university to university.
© 2017 CBRE, Inc.
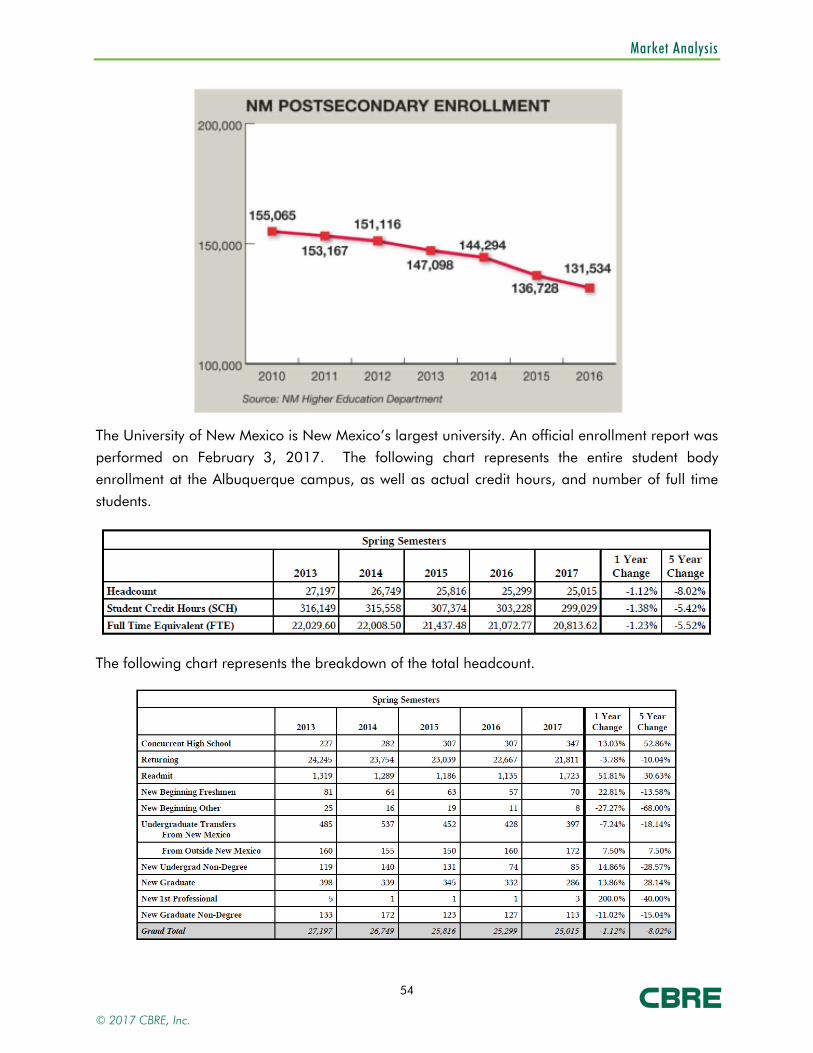
Market Analysis
54
The University of New Mexico is New Mexico’s largest university. An official enrollment report was
performed on February 3, 2017. The following chart represents the entire student body enrollment at the Albuquerque campus, as well as actual credit hours, and number of full time
students.
The following chart represents the breakdown of the total headcount.
© 2017 CBRE, Inc.
Market Analysis
55
These numbers are slightly below the state numbers and there has been an 8.02% decline in total
enrollment over the past five years.
SUBJECT ANALYSIS
Tenant Analysis
The Santa Fe University of Art and Design is located at 1600 St. Michael’s Drive. Previously
known as the St. Michael’s College until 1966, then known as College of Santa Fe until 2009. College of Santa Fe faced financial difficulties in 2009 and was purchased by the City of Santa
Fe. Since that time, the City of Santa Fe has leased the property to The Santa Fe University of Art
and Design, which has a narrower focus on film, theater, and arts and reported a 2014
enrollment of over 800 students. Other public institutions in the neighborhood include the Santa Fe Indian School and the New Mexico School for the Deaf in the northern portion of the
neighborhood, on the north side of Cerrillos Road.
The Santa Fe University of Art and Design has given notice that they will be vacating the facility in the summer of 2018. As stated earlier within this analysis, The Santa Fe University of Art and
Design has a termination penalty built into the lease and they also have a purchase option on the
property within the lease agreement. It is unknown at this time which option will be chosen by the tenant.
OTHER COLLEGES
Institute of American Indian Arts
The school, founded in 1962, offers two and four-year degrees in Studio Arts, Visual
Communication, Creative Writing and Museum Studies. The school is located in Santa Fe and sits
on an approximate 140 acres and includes a fine arts museum. The college helps preserve Santa Fe’s place as the international center for American Indian arts and is home to the largest Native
American arts market in the world. The school is accredited by the North Central Association of
Colleges and Schools and the National Association of Schools of Art and Design with 2017
enrollment reported to be 524 students. Tuition costs for 2016-2017 school year $2,350 per semester for 12 credit hours. Books, room and board are not included but are estimated to be
an additional $4,306 per semester.
St. John’s College
This world-renowned liberal arts college located in Santa Fe is situated on approximately 250-acres. This College opened in 1964 and offers four year degrees with a faculty-student ratio of 1
to 8. The college is best known for its studies of the classic books of world history. The school is
accredited by the American Academy for Liberal education and the North Central Association of
Colleges and Secondary Schools. St. Johns also operates a 36-acre campus in Annapolis, Maryland. Tuition costs for the 2014-2015 school year is $23,913 per semester for 15-18 credit
hours. The combined student body of both campuses is only 900 students.
© 2017 CBRE, Inc.
Market Analysis
56
Santa Fe Community College
This college is located in Santa Fe and had a 2012 enrollment of over 6,480 students. This
College sits on an approximate 368-acre campus. The school offers certificates and associate
degrees with 320 full and part time faculty members. In addition, the school maintains academic departments in Business and Technology, Health and Sciences, Liberal and Fine Arts, and
Educational Leadership. The college offers 100 degree and certificate program. The school is
accredited by the Higher Learning Commission of the North Central Association of Colleges and Schools and also has seven other special program accreditations in nursing, dental assistance,
child development, and EMT/paramedics. Tuition costs for the 2015 semester is $747 per
semester for 15 credit hours for in-state/in-district. This amount is $1,625 per semester for out-
of-state tuition. The college has also partnered with New Mexico Highlands University to offer additional undergraduate and graduate programs in business, sciences, education, and other
fields.
The University of New Mexico
UNM was founded in 1889 and is situated on an approximate 600-acre campus. The university offers bachelor’s, master’s, doctoral, and professional degrees in a multitude of art, science, and
engineering disciplines. The main campus in located in Albuquerque with an Extended University
Distance Education program offered in Santa Fe with an office located at Santa Fe Community
College.
CONCLUSION
Thousands of students have attended Santa Fe University of Art & Design and its predecessors.
The college the majority of the buildings are generally in average to good condition and are functional for continued use as a facility of higher education. Although enrollment at state
funded education facilities has dropped by approximately 8.0% over the past 5-years, with the
entire decrease attributed to a drop of in-state enrollments. Out of state enrollments saw a 7.5%
increase over the past 5 years. Nationally, undergraduate enrollment at 2-year institutions is projected to increase by approximately 16 percent by 2026, while enrollment at 4-year
institutions are projected to increase by 7 percent by 2026. Given the demographic and city
profile the subject should regain market acceptance.
© 2017 CBRE, Inc.
Highest and Best Use
57
Highest and Best Use
In appraisal practice, the concept of highest and best use represents the premise upon which value is based. The four criteria the highest and best use must meet are:
• legally permissible; • physically possible; • financially feasible; and • maximally productive.
The highest and best use analysis of the subject is discussed below.
AS IF VACANT
Legally Permissible
The legally permissible uses were discussed in the Site Analysis and Zoning Sections.
Physically Possible
The subject is adequately served by utilities, and has an adequate shape and size, sufficient
access, etc., to be a separately developable site. There are no known physical reasons why the subject site would not support any legally probable development (i.e. it appears adequate for
development).
Financially Feasible
Potential uses of the site include institutional, mixed use development, having components of multi-family, retail and office within the development. The determination of financial feasibility is
dependent primarily on the relationship of supply and demand for the legally probable land uses
versus the cost to create the uses.
Mixed use projects have not been recently developed in this market due to economic conditions.
Further, there are proposed developments which are no longer moving forward due to
inadequate construction financing and market conditions (increasing vacancy, declining effective
rental rates, higher cap rates, etc.). Overall, there is significant risk in the development of mixed use projected and most investors would not move forward with new construction at this time on a
speculative basis.
Maximally Productive - Conclusion
The final test of highest and best use of the site as if vacant is that the use be maximally productive, yielding the highest return to the land.
Based on the information presented above and upon information contained in the market and
neighborhood analysis, we conclude that the highest and best use of the subject as if vacant would be to hold for development of a mixed use project, time and circumstances warranted.
Our analysis of the subject and its respective market characteristics indicate the most likely buyer,
as if vacant, would be an investor (land speculation) or a developer.
© 2017 CBRE, Inc.

Highest and Best Use
58
AS IMPROVED
Legally Permissible
The site has been improved with a university development that is a legal, conforming use.
Physically Possible
The layout and positioning of the improvements are considered functional for university use.
While it would be physically possible for a wide variety of uses, based on the legal restrictions and the design of the improvements, the continued use of the property for university users would
be the most functional use.
Financially Feasible
The financial feasibility of a university property is based on the amount of rent which can be generated, less operating expenses required to generate that income; if a residual amount exists,
then the land is being put to a productive use. Based upon the income capitalization approach
conclusion, the subject is producing a positive net cash flow and continued utilization of the improvements for university purposes is considered financially feasible. Further, the value of the
improvements detailed clearly exceeds the underlying land value.
Maximally Productive - Conclusion
As shown in the applicable valuation sections, buildings that are similar to the subject have been acquired or continue to be used by university owners/tenants. None of the comparable buildings
have been acquired for conversion to an alternative use.
Based on the foregoing, the highest and best use of the property, as improved, is consistent with
the existing use as a university development.
© 2017 CBRE, Inc.

Appraisal Methodology
59
Appraisal Methodology
In appraisal practice, an approach to value is included or omitted based on its applicability to the property type being valued and the quality and quantity of information available.
COST APPROACH
The cost approach is based on the proposition that the informed purchaser would pay no more
for the subject than the cost to produce a substitute property with equivalent utility. This approach is particularly applicable when the property being appraised involves relatively new improvements
that represent the highest and best use of the land, or when it is improved with relatively unique
or specialized improvements for which there exist few sales or leases of comparable properties.
SALES COMPARISON APPROACH
The sales comparison approach utilizes sales of comparable properties, adjusted for differences,
to indicate a value for the subject. Valuation is typically accomplished using physical units of
comparison such as price per square foot, price per unit, price per floor, etc., or economic units of comparison such as gross rent multiplier. Adjustments are applied to the physical units of
comparison derived from the comparable sale. The unit of comparison chosen for the subject is
then used to yield a total value. Economic units of comparison are not adjusted, but rather analyzed as to relevant differences, with the final estimate derived based on the general
comparisons.
INCOME CAPITALIZATION APPROACH
The income capitalization approach reflects the subject’s income-producing capabilities. This approach is based on the assumption that value is created by the expectation of benefits to be
derived in the future. Specifically estimated is the amount an investor would be willing to pay to
receive an income stream plus reversion value from a property over a period of time. The two common valuation techniques associated with the income capitalization approach are direct
capitalization and the discounted cash flow (DCF) analysis.
METHODOLOGY APPLICABLE TO THE SUBJECT
In valuing the subject, all three approaches are applicable and have been utilized.
© 2017 CBRE, Inc.
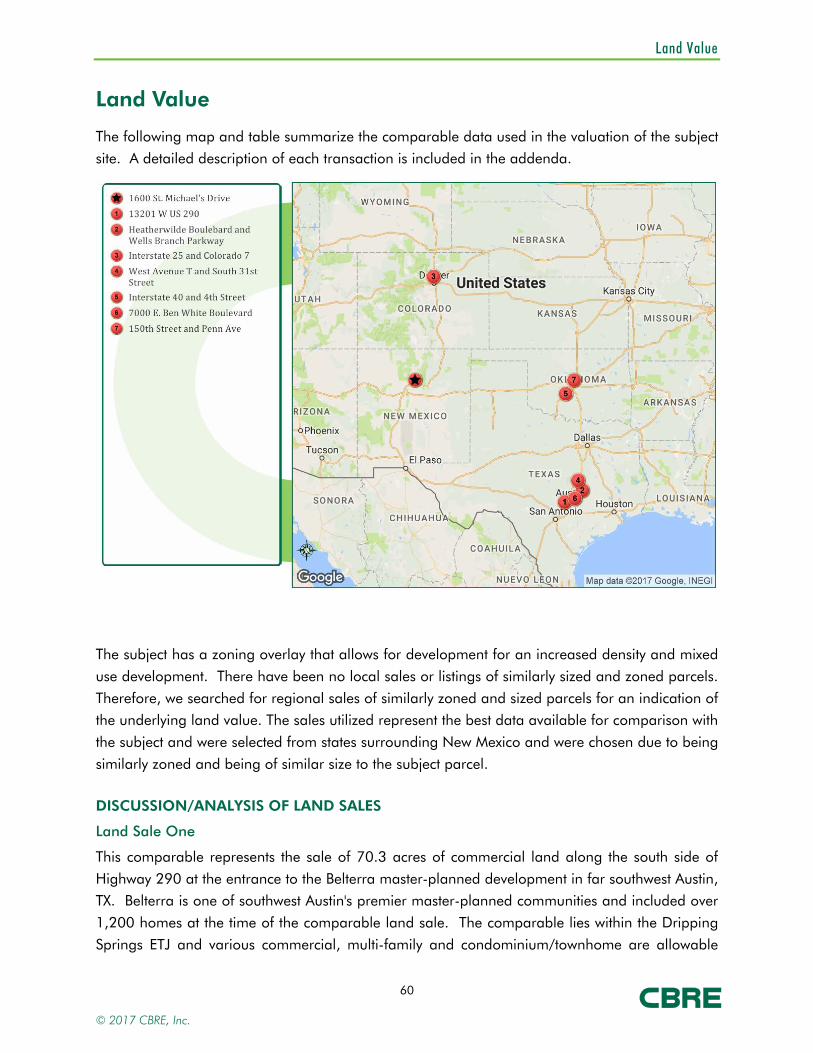
Land Value
60
Land Value
The following map and table summarize the comparable data used in the valuation of the subject site. A detailed description of each transaction is included in the addenda.
The subject has a zoning overlay that allows for development for an increased density and mixed
use development. There have been no local sales or listings of similarly sized and zoned parcels.
Therefore, we searched for regional sales of similarly zoned and sized parcels for an indication of the underlying land value. The sales utilized represent the best data available for comparison with
the subject and were selected from states surrounding New Mexico and were chosen due to being
similarly zoned and being of similar size to the subject parcel.
DISCUSSION/ANALYSIS OF LAND SALES
Land Sale One
This comparable represents the sale of 70.3 acres of commercial land along the south side of
Highway 290 at the entrance to the Belterra master-planned development in far southwest Austin, TX. Belterra is one of southwest Austin's premier master-planned communities and included over
1,200 homes at the time of the comparable land sale. The comparable lies within the Dripping
Springs ETJ and various commercial, multi-family and condominium/townhome are allowable
© 2017 CBRE, Inc.

Land Value
61
under the development agreement with Drippings Springs. All utilities are to the site with water
and wastewater provide by Hays County WCID #1. The December 2016 sales price was $9.7 million or $3.17 PSF. However, the buyer was given an extended option period in order to
obtain commitments from a number of retailers and other tenants prior to closing. The selling
broker indicated that without such a condition of sale, the buyer would have either not been
interest in the site or have needed to acquire it for a lower price.
The adjustment for location was warranted due to its superior demographics. Therefore, a
downward adjustment was judged proper for this comparable. The downward adjustment for
highest and best use was considered reasonable due to the site being 100% zoned for retail use, which is a superior highest and best use. Overall, this comparable was deemed superior in
comparison to the subject and a downward net adjustment was warranted to the sales price
indicator.
Land Sale Two
The comparable represents that sale of a 52-acre tract located at the northeast corner of Wells
Branch Parkway and Heatherwilde Boulevard. The majority of the tract is located within the Austin
City Limits and is zoned SF-4A, MF-2 and GR. The remainder of the tract is located in Pflugerville and is zoned GB-1. The land was vacant and was in agricultural production at the time of sale.
The buyer plans to develop the land with an unknown number of apartments and to reserve the
8-acre portion of the tract which is situated in the City of Pflugerville for future commercial/ retail
use. The property sold in December 2016 for $5,490,000 and $600,000 in rollback taxes paid by the buyer. The adjusted price equates to $6,090,000, or $2.67 per square foot.
The adjustment for location was warranted due to its superior demographics. Therefore, a
downward adjustment was judged proper for this comparable. Overall, this comparable was deemed superior in comparison to the subject and a downward net adjustment was warranted to
the sales price indicator.
Land Sale Three
This comparable is commonly known as the Northlands planned development, a 123.39-acre tract of vacant land located at the northwest corner of Interstate 25 and Colorado 7 in
Broomfield, Colorado. It was purchased by IKEA Property, which intends to develop a portion
(40± acres) to an IKEA store. It is fully entitled and approved for mixed-use commercial and residential development with a maximum of 2.23± million square feet of commercial building
improvements and 525 residential units in 457,380 square feet of building improvements. In
addition, it has an approved metropolitan district that can finance up to $50.9 million of
infrastructure through public financing. It was reported that "$13.5 million of work has been done to the property for drainage and infrastructure," a substantial portion of which was for the
installation of a sewer lift station, extension of the water and sewer line to the central portion of
the site and relocation of the Bull Canal that bisects the site centrally.
© 2017 CBRE, Inc.

Land Value
62
The upward adjustment for size reflects this comparable's inferior feature with respect to
economies of scale regarding parcel size. The adjustment for location was warranted due to being in an area with less development. Therefore, an upward adjustment was judged proper for
this comparable. Overall, this comparable was deemed inferior in comparison to the subject and
an upward net adjustment was warranted to the sales price indicator.
Land Sale Four
"This comparable represents the sale of 40.39 acres of land at the northwest corner of S. 31st
Street and Scott Boulevard; the property also has road frontage on W. Avenue T. The site is
irregular in shape with rolling topography and no floodplain, although a tributary of Bird Creek crosses the property, requiring drainage/development consideration. The site is proposed for
retail and multi-family use. The buyers of the property have sold +/- 9.66 acres to Cypressbrook,
a Houston-based multi-family developer that closed in July 2016. The buyer intends to plat the
remaining 30.73 acres for retail/commercial pad sites and development and develop a 13,575 SF retail building on one of the pad sites. Road frontage is asphalt paved and all utilities are
available. The property sold in May 2015 for $4,300,000, or $2.44/SF.
Legal description: A0692BC R ROBERTS, OB 541, ACRES 40.39, Bell County, Texas"
The downward adjustment for size reflects this comparable's superior feature with respect to
economies of scale regarding parcel size. Overall, this comparable was deemed superior in
comparison to the subject and a downward net adjustment was warranted to the sales price
indicator.
Land Sale Five
The comparable is a 32.25-net-acre retail development site that wraps around the southeast
corner of 4th Street and Grand Avenue in Chickasha, Oklahoma. The site has good access and visibility to Interstate 44 (HE Bailey Turnpike). Chickasha is 45 miles southwest of Oklahoma City.
The zoning is C-2, commercial and all utilities are near the site. A single Tax Increment Finance
(TIF) District has been established for this property. This affords the Developer to recover the
infrastructure costs incurred to make the land suitable for development. All of the risk for reimbursement lies with the Developer. If new taxes are generated, the Developer shares in the
added revenue by a set formula via an Economic Development Agreement with the City of
Chickasha. The reimbursable costs are limited to infrastructure development, including but not limited to site work, drainage, utility relocation, roads, paving and such. The buyer plans a retail
development known as Chisholm Trail. It will be subdivided into seven lots that will vary in size
from 1.15 to 9.99 acres. The development will include big box retail, pad buildings, ground-
leased pads sites and pad sites available for sale. The site sold in April 2015 for $3,705,000, or $2.64 per square foot.
The downward adjustment for size reflects this comparable's superior feature with respect to
economies of scale regarding parcel size. The adjustment for location was warranted due to its
© 2017 CBRE, Inc.
Land Value
63
inferior demographics. Therefore, an upward adjustment was judged proper for this
comparable. The downward adjustment for highest and best use was considered reasonable due to the site being 100% zoned for retail use, which is a superior highest and best use. Overall, the
adjustments applied to this comparable resulted in a net adjustment of zero, whereby the
property was deemed similar in comparison to the subject.
Land Sale Six
This comparable represents the sale of 31.42 acres at 7000 E. Ben White Boulevard in Austin,
Texas. The site has an irregular shape with generally level topography and no floodplain; the
property was purchased for multi-family use. All utilities are available to the site. The property sold in August 2014 for $4,000,000, or $2.92 per square foot.
Legal description: LOTS 1-4 BLK A TRAVIS 51 ADDN NO 2 RESUB OF LOTS 1-2 & LOT 1 AHC
ADDN, City of Austin, Travis County, Texas
The downward adjustment for size reflects this comparable's superior feature with respect to economies of scale regarding parcel size. The adjustment for location was warranted due to its
superior demographics. Therefore, a downward adjustment was judged proper for this
comparable. The upward adjustment for highest and best use was considered reasonable due to the site being developed with 100% multifamily use, which is an inferior highest and best use.
Overall, this comparable was deemed superior in comparison to the subject and a downward net
adjustment was warranted to the sales price indicator.
Land Sale Seven
This is a June 2014 sale of a 35.96-acre site at the northwest corner of Northwest 150th Street
and North Pennsylvania Avenue, in Edmond, Oklahoma. The site is one-mile north of John
Kilpatrick Turnpike. There is 1,275 feet of frontage along Northwest 150th Street and 1,275 feet of frontage along North Pennsylvania Avenue. The surrounding uses are residential, retail and
senior housing. The site is square in shape and contains 35.96 acres. It is zoned PUD-288,
allowing for residential and commercial uses. All utilities are near the site. The sale price was
$4,515,500, or $2.88 per square foot.
The downward adjustment for size reflects this comparable's superior feature with respect to
economies of scale regarding parcel size. Overall, this comparable was deemed superior in
comparison to the subject and a downward net adjustment was warranted to the sales price indicator.
SUMMARY OF ADJUSTMENTS
Based on our comparative analysis, the following chart summarizes the adjustments warranted to
each comparable.
© 2017 CBRE, Inc.
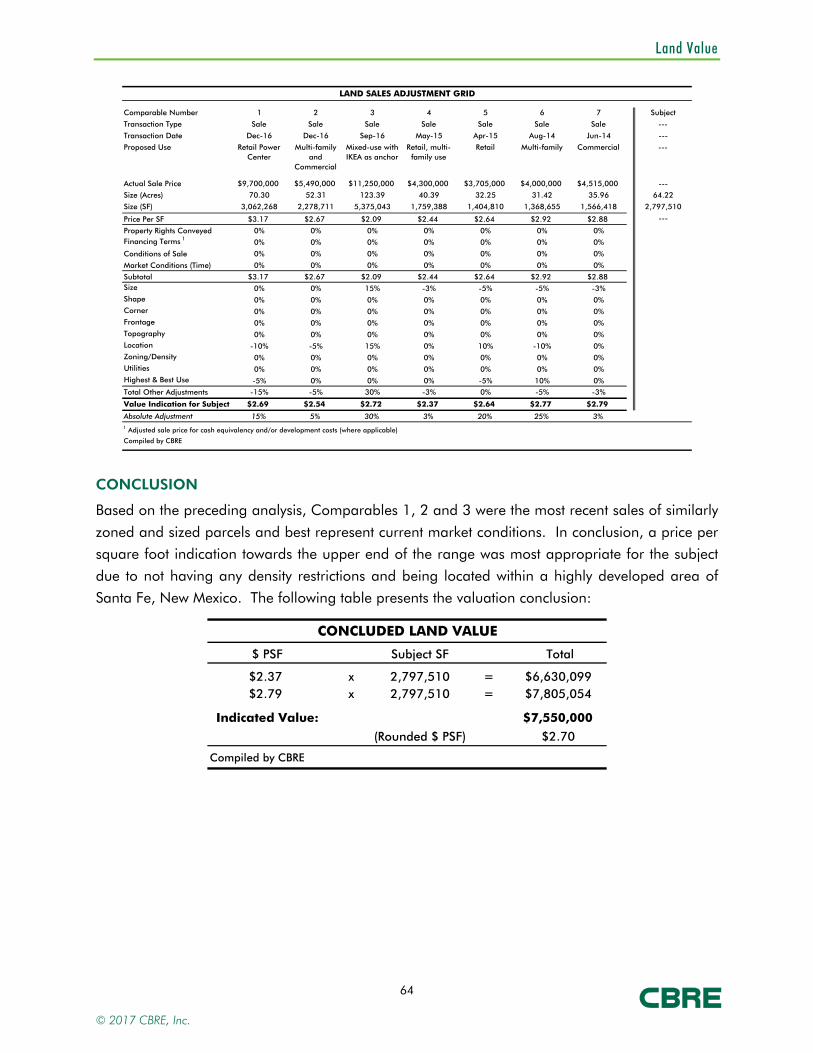
Land Value
64
LAND SALES ADJUSTMENT GRID
Comparable Number 1 2 3 4 5 6 7 Subject
Transaction Type Sale Sale Sale Sale Sale Sale Sale ---
Transaction Date Dec-16 Dec-16 Sep-16 May-15 Apr-15 Aug-14 Jun-14 ---
Proposed Use Retail Power Center
Multi-family and
Commercial
Mixed-use with IKEA as anchor
Retail, multi-family use
Retail Multi-family Commercial ---
Actual Sale Price $9,700,000 $5,490,000 $11,250,000 $4,300,000 $3,705,000 $4,000,000 $4,515,000 ---
Size (Acres) 70.30 52.31 123.39 40.39 32.25 31.42 35.96 64.22
Size (SF) 3,062,268 2,278,711 5,375,043 1,759,388 1,404,810 1,368,655 1,566,418 2,797,510
Price Per SF $3.17 $2.67 $2.09 $2.44 $2.64 $2.92 $2.88 ---
Property Rights Conveyed 0% 0% 0% 0% 0% 0% 0%Financing Terms 1 0% 0% 0% 0% 0% 0% 0%
Conditions of Sale 0% 0% 0% 0% 0% 0% 0%
Market Conditions (Time) 0% 0% 0% 0% 0% 0% 0%
Subtotal $3.17 $2.67 $2.09 $2.44 $2.64 $2.92 $2.88Size 0% 0% 15% -3% -5% -5% -3%Shape 0% 0% 0% 0% 0% 0% 0%Corner 0% 0% 0% 0% 0% 0% 0%Frontage 0% 0% 0% 0% 0% 0% 0%Topography 0% 0% 0% 0% 0% 0% 0%Location -10% -5% 15% 0% 10% -10% 0%Zoning/Density 0% 0% 0% 0% 0% 0% 0%Utilities 0% 0% 0% 0% 0% 0% 0%Highest & Best Use -5% 0% 0% 0% -5% 10% 0%
Total Other Adjustments -15% -5% 30% -3% 0% -5% -3%
Value Indication for Subject $2.69 $2.54 $2.72 $2.37 $2.64 $2.77 $2.79
Absolute Adjustment 15% 5% 30% 3% 20% 25% 3%1 Adjusted sale price for cash equivalency and/or development costs (where applicable)
Compiled by CBRE
CONCLUSION
Based on the preceding analysis, Comparables 1, 2 and 3 were the most recent sales of similarly
zoned and sized parcels and best represent current market conditions. In conclusion, a price per square foot indication towards the upper end of the range was most appropriate for the subject
due to not having any density restrictions and being located within a highly developed area of
Santa Fe, New Mexico. The following table presents the valuation conclusion:
CONCLUDED LAND VALUE
$ PSF Subject SF Total
$2.37 x 2,797,510 = $6,630,099$2.79 x 2,797,510 = $7,805,054
Indicated Value: $7,550,000
(Rounded $ PSF) $2.70
Compiled by CBRE
© 2017 CBRE, Inc.
Cost Approach
65
Cost Approach
In estimating the replacement cost new for the subject, the following methods/data sources have been utilized (where available):
• the comparative unit method has been employed, utilizing the Marshall Valuation Service (MVS) cost guide, published by Marshall and Swift, LLC;
• the subject’s actual construction costs (where available); and • actual/budget construction cost figures available for comparable properties have been
considered.
MARSHALL VALUATION SERVICE
Direct Cost
Salient details regarding the direct costs are summarized in the Cost Approach Conclusion at the
end of this section. The MVS cost estimates include the following:
1. average architect’s and engineer’s fees for plans, plan check, building permits and survey(s) to establish building line;
2. normal interest in building funds during the period of construction plus a processing fee or service charge;
3. materials, sales taxes on materials, and labor costs; 4. normal site preparation including finish grading and excavation for foundation and
backfill; 5. utilities from structure to lot line figured for typical setback; 6. contractor’s overhead and profit, including job supervision, workmen’s compensation,
fire and liability insurance, unemployment insurance, equipment, temporary facilities, security, etc.;
7. site improvements (included as lump sum additions); and 8. initial tenant improvement costs are included in MVS cost estimate. However, additional
lease-up costs such as advertising, marketing and leasing commissions are not included.
Base building costs (direct costs) are adjusted to reflect the physical characteristics of the subject. Making these adjustments, including the appropriate local and current cost multipliers, the direct
building cost is indicated.
Additions
Items not included in the direct building cost estimate include parking and walks, signage, landscaping, and miscellaneous site improvements. The cost for these items is estimated
separately using the segregated cost sections of the MVS cost guide.
Indirect Cost Items
Several indirect cost items are not included in the direct building cost figures derived through the MVS cost guide. These items include developer overhead (general and administrative costs),
property taxes, legal and insurance costs, local development fees and contingencies, lease-up
and marketing costs and miscellaneous costs. The concluded indirect cost allowance is 10.0%.
© 2017 CBRE, Inc.

Cost Approach
66
MVS Conclusion
The concluded direct and indirect building cost estimates obtained via the MVS cost guide are illustrated as follows:
MARSHALL VALUATION SERVICE COST SCHEDULE - TABLE A
Primary Building Type: Height per Story: 8'-10'Effective Age: Number of Buildings: 32Condition: Gross Building Area: 498,384 SFExterior Wall: Net Rentable Area: 498,384 SFNumber of Stories: Average Floor Area: Building Number #1 #2, #26 #3-5 #6A & 6B #7, #11, #12MVS Sec/Page Sec 16/Pg 12 Sec 15/Pg 17 Sec 18/Pg 27 Sec 12/Pg 16 Sec 11/Pg 14Quality/Bldg. Class Average/C Average/C Average/C Average/D Average/CBuilding Component Theater: Live Stage Office Building College Classrooms Multiple
ResidencesDormitories
Component Sq. Ft. 32,628 SF 34,857 SF 58,457 SF 30,000 SF 101,012 SFBase Square Foot Cost $121.09 $109.26 $140.00 $71.55 $110.00
Square Foot RefinementsElevator $1.82 $1.53 $1.08 $0.00 $0.00Sprinklers $3.40 $0.00 $0.00 $0.00 $2.92Subtotal $126.31 $110.79 $141.08 $71.55 $112.92
Cost MultipliersCurrent Cost Multiplier 1.02 1.01 1.02 1.02 1.00Local Multiplier 0.97 0.97 0.97 0.96 0.97
Final Square Foot Cost $124.97 $108.55 $139.58 $70.06 $109.53
Base Component Cost $4,077,654 $3,783,576 $8,159,578 $2,101,853 $11,064,087
Base Building Cost (via Marshall Valuation Service cost data) $29,186,749
Indirect Costs 10.0% of Direct Building Cost $2,918,675Direct and Indirect Building Cost $32,105,424Rounded $32,105,000
Compiled by CBRE
1, 2 & 3
Various27 YRSAverageVarious
© 2017 CBRE, Inc.
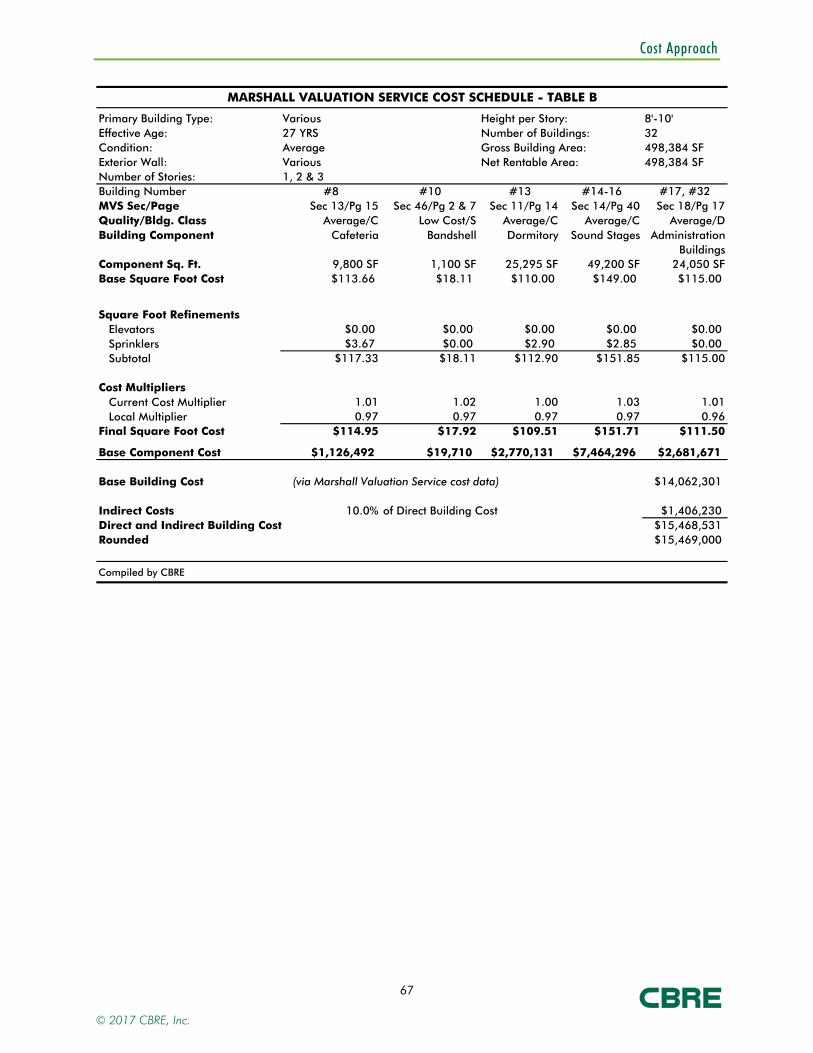
Cost Approach
67
MARSHALL VALUATION SERVICE COST SCHEDULE - TABLE B
Primary Building Type: Height per Story: 8'-10'Effective Age: Number of Buildings: 32Condition: Gross Building Area: 498,384 SFExterior Wall: Net Rentable Area: 498,384 SFNumber of Stories: Average Floor Area: #VALUE!Building Number #8 #10 #13 #14-16 #17, #32MVS Sec/Page Sec 13/Pg 15 Sec 46/Pg 2 & 7 Sec 11/Pg 14 Sec 14/Pg 40 Sec 18/Pg 17Quality/Bldg. Class Average/C Low Cost/S Average/C Average/C Average/DBuilding Component Cafeteria Bandshell Dormitory Sound Stages Administration
BuildingsComponent Sq. Ft. 9,800 SF 1,100 SF 25,295 SF 49,200 SF 24,050 SFBase Square Foot Cost $113.66 $18.11 $110.00 $149.00 $115.00
Square Foot RefinementsElevators $0.00 $0.00 $0.00 $0.00 $0.00Sprinklers $3.67 $0.00 $2.90 $2.85 $0.00Subtotal $117.33 $18.11 $112.90 $151.85 $115.00
Cost MultipliersCurrent Cost Multiplier 1.01 1.02 1.00 1.03 1.01Local Multiplier 0.97 0.97 0.97 0.97 0.96
Final Square Foot Cost $114.95 $17.92 $109.51 $151.71 $111.50
Base Component Cost $1,126,492 $19,710 $2,770,131 $7,464,296 $2,681,671
Base Building Cost (via Marshall Valuation Service cost data) $14,062,301
Indirect Costs 10.0% of Direct Building Cost $1,406,230Direct and Indirect Building Cost $15,468,531Rounded $15,469,000
Compiled by CBRE
Various27 YRSAverageVarious1, 2 & 3
© 2017 CBRE, Inc.
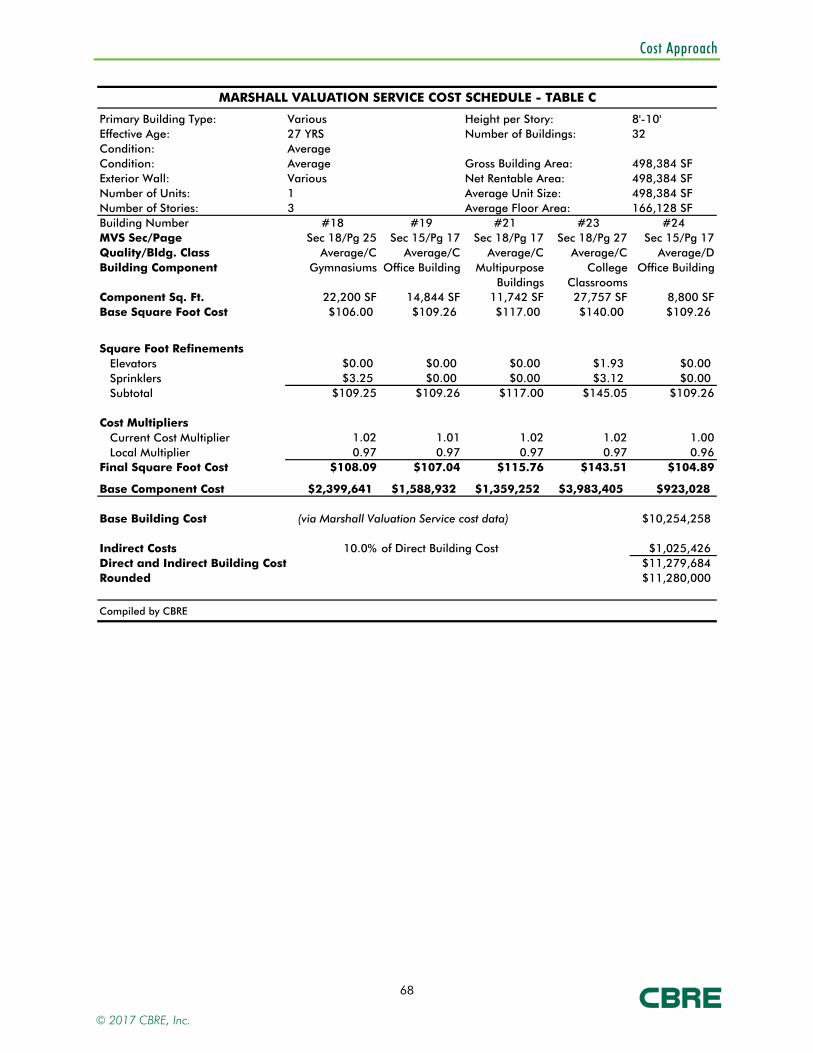
Cost Approach
68
MARSHALL VALUATION SERVICE COST SCHEDULE - TABLE C
Primary Building Type: Height per Story: 8'-10'Effective Age: Number of Buildings: 32Condition:Condition: Gross Building Area: 498,384 SFExterior Wall: Net Rentable Area: 498,384 SFNumber of Units: Average Unit Size: 498,384 SFNumber of Stories: Average Floor Area: 166,128 SFBuilding Number #18 #19 #21 #23 #24MVS Sec/Page Sec 18/Pg 25 Sec 15/Pg 17 Sec 18/Pg 17 Sec 18/Pg 27 Sec 15/Pg 17Quality/Bldg. Class Average/C Average/C Average/C Average/C Average/DBuilding Component Gymnasiums Office Building Multipurpose
BuildingsCollege
ClassroomsOffice Building
Component Sq. Ft. 22,200 SF 14,844 SF 11,742 SF 27,757 SF 8,800 SFBase Square Foot Cost $106.00 $109.26 $117.00 $140.00 $109.26
Square Foot RefinementsElevators $0.00 $0.00 $0.00 $1.93 $0.00Sprinklers $3.25 $0.00 $0.00 $3.12 $0.00Subtotal $109.25 $109.26 $117.00 $145.05 $109.26
Cost MultipliersCurrent Cost Multiplier 1.02 1.01 1.02 1.02 1.00Local Multiplier 0.97 0.97 0.97 0.97 0.96
Final Square Foot Cost $108.09 $107.04 $115.76 $143.51 $104.89
Base Component Cost $2,399,641 $1,588,932 $1,359,252 $3,983,405 $923,028
Base Building Cost (via Marshall Valuation Service cost data) $10,254,258
Indirect Costs 10.0% of Direct Building Cost $1,025,426Direct and Indirect Building Cost $11,279,684Rounded $11,280,000
Compiled by CBRE
1
Various27 YRSAverageAverageVarious
3
© 2017 CBRE, Inc.
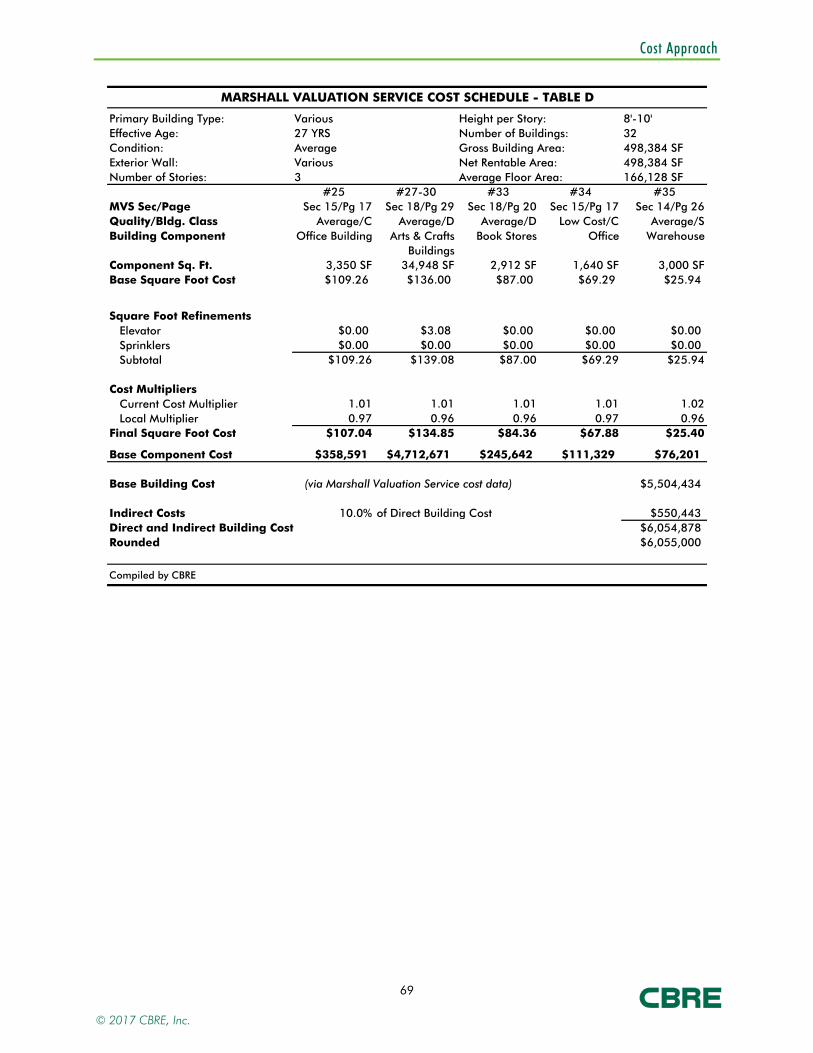
Cost Approach
69
MARSHALL VALUATION SERVICE COST SCHEDULE - TABLE D
Primary Building Type: Height per Story: 8'-10'Effective Age: Number of Buildings: 32Condition: Gross Building Area: 498,384 SFExterior Wall: Net Rentable Area: 498,384 SFNumber of Stories: Average Floor Area: 166,128 SF
#25 #27-30 #33 #34 #35MVS Sec/Page Sec 15/Pg 17 Sec 18/Pg 29 Sec 18/Pg 20 Sec 15/Pg 17 Sec 14/Pg 26Quality/Bldg. Class Average/C Average/D Average/D Low Cost/C Average/SBuilding Component Office Building Arts & Crafts
BuildingsBook Stores Office Warehouse
Component Sq. Ft. 3,350 SF 34,948 SF 2,912 SF 1,640 SF 3,000 SFBase Square Foot Cost $109.26 $136.00 $87.00 $69.29 $25.94
Square Foot RefinementsElevator $0.00 $3.08 $0.00 $0.00 $0.00Sprinklers $0.00 $0.00 $0.00 $0.00 $0.00Subtotal $109.26 $139.08 $87.00 $69.29 $25.94
Cost MultipliersCurrent Cost Multiplier 1.01 1.01 1.01 1.01 1.02Local Multiplier 0.97 0.96 0.96 0.97 0.96
Final Square Foot Cost $107.04 $134.85 $84.36 $67.88 $25.40
Base Component Cost $358,591 $4,712,671 $245,642 $111,329 $76,201
Base Building Cost (via Marshall Valuation Service cost data) $5,504,434
Indirect Costs 10.0% of Direct Building Cost $550,443Direct and Indirect Building Cost $6,054,878Rounded $6,055,000
Compiled by CBRE
Various27 YRSAverageVarious3
© 2017 CBRE, Inc.
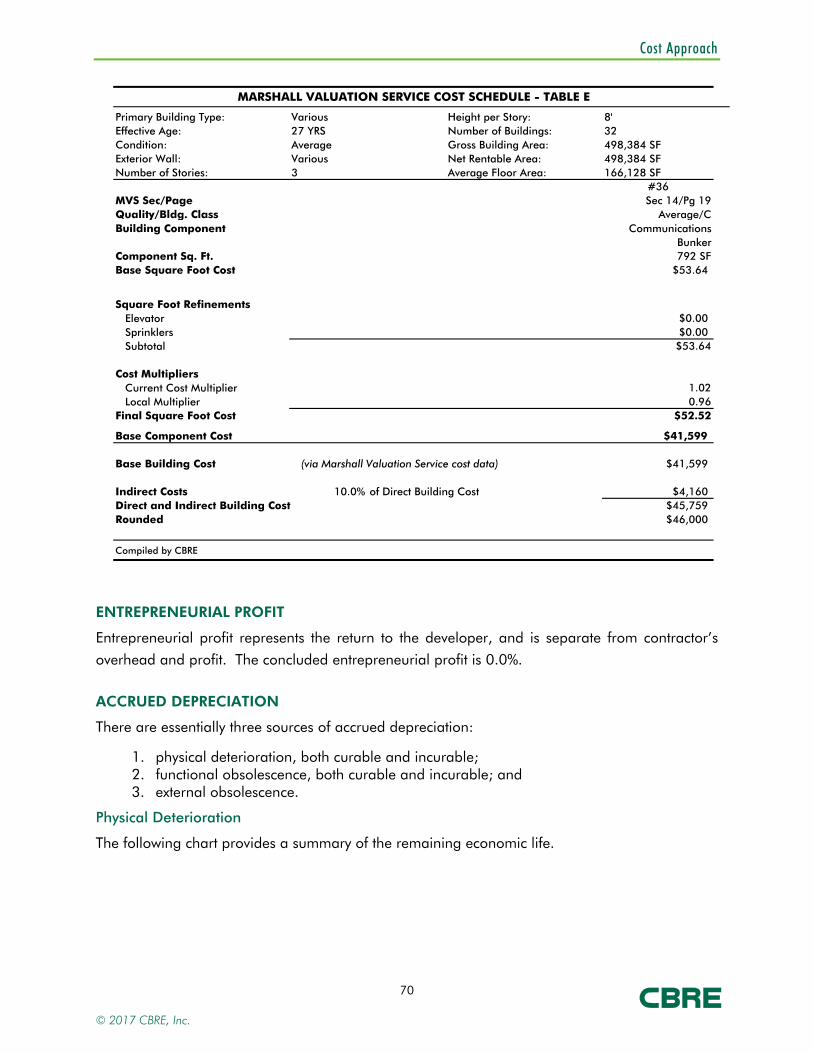
Cost Approach
70
MARSHALL VALUATION SERVICE COST SCHEDULE - TABLE E
Primary Building Type: Height per Story:Effective Age: Number of Buildings: 32Condition: Gross Building Area: 498,384 SFExterior Wall: Net Rentable Area: 498,384 SFNumber of Stories: Average Floor Area: 166,128 SF
#25 #27-30 #33 #34 #36MVS Sec/Page Sec 15/Pg 17 Sec 18/Pg 29 Sec 18/Pg 20 Sec 15/Pg 17 Sec 14/Pg 19Quality/Bldg. Class Average/C Average/D Average/D Low Cost/C Average/CBuilding Component Office Building Arts & Crafts
BuildingsBook Stores Office Communications
BunkerComponent Sq. Ft. 0 SF 0 SF 0 SF 0 SF 792 SF Base Square Foot Cost $109.26 $136.00 $87.00 $69.29 $53.64
Square Foot RefinementsElevator $0.00 $3.08 $0.00 $0.00 $0.00Sprinklers $0.00 $3.00 $0.00 $0.00 $0.00Subtotal $109.26 $142.08 $87.00 $69.29 $53.64
Cost MultipliersCurrent Cost Multiplier 1.01 1.01 1.01 1.01 1.02Local Multiplier 0.97 0.96 0.96 0.97 0.96
Final Square Foot Cost $107.04 $137.76 $84.36 $67.88 $52.52
Base Component Cost $0 $0 $0 $0 $41,599
Base Building Cost (via Marshall Valuation Service cost data) $41,599
Indirect Costs 10.0% of Direct Building Cost $4,160Direct and Indirect Building Cost $45,759Rounded $46,000
Compiled by CBRE
3
8'Various27 YRSAverageVarious
ENTREPRENEURIAL PROFIT
Entrepreneurial profit represents the return to the developer, and is separate from contractor’s
overhead and profit. The concluded entrepreneurial profit is 0.0%.
ACCRUED DEPRECIATION
There are essentially three sources of accrued depreciation:
1. physical deterioration, both curable and incurable; 2. functional obsolescence, both curable and incurable; and 3. external obsolescence.
Physical Deterioration
The following chart provides a summary of the remaining economic life.
© 2017 CBRE, Inc.

Cost Approach
71
ANALYSIS OF DEPRECIATION
BUILDINGSBASE BUILDING COST
REPLACEMENT COST NEW * YEAR BUILT % DEPRECIATED DEPRECIATION
DEPRECIATED REPLACEMENT COST
#1 $4,077,654 $4,485,420 1965 60.0% $2,691,252 $1,794,168
#2, #26 $3,783,576 $4,161,934 1962-1976 75.0% $3,121,450 $1,040,483
#3-5 $8,159,578 $8,975,536 1970 / 1996 60.0% $5,385,322 $3,590,215
#6A & 6B $2,101,853 $2,312,038 1998 24.0% $554,889 $1,757,149
#7, #11, #12 $11,064,087 $12,170,495 1962-1967 70.0% $8,519,347 $3,651,149
#8 $1,126,492 $1,239,142 2010 12.0% $148,697 $1,090,445
#10 $19,710 $21,681 1990 36.0% $7,805 $13,876
#13 $2,770,131 $3,047,144 1962 / 2002 70.0% $2,133,001 $914,143
#14-16 $7,464,296 $8,210,726 1993 40.0% $3,284,290 $4,926,435
#17, #32 $2,681,671 $2,949,838 1945 80.0% $2,359,871 $589,968
#18 $2,399,641 $2,639,605 1993 36.0% $950,258 $1,689,347
#19 $1,588,932 $1,747,825 1964 60.0% $1,048,695 $699,130
#21 $1,359,252 $1,495,177 1968 60.0% $897,106 $598,071
#23 $3,983,405 $4,381,746 1963 / 2005 40.0% $1,752,698 $2,629,048
#24 $923,028 $1,015,331 2010 14.0% $142,146 $873,185
#25 $358,591 $394,450 1981 60.0% $236,670 $157,780
#27-30 $4,712,671 $5,183,938 1998 26.0% $1,347,824 $3,836,114
#33 $245,642 $270,207 1994 57.5% $155,369 $114,838
#34 $111,329 $122,462 1990 54.0% $66,129 $56,332
#35 $76,201 $83,821 1966 72.0% $60,351 $23,470
#36 $41,599 $45,759 1962 70.0% $32,031 $13,728
Total $59,049,341 $64,954,276 $34,895,203 $30,059,073
* Inclusive of 10% Indirect Costs 53.7% 46.3%
Source: CBRE
ECONOMIC AGE AND LIFE
Actual Age 72 Years
Effective Age 27 Years
MVS Expected Life 50 Years
Remaining Economic Life 23 Years
Accrued Physical Incurable Depreciation 53.7%
Compiled by CBRE
Functional Obsolescence
Based on a review of the design and layout of the improvements, no forms of curable functional
obsolescence were noted. Because replacement cost considers the construction of the subject
improvements utilizing modern materials and current standards, design and layout, functional incurable obsolescence is not applicable.
External Obsolescence
External obsolescence is estimated by the capitalization of income loss. As the subject produces income, the income loss caused by the external obsolescence can be capitalized into an estimate
of the loss in total property value. As the land value is not impacted, the entire amount is
attributed to the improvements. For the purpose of this approach, the external obsolescence
affecting the subject from the new zoning overlay that now encompasses the subject property and
© 2017 CBRE, Inc.

Cost Approach
72
the increase in land value due to this overlay has been analyzed. Since a college will not pay an
increase in rent due to the increase in density and uses available through the redevelopment of the site, the increase in land value results in external obsolescence being present at the property.
The external obsolescence is calculated in the following table:
EXTERNAL OBSOLESCENCECost Feasible NOI: $1,997,751Pro-Forma Stabilized NOI: $3,239,496NOI Differential: ($1,241,745)Capitalized at: 8.75%External Obsolescence: $0
Compiled by CBRE
The cost feasible NOI is based on the depreciated cost of the improvements plus land value, multiplied by the current capitalization rate. The pro forma stabilized NOI is taken from the
direct capitalization schedule and supported by the assumptions in the appraisal report.
COST APPROACH CONCLUSION
The value estimate is calculated as follows.
© 2017 CBRE, Inc.

Cost Approach
73
COST APPROACH CONCLUSION
Primary Building Type: Height per Story: 8' - 10'Effective Age: Number of Buildings: 32Quality/Condition:Condition: Gross Building Area: 498,384 SFExterior Wall: Net Rentable Area: 498,384 SFNumber of Units: Average Unit Size: 498,384 SFNumber of Stories: Average Floor Area: 166,128 SF
Direct and Indirect Building Cost Table A $32,105,000Direct and Indirect Building Cost Table B $15,469,000Direct and Indirect Building Cost Table C $11,280,000Direct and Indirect Building Cost Table D $6,055,000Direct and Indirect Building Cost Table E $46,000
Subtotal $64,955,000Addition (70% Depreciated)
Signage, Landscaping, Walks, Parking & Miscellaneous Site Improvements $1,545,604Entrepreneurial Profit 0.0% of Total Building Cost $0
Replacement Cost New $66,500,604
Accrued DepreciationUnfinished Shell Space $0Incurable Physical Deterioration 53.7% ($34,895,203)
Functional Obsolescence $0External Obsolescence ($2,132,590)
Total Accrued Depreciation 55.7% of Replacement Cost New ($37,027,792)
Contributory Value of FF&E $0
Depreciated Replacement Cost $29,472,811
Land Value $7,550,000Indicated Stabilized Value $37,022,811
Curable Physical Deterioration ($776,200)Lease-Up Discount $0
Indicated As Is Value $36,246,611Rounded $36,200,000Value Per SF $72.63
Compiled by CBRE
13
of Replacement Cost New less Curable Physical Deterioration
Various27 YRSAverageAverageVarious
© 2017 CBRE, Inc.
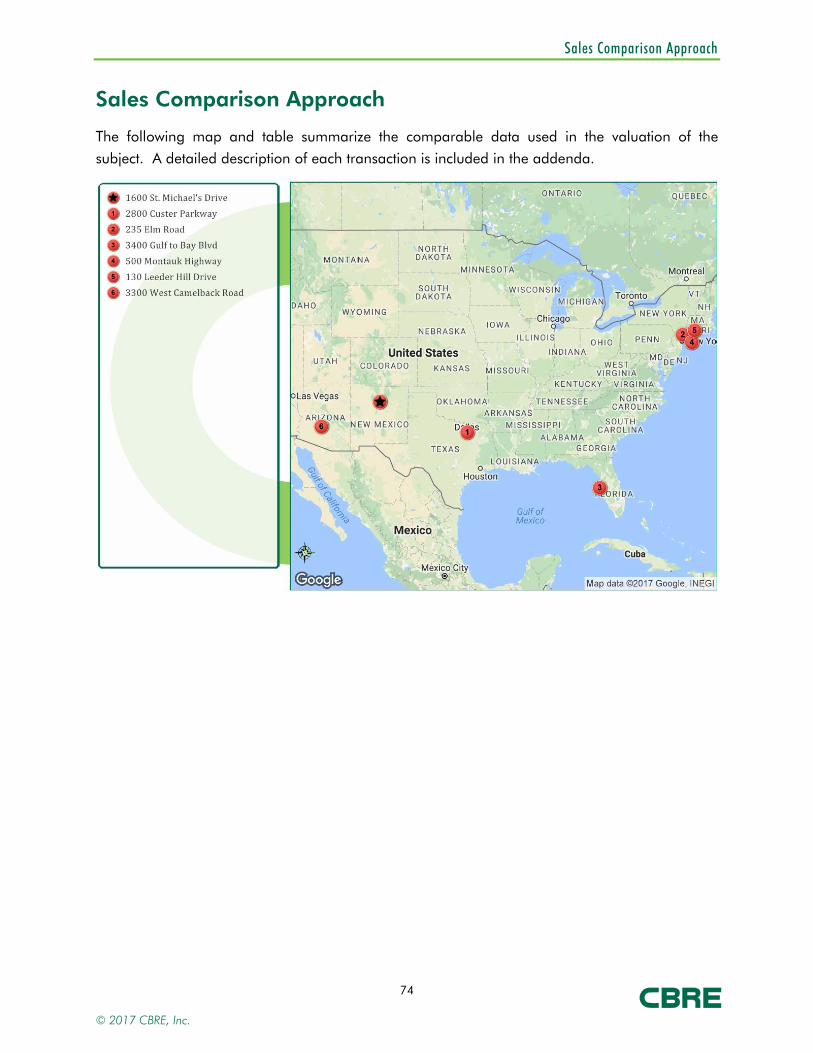
Sales Comparison Approach
74
Sales Comparison Approach
The following map and table summarize the comparable data used in the valuation of the subject. A detailed description of each transaction is included in the addenda.
© 2017 CBRE, Inc.

Sales Comparison Approach
75
SUMMARY OF COMPARABLE SCHOOL CAMPUS SALES
Land YOC / Property NRA Actual Sale PriceNo. Property Name Type Date (Acres) Reno'd Type (SF) Price Per SF 1
1 Canyon Creek Christian Academy,2800 Custer ParkwayRichardson, TX 75080
Sale Jan-17 7.02 1974 Special 160,000 $9,750,000 $60.94
2 Former Pace University Briarcliff Manor Campus,235 Elm RoadBriarcliff Manor, NY 10510
Sale Dec-16 37.17 1902 / 2000
Special 330,308 $17,000,000 $69.63
3 Former Clearwater Christian College,3400 Gulf to Bay Blvd.Clearwater, FL 33759
Sale Dec-16 27.39 1967 Special 141,965 $10,209,103 $71.91
4 St. John's University - Oakdale Campus,500 Montauk HighwayOakdale, NY 11769
Sale Sep-16 175.30 1897 / 1998
Special 260,000 $22,500,000 $86.54
5 Leeder Hill Drive School,130 Leeder Hill DriveHamden, CT 06517
Sale Jan-16 13.08 1970 / 1990
Special 144,574 $14,100,000 $97.53
6 Grand Canyon University,3300 West Camelback RoadPhoenix, AZ 85017
Sale Apr-09 90.00 1973 Special 475,000 $42,000,000 $88.42
Subj.Pro
Forma
Santa Fe University of Art & Design,1600 St Michael's DriveSanta Fe, NM 87505
--- --- 64.22 1945 / 2013
Special 498,384 --- ---
1 Adjusted sale price for cash equivalency, lease-up and/or deferred maintenance (where applicable)
Compiled by CBRE
Transaction
The sales utilized represent the best data available for comparison with the subject. They were
selected from our research of comparable improved sales nationally of facilities with similar utility, age and when possible, size. It should be noted that Comparable 6 was sold in April
2009. Although this comparable sale this dated, the property is located within the region of our
subject property, was of similar size and had some buildings of similar effective age to the
subject, making the property a good comparable sale in providing an indication of value for the subject property.
DISCUSSION/ANALYSIS OF IMPROVED SALES
Improved Sale One
This is the sale of a Baptist school located at 2800 Custer Parkway in Richardson, Texas. The facility was known as Canyon Creek Christian Academy and is 160,000 square feet in size and
located on a 7.02-acre parcel. The property sold on January 30, 2017 for $9,750,000 or
$60.94 per square foot of building area. The property was occupied by Canyon Creek Christian Academy for the last 20 years. The motivation of the purchaser was to utilize as a school. The
motivation of the seller was they no longer needed that large a building. The seller agreed to
lease back the property in the short-term until the buyer was ready to move in. The sale
© 2017 CBRE, Inc.
Sales Comparison Approach
76
contained no sale conditions that would have affected the sales price and there was no known
deferred maintenance.
Upon comparison with the subject, this comparable was considered superior in terms of size and
received a downward adjustment for this characteristic due to its smaller square footage. In
terms of age/condition, this comparable was judged inferior due to its older effective age and
received an upward adjustment for this characteristic. An adjustment for land to building ratio was considered appropriate for this comparable given its inferior sized land parcel in comparison
the building size. Because of this inferior trait, an upward adjustment was considered
appropriate. Overall, this comparable was deemed inferior in comparison to the subject and an upward net adjustment was warranted to the sales price indicator.
Improved Sale Two
This comparable represents a 330,308-square-foot, Class B school office property, which is
situated on a 37.17-acre parcel at 235 Elm Road, Briarcliff Manor, NY. The 3-story improvements were originally constructed in 1902 and were considered in average condition at
the time of sale. The property sold in December 2016 for $23,000,000, or $69.63 per square
foot. "The Briarcliff Manor Campus consists of nine buildings totaling 330,308 square feet located on a 37-acre campus. The buildings range in size from 13,041 square feet to 111,915
square feet and support a variety of uses - including office, student housing, dining, [auditorium],
recreational and educational. The expansive grounds also feature tennis courts and ball fields."
Pace University has owned the property since 1977. The university is expanding their Pleasantville, NY, campus, which has eliminated the need for this property in Briarcliff. The
property was purchased by the Research Center on Natural Conservation, Inc. who will use the
campus as a school for Chinese students. According to the selling broker, the property was in fair to good condition. The majority of the buildings were in good condition, but one of the
buildings required significant work (costs estimated to be between $5,000,000 and $7,000,000).
The costs to repair this building added to the sale price listed above. The property was marketed
by CBRE for 8 months, but was on the market previously for an unknown period.
The buildings are summarized as follows:
Dow Hall: built 1902, 111,915 SF, 166 beds, 4 stories
Dining Hall: built 1963, 26,253 SF, 2 stories
West Hall: built 1964/2000, 23,414 SF, 2 stories
Woodward Hall: built 1964, 26,013 SF, 2 stories
Hillside Dorm: built 1964, 28,256 SF, 94 beds, 2 stories
Howard Johnson: built 1950/1997, 25,031 SF, 25 beds, 4 stories
Valley Dorm: built 1963, 32,517 SF, 112 beds, 2 stories
© 2017 CBRE, Inc.
Sales Comparison Approach
77
New Dorm: built 1966, 43,868 SF, 168 beds, 4 stories
Tead Hall: built 1912/1998, 13,041 SF, 2 stories
The 2016 median home value at this property's location (10510 zip code) is $841,021 and the
2016 median household income is $162,621.
The downward adjustment for location reflects this comparable's superior feature with respect to being in an area with superior demographics. In terms of age/condition, this comparable was
judged inferior due to its older effective age and received an upward adjustment for this
characteristic. Overall, this comparable was deemed inferior in comparison to the subject and an upward net adjustment was warranted to the sales price indicator.
Improved Sale Three
This represents the sale of the former Clearwater Christian College located at 3400 Gulf to Bay
Blvd. in Clearwater, Florida. The property is 141,965 square feet in size located on a 27.39-acre parcel. The property was originally listed of $19,750,000, then dropped to $16,500,000 when
the property went under contract. The property was purchased by the chairman of the local
HMO Freedom Health, Inc. who plans on opening a medical school at the site. The purchaser reportedly purchased the existing note on the property for $10,209,103, which equates to
$71.91 per square foot. The improvements consist of 7-buildings constructed between 1967-
1996. The property consists of a student dorm with capacity of 600+/- students, gymnasium,
athletic fields, and a commercial kitchen w/dining hall.
In terms of conditions of sale, this comparable was considered inferior and received an upward
adjustment for this characteristic due to the buyer purchasing the note of the property. Upon
comparison with the subject, this comparable was considered superior in terms of size and received a downward adjustment for this characteristic due to its smaller square footage. In
terms of age/condition, this comparable was judged inferior due to its older effective age and the
buyers plan to spend money on renovations and expansion of the campus and received an
upward adjustment for this characteristic. An adjustment for land to building ratio was considered appropriate for this comparable given its superior sized land parcel in comparison the
building size. Because of this superior trait, a downward adjustment was considered appropriate.
Overall, this comparable was deemed inferior in comparison to the subject and an upward net adjustment was warranted to the sales price indicator.
Improved Sale Four
This is the sale of the Oakdale Campus of St. Johns University located at 500 Mantauk Highway
in Oakdale, New York. The campus was 260,000 square feet in size located on a 175.30-acre campus. The property was originally purchased by St. John's University in 1998, followed by an
investment of $10 million in renovating classrooms, laboratories and other buildings there. The
campus is highlighted by the original Georgian mansion built in 1897 for the president of the
© 2017 CBRE, Inc.

Sales Comparison Approach
78
Singer Sewing Machine Company. The property was purchased for $22,500,000 or $86.54 per
square foot by Amity University on September 2016.
The downward adjustment for location reflects this comparable's superior feature with respect to
being in an area with superior demographics. An adjustment for land to building ratio was
considered appropriate for this comparable given its superior sized land parcel in comparison the
building size. Because of this superior trait, a downward adjustment was considered appropriate. Overall, this comparable was deemed superior in comparison to the subject and a downward net
adjustment was warranted to the sales price indicator.
Improved Sale Five
The comparable is a 144,574-square foot, one- and two-story, school building that was
originally constructed in 1970 for use as a flex office building occupied by a local phone
company. The building was converted to its current school use in the late 1990’s. A gym addition
was completed in 2001. The building is basically divided into two sections, commonly referred to as Building A and Building B. Prior to the sale, the first floor of Building A was leased and
occupied by Highville Charter School. This space includes a one-story full-service cafeteria
building that also includes various multi-purpose rooms for gym activities and a culinary arts area. The remaining space consists of classrooms and administrative offices. The first level of
Building A and the upper floor of Building B was formerly leased to the City of New Haven Board
of Education and occupied by their Engineering and Science University Magnet School. This
space includes the 2001 gym addition with is located to the rear of the building. This area of the building generally consists of a cafeteria, numerous classrooms and various administrative
offices. The buyer, ACES, will fully occupy 100% of the building, relocating from another location
within Hamden to this property.
The downward adjustment for location reflects this comparable's superior feature with respect to
being in an area with superior demographics. Upon comparison with the subject, this
comparable was considered superior in terms of size and received a downward adjustment for
this characteristic due to its smaller square footage. Overall, this comparable was deemed superior in comparison to the subject and a downward net adjustment was warranted to the sales
price indicator.
Improved Sale Six
This sale/leaseback transaction between Grand Canyon University and Spirit Finance occurred in
2004. The indicated rental rate was $3,360,000 annually or $7.07 per square foot on a triple
net basis. This campus consists of approximately 40 buildings all located on an approximate 90-
acre campus in Phoenix. This property is considered to be in average condition and has buildings ranging in age. The property amenities include classrooms, dormitories, library, 4
baseball fields, 6 tennis courts, a 5,000 seat event center and other miscellaneous buildings. It
should be noted that as of May 2009, the University purchased the property back from Spirit
© 2017 CBRE, Inc.
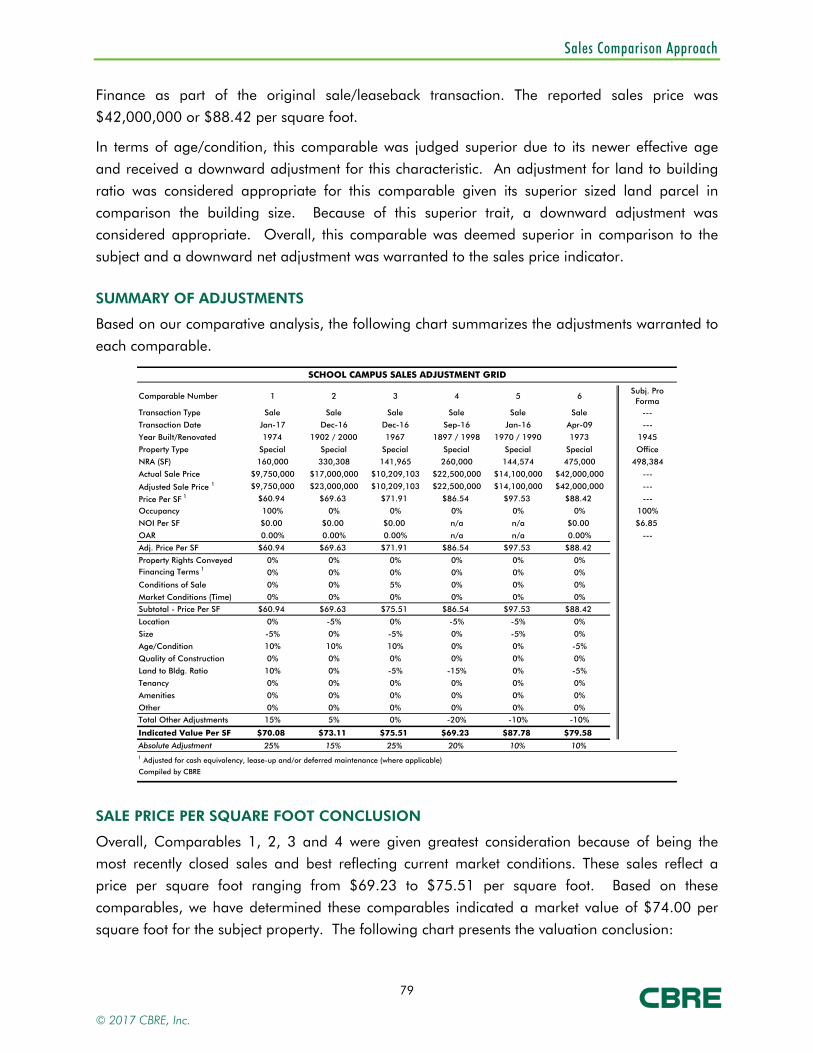
Sales Comparison Approach
79
Finance as part of the original sale/leaseback transaction. The reported sales price was
$42,000,000 or $88.42 per square foot.
In terms of age/condition, this comparable was judged superior due to its newer effective age
and received a downward adjustment for this characteristic. An adjustment for land to building
ratio was considered appropriate for this comparable given its superior sized land parcel in
comparison the building size. Because of this superior trait, a downward adjustment was considered appropriate. Overall, this comparable was deemed superior in comparison to the
subject and a downward net adjustment was warranted to the sales price indicator.
SUMMARY OF ADJUSTMENTS
Based on our comparative analysis, the following chart summarizes the adjustments warranted to
each comparable.
SCHOOL CAMPUS SALES ADJUSTMENT GRID
Comparable Number 1 2 3 4 5 6Subj. ProForma
Transaction Type Sale Sale Sale Sale Sale Sale ---
Transaction Date Jan-17 Dec-16 Dec-16 Sep-16 Jan-16 Apr-09 ---
Year Built/Renovated 1974 1902 / 2000 1967 1897 / 1998 1970 / 1990 1973 1945
Property Type Special Special Special Special Special Special Office
NRA (SF) 160,000 330,308 141,965 260,000 144,574 475,000 498,384
Actual Sale Price $9,750,000 $17,000,000 $10,209,103 $22,500,000 $14,100,000 $42,000,000 ---
Adjusted Sale Price 1 $9,750,000 $23,000,000 $10,209,103 $22,500,000 $14,100,000 $42,000,000 ---
Price Per SF 1 $60.94 $69.63 $71.91 $86.54 $97.53 $88.42 ---
Occupancy 100% 0% 0% 0% 0% 0% 100%
NOI Per SF $0.00 $0.00 $0.00 n/a n/a $0.00 $6.85
OAR 0.00% 0.00% 0.00% n/a n/a 0.00% ---
Adj. Price Per SF $60.94 $69.63 $71.91 $86.54 $97.53 $88.42
Property Rights Conveyed 0% 0% 0% 0% 0% 0%Financing Terms 1 0% 0% 0% 0% 0% 0%
Conditions of Sale 0% 0% 5% 0% 0% 0%
Market Conditions (Time) 0% 0% 0% 0% 0% 0%
Subtotal - Price Per SF $60.94 $69.63 $75.51 $86.54 $97.53 $88.42
Location 0% -5% 0% -5% -5% 0%
Size -5% 0% -5% 0% -5% 0%
Age/Condition 10% 10% 10% 0% 0% -5%
Quality of Construction 0% 0% 0% 0% 0% 0%
Land to Bldg. Ratio 10% 0% -5% -15% 0% -5%
Tenancy 0% 0% 0% 0% 0% 0%
Amenities 0% 0% 0% 0% 0% 0%
Other 0% 0% 0% 0% 0% 0%
Total Other Adjustments 15% 5% 0% -20% -10% -10%
Indicated Value Per SF $70.08 $73.11 $75.51 $69.23 $87.78 $79.58
Absolute Adjustment 25% 15% 25% 20% 10% 10%1 Adjusted for cash equivalency, lease-up and/or deferred maintenance (where applicable)
Compiled by CBRE
SALE PRICE PER SQUARE FOOT CONCLUSION
Overall, Comparables 1, 2, 3 and 4 were given greatest consideration because of being the most recently closed sales and best reflecting current market conditions. These sales reflect a
price per square foot ranging from $69.23 to $75.51 per square foot. Based on these
comparables, we have determined these comparables indicated a market value of $74.00 per
square foot for the subject property. The following chart presents the valuation conclusion:
© 2017 CBRE, Inc.
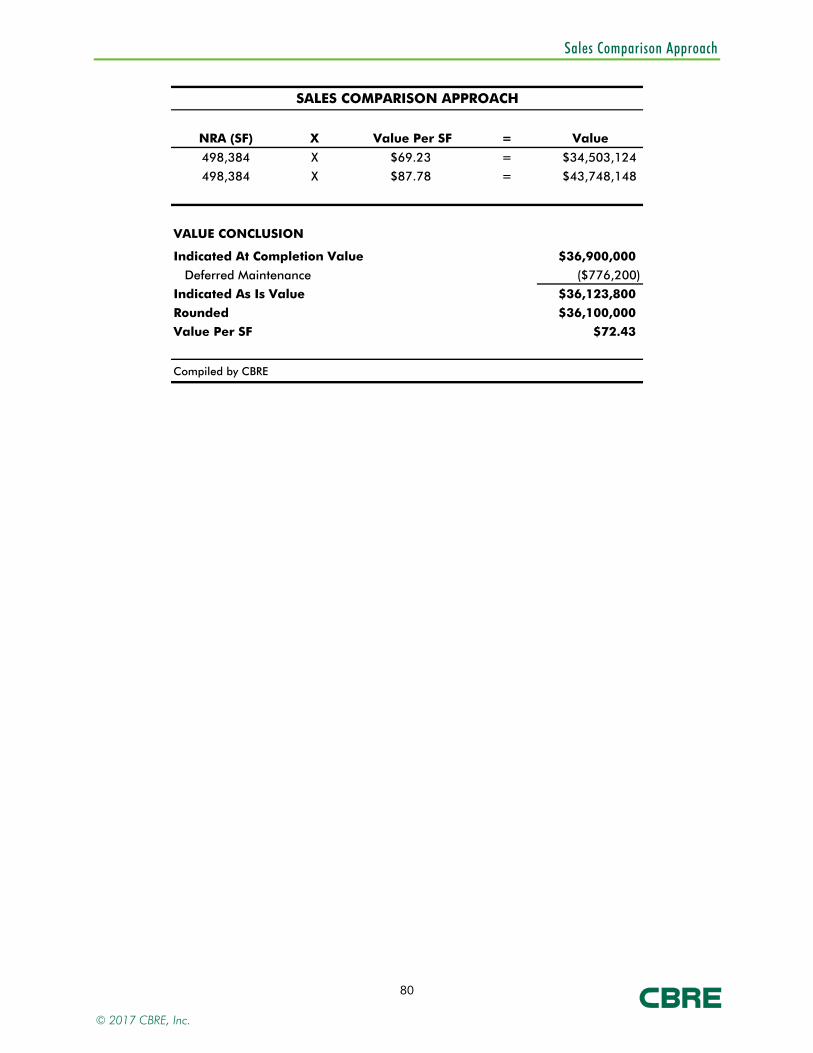
Sales Comparison Approach
80
SALES COMPARISON APPROACH
NRA (SF) X Value Per SF = Value
498,384 X $69.23 = $34,503,124
498,384 X $87.78 = $43,748,148
VALUE CONCLUSION
Indicated At Completion Value $36,900,000
Deferred Maintenance ($776,200)
Indicated As Is Value $36,123,800
Rounded $36,100,000
Value Per SF $72.43
Compiled by CBRE
© 2017 CBRE, Inc.
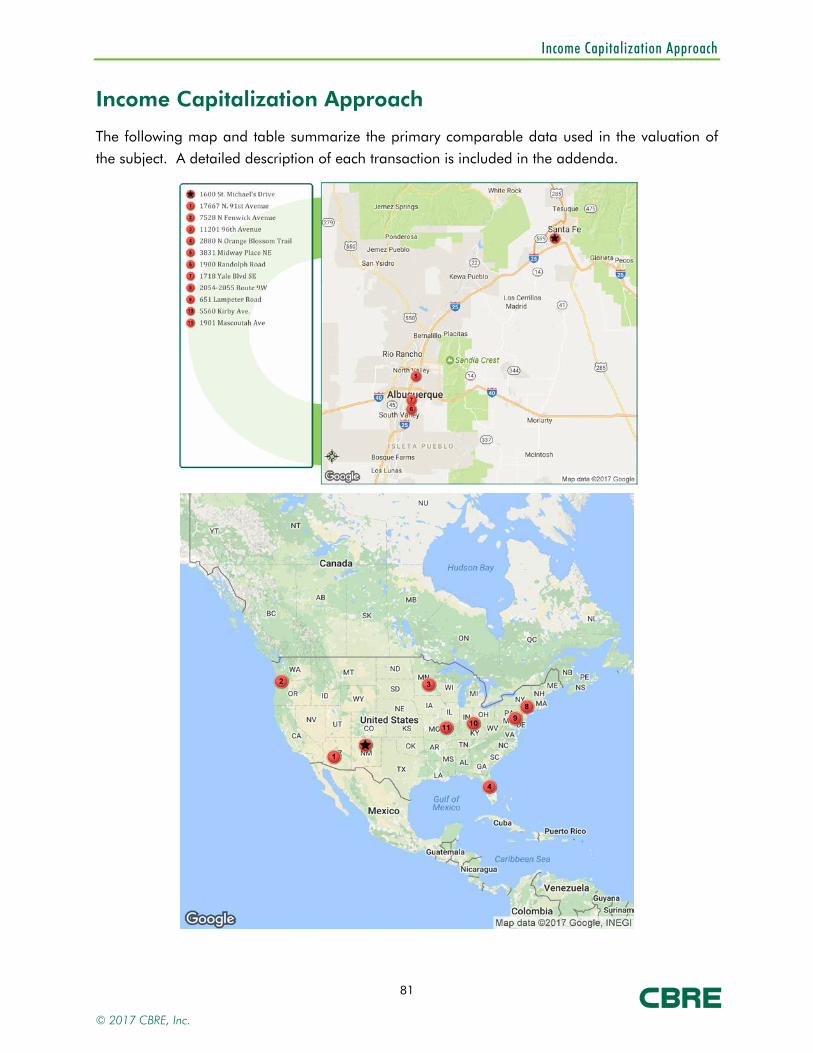
Income Capitalization Approach
81
Income Capitalization Approach
The following map and table summarize the primary comparable data used in the valuation of the subject. A detailed description of each transaction is included in the addenda.
© 2017 CBRE, Inc.

Income Capitalization Approach
82
SUMMARY OF COMPARABLE SCHOOL RENTALS
Comp. No.
Property Nameand Location
YOC / Reno'd NRA (SF)
TenantName
LeaseArea (SF)
LeaseDate
LeaseTerm Base Rent
Reimbursements Escalations
1 2005 30,604 Sonoran Science Academy 30,604 Jan-15 2.0 Yrs. $9.80 PSF NNN Flat
2 1913 53,643 De La Salle North Catholic High School 53,643 Apr-16 1.0 Yrs. $9.57 PSF NNN N/A
3 1981 146,855 Parnassus Preparatory School 146,855 Aug-17 30.0 Yrs. $12.59 PSF Absolute Net N/A
4 2014 59,482 Avant Garde 59,482 Jul-14 20.0 Yrs. $8.24 PSF NNN N/A
5 1993 34,785 Available 34,785 Jul-17 5.0 Yrs. $8.50 PSF NNN Neg.
/ 2008 Sage Montessoeri Charter School 34,785 Jul-16 1.0 Yrs. $7.19 PSF $0.00 PSF Flat
6 1984 15,800 Health Leadership High School 15,800 Jul-14 3.0 Yrs. $9.05 PSF NNN $3.10/sf annually
7 1966 59,744 Mission Achievement and Success 21,470 Jul-13 6.0 Yrs. $6.69 PSF NNN 3% annually
Subj. Santa Fe University of Art & Design1600 St Michael's Drive,Santa Fe, New Mexico
1945 / 2013
498,384 --- ---
Compiled by CBRE
Sonoran Science Academy17667 N. 91st Avenue,Peoria, AZ
Health Leadership High School1900 Randolph Road,Albuquerque, NM
Mission Achievement and Success1718 Yale Blvd. SE,Albuquerque, NM
De La Salle North Catholic High School7528 N Fenwick Avenue,Portland, OR
Parnassus Preparatory School11201 96th Ave,Maple Grove, MN
Avant Garde Charter School2880 N Orange Blossom Trail,Kissimmee, FL
Sage Montessori Charter School3831 Midway Place NE,Albuquerque, NM
The rentals utilized represent executed leases of school facilities throughout the United States and
three located of charter schools located within Albuquerque, New Mexico. We have searched for
recently leased facilities that are of similar size to the subject property and were not successful. The signed leases range from $6.69 to $12.59 per square foot. We are aware of a similarly
sized property that was leased to Grand Canyon University in Phoenix, Arizona in 2007 at a fixed
rate of approximately $7.00 per square foot on a triple net basis in a sale/lease back transaction. However, we felt a transaction that is approximately 10 years old was worthy of mention,
however too dated to utilize as a lease comparable.
SUMMARY OF COMPARABLE SCHOOLS AVAILABLE FOR LEASE
Comp. No.
Property Nameand Location
YOC / Reno'd
TenantName
LeaseArea (SF)
LeaseDate
LeaseTerm Base Rent Escalations
8 1920 Available for Lease 72,206 Jun-17 10.0 Yrs. $6.50 PSF Neg.
9 1979 Available for Lease 71,000 Jun-17 10.0 Yrs. $5.75 PSF Neg.
10 1929 Available for Lease 51,345 Jun-17 10.0 Yrs. $5.65 PSF neg.
11 1955 Available for lease 60,000 Jun-17 10.0 Yrs. $6.00 PSF Neg.
Subj. Santa Fe University of Art & Design1600 St Michael's Drive,Santa Fe, New Mexico
1945 / 2013
---
Compiled by CBRE
West Park NY School2054-2055 Route 9 W,West Park, NY
School Lancaster PA651 Lampeter Road,Lancaster, PASchool Cincinnati OH5560 Kirby Ave.,Cincinnati, OH
School Belleville IL1901 Mascoutah Ave.,Belleville, IL
© 2017 CBRE, Inc.
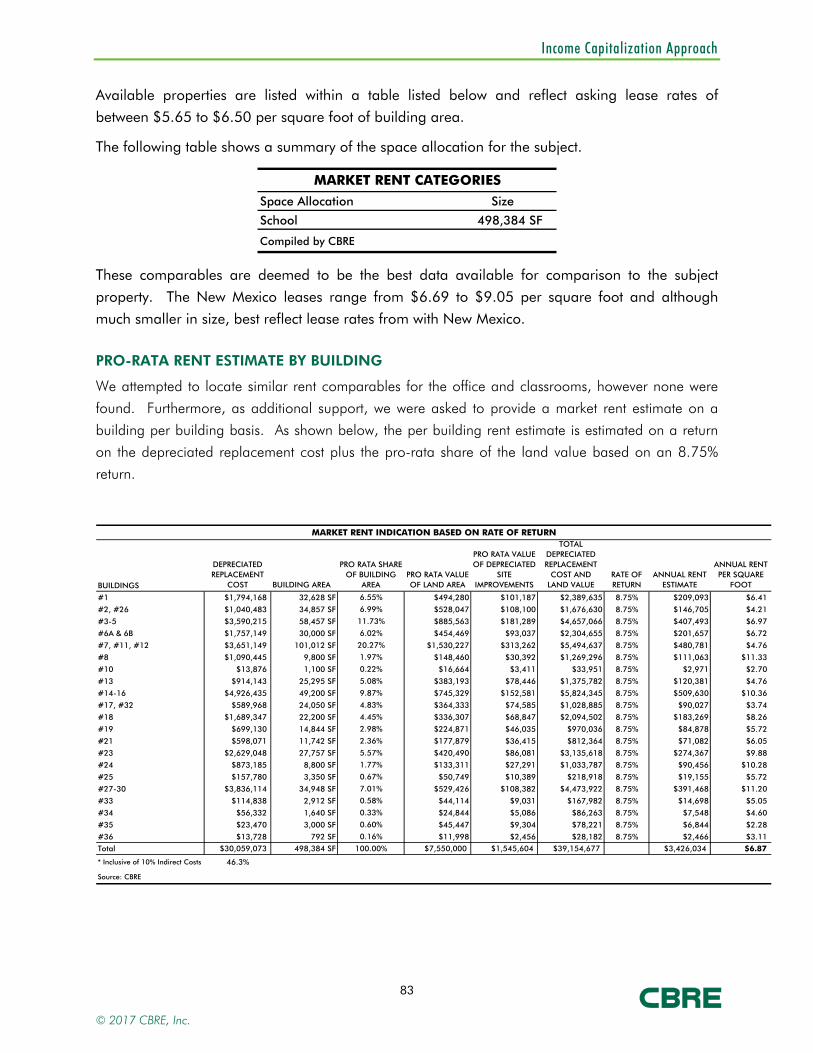
Income Capitalization Approach
83
Available properties are listed within a table listed below and reflect asking lease rates of
between $5.65 to $6.50 per square foot of building area.
The following table shows a summary of the space allocation for the subject.
MARKET RENT CATEGORIES
Space Allocation Size
School 498,384 SF
Compiled by CBRE
These comparables are deemed to be the best data available for comparison to the subject
property. The New Mexico leases range from $6.69 to $9.05 per square foot and although
much smaller in size, best reflect lease rates from with New Mexico.
PRO-RATA RENT ESTIMATE BY BUILDING
We attempted to locate similar rent comparables for the office and classrooms, however none were
found. Furthermore, as additional support, we were asked to provide a market rent estimate on a
building per building basis. As shown below, the per building rent estimate is estimated on a return on the depreciated replacement cost plus the pro-rata share of the land value based on an 8.75%
return.
MARKET RENT INDICATION BASED ON RATE OF RETURN
BUILDINGS
DEPRECIATED REPLACEMENT
COST BUILDING AREA
PRO RATA SHARE OF BUILDING
AREAPRO RATA VALUE OF LAND AREA
PRO RATA VALUE OF DEPRECIATED
SITE IMPROVEMENTS
TOTAL DEPRECIATED REPLACEMENT
COST AND LAND VALUE
RATE OF RETURN
ANNUAL RENT ESTIMATE
ANNUAL RENT PER SQUARE
FOOT
#1 $1,794,168 32,628 SF 6.55% $494,280 $101,187 $2,389,635 8.75% $209,093 $6.41
#2, #26 $1,040,483 34,857 SF 6.99% $528,047 $108,100 $1,676,630 8.75% $146,705 $4.21
#3-5 $3,590,215 58,457 SF 11.73% $885,563 $181,289 $4,657,066 8.75% $407,493 $6.97
#6A & 6B $1,757,149 30,000 SF 6.02% $454,469 $93,037 $2,304,655 8.75% $201,657 $6.72
#7, #11, #12 $3,651,149 101,012 SF 20.27% $1,530,227 $313,262 $5,494,637 8.75% $480,781 $4.76
#8 $1,090,445 9,800 SF 1.97% $148,460 $30,392 $1,269,296 8.75% $111,063 $11.33
#10 $13,876 1,100 SF 0.22% $16,664 $3,411 $33,951 8.75% $2,971 $2.70
#13 $914,143 25,295 SF 5.08% $383,193 $78,446 $1,375,782 8.75% $120,381 $4.76
#14-16 $4,926,435 49,200 SF 9.87% $745,329 $152,581 $5,824,345 8.75% $509,630 $10.36
#17, #32 $589,968 24,050 SF 4.83% $364,333 $74,585 $1,028,885 8.75% $90,027 $3.74
#18 $1,689,347 22,200 SF 4.45% $336,307 $68,847 $2,094,502 8.75% $183,269 $8.26
#19 $699,130 14,844 SF 2.98% $224,871 $46,035 $970,036 8.75% $84,878 $5.72
#21 $598,071 11,742 SF 2.36% $177,879 $36,415 $812,364 8.75% $71,082 $6.05
#23 $2,629,048 27,757 SF 5.57% $420,490 $86,081 $3,135,618 8.75% $274,367 $9.88
#24 $873,185 8,800 SF 1.77% $133,311 $27,291 $1,033,787 8.75% $90,456 $10.28
#25 $157,780 3,350 SF 0.67% $50,749 $10,389 $218,918 8.75% $19,155 $5.72
#27-30 $3,836,114 34,948 SF 7.01% $529,426 $108,382 $4,473,922 8.75% $391,468 $11.20
#33 $114,838 2,912 SF 0.58% $44,114 $9,031 $167,982 8.75% $14,698 $5.05
#34 $56,332 1,640 SF 0.33% $24,844 $5,086 $86,263 8.75% $7,548 $4.60
#35 $23,470 3,000 SF 0.60% $45,447 $9,304 $78,221 8.75% $6,844 $2.28
#36 $13,728 792 SF 0.16% $11,998 $2,456 $28,182 8.75% $2,466 $3.11
Total $30,059,073 498,384 SF 100.00% $7,550,000 $1,545,604 $39,154,677 $3,426,034 $6.87
* Inclusive of 10% Indirect Costs 46.3%
Source: CBRE
© 2017 CBRE, Inc.
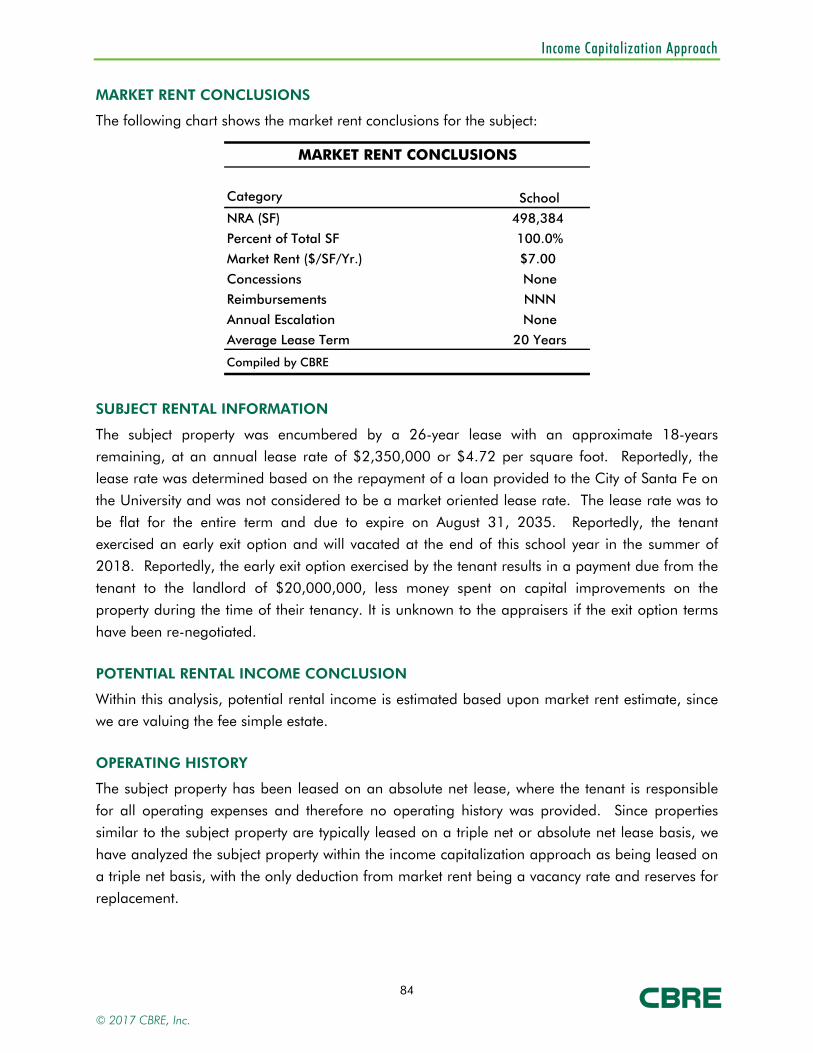
Income Capitalization Approach
84
MARKET RENT CONCLUSIONS
The following chart shows the market rent conclusions for the subject:
MARKET RENT CONCLUSIONS
Category
NRA (SF) 498,384
Percent of Total SF 100.0%
Market Rent ($/SF/Yr.) $7.00
Concessions None
Reimbursements NNN
Annual Escalation None
Average Lease Term 20 Years
Compiled by CBRE
School
SUBJECT RENTAL INFORMATION
The subject property was encumbered by a 26-year lease with an approximate 18-years
remaining, at an annual lease rate of $2,350,000 or $4.72 per square foot. Reportedly, the lease rate was determined based on the repayment of a loan provided to the City of Santa Fe on
the University and was not considered to be a market oriented lease rate. The lease rate was to
be flat for the entire term and due to expire on August 31, 2035. Reportedly, the tenant exercised an early exit option and will vacated at the end of this school year in the summer of
2018. Reportedly, the early exit option exercised by the tenant results in a payment due from the
tenant to the landlord of $20,000,000, less money spent on capital improvements on the property during the time of their tenancy. It is unknown to the appraisers if the exit option terms
have been re-negotiated.
POTENTIAL RENTAL INCOME CONCLUSION
Within this analysis, potential rental income is estimated based upon market rent estimate, since we are valuing the fee simple estate.
OPERATING HISTORY
The subject property has been leased on an absolute net lease, where the tenant is responsible
for all operating expenses and therefore no operating history was provided. Since properties similar to the subject property are typically leased on a triple net or absolute net lease basis, we
have analyzed the subject property within the income capitalization approach as being leased on
a triple net basis, with the only deduction from market rent being a vacancy rate and reserves for replacement.
© 2017 CBRE, Inc.

Income Capitalization Approach
85
VACANCY
Since the subject will likely have a period of vacancy, we have analyzed the subject property at a market oriented lease rate and a global vacancy of 5%. The subject’s vacancy is detailed as
follows:
VACANCY
Year % PGI
Current 0%
CBRE Estimate 5%
Compiled by CBRE
The vacancy estimate for the subject is on the basis of a 5% deduction applied against the scheduled rental revenues.
EFFECTIVE GROSS INCOME
The subject’s effective gross income is detailed as follows:
EFFECTIVE GROSS INCOME
Year Total $/SF
CBRE Estimate $3,314,254 $6.65
Compiled by CBRE
OPERATING EXPENSE ANALYSIS
As the subject lease structure is based on an absolute triple net structure, all operating expenses
will be the responsibility of the tenant. The only expenses would be a reserve for replacement
amount of $0.15 per square foot of building area.
Reserves for Replacement
Reserves for replacement have been estimated based on market parameters.
RESERVES FOR REPLACEMENT
Year Total $/SF
CBRE Estimate $74,758 $0.15
Compiled by CBRE
OPERATING EXPENSE CONCLUSION
The comparable data and projections for the subject are summarized as follows:
© 2017 CBRE, Inc.

Income Capitalization Approach
86
RESERVES FOR REPLACEMENT
Year Total $/SF
CBRE Estimate $74,758 $0.15
Compiled by CBRE
NET OPERATING INCOME CONCLUSION
The comparable data and projections for the subject are summarized as follows:
NET OPERATING INCOME
Year Total $/SF
CBRE Estimate $3,239,496 $6.50
Compiled by CBRE
DIRECT CAPITALIZATION
Direct capitalization is a method used to convert a single year’s estimated stabilized net operating
income into a value indication. The following subsections represent different techniques for
deriving an overall capitalization rate.
Comparable Sales
The overall capitalization rates (OARs) confirmed for the comparable sales analyzed in the sales
comparison approach are as follows:
COMPARABLE CAPITALIZATION RATES
Sale Sale Price
Sale Date $/SF Occupancy OAR6 Apr-09 $88.42 100% 8.00%
Indicated OAR: 95% 8.00%
Compiled by: CBRE
The overall capitalization rates for these sales were derived based upon the actual or pro-forma
income characteristics of the property. Sale Comparable #6 represents a property that was a tenant repurchasing a property they formally sold in a sale/leaseback transaction at a sales price
that represents an 8% capitalization rate based on their current lease rate at time of purchase.
Secondary Comparable Sales
Since capitalization rates were limited within our comparable data, we analyzed sale of school properties nationally to extract capitalization rates of properties with similar utility. Those
secondary cap rate comparables are as follows:
© 2017 CBRE, Inc.
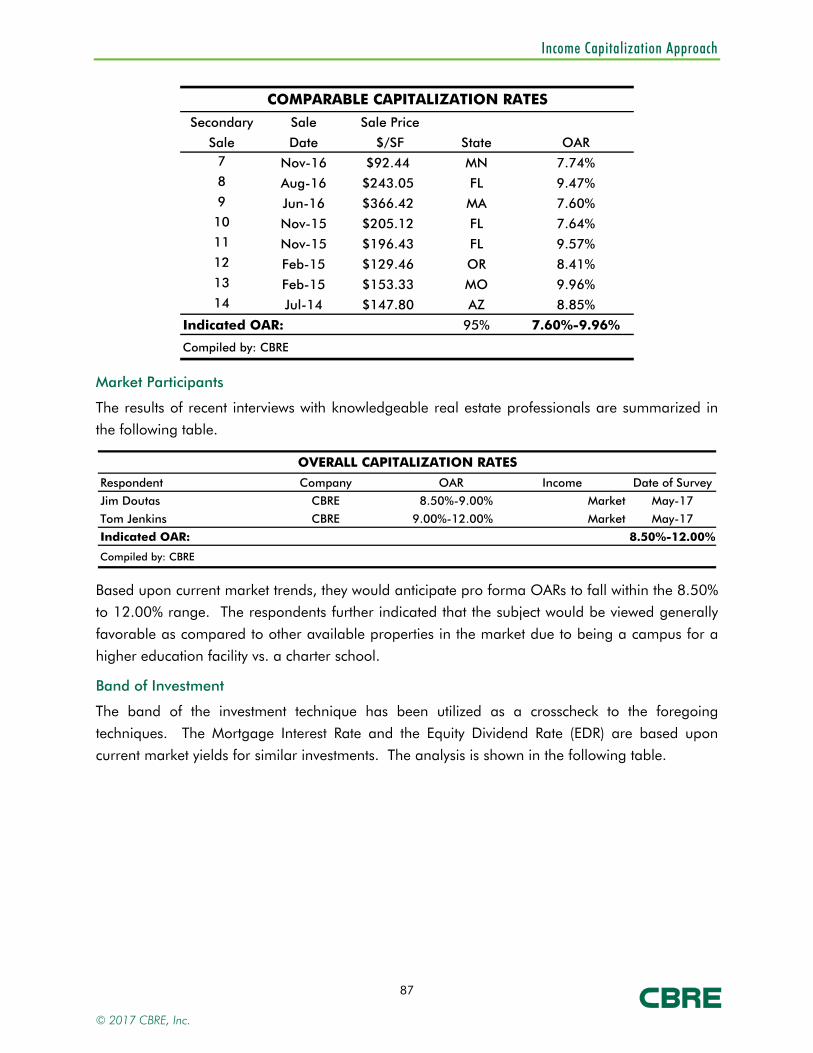
Income Capitalization Approach
87
COMPARABLE CAPITALIZATION RATES
Secondary Sale Sale Price
Sale Date $/SF State OAR7 Nov-16 $92.44 MN 7.74%8 Aug-16 $243.05 FL 9.47%9 Jun-16 $366.42 MA 7.60%10 Nov-15 $205.12 FL 7.64%11 Nov-15 $196.43 FL 9.57%12 Feb-15 $129.46 OR 8.41%13 Feb-15 $153.33 MO 9.96%14 Jul-14 $147.80 AZ 8.85%
Indicated OAR: 95% 7.60%-9.96%
Compiled by: CBRE
Market Participants
The results of recent interviews with knowledgeable real estate professionals are summarized in
the following table.
OVERALL CAPITALIZATION RATES
Respondent Company OAR Income Date of Survey
Jim Doutas CBRE 8.50%-9.00% Market May-17
Tom Jenkins CBRE 9.00%-12.00% Market May-17
Indicated OAR: 8.50%-12.00%
Compiled by: CBRE
Based upon current market trends, they would anticipate pro forma OARs to fall within the 8.50% to 12.00% range. The respondents further indicated that the subject would be viewed generally
favorable as compared to other available properties in the market due to being a campus for a
higher education facility vs. a charter school.
Band of Investment
The band of the investment technique has been utilized as a crosscheck to the foregoing
techniques. The Mortgage Interest Rate and the Equity Dividend Rate (EDR) are based upon
current market yields for similar investments. The analysis is shown in the following table.
© 2017 CBRE, Inc.
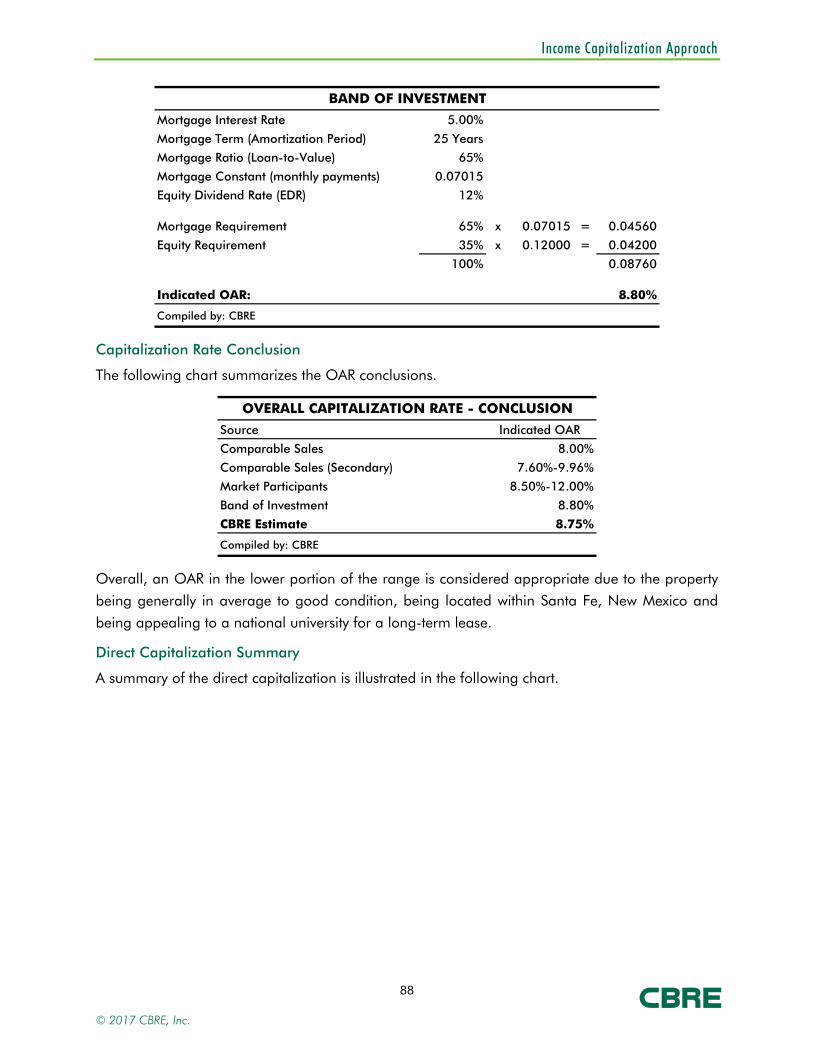
Income Capitalization Approach
88
BAND OF INVESTMENT
Mortgage Interest Rate 5.00%
Mortgage Term (Amortization Period) 25 Years
Mortgage Ratio (Loan-to-Value) 65%
Mortgage Constant (monthly payments) 0.07015
Equity Dividend Rate (EDR) 12%
Mortgage Requirement 65% x 0.07015 = 0.04560
Equity Requirement 35% x 0.12000 = 0.04200
100% 0.08760
Indicated OAR: 8.80%
Compiled by: CBRE
Capitalization Rate Conclusion
The following chart summarizes the OAR conclusions.
OVERALL CAPITALIZATION RATE - CONCLUSION
Source Indicated OAR
Comparable Sales 8.00%
Comparable Sales (Secondary) 7.60%-9.96%
Market Participants 8.50%-12.00%
Band of Investment 8.80%
CBRE Estimate 8.75%
Compiled by: CBRE
Overall, an OAR in the lower portion of the range is considered appropriate due to the property
being generally in average to good condition, being located within Santa Fe, New Mexico and
being appealing to a national university for a long-term lease.
Direct Capitalization Summary
A summary of the direct capitalization is illustrated in the following chart.
© 2017 CBRE, Inc.
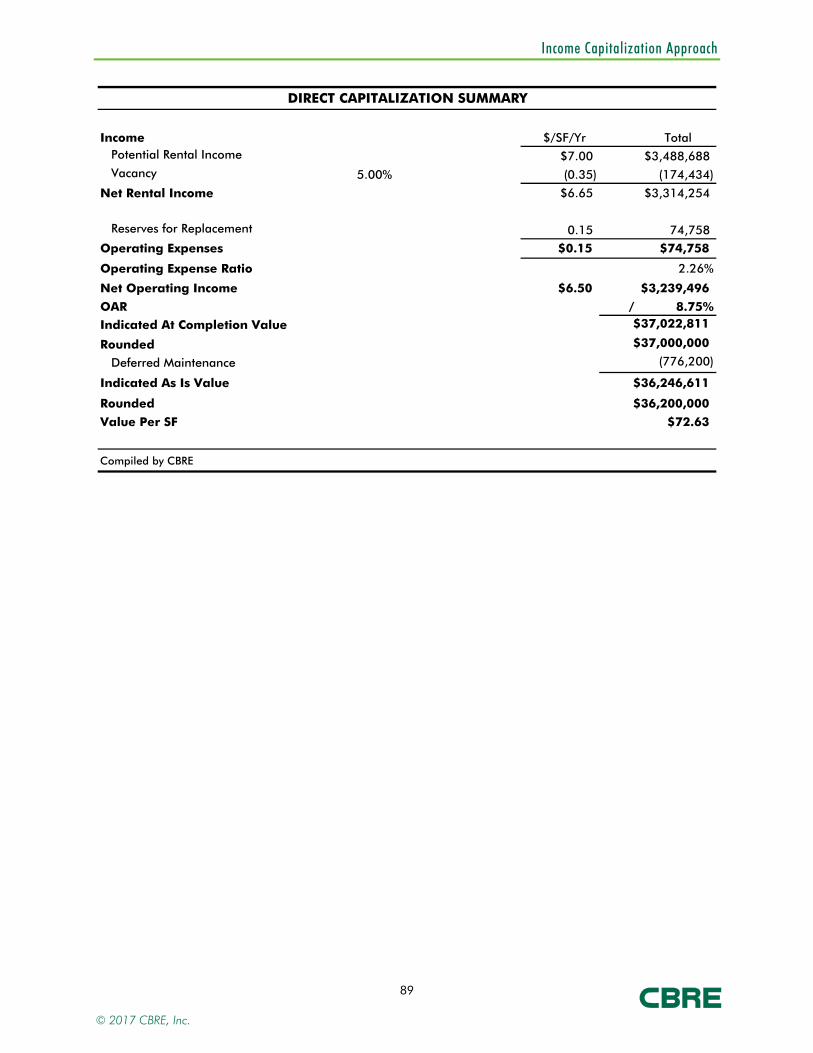
Income Capitalization Approach
89
DIRECT CAPITALIZATION SUMMARY
Income $/Door/Mo. $/SF/Yr Total Potential Rental Income #DIV/0! $7.00 $3,488,688Vacancy 5.00% #DIV/0! (0.35) (174,434)
Net Rental Income #DIV/0! $6.65 $3,314,254
Reserves for Replacement 0.15 74,758
Operating Expenses $0.15 $74,758
Operating Expense Ratio 2.26%
Net Operating Income $6.50 $3,239,496
OAR / 8.75%
Indicated At Completion Value $37,022,811
Rounded $37,000,000
Deferred Maintenance (776,200)
Indicated As Is Value $36,246,611
Rounded $36,200,000
Value Per SF $72.63
Compiled by CBRE
© 2017 CBRE, Inc.
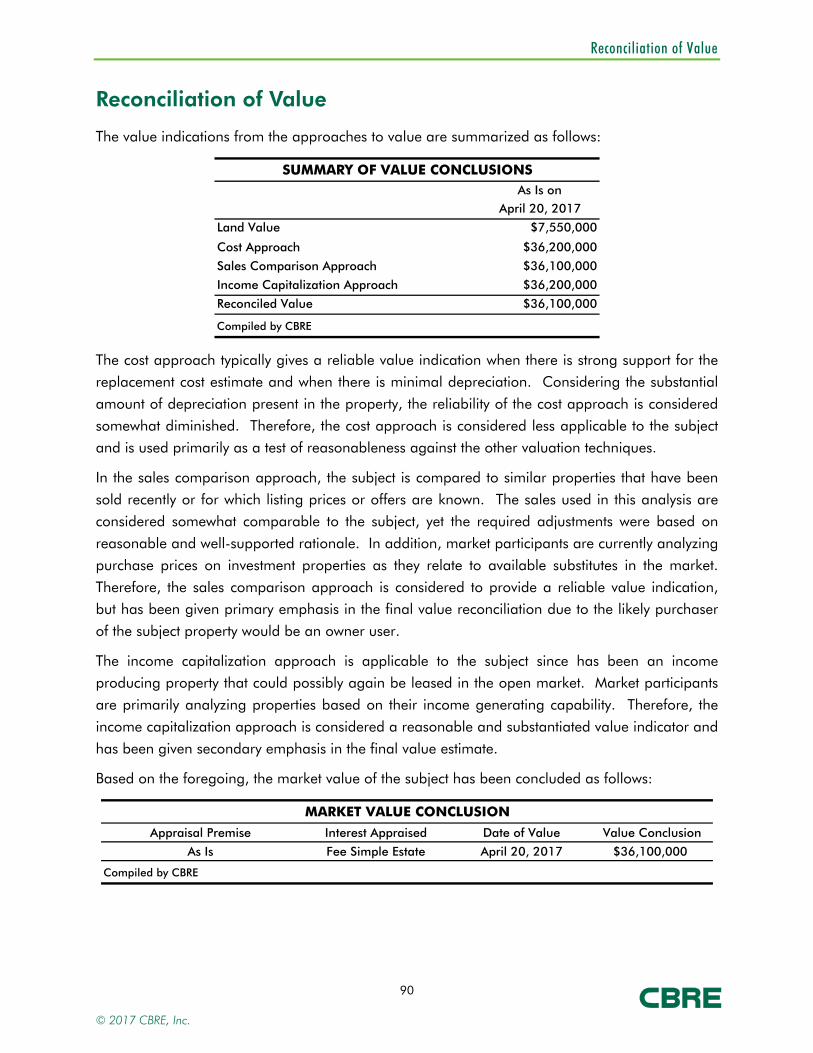
Reconciliation of Value
90
Reconciliation of Value
The value indications from the approaches to value are summarized as follows:
SUMMARY OF VALUE CONCLUSIONSAs Is on
April 20, 2017
Land Value $7,550,000
Cost Approach $36,200,000
Sales Comparison Approach $36,100,000
Income Capitalization Approach $36,200,000
Reconciled Value $36,100,000
Compiled by CBRE
The cost approach typically gives a reliable value indication when there is strong support for the replacement cost estimate and when there is minimal depreciation. Considering the substantial
amount of depreciation present in the property, the reliability of the cost approach is considered
somewhat diminished. Therefore, the cost approach is considered less applicable to the subject and is used primarily as a test of reasonableness against the other valuation techniques.
In the sales comparison approach, the subject is compared to similar properties that have been
sold recently or for which listing prices or offers are known. The sales used in this analysis are considered somewhat comparable to the subject, yet the required adjustments were based on
reasonable and well-supported rationale. In addition, market participants are currently analyzing
purchase prices on investment properties as they relate to available substitutes in the market.
Therefore, the sales comparison approach is considered to provide a reliable value indication, but has been given primary emphasis in the final value reconciliation due to the likely purchaser
of the subject property would be an owner user.
The income capitalization approach is applicable to the subject since has been an income producing property that could possibly again be leased in the open market. Market participants
are primarily analyzing properties based on their income generating capability. Therefore, the
income capitalization approach is considered a reasonable and substantiated value indicator and
has been given secondary emphasis in the final value estimate.
Based on the foregoing, the market value of the subject has been concluded as follows:
MARKET VALUE CONCLUSION
Appraisal Premise Interest Appraised Date of Value Value Conclusion
As Is Fee Simple Estate April 20, 2017 $36,100,000
Compiled by CBRE
© 2017 CBRE, Inc.
Assumptions and Limiting Conditions
91
Assumptions and Limiting Conditions
1. CBRE, Inc. through its appraiser (collectively, “CBRE”) has inspected through reasonable observation the subject property. However, it is not possible or reasonably practicable to personally inspect conditions beneath the soil and the entire interior and exterior of the improvements on the subject property. Therefore, no representation is made as to such matters.
2. The report, including its conclusions and any portion of such report (the “Report”), is as of the date set forth in the letter of transmittal and based upon the information, market, economic, and property conditions and projected levels of operation existing as of such date. The dollar amount of any conclusion as to value in the Report is based upon the purchasing power of the U.S. Dollar on such date. The Report is subject to change as a result of fluctuations in any of the foregoing. CBRE has no obligation to revise the Report to reflect any such fluctuations or other events or conditions which occur subsequent to such date.
3. Unless otherwise expressly noted in the Report, CBRE has assumed that:
(i) Title to the subject property is clear and marketable and that there are no recorded or unrecorded matters or exceptions to title that would adversely affect marketability or value. CBRE has not examined title records (including without limitation liens, encumbrances, easements, deed restrictions, and other conditions that may affect the title or use of the subject property) and makes no representations regarding title or its limitations on the use of the subject property. Insurance against financial loss that may arise out of defects in title should be sought from a qualified title insurance company.
(ii) Existing improvements on the subject property conform to applicable local, state, and federal building codes and ordinances, are structurally sound and seismically safe, and have been built and repaired in a workmanlike manner according to standard practices; all building systems (mechanical/electrical, HVAC, elevator, plumbing, etc.) are in good working order with no major deferred maintenance or repair required; and the roof and exterior are in good condition and free from intrusion by the elements. CBRE has not retained independent structural, mechanical, electrical, or civil engineers in connection with this appraisal and, therefore, makes no representations relative to the condition of improvements. CBRE appraisers are not engineers and are not qualified to judge matters of an engineering nature, and furthermore structural problems or building system problems may not be visible. It is expressly assumed that any purchaser would, as a precondition to closing a sale, obtain a satisfactory engineering report relative to the structural integrity of the property and the integrity of building systems.
(iii) Any proposed improvements, on or off-site, as well as any alterations or repairs considered will be completed in a workmanlike manner according to standard practices.
(iv) Hazardous materials are not present on the subject property. CBRE is not qualified to detect such substances. The presence of substances such as asbestos, urea formaldehyde foam insulation, contaminated groundwater, mold, or other potentially hazardous materials may affect the value of the property.
(v) No mineral deposit or subsurface rights of value exist with respect to the subject property, whether gas, liquid, or solid, and no air or development rights of value may be transferred. CBRE has not considered any rights associated with extraction or exploration of any resources, unless otherwise expressly noted in the Report.
(vi) There are no contemplated public initiatives, governmental development controls, rent controls, or changes in the present zoning ordinances or regulations governing use, density, or shape that would significantly affect the value of the subject property.
(vii) All required licenses, certificates of occupancy, consents, or other legislative or administrative authority from any local, state, nor national government or private entity or organization have been or can be readily obtained or renewed for any use on which the Report is based.
(viii) The subject property is managed and operated in a prudent and competent manner, neither inefficiently or super-efficiently.
(ix) The subject property and its use, management, and operation are in full compliance with all applicable federal, state, and local regulations, laws, and restrictions, including without limitation environmental laws, seismic hazards, flight patterns, decibel levels/noise envelopes, fire hazards, hillside ordinances, density, allowable uses, building codes, permits, and licenses.
(x) The subject property is in full compliance with the Americans with Disabilities Act (ADA). CBRE is not qualified to assess the subject property’s compliance with the ADA, notwithstanding any discussion of possible readily achievable barrier removal construction items in the Report.
© 2017 CBRE, Inc.
Assumptions and Limiting Conditions
92
(xi) All information regarding the areas and dimensions of the subject property furnished to CBRE are correct, and no encroachments exist. CBRE has neither undertaken any survey of the boundaries of the subject property nor reviewed or confirmed the accuracy of any legal description of the subject property.
Unless otherwise expressly noted in the Report, no issues regarding the foregoing were brought to CBRE’s attention, and CBRE has no knowledge of any such facts affecting the subject property. If any information inconsistent with any of the foregoing assumptions is discovered, such information could have a substantial negative impact on the Report. Accordingly, if any such information is subsequently made known to CBRE, CBRE reserves the right to amend the Report, which may include the conclusions of the Report. CBRE assumes no responsibility for any conditions regarding the foregoing, or for any expertise or knowledge required to discover them. Any user of the Report is urged to retain an expert in the applicable field(s) for information regarding such conditions.
4. CBRE has assumed that all documents, data and information furnished by or behalf of the client, property owner, or owner’s representative are accurate and correct, unless otherwise expressly noted in the Report. Such data and information include, without limitation, numerical street addresses, lot and block numbers, Assessor’s Parcel Numbers, land dimensions, square footage area of the land, dimensions of the improvements, gross building areas, net rentable areas, usable areas, unit count, room count, rent schedules, income data, historical operating expenses, budgets, and related data. Any error in any of the above could have a substantial impact on the Report. Accordingly, if any such errors are subsequently made known to CBRE, CBRE reserves the right to amend the Report, which may include the conclusions of the Report. The client and intended user should carefully review all assumptions, data, relevant calculations, and conclusions of the Report and should immediately notify CBRE of any questions or errors within 30 days after the date of delivery of the Report.
5. CBRE assumes no responsibility (including any obligation to procure the same) for any documents, data or information not provided to CBRE, including without limitation any termite inspection, survey or occupancy permit.
6. All furnishings, equipment and business operations have been disregarded with only real property being considered in the Report, except as otherwise expressly stated and typically considered part of real property.
7. Any cash flows included in the analysis are forecasts of estimated future operating characteristics based upon the information and assumptions contained within the Report. Any projections of income, expenses and economic conditions utilized in the Report, including such cash flows, should be considered as only estimates of the expectations of future income and expenses as of the date of the Report and not predictions of the future. Actual results are affected by a number of factors outside the control of CBRE, including without limitation fluctuating economic, market, and property conditions. Actual results may ultimately differ from these projections, and CBRE does not warrant any such projections.
8. The Report contains professional opinions and is expressly not intended to serve as any warranty, assurance or guarantee of any particular value of the subject property. Other appraisers may reach different conclusions as to the value of the subject property. Furthermore, market value is highly related to exposure time, promotion effort, terms, motivation, and conclusions surrounding the offering of the subject property. The Report is for the sole purpose of providing the intended user with CBRE’s independent professional opinion of the value of the subject property as of the date of the Report. Accordingly, CBRE shall not be liable for any losses that arise from any investment or lending decisions based upon the Report that the client, intended user, or any buyer, seller, investor, or lending institution may undertake related to the subject property, and CBRE has not been compensated to assume any of these risks. Nothing contained in the Report shall be construed as any direct or indirect recommendation of CBRE to buy, sell, hold, or finance the subject property.
9. No opinion is expressed on matters which may require legal expertise or specialized investigation or knowledge beyond that customarily employed by real estate appraisers. Any user of the Report is advised to retain experts in areas that fall outside the scope of the real estate appraisal profession for such matters.
10. CBRE assumes no responsibility for any costs or consequences arising due to the need, or the lack of need, for flood hazard insurance. An agent for the Federal Flood Insurance Program should be contacted to determine the actual need for Flood Hazard Insurance.
11. Acceptance or use of the Report constitutes full acceptance of these Assumptions and Limiting Conditions and any special assumptions set forth in the Report. It is the responsibility of the user of the Report to read in full, comprehend and thus become aware of all such assumptions and limiting conditions. CBRE assumes no responsibility for any situation arising out of the user’s failure to become familiar with and understand the same.
12. The Report applies to the property as a whole only, and any pro ration or division of the title into fractional interests will invalidate such conclusions, unless the Report expressly assumes such pro ration or division of interests.
© 2017 CBRE, Inc.
Assumptions and Limiting Conditions
93
13. The allocations of the total value estimate in the Report between land and improvements apply only to the existing use of the subject property. The allocations of values for each of the land and improvements are not intended to be used with any other property or appraisal and are not valid for any such use.
14. The maps, plats, sketches, graphs, photographs, and exhibits included in this Report are for illustration purposes only and shall be utilized only to assist in visualizing matters discussed in the Report. No such items shall be removed, reproduced, or used apart from the Report.
15. The Report shall not be duplicated or provided to any unintended users in whole or in part without the written consent of CBRE, which consent CBRE may withhold in its sole discretion. Exempt from this restriction is duplication for the internal use of the intended user and its attorneys, accountants, or advisors for the sole benefit of the intended user. Also exempt from this restriction is transmission of the Report pursuant to any requirement of any court, governmental authority, or regulatory agency having jurisdiction over the intended user, provided that the Report and its contents shall not be published, in whole or in part, in any public document without the written consent of CBRE, which consent CBRE may withhold in its sole discretion. Finally, the Report shall not be made available to the public or otherwise used in any offering of the property or any security, as defined by applicable law. Any unintended user who may possess the Report is advised that it shall not rely upon the Report or its conclusions and that it should rely on its own appraisers, advisors and other consultants for any decision in connection with the subject property. CBRE shall have no liability or responsibility to any such unintended user.
© 2017 CBRE, Inc.
Addenda
ADDENDA
© 2017 CBRE, Inc.
Addenda
Addendum A
LAND SALE DATA SHEETS
© 2017 CBRE, Inc.
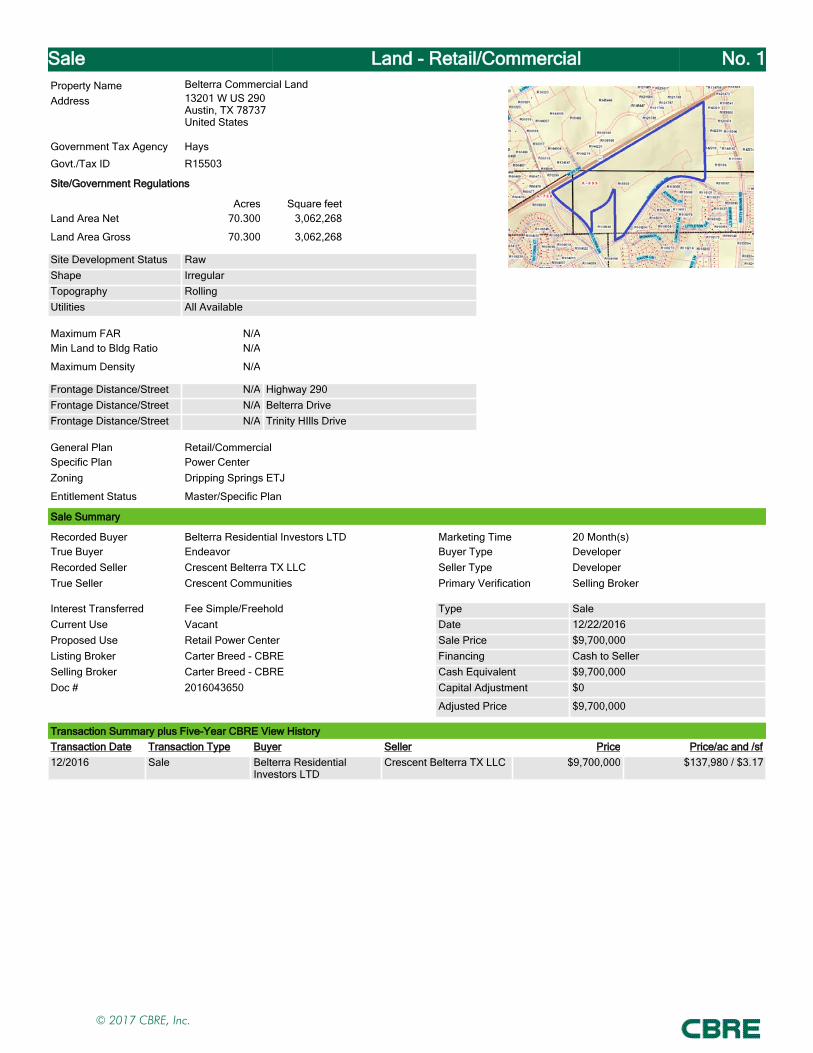
Sale Land - Retail/Commercial No. 1Property Name Belterra Commercial LandAddress 13201 W US 290
Austin, TX 78737United States
Government Tax Agency Hays
Govt./Tax ID R15503
Site/Government Regulations
Acres Square feetLand Area Net 70.300 3,062,268
Land Area Gross 70.300 3,062,268
Site Development Status RawShape IrregularTopography RollingUtilities All Available
Maximum FAR N/AMin Land to Bldg Ratio N/A
Maximum Density N/A
Frontage Distance/Street N/A Highway 290Frontage Distance/Street N/A Belterra DriveFrontage Distance/Street N/A Trinity HIlls Drive
General Plan Retail/CommercialSpecific Plan Power CenterZoning Dripping Springs ETJ
Entitlement Status Master/Specific Plan
Sale Summary
Recorded Buyer Belterra Residential Investors LTD Marketing Time 20 Month(s)True Buyer Endeavor Buyer Type DeveloperRecorded Seller Crescent Belterra TX LLC Seller Type DeveloperTrue Seller Crescent Communities Primary Verification Selling Broker
Interest Transferred Fee Simple/Freehold Type SaleCurrent Use Vacant Date 12/22/2016Proposed Use Retail Power Center Sale Price $9,700,000Listing Broker Carter Breed - CBRE Financing Cash to SellerSelling Broker Carter Breed - CBRE Cash Equivalent $9,700,000Doc # 2016043650 Capital Adjustment $0
Adjusted Price $9,700,000
Transaction Summary plus Five-Year CBRE View HistoryTransaction Date Transaction Type Buyer Seller Price Price/ac and /sf12/2016 Sale Belterra Residential
Investors LTDCrescent Belterra TX LLC $9,700,000 $137,980 / $3.17
© 2017 CBRE, Inc.

Sale Land - Retail/Commercial No. 1Units of Comparison
$3.17 / sf N/A / Unit
$137,980.09 / ac N/A / Allowable Bldg. Units
N/A / Building Area
Financial
No information recorded
Map & Comments
This comparable represents the sale of 70.3 acres of commercial land along the south side of Highway 290 at the entrance to the Belterra master-planned development in far southwest Austin, TX. Belterra is one of southwest Austin's premier master-planned communities and included over 1,200 homes at the time of the comparable land sale. The comparable lies within the Dripping Springs ETJ and various commercial, multi-family and condominium/townhome are allowable under the development agreement with Drippings Springs. All utilities are to the site with water and wastewater provide by Hays County WCID #1. The December 2016 sales price was $9.7 million or $3.17 PSF. However, the buyer was given an extended option period in order to obtain commitments from a number of retailers and other tenants prior to closing. The selling broker indicated that without such a condition of sale, the buyer would have either not been interest in the site or have needed to acquire it for a lower price.
© 2017 CBRE, Inc.
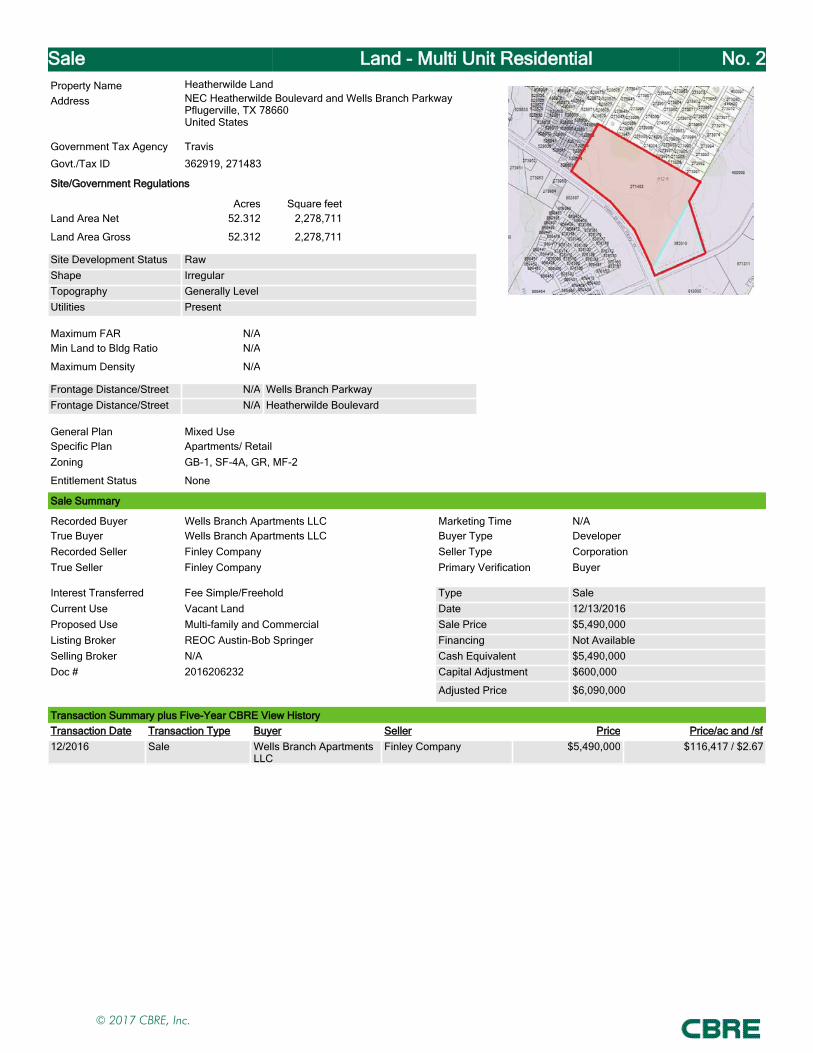
Sale Land - Multi Unit Residential No. 2Property Name Heatherwilde LandAddress NEC Heatherwilde Boulevard and Wells Branch Parkway
Pflugerville, TX 78660United States
Government Tax Agency Travis
Govt./Tax ID 362919, 271483
Site/Government Regulations
Acres Square feetLand Area Net 52.312 2,278,711
Land Area Gross 52.312 2,278,711
Site Development Status RawShape IrregularTopography Generally LevelUtilities Present
Maximum FAR N/AMin Land to Bldg Ratio N/A
Maximum Density N/A
Frontage Distance/Street N/A Wells Branch ParkwayFrontage Distance/Street N/A Heatherwilde Boulevard
General Plan Mixed UseSpecific Plan Apartments/ RetailZoning GB-1, SF-4A, GR, MF-2
Entitlement Status None
Sale Summary
Recorded Buyer Wells Branch Apartments LLC Marketing Time N/ATrue Buyer Wells Branch Apartments LLC Buyer Type DeveloperRecorded Seller Finley Company Seller Type CorporationTrue Seller Finley Company Primary Verification Buyer
Interest Transferred Fee Simple/Freehold Type SaleCurrent Use Vacant Land Date 12/13/2016Proposed Use Multi-family and Commercial Sale Price $5,490,000Listing Broker REOC Austin-Bob Springer Financing Not AvailableSelling Broker N/A Cash Equivalent $5,490,000Doc # 2016206232 Capital Adjustment $600,000
Adjusted Price $6,090,000
Transaction Summary plus Five-Year CBRE View HistoryTransaction Date Transaction Type Buyer Seller Price Price/ac and /sf12/2016 Sale Wells Branch Apartments
LLCFinley Company $5,490,000 $116,417 / $2.67
© 2017 CBRE, Inc.
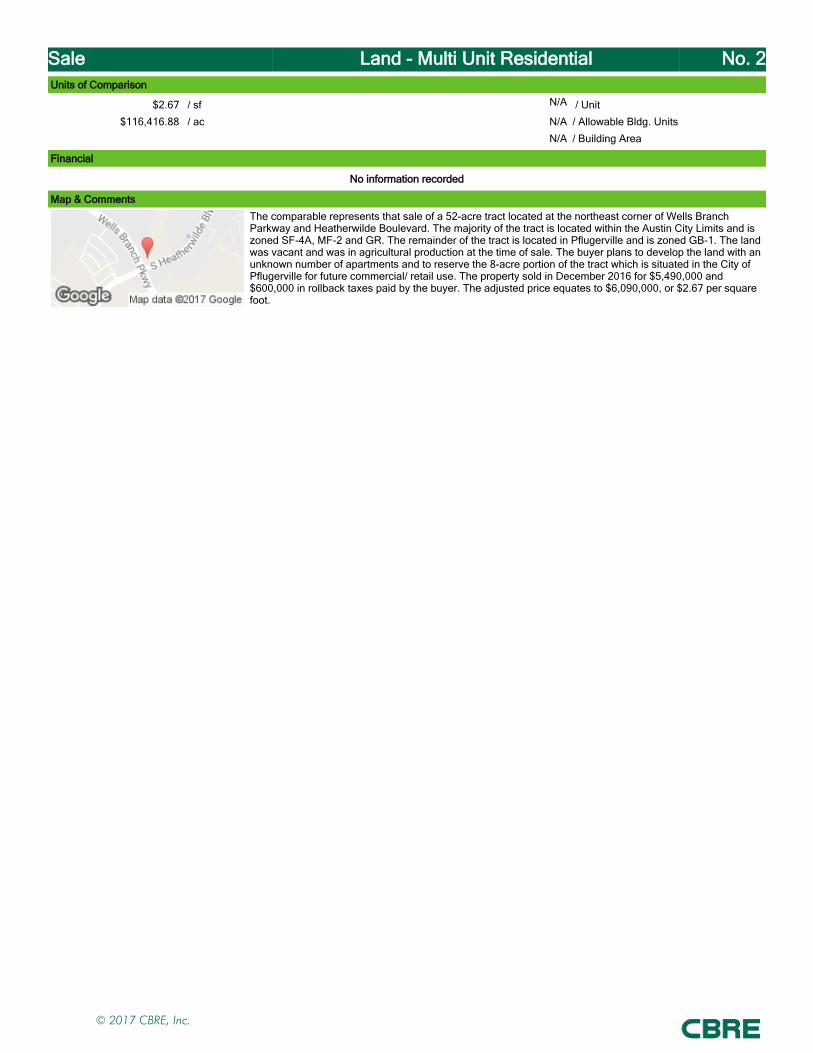
Sale Land - Multi Unit Residential No. 2Units of Comparison
$2.67 / sf N/A / Unit
$116,416.88 / ac N/A / Allowable Bldg. Units
N/A / Building Area
Financial
No information recorded
Map & Comments
The comparable represents that sale of a 52-acre tract located at the northeast corner of Wells Branch Parkway and Heatherwilde Boulevard. The majority of the tract is located within the Austin City Limits and is zoned SF-4A, MF-2 and GR. The remainder of the tract is located in Pflugerville and is zoned GB-1. The land was vacant and was in agricultural production at the time of sale. The buyer plans to develop the land with an unknown number of apartments and to reserve the 8-acre portion of the tract which is situated in the City of Pflugerville for future commercial/ retail use. The property sold in December 2016 for $5,490,000 and $600,000 in rollback taxes paid by the buyer. The adjusted price equates to $6,090,000, or $2.67 per square foot.
© 2017 CBRE, Inc.
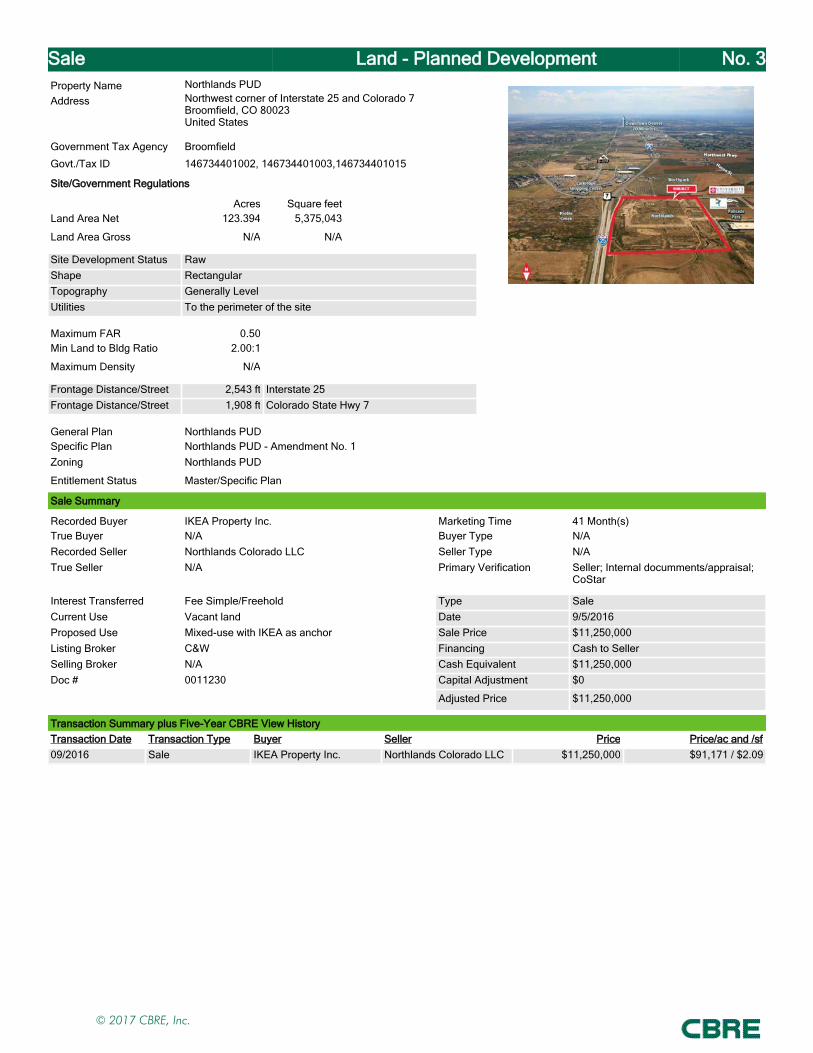
Sale Land - Planned Development No. 3Property Name Northlands PUDAddress Northwest corner of Interstate 25 and Colorado 7
Broomfield, CO 80023United States
Government Tax Agency Broomfield
Govt./Tax ID 146734401002, 146734401003,146734401015
Site/Government Regulations
Acres Square feetLand Area Net 123.394 5,375,043
Land Area Gross N/A N/A
Site Development Status RawShape RectangularTopography Generally LevelUtilities To the perimeter of the site
Maximum FAR 0.50Min Land to Bldg Ratio 2.00:1
Maximum Density N/A
Frontage Distance/Street 2,543 ft Interstate 25Frontage Distance/Street 1,908 ft Colorado State Hwy 7
General Plan Northlands PUDSpecific Plan Northlands PUD - Amendment No. 1Zoning Northlands PUD
Entitlement Status Master/Specific Plan
Sale Summary
Recorded Buyer IKEA Property Inc. Marketing Time 41 Month(s)True Buyer N/A Buyer Type N/ARecorded Seller Northlands Colorado LLC Seller Type N/ATrue Seller N/A Primary Verification Seller; Internal documments/appraisal;
CoStar
Interest Transferred Fee Simple/Freehold Type SaleCurrent Use Vacant land Date 9/5/2016Proposed Use Mixed-use with IKEA as anchor Sale Price $11,250,000Listing Broker C&W Financing Cash to SellerSelling Broker N/A Cash Equivalent $11,250,000Doc # 0011230 Capital Adjustment $0
Adjusted Price $11,250,000
Transaction Summary plus Five-Year CBRE View HistoryTransaction Date Transaction Type Buyer Seller Price Price/ac and /sf09/2016 Sale IKEA Property Inc. Northlands Colorado LLC $11,250,000 $91,171 / $2.09
© 2017 CBRE, Inc.
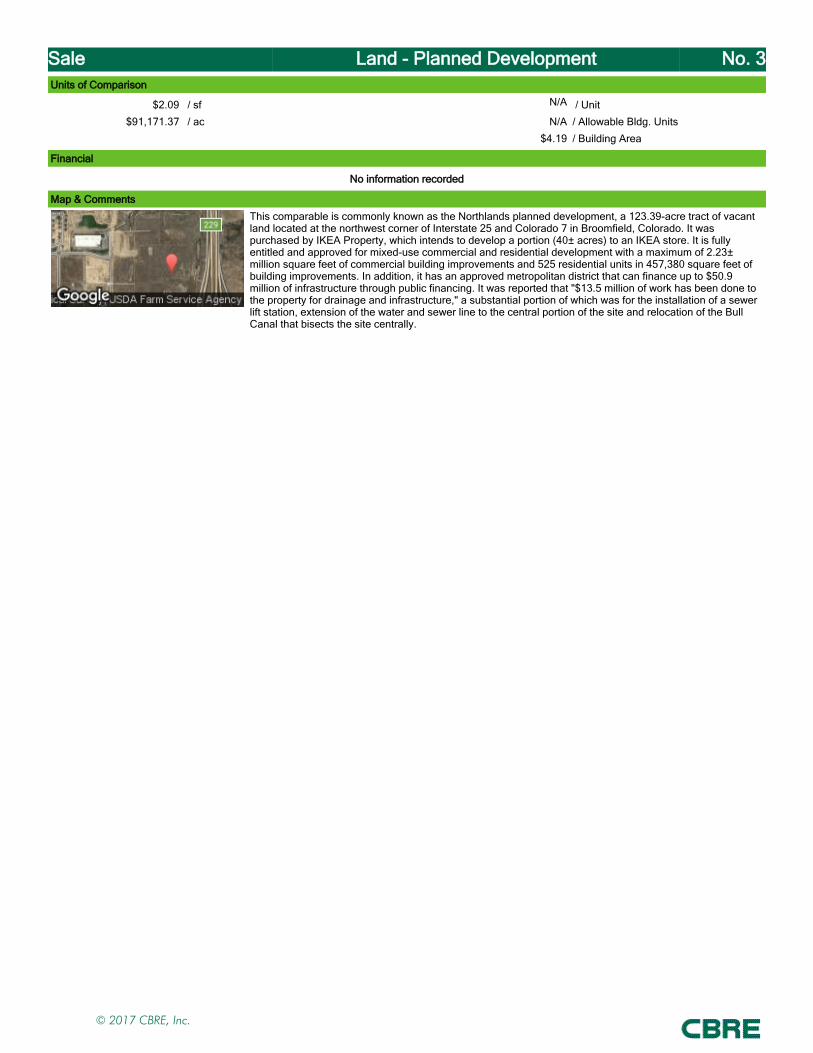
Sale Land - Planned Development No. 3Units of Comparison
$2.09 / sf N/A / Unit
$91,171.37 / ac N/A / Allowable Bldg. Units
$4.19 / Building Area
Financial
No information recorded
Map & Comments
This comparable is commonly known as the Northlands planned development, a 123.39-acre tract of vacant land located at the northwest corner of Interstate 25 and Colorado 7 in Broomfield, Colorado. It was purchased by IKEA Property, which intends to develop a portion (40± acres) to an IKEA store. It is fully entitled and approved for mixed-use commercial and residential development with a maximum of 2.23± million square feet of commercial building improvements and 525 residential units in 457,380 square feet of building improvements. In addition, it has an approved metropolitan district that can finance up to $50.9 million of infrastructure through public financing. It was reported that "$13.5 million of work has been done to the property for drainage and infrastructure," a substantial portion of which was for the installation of a sewer lift station, extension of the water and sewer line to the central portion of the site and relocation of the Bull Canal that bisects the site centrally.
© 2017 CBRE, Inc.
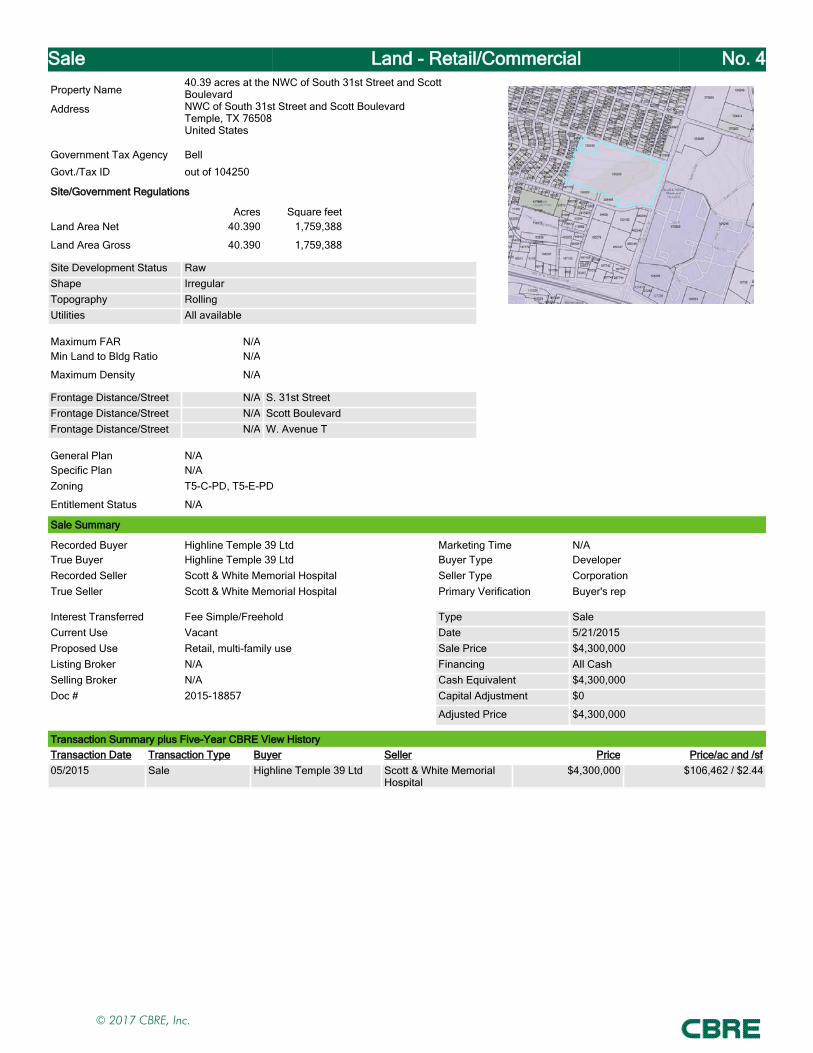
Sale Land - Retail/Commercial No. 4Property Name
40.39 acres at the NWC of South 31st Street and Scott Boulevard
Address NWC of South 31st Street and Scott BoulevardTemple, TX 76508United States
Government Tax Agency Bell
Govt./Tax ID out of 104250
Site/Government Regulations
Acres Square feetLand Area Net 40.390 1,759,388
Land Area Gross 40.390 1,759,388
Site Development Status RawShape IrregularTopography RollingUtilities All available
Maximum FAR N/AMin Land to Bldg Ratio N/A
Maximum Density N/A
Frontage Distance/Street N/A S. 31st StreetFrontage Distance/Street N/A Scott BoulevardFrontage Distance/Street N/A W. Avenue T
General Plan N/ASpecific Plan N/AZoning T5-C-PD, T5-E-PD
Entitlement Status N/A
Sale Summary
Recorded Buyer Highline Temple 39 Ltd Marketing Time N/ATrue Buyer Highline Temple 39 Ltd Buyer Type DeveloperRecorded Seller Scott & White Memorial Hospital Seller Type CorporationTrue Seller Scott & White Memorial Hospital Primary Verification Buyer's rep
Interest Transferred Fee Simple/Freehold Type SaleCurrent Use Vacant Date 5/21/2015Proposed Use Retail, multi-family use Sale Price $4,300,000Listing Broker N/A Financing All CashSelling Broker N/A Cash Equivalent $4,300,000Doc # 2015-18857 Capital Adjustment $0
Adjusted Price $4,300,000
Transaction Summary plus Five-Year CBRE View HistoryTransaction Date Transaction Type Buyer Seller Price Price/ac and /sf05/2015 Sale Highline Temple 39 Ltd Scott & White Memorial
Hospital$4,300,000 $106,462 / $2.44
© 2017 CBRE, Inc.
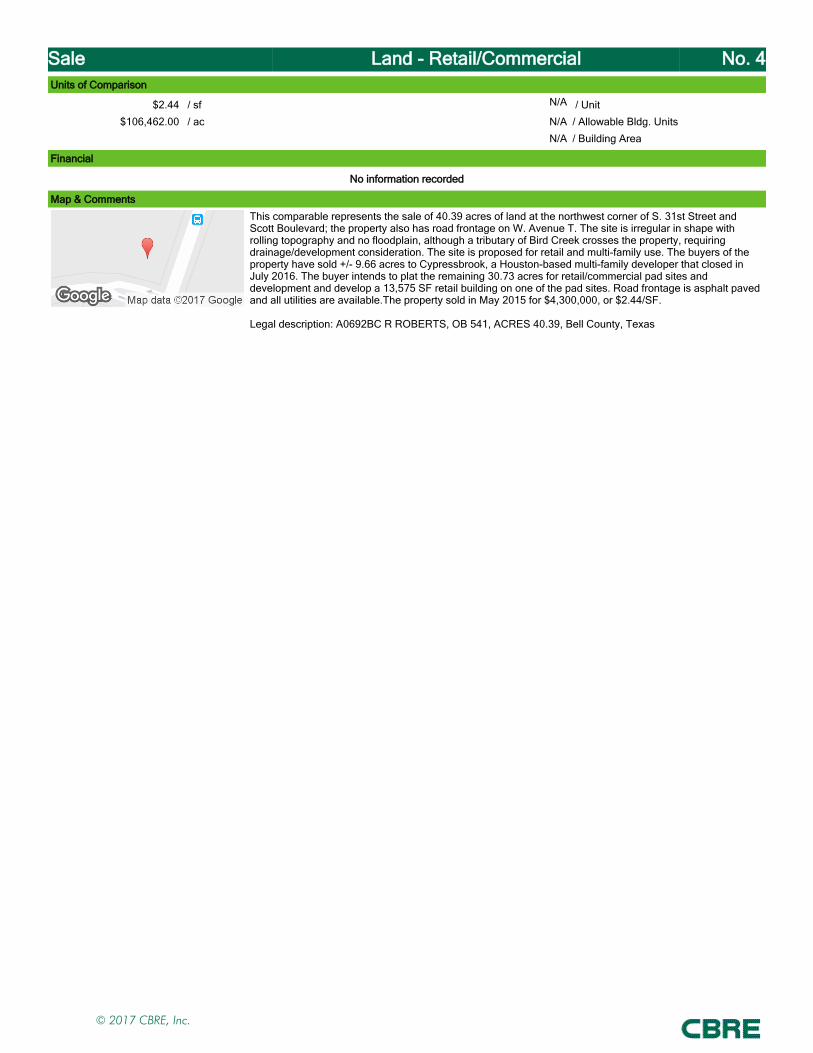
Sale Land - Retail/Commercial No. 4Units of Comparison
$2.44 / sf N/A / Unit
$106,462.00 / ac N/A / Allowable Bldg. Units
N/A / Building Area
Financial
No information recorded
Map & Comments
This comparable represents the sale of 40.39 acres of land at the northwest corner of S. 31st Street and Scott Boulevard; the property also has road frontage on W. Avenue T. The site is irregular in shape with rolling topography and no floodplain, although a tributary of Bird Creek crosses the property, requiring drainage/development consideration. The site is proposed for retail and multi-family use. The buyers of the property have sold +/- 9.66 acres to Cypressbrook, a Houston-based multi-family developer that closed in July 2016. The buyer intends to plat the remaining 30.73 acres for retail/commercial pad sites and development and develop a 13,575 SF retail building on one of the pad sites. Road frontage is asphalt paved and all utilities are available.The property sold in May 2015 for $4,300,000, or $2.44/SF.
Legal description: A0692BC R ROBERTS, OB 541, ACRES 40.39, Bell County, Texas
© 2017 CBRE, Inc.
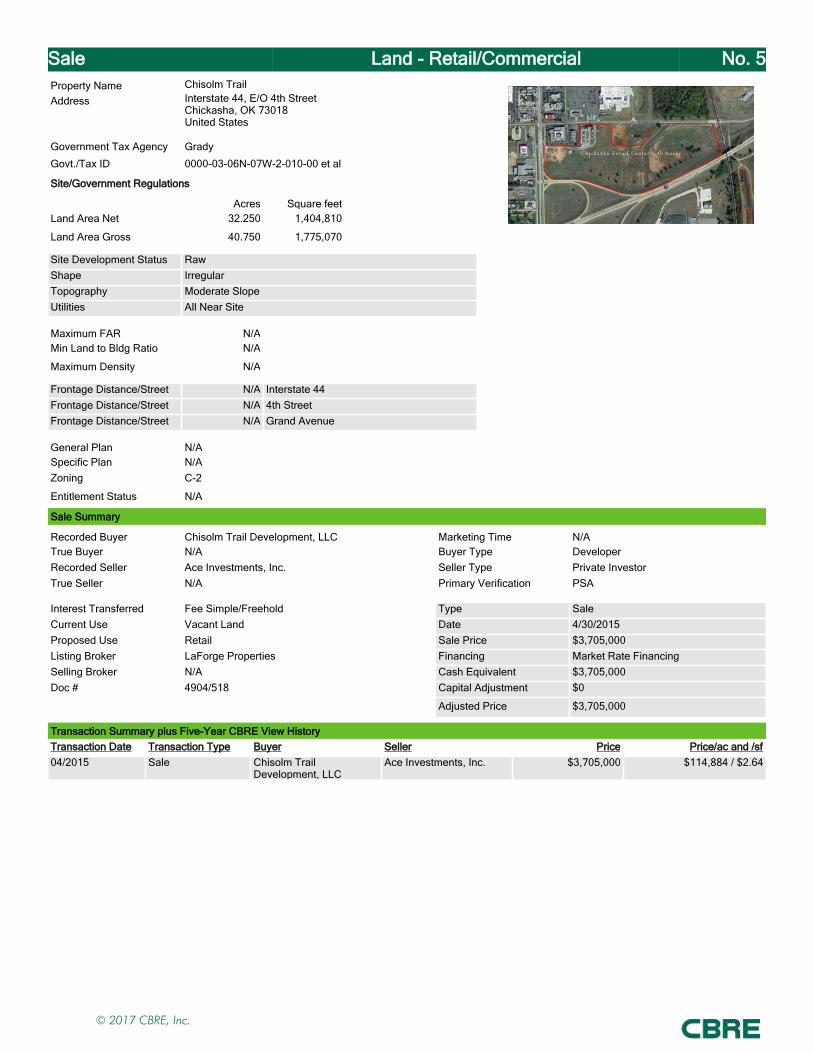
Sale Land - Retail/Commercial No. 5Property Name Chisolm TrailAddress Interstate 44, E/O 4th Street
Chickasha, OK 73018United States
Government Tax Agency Grady
Govt./Tax ID 0000-03-06N-07W-2-010-00 et al
Site/Government Regulations
Acres Square feetLand Area Net 32.250 1,404,810
Land Area Gross 40.750 1,775,070
Site Development Status RawShape IrregularTopography Moderate SlopeUtilities All Near Site
Maximum FAR N/AMin Land to Bldg Ratio N/A
Maximum Density N/A
Frontage Distance/Street N/A Interstate 44Frontage Distance/Street N/A 4th StreetFrontage Distance/Street N/A Grand Avenue
General Plan N/ASpecific Plan N/AZoning C-2
Entitlement Status N/A
Sale Summary
Recorded Buyer Chisolm Trail Development, LLC Marketing Time N/ATrue Buyer N/A Buyer Type DeveloperRecorded Seller Ace Investments, Inc. Seller Type Private InvestorTrue Seller N/A Primary Verification PSA
Interest Transferred Fee Simple/Freehold Type SaleCurrent Use Vacant Land Date 4/30/2015Proposed Use Retail Sale Price $3,705,000Listing Broker LaForge Properties Financing Market Rate FinancingSelling Broker N/A Cash Equivalent $3,705,000Doc # 4904/518 Capital Adjustment $0
Adjusted Price $3,705,000
Transaction Summary plus Five-Year CBRE View HistoryTransaction Date Transaction Type Buyer Seller Price Price/ac and /sf04/2015 Sale Chisolm Trail
Development, LLCAce Investments, Inc. $3,705,000 $114,884 / $2.64
© 2017 CBRE, Inc.

Sale Land - Retail/Commercial No. 5Units of Comparison
$2.64 / sf N/A / Unit
$114,883.72 / ac N/A / Allowable Bldg. Units
N/A / Building Area
Financial
No information recorded
Map & Comments
The comparable is a 32.25-net-acre retail development site that wraps around the southeast corner of 4th Street and Grand Avenue in Chickasha, Oklahoma. The site has good access and visibility to Interstate 44 (HE Bailey Turnpike). Chickasha is 45 miles southwest of Oklahoma City. The zoning is C-2, commercial and all utilities are near the site. A single Tax Increment Finance (TIF) District has been established for this property. This affords the Developer to recover the infrastructure costs incurred to make the land suitable for development. All of the risk for reimbursement lies with the Developer. If new taxes are generated, the Developer shares in the added revenue by a set formula via an Economic Development Agreement with the City of Chickasha. The reimbursable costs are limited to infrastructure development, including but not limited to site work, drainage, utility relocation, roads, paving and such.The buyer plans a retail development known as Chisholm Trail. It will be subdivided into seven lots that will vary in size from 1.15 to 9.99 acres. The development will include big box retail, pad buildings, ground-leased pads sites and pad sites available for sale. The site sold in April 2015 for $3,705,000, or $2.64 per square foot.
© 2017 CBRE, Inc.
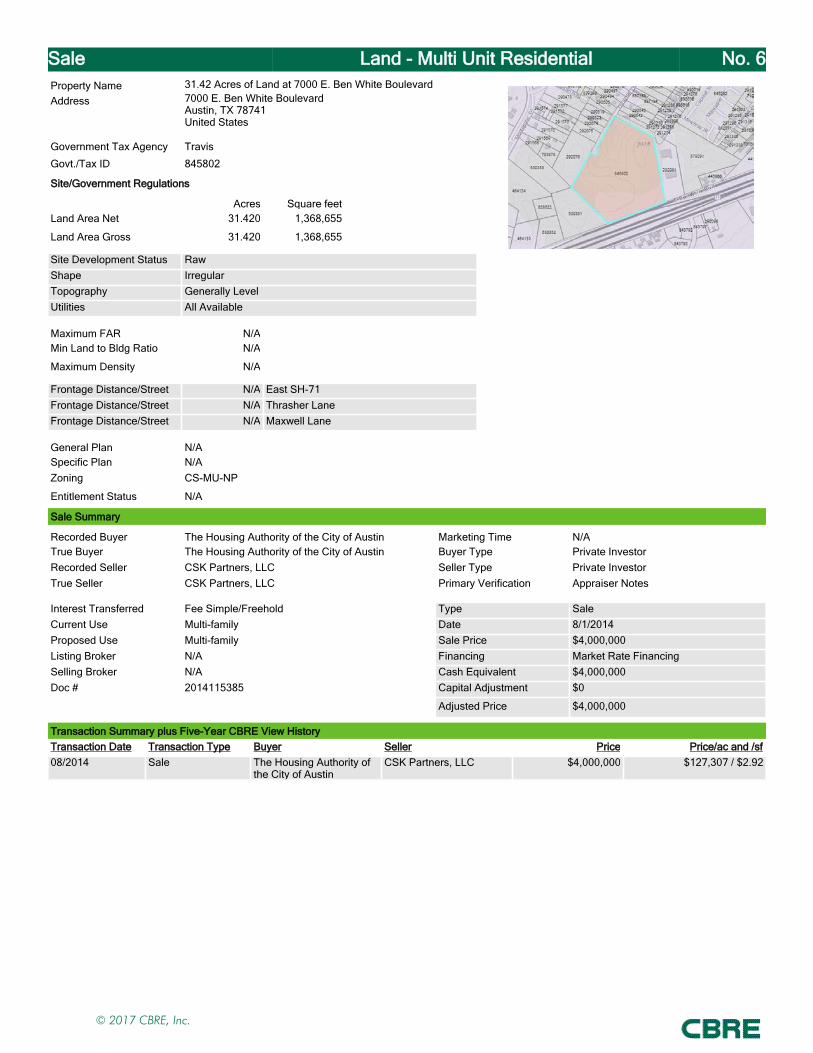
Sale Land - Multi Unit Residential No. 6Property Name 31.42 Acres of Land at 7000 E. Ben White BoulevardAddress 7000 E. Ben White Boulevard
Austin, TX 78741United States
Government Tax Agency Travis
Govt./Tax ID 845802
Site/Government Regulations
Acres Square feetLand Area Net 31.420 1,368,655
Land Area Gross 31.420 1,368,655
Site Development Status RawShape IrregularTopography Generally LevelUtilities All Available
Maximum FAR N/AMin Land to Bldg Ratio N/A
Maximum Density N/A
Frontage Distance/Street N/A East SH-71Frontage Distance/Street N/A Thrasher LaneFrontage Distance/Street N/A Maxwell Lane
General Plan N/ASpecific Plan N/AZoning CS-MU-NP
Entitlement Status N/A
Sale Summary
Recorded Buyer The Housing Authority of the City of Austin Marketing Time N/ATrue Buyer The Housing Authority of the City of Austin Buyer Type Private InvestorRecorded Seller CSK Partners, LLC Seller Type Private InvestorTrue Seller CSK Partners, LLC Primary Verification Appraiser Notes
Interest Transferred Fee Simple/Freehold Type SaleCurrent Use Multi-family Date 8/1/2014Proposed Use Multi-family Sale Price $4,000,000Listing Broker N/A Financing Market Rate FinancingSelling Broker N/A Cash Equivalent $4,000,000Doc # 2014115385 Capital Adjustment $0
Adjusted Price $4,000,000
Transaction Summary plus Five-Year CBRE View HistoryTransaction Date Transaction Type Buyer Seller Price Price/ac and /sf08/2014 Sale The Housing Authority of
the City of AustinCSK Partners, LLC $4,000,000 $127,307 / $2.92
© 2017 CBRE, Inc.
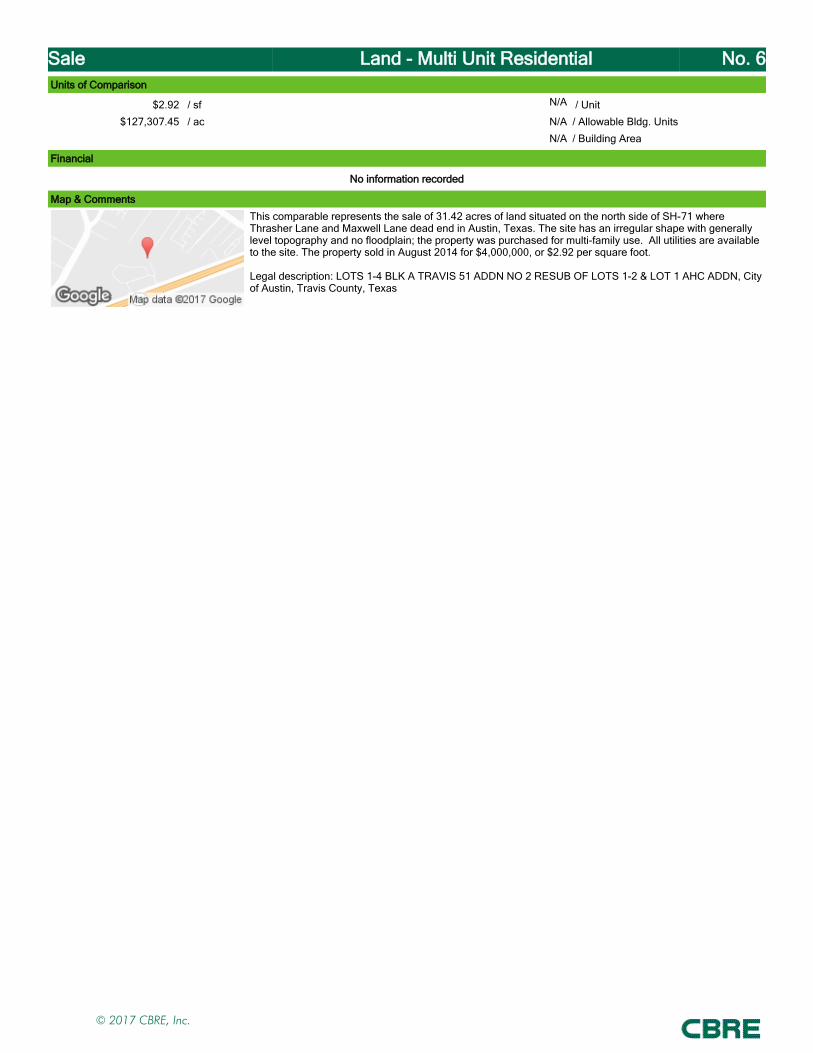
Sale Land - Multi Unit Residential No. 6Units of Comparison
$2.92 / sf N/A / Unit
$127,307.45 / ac N/A / Allowable Bldg. Units
N/A / Building Area
Financial
No information recorded
Map & Comments
This comparable represents the sale of 31.42 acres of land situated on the north side of SH-71 where Thrasher Lane and Maxwell Lane dead end in Austin, Texas. The site has an irregular shape with generally level topography and no floodplain; the property was purchased for multi-family use. All utilities are available to the site. The property sold in August 2014 for $4,000,000, or $2.92 per square foot.
Legal description: LOTS 1-4 BLK A TRAVIS 51 ADDN NO 2 RESUB OF LOTS 1-2 & LOT 1 AHC ADDN, City of Austin, Travis County, Texas
© 2017 CBRE, Inc.

Sale Land - Retail/Commercial No. 7Property Name 35.96-Acre SiteAddress NWC NW 150th St & Penn Ave
Edmond, OK 73013United States
Government Tax Agency Oklahoma
Govt./Tax ID R168511850
Site/Government Regulations
Acres Square feetLand Area Net 35.960 1,566,418
Land Area Gross 35.960 1,566,418
Site Development Status RawShape RectangularTopography Generally LevelUtilities All near site
Maximum FAR N/AMin Land to Bldg Ratio N/A
Maximum Density N/A
Frontage Distance/Street 1,275 ft Pennsylvania AveFrontage Distance/Street 1,275 ft NW 150th St
General Plan N/ASpecific Plan N/AZoning PUD-288
Entitlement Status N/A
Sale Summary
Recorded Buyer 150TH AND PENN LLC Marketing Time 69 Month(s)True Buyer N/A Buyer Type Private InvestorRecorded Seller 3D BROWN ENTERPRISES LLC ETAL
SOULE KENT E & MARGO CO EXECSeller Type N/A
True Seller N/A Primary Verification Craig Bodenhamer/405.217.8380
Interest Transferred Fee Simple/Freehold Type SaleCurrent Use Vacant Land Date 6/3/2014Proposed Use Commercial Sale Price $4,515,000Listing Broker Cordell Brown/405.239.1222 Financing Cash to SellerSelling Broker Craig Bodenhamer/405.217.8380 Cash Equivalent $4,515,000Doc # 12553-1209 Capital Adjustment $0
Adjusted Price $4,515,000
Transaction Summary plus Five-Year CBRE View HistoryTransaction Date Transaction Type Buyer Seller Price Price/ac and /sf06/2014 Sale 150TH AND PENN LLC 3D BROWN
ENTERPRISES LLC ETAL SOULE KENT E & MARGO CO EXEC
$4,515,000 $125,556 / $2.88
© 2017 CBRE, Inc.
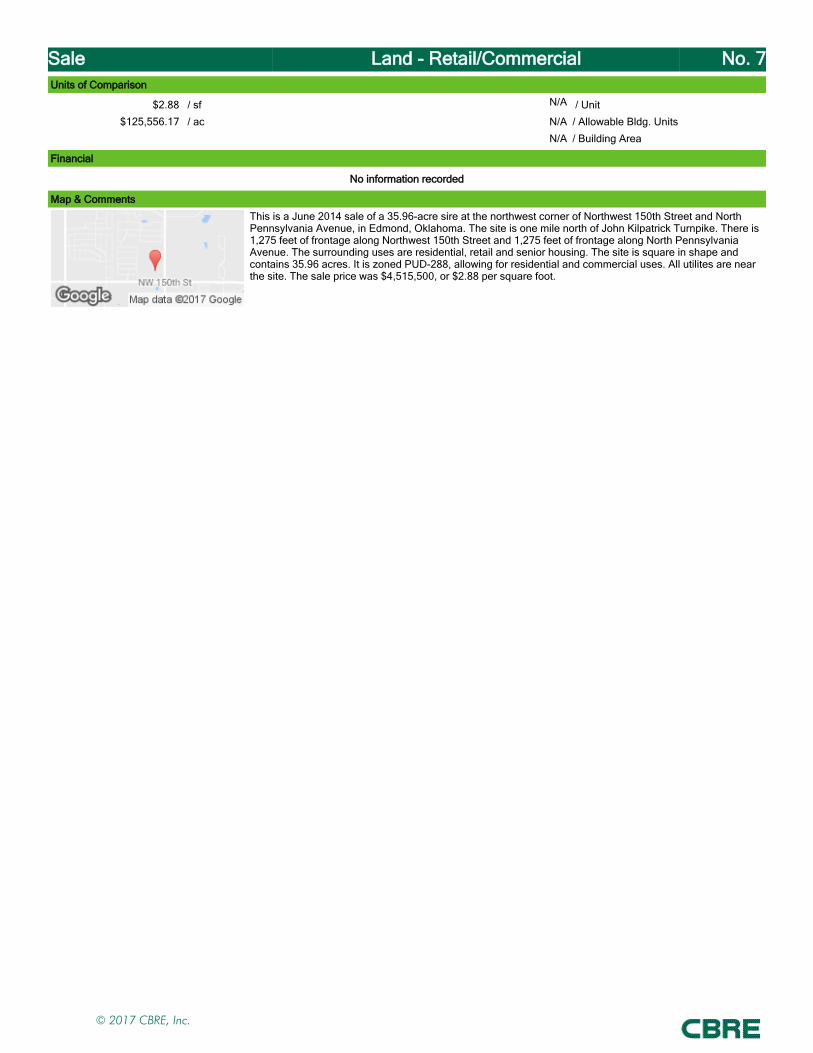
Sale Land - Retail/Commercial No. 7Units of Comparison
$2.88 / sf N/A / Unit
$125,556.17 / ac N/A / Allowable Bldg. Units
N/A / Building Area
Financial
No information recorded
Map & Comments
This is a June 2014 sale of a 35.96-acre sire at the northwest corner of Northwest 150th Street and North Pennsylvania Avenue, in Edmond, Oklahoma. The site is one mile north of John Kilpatrick Turnpike. There is 1,275 feet of frontage along Northwest 150th Street and 1,275 feet of frontage along North Pennsylvania Avenue. The surrounding uses are residential, retail and senior housing. The site is square in shape and contains 35.96 acres. It is zoned PUD-288, allowing for residential and commercial uses. All utilites are near the site. The sale price was $4,515,500, or $2.88 per square foot.
© 2017 CBRE, Inc.
Addenda
Addendum B
IMPROVED SALE DATA SHEETS
© 2017 CBRE, Inc.
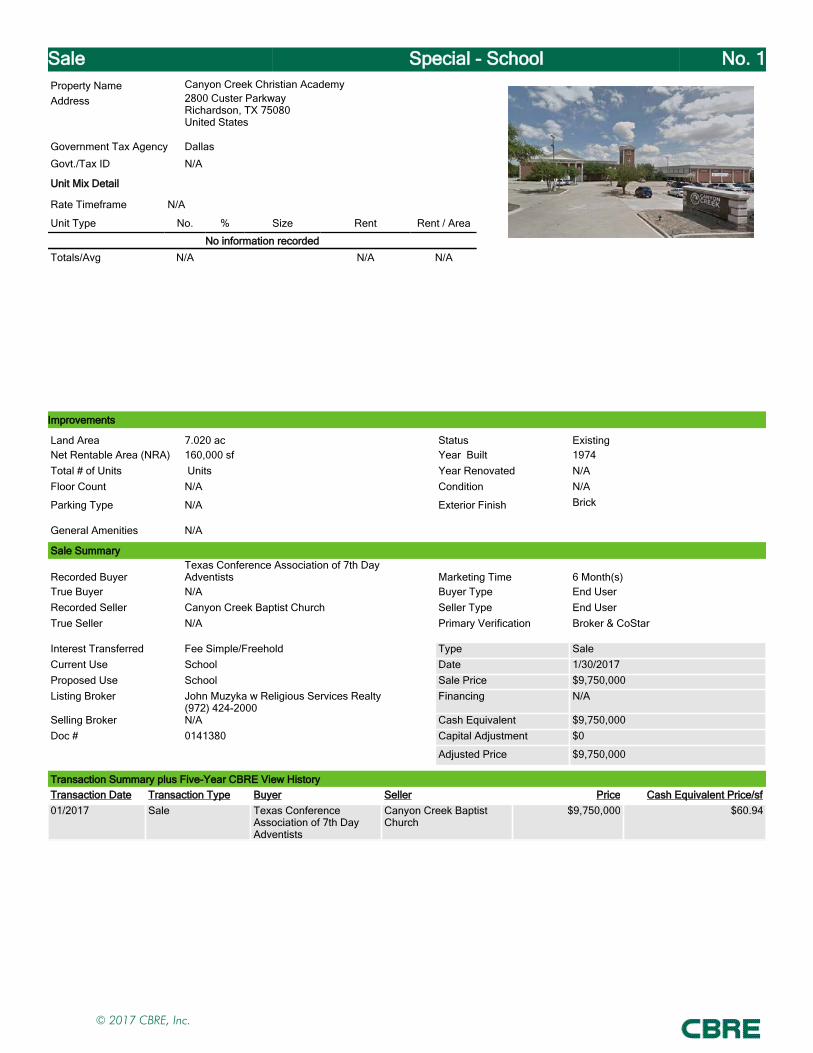
Sale Special - School No. 1Property Name Canyon Creek Christian AcademyAddress 2800 Custer Parkway
Richardson, TX 75080United States
Government Tax Agency Dallas
Govt./Tax ID N/A
Unit Mix Detail
Rate Timeframe N/A
Unit Type No. % Size Rent Rent / Area
No information recordedTotals/Avg N/A N/A N/A
Improvements
Land Area 7.020 ac Status ExistingNet Rentable Area (NRA) 160,000 sf Year Built 1974Total # of Units Units Year Renovated N/AFloor Count N/A Condition N/A
Parking Type N/A Exterior Finish Brick
General Amenities N/A
Sale Summary
Recorded BuyerTexas Conference Association of 7th Day Adventists Marketing Time 6 Month(s)
True Buyer N/A Buyer Type End UserRecorded Seller Canyon Creek Baptist Church Seller Type End UserTrue Seller N/A Primary Verification Broker & CoStar
Interest Transferred Fee Simple/Freehold Type SaleCurrent Use School Date 1/30/2017Proposed Use School Sale Price $9,750,000Listing Broker John Muzyka w Religious Services Realty
(972) 424-2000Financing N/A
Selling Broker N/A Cash Equivalent $9,750,000Doc # 0141380 Capital Adjustment $0
Adjusted Price $9,750,000
Transaction Summary plus Five-Year CBRE View HistoryTransaction Date Transaction Type Buyer Seller Price Cash Equivalent Price/sf01/2017 Sale Texas Conference
Association of 7th Day Adventists
Canyon Creek Baptist Church
$9,750,000 $60.94
© 2017 CBRE, Inc.
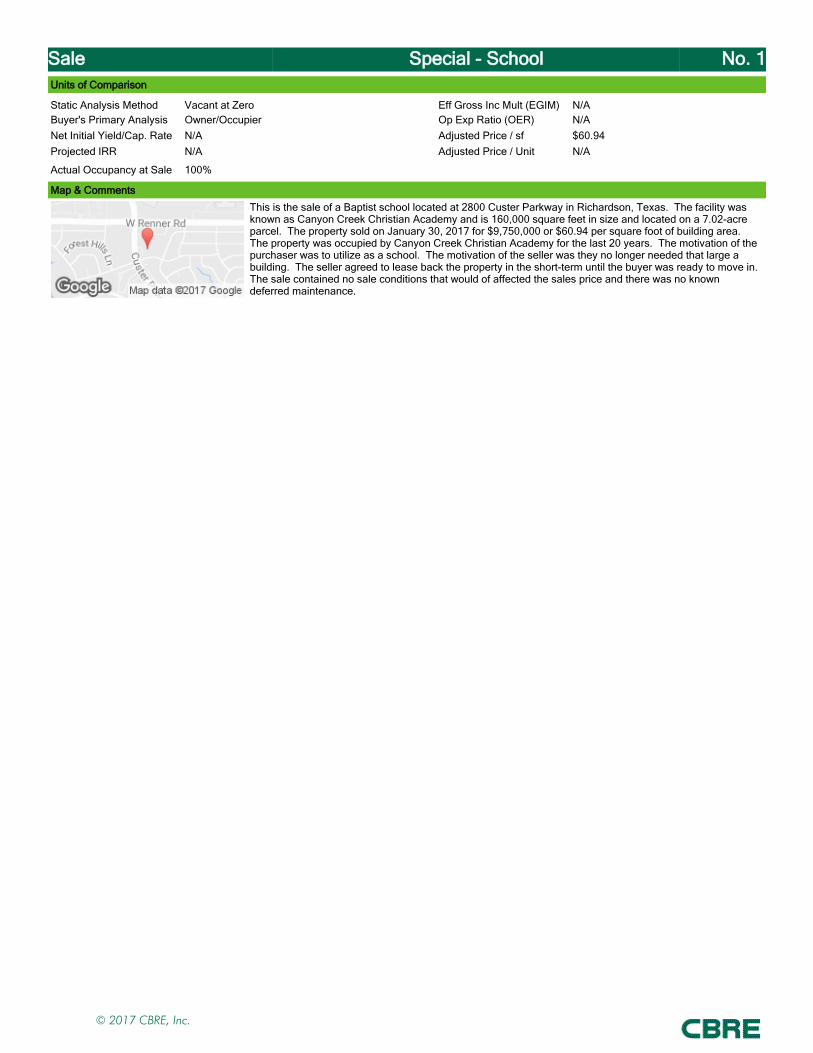
Sale Special - School No. 1Units of Comparison
Static Analysis Method Vacant at Zero Eff Gross Inc Mult (EGIM) N/ABuyer's Primary Analysis Owner/Occupier Op Exp Ratio (OER) N/ANet Initial Yield/Cap. Rate N/A Adjusted Price / sf $60.94Projected IRR N/A Adjusted Price / Unit N/A
Actual Occupancy at Sale 100%
Map & Comments
This is the sale of a Baptist school located at 2800 Custer Parkway in Richardson, Texas. The facility was known as Canyon Creek Christian Academy and is 160,000 square feet in size and located on a 7.02-acre parcel. The property sold on January 30, 2017 for $9,750,000 or $60.94 per square foot of building area. The property was occupied by Canyon Creek Christian Academy for the last 20 years. The motivation of the purchaser was to utilize as a school. The motivation of the seller was they no longer needed that large a building. The seller agreed to lease back the property in the short-term until the buyer was ready to move in. The sale contained no sale conditions that would of affected the sales price and there was no known deferred maintenance.
© 2017 CBRE, Inc.
Sale Special - School No. 2Property Name Former Pace University Briarcliff Manor CampusAddress 235 Elm Road
Briarcliff Manor, NY 10510United States
Government Tax Agency Westchester
Govt./Tax ID 98.19-2-10 & 11
Unit Mix Detail
Rate Timeframe N/A
Unit Type No. % Size (sf) Rent Rent / sfDesignated Beds 565 100% N/A N/A N/A
Totals/Avg 565 $0 N/A
Improvements
Land Area 37.170 ac Status ExistingGross Building Area (GBA) 330,308 sf Year Built 1902Total # of Units 565 Units Year Renovated 2000Floor Count 3 Condition Average
Parking Type Open Exterior Finish Masonry
General Amenities N/A
Sale Summary
Recorded Buyer N/A Marketing Time 8 Month(s)True Buyer Research Center on Natural Conservation, Inc. Buyer Type End UserRecorded Seller Pace University Seller Type End UserTrue Seller Pace University Primary Verification Listing Broker, Market Participant,
Marketing Package
Interest Transferred Fee Simple/Freehold Type SaleCurrent Use Pace University Campus Date 12/23/2016Proposed Use Private Prep School Sale Price $17,000,000Listing Broker William Cuddy Jr. of CBRE 203-325-5380 Financing Cash to SellerSelling Broker William Cuddy Jr. of CBRE 203-325-5380 Cash Equivalent $17,000,000Doc # 56336-3334 Capital Adjustment $6,000,000
Adjusted Price $23,000,000
Transaction Summary plus Five-Year CBRE View HistoryTransaction Date Transaction Type Buyer Seller Price Cash Equivalent Price/sf12/2016 Sale N/A Pace University $17,000,000 $51.47
© 2017 CBRE, Inc.
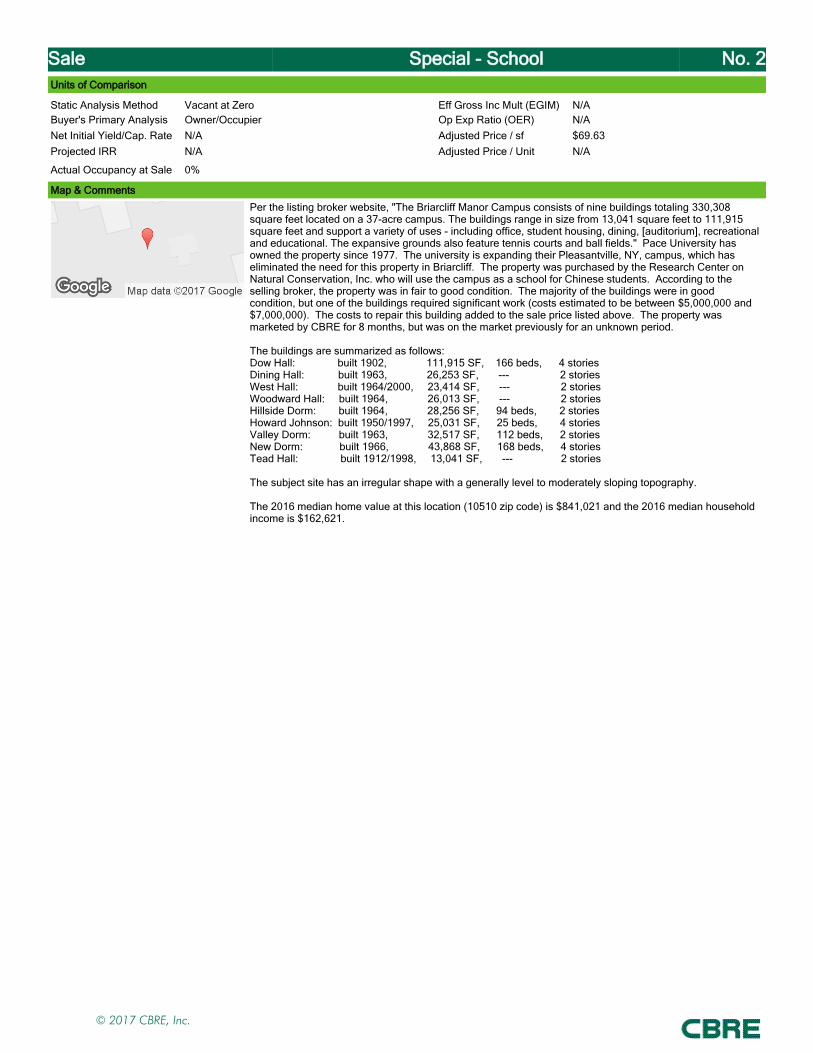
Sale Special - School No. 2Units of Comparison
Static Analysis Method Vacant at Zero Eff Gross Inc Mult (EGIM) N/ABuyer's Primary Analysis Owner/Occupier Op Exp Ratio (OER) N/ANet Initial Yield/Cap. Rate N/A Adjusted Price / sf $69.63Projected IRR N/A Adjusted Price / Unit N/A
Actual Occupancy at Sale 0%
Map & Comments
Per the listing broker website, "The Briarcliff Manor Campus consists of nine buildings totaling 330,308 square feet located on a 37-acre campus. The buildings range in size from 13,041 square feet to 111,915 square feet and support a variety of uses - including office, student housing, dining, [auditorium], recreational and educational. The expansive grounds also feature tennis courts and ball fields." Pace University has owned the property since 1977. The university is expanding their Pleasantville, NY, campus, which has eliminated the need for this property in Briarcliff. The property was purchased by the Research Center on Natural Conservation, Inc. who will use the campus as a school for Chinese students. According to the selling broker, the property was in fair to good condition. The majority of the buildings were in good condition, but one of the buildings required significant work (costs estimated to be between $5,000,000 and $7,000,000). The costs to repair this building added to the sale price listed above. The property was marketed by CBRE for 8 months, but was on the market previously for an unknown period.
The buildings are summarized as follows:Dow Hall: built 1902, 111,915 SF, 166 beds, 4 storiesDining Hall: built 1963, 26,253 SF, --- 2 storiesWest Hall: built 1964/2000, 23,414 SF, --- 2 storiesWoodward Hall: built 1964, 26,013 SF, --- 2 storiesHillside Dorm: built 1964, 28,256 SF, 94 beds, 2 storiesHoward Johnson: built 1950/1997, 25,031 SF, 25 beds, 4 storiesValley Dorm: built 1963, 32,517 SF, 112 beds, 2 storiesNew Dorm: built 1966, 43,868 SF, 168 beds, 4 storiesTead Hall: built 1912/1998, 13,041 SF, --- 2 stories
The subject site has an irregular shape with a generally level to moderately sloping topography.
The 2016 median home value at this location (10510 zip code) is $841,021 and the 2016 median household income is $162,621.
© 2017 CBRE, Inc.

Sale Special - School No. 3Property Name Former Clearwater Christian CollegeAddress 3400 Gulf to Bay Blvd.
Clearwater, FL 33759United States
Government Tax Agency Pinellas
Govt./Tax ID N/A
Unit Mix Detail
Rate Timeframe N/A
Unit Type No. % Size Rent Rent / Area
No information recordedTotals/Avg N/A N/A N/A
Improvements
Land Area 27.390 ac Status ExistingNet Rentable Area (NRA) 141,965 sf Year Built 1967Total # of Units Units Year Renovated N/AFloor Count 3 Condition N/A
Parking Type N/A Exterior Finish N/A
General Amenities N/A
Sale Summary
Recorded Buyer Drs. Kiran & Pallavi Family Foundation, Inc. Marketing Time 14 Month(s)True Buyer Dr. Kiran Patel Buyer Type End UserRecorded Seller Clearwater Christian College Private School,
Inc.Seller Type End User
True Seller N/A Primary Verification Purchaser & CoStar
Interest Transferred Fee Simple/Freehold Type SaleCurrent Use College/University Date 12/15/2016Proposed Use College/University Sale Price $10,209,103Listing Broker Joey Blakley w/Foundry Commercial (407) 540-
7737Financing Cash to Seller
Selling Broker N/A Cash Equivalent $10,209,103Doc # 19452-1497 Capital Adjustment $0
Adjusted Price $10,209,103
Transaction Summary plus Five-Year CBRE View HistoryTransaction Date Transaction Type Buyer Seller Price Cash Equivalent Price/sf12/2016 Sale Drs. Kiran & Pallavi
Family Foundation, Inc.Clearwater Christian College Private School, Inc.
$10,209,103 $71.91
12/2016 N/A N/A N/A N/A N/A
© 2017 CBRE, Inc.
Sale Special - School No. 3Units of Comparison
Static Analysis Method Vacant at Market Eff Gross Inc Mult (EGIM) N/ABuyer's Primary Analysis Owner/Occupier Op Exp Ratio (OER) N/ANet Initial Yield/Cap. Rate N/A Adjusted Price / sf $71.91Projected IRR N/A Adjusted Price / Unit N/A
Actual Occupancy at Sale 0%
Map & Comments
This represents the sale of the former Clearwater Christian College located at 3400 Gulf to Bay Blvd. in Clearwater, Florida. The property is 141,965 square feet in size located on a 27.39 acre parcel. The property was originally listed of $19,750,000, then dropped to $16,500,000 when the property went under contract. The property was purchased by the chairman of the local HMO Freedom Health, Inc. who plans on opening a medical school at the site. The purchaser reportedly purchased the existing note on the property for $10,209,103, which equates to $71.91 per square foot. The improvements consist of 7-buildings constructed between 1967-1996. The property consists of a student dorm with capacity of 600+/- students, gymnasium, athletic fields, and a commercial kitchen w/dining hall.
© 2017 CBRE, Inc.
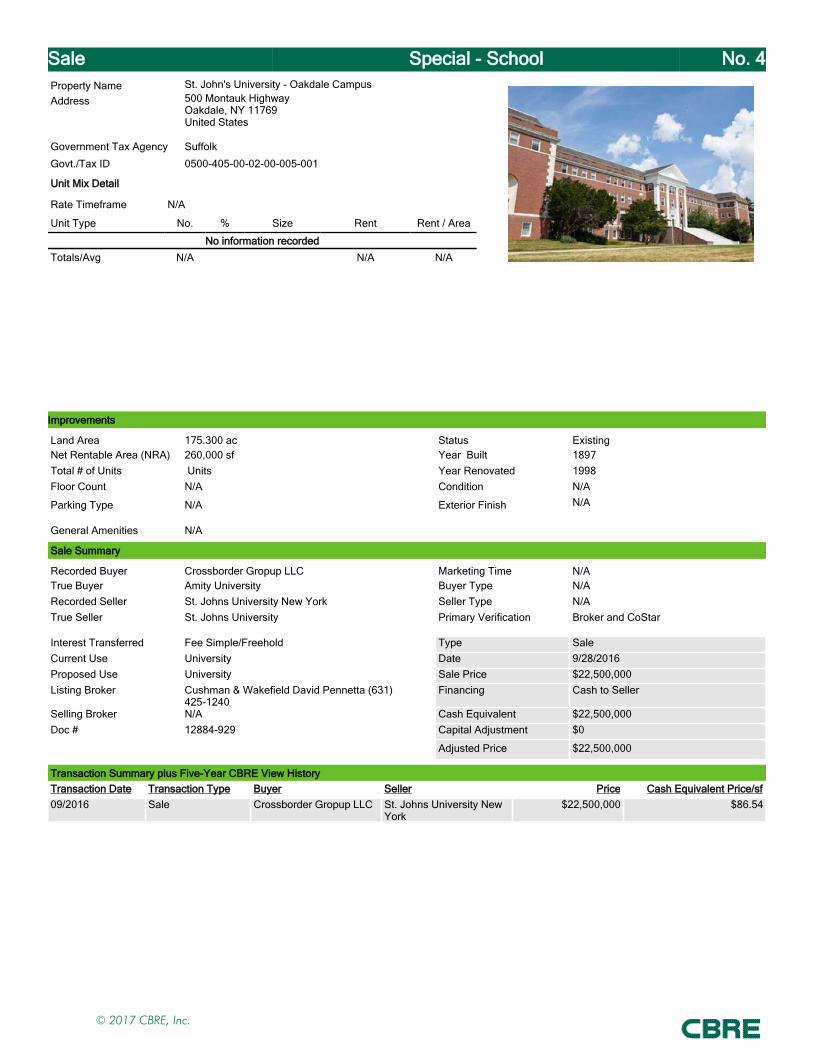
Sale Special - School No. 4Property Name St. John's University - Oakdale CampusAddress 500 Montauk Highway
Oakdale, NY 11769United States
Government Tax Agency Suffolk
Govt./Tax ID 0500-405-00-02-00-005-001
Unit Mix Detail
Rate Timeframe N/A
Unit Type No. % Size Rent Rent / Area
No information recordedTotals/Avg N/A N/A N/A
Improvements
Land Area 175.300 ac Status ExistingNet Rentable Area (NRA) 260,000 sf Year Built 1897Total # of Units Units Year Renovated 1998Floor Count N/A Condition N/A
Parking Type N/A Exterior Finish N/A
General Amenities N/A
Sale Summary
Recorded Buyer Crossborder Gropup LLC Marketing Time N/ATrue Buyer Amity University Buyer Type N/ARecorded Seller St. Johns University New York Seller Type N/ATrue Seller St. Johns University Primary Verification Broker and CoStar
Interest Transferred Fee Simple/Freehold Type SaleCurrent Use University Date 9/28/2016Proposed Use University Sale Price $22,500,000Listing Broker Cushman & Wakefield David Pennetta (631)
425-1240Financing Cash to Seller
Selling Broker N/A Cash Equivalent $22,500,000Doc # 12884-929 Capital Adjustment $0
Adjusted Price $22,500,000
Transaction Summary plus Five-Year CBRE View HistoryTransaction Date Transaction Type Buyer Seller Price Cash Equivalent Price/sf09/2016 Sale Crossborder Gropup LLC St. Johns University New
York$22,500,000 $86.54
© 2017 CBRE, Inc.
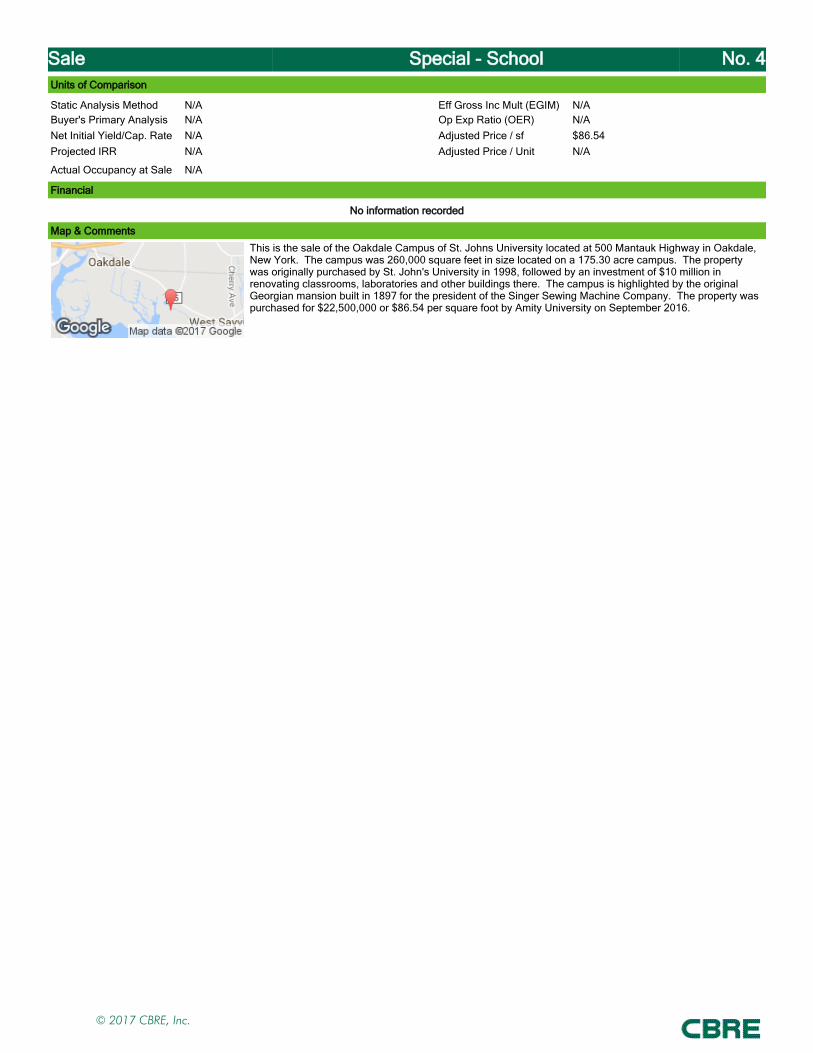
Sale Special - School No. 4Units of Comparison
Static Analysis Method N/A Eff Gross Inc Mult (EGIM) N/ABuyer's Primary Analysis N/A Op Exp Ratio (OER) N/ANet Initial Yield/Cap. Rate N/A Adjusted Price / sf $86.54Projected IRR N/A Adjusted Price / Unit N/A
Actual Occupancy at Sale N/A
Financial
No information recorded
Map & Comments
This is the sale of the Oakdale Campus of St. Johns University located at 500 Mantauk Highway in Oakdale, New York. The campus was 260,000 square feet in size located on a 175.30 acre campus. The property was originally purchased by St. John's University in 1998, followed by an investment of $10 million in renovating classrooms, laboratories and other buildings there. The campus is highlighted by the original Georgian mansion built in 1897 for the president of the Singer Sewing Machine Company. The property was purchased for $22,500,000 or $86.54 per square foot by Amity University on September 2016.
© 2017 CBRE, Inc.
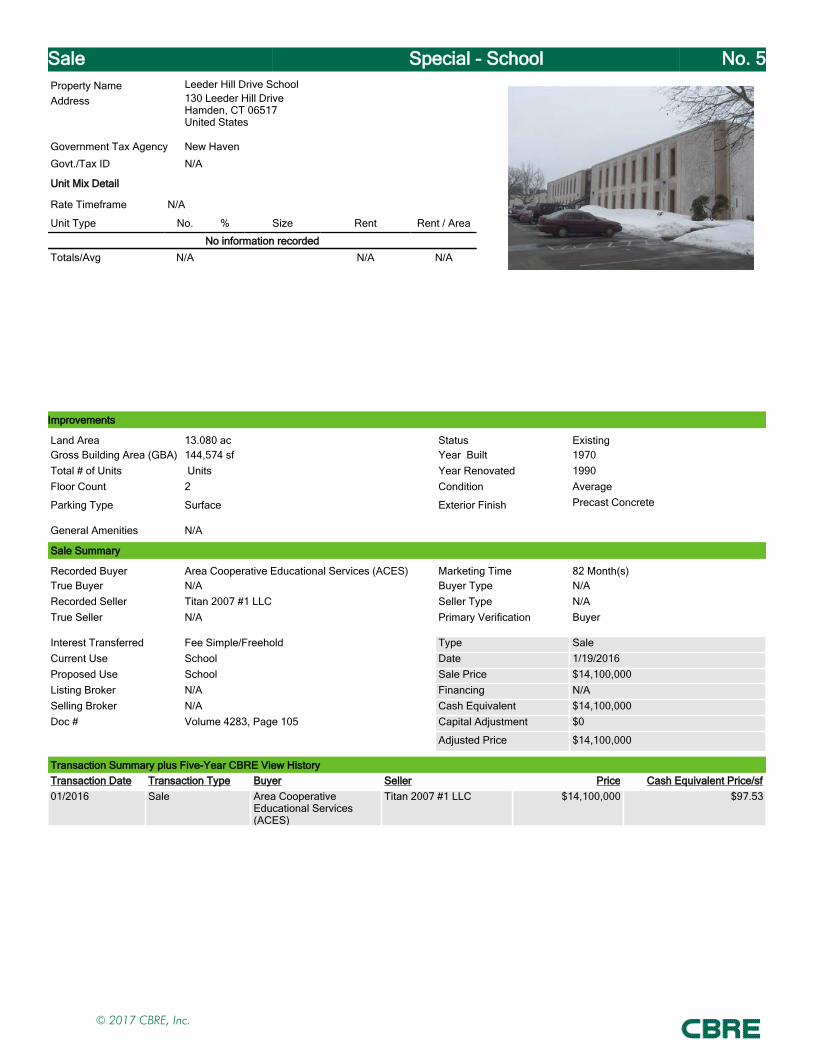
Sale Special - School No. 5Property Name Leeder Hill Drive SchoolAddress 130 Leeder Hill Drive
Hamden, CT 06517United States
Government Tax Agency New Haven
Govt./Tax ID N/A
Unit Mix Detail
Rate Timeframe N/A
Unit Type No. % Size Rent Rent / Area
No information recordedTotals/Avg N/A N/A N/A
Improvements
Land Area 13.080 ac Status ExistingGross Building Area (GBA) 144,574 sf Year Built 1970Total # of Units Units Year Renovated 1990Floor Count 2 Condition Average
Parking Type Surface Exterior Finish Precast Concrete
General Amenities N/A
Sale Summary
Recorded Buyer Area Cooperative Educational Services (ACES) Marketing Time 82 Month(s)True Buyer N/A Buyer Type N/ARecorded Seller Titan 2007 #1 LLC Seller Type N/ATrue Seller N/A Primary Verification Buyer
Interest Transferred Fee Simple/Freehold Type SaleCurrent Use School Date 1/19/2016Proposed Use School Sale Price $14,100,000Listing Broker N/A Financing N/ASelling Broker N/A Cash Equivalent $14,100,000Doc # Volume 4283, Page 105 Capital Adjustment $0
Adjusted Price $14,100,000
Transaction Summary plus Five-Year CBRE View HistoryTransaction Date Transaction Type Buyer Seller Price Cash Equivalent Price/sf01/2016 Sale Area Cooperative
Educational Services (ACES)
Titan 2007 #1 LLC $14,100,000 $97.53
© 2017 CBRE, Inc.
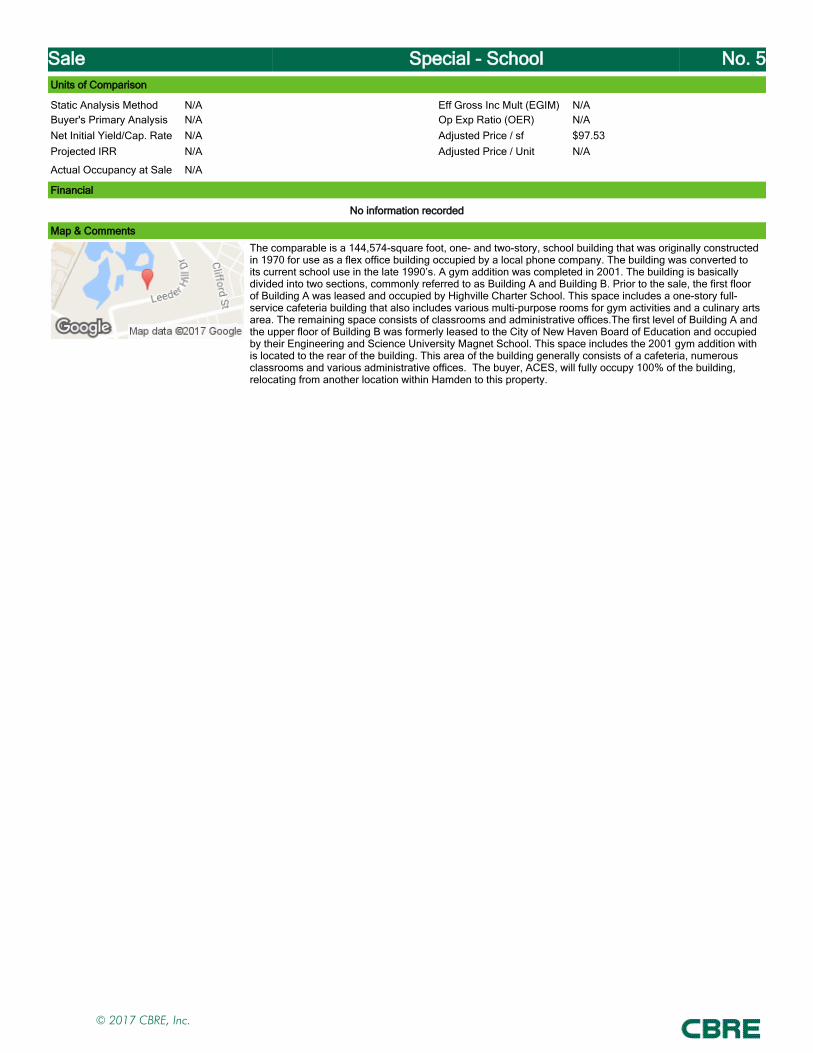
Sale Special - School No. 5Units of Comparison
Static Analysis Method N/A Eff Gross Inc Mult (EGIM) N/ABuyer's Primary Analysis N/A Op Exp Ratio (OER) N/ANet Initial Yield/Cap. Rate N/A Adjusted Price / sf $97.53Projected IRR N/A Adjusted Price / Unit N/A
Actual Occupancy at Sale N/A
Financial
No information recorded
Map & Comments
The comparable is a 144,574-square foot, one- and two-story, school building that was originally constructed in 1970 for use as a flex office building occupied by a local phone company. The building was converted to its current school use in the late 1990’s. A gym addition was completed in 2001. The building is basically divided into two sections, commonly referred to as Building A and Building B. Prior to the sale, the first floor of Building A was leased and occupied by Highville Charter School. This space includes a one-story full-service cafeteria building that also includes various multi-purpose rooms for gym activities and a culinary arts area. The remaining space consists of classrooms and administrative offices.The first level of Building A and the upper floor of Building B was formerly leased to the City of New Haven Board of Education and occupied by their Engineering and Science University Magnet School. This space includes the 2001 gym addition with is located to the rear of the building. This area of the building generally consists of a cafeteria, numerous classrooms and various administrative offices. The buyer, ACES, will fully occupy 100% of the building, relocating from another location within Hamden to this property.
© 2017 CBRE, Inc.
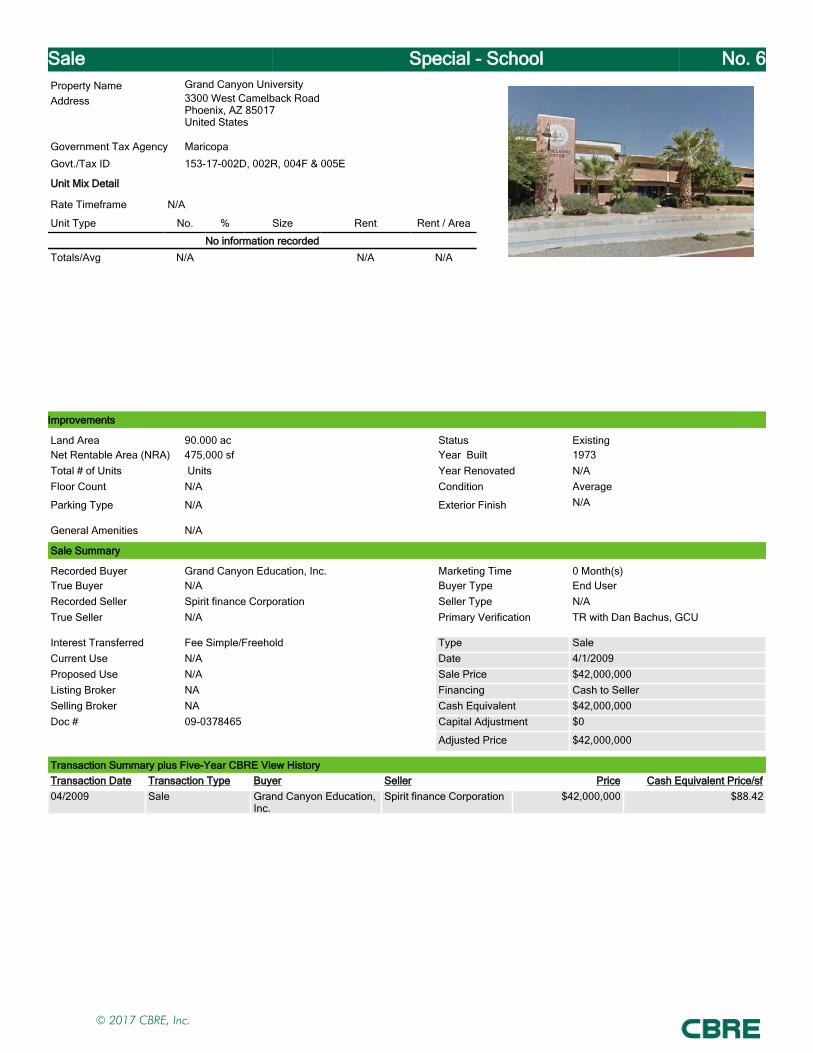
Sale Special - School No. 6Property Name Grand Canyon UniversityAddress 3300 West Camelback Road
Phoenix, AZ 85017United States
Government Tax Agency Maricopa
Govt./Tax ID 153-17-002D, 002R, 004F & 005E
Unit Mix Detail
Rate Timeframe N/A
Unit Type No. % Size Rent Rent / Area
No information recordedTotals/Avg N/A N/A N/A
Improvements
Land Area 90.000 ac Status ExistingNet Rentable Area (NRA) 475,000 sf Year Built 1973Total # of Units Units Year Renovated N/AFloor Count N/A Condition Average
Parking Type N/A Exterior Finish N/A
General Amenities N/A
Sale Summary
Recorded Buyer Grand Canyon Education, Inc. Marketing Time 0 Month(s)True Buyer N/A Buyer Type End UserRecorded Seller Spirit finance Corporation Seller Type N/ATrue Seller N/A Primary Verification TR with Dan Bachus, GCU
Interest Transferred Fee Simple/Freehold Type SaleCurrent Use N/A Date 4/1/2009Proposed Use N/A Sale Price $42,000,000Listing Broker NA Financing Cash to SellerSelling Broker NA Cash Equivalent $42,000,000Doc # 09-0378465 Capital Adjustment $0
Adjusted Price $42,000,000
Transaction Summary plus Five-Year CBRE View HistoryTransaction Date Transaction Type Buyer Seller Price Cash Equivalent Price/sf04/2009 Sale Grand Canyon Education,
Inc.Spirit finance Corporation $42,000,000 $88.42
© 2017 CBRE, Inc.
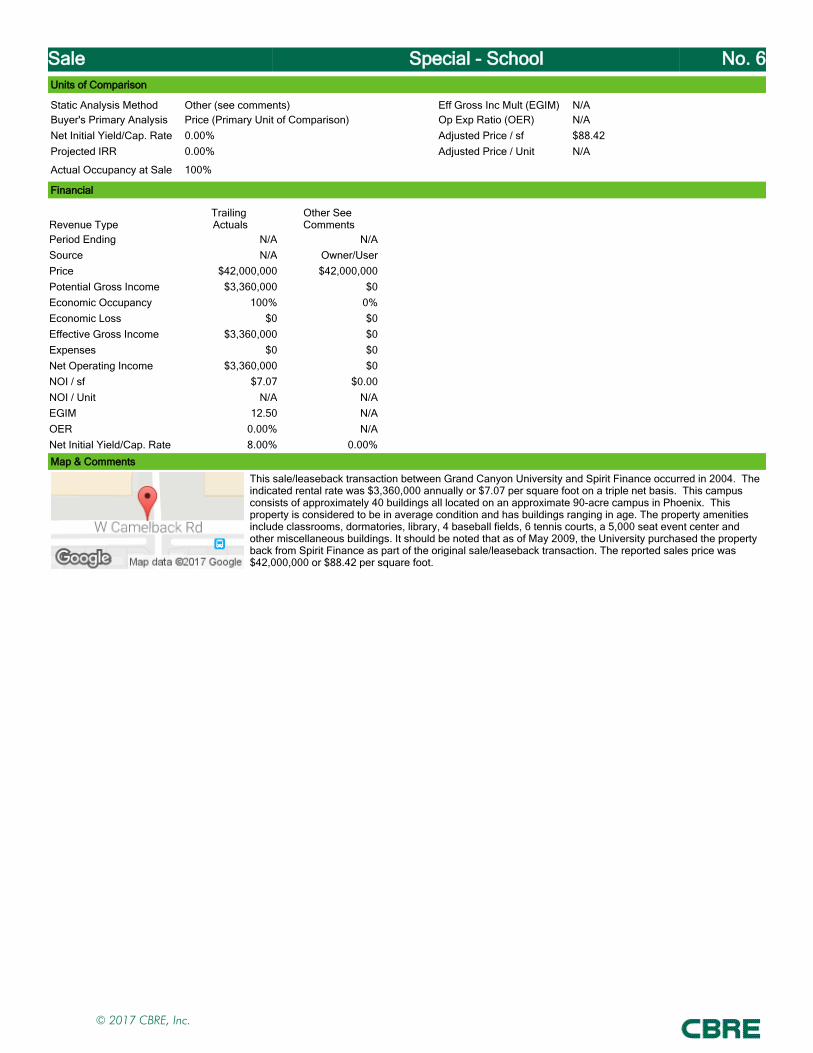
Sale Special - School No. 6Units of Comparison
Static Analysis Method Other (see comments) Eff Gross Inc Mult (EGIM) N/ABuyer's Primary Analysis Price (Primary Unit of Comparison) Op Exp Ratio (OER) N/ANet Initial Yield/Cap. Rate 0.00% Adjusted Price / sf $88.42Projected IRR 0.00% Adjusted Price / Unit N/A
Actual Occupancy at Sale 100%
Financial
Revenue TypeTrailing Actuals
Other See Comments
Period Ending N/A N/ASource N/A Owner/UserPrice $42,000,000 $42,000,000Potential Gross Income $3,360,000 $0Economic Occupancy 100% 0%Economic Loss $0 $0Effective Gross Income $3,360,000 $0Expenses $0 $0Net Operating Income $3,360,000 $0NOI / sf $7.07 $0.00NOI / Unit N/A N/AEGIM 12.50 N/AOER 0.00% N/ANet Initial Yield/Cap. Rate 8.00% 0.00%
Map & Comments
This sale/leaseback transaction between Grand Canyon University and Spirit Finance occurred in 2004. The indicated rental rate was $3,360,000 annually or $7.07 per square foot on a triple net basis. This campus consists of approximately 40 buildings all located on an approximate 90-acre campus in Phoenix. This property is considered to be in average condition and has buildings ranging in age. The property amenities include classrooms, dormatories, library, 4 baseball fields, 6 tennis courts, a 5,000 seat event center and other miscellaneous buildings. It should be noted that as of May 2009, the University purchased the property back from Spirit Finance as part of the original sale/leaseback transaction. The reported sales price was $42,000,000 or $88.42 per square foot.
© 2017 CBRE, Inc.
Addenda
Addendum C
RENT COMPARABLE DATA SHEETS
© 2017 CBRE, Inc.
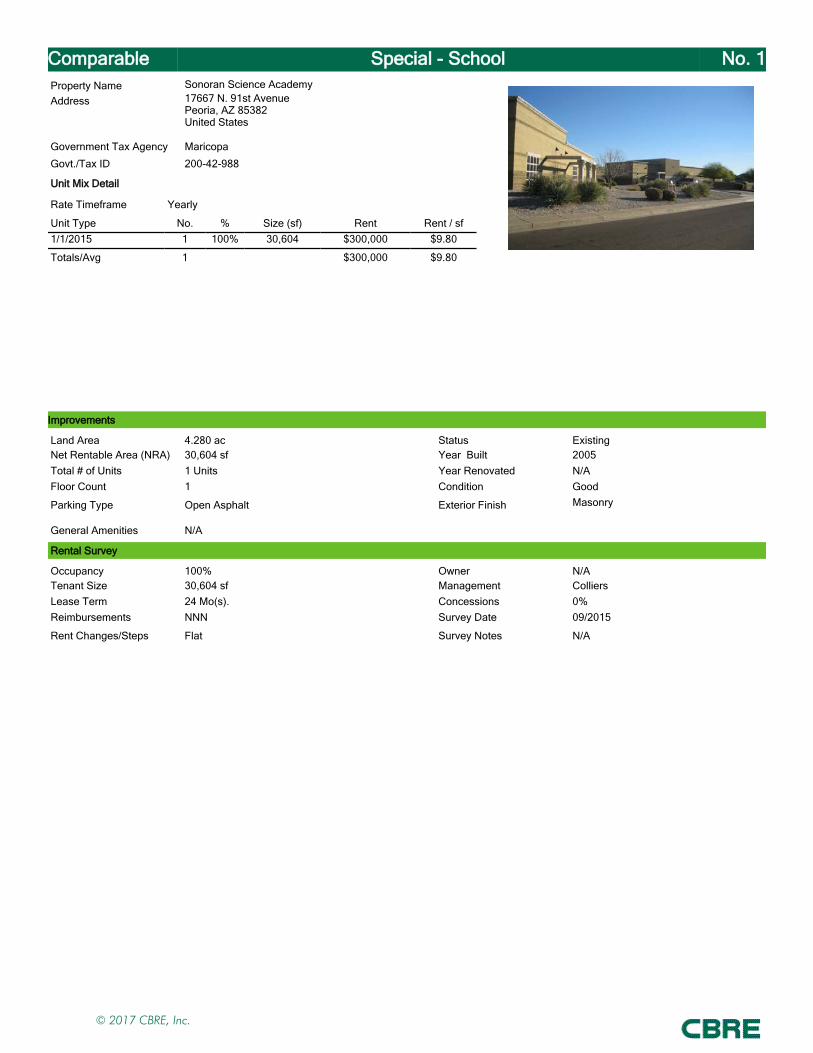
Comparable Special - School No. 1Property Name Sonoran Science AcademyAddress 17667 N. 91st Avenue
Peoria, AZ 85382United States
Government Tax Agency Maricopa
Govt./Tax ID 200-42-988
Unit Mix Detail
Rate Timeframe Yearly
Unit Type No. % Size (sf) Rent Rent / sf1/1/2015 1 100% 30,604 $300,000 $9.80
Totals/Avg 1 $300,000 $9.80
Improvements
Land Area 4.280 ac Status ExistingNet Rentable Area (NRA) 30,604 sf Year Built 2005Total # of Units 1 Units Year Renovated N/AFloor Count 1 Condition Good
Parking Type Open Asphalt Exterior Finish Masonry
General Amenities N/A
Rental Survey
Occupancy 100% Owner N/ATenant Size 30,604 sf Management ColliersLease Term 24 Mo(s). Concessions 0%Reimbursements NNN Survey Date 09/2015
Rent Changes/Steps Flat Survey Notes N/A
© 2017 CBRE, Inc.
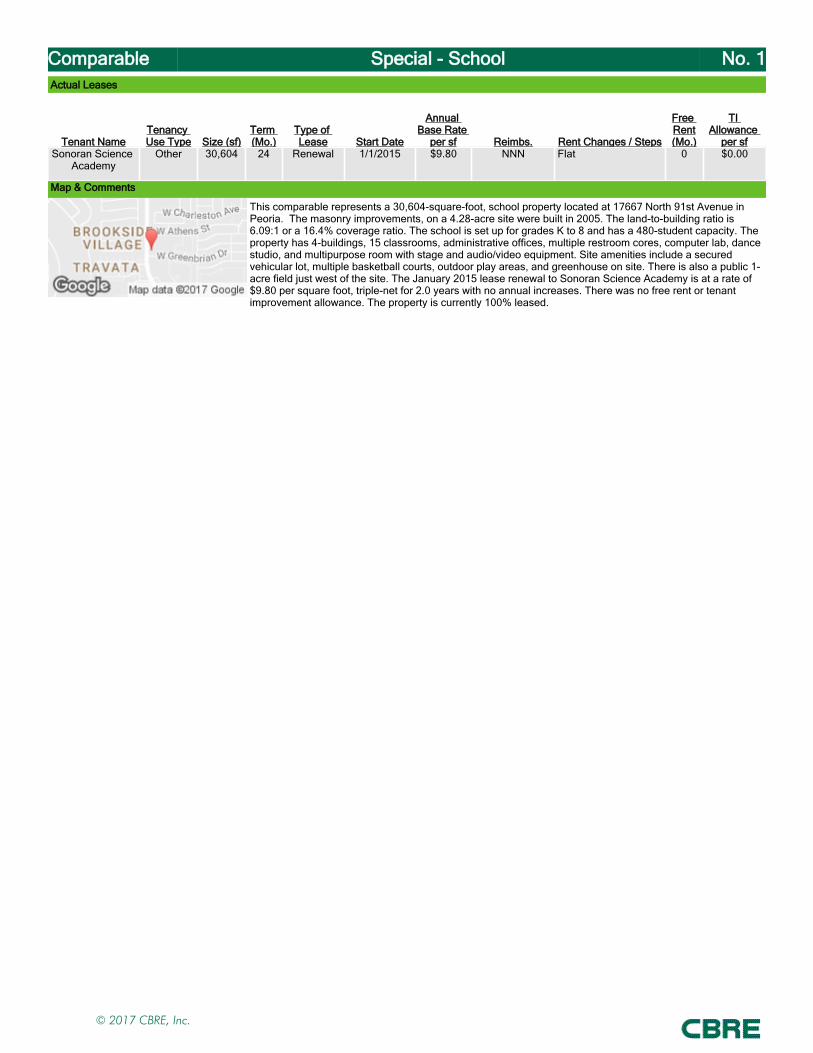
Comparable Special - School No. 1Actual Leases
Tenant NameTenancy Use Type Size (sf)
Term (Mo.)
Type of Lease Start Date
Annual Base Rate
per sf Reimbs. Rent Changes / Steps
Free Rent(Mo.)
TI Allowance
per sfSonoran Science
AcademyOther 30,604 24 Renewal 1/1/2015 $9.80 NNN Flat 0 $0.00
Map & Comments
This comparable represents a 30,604-square-foot, school property located at 17667 North 91st Avenue in Peoria. The masonry improvements, on a 4.28-acre site were built in 2005. The land-to-building ratio is 6.09:1 or a 16.4% coverage ratio. The school is set up for grades K to 8 and has a 480-student capacity. The property has 4-buildings, 15 classrooms, administrative offices, multiple restroom cores, computer lab, dance studio, and multipurpose room with stage and audio/video equipment. Site amenities include a secured vehicular lot, multiple basketball courts, outdoor play areas, and greenhouse on site. There is also a public 1-acre field just west of the site. The January 2015 lease renewal to Sonoran Science Academy is at a rate of $9.80 per square foot, triple-net for 2.0 years with no annual increases. There was no free rent or tenant improvement allowance. The property is currently 100% leased.
© 2017 CBRE, Inc.
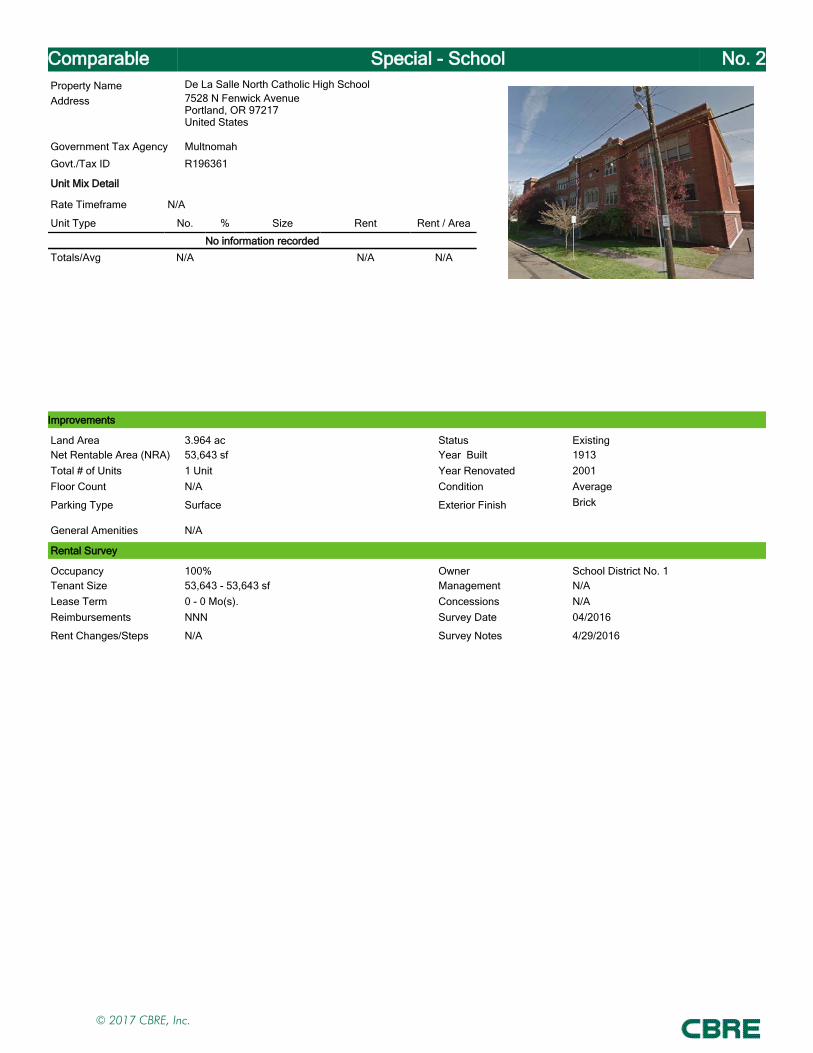
Comparable Special - School No. 2Property Name De La Salle North Catholic High SchoolAddress 7528 N Fenwick Avenue
Portland, OR 97217United States
Government Tax Agency Multnomah
Govt./Tax ID R196361
Unit Mix Detail
Rate Timeframe N/A
Unit Type No. % Size Rent Rent / Area
No information recordedTotals/Avg N/A N/A N/A
Improvements
Land Area 3.964 ac Status ExistingNet Rentable Area (NRA) 53,643 sf Year Built 1913Total # of Units 1 Unit Year Renovated 2001Floor Count N/A Condition Average
Parking Type Surface Exterior Finish Brick
General Amenities N/A
Rental Survey
Occupancy 100% Owner School District No. 1Tenant Size 53,643 - 53,643 sf Management N/ALease Term 0 - 0 Mo(s). Concessions N/AReimbursements NNN Survey Date 04/2016
Rent Changes/Steps N/A Survey Notes 4/29/2016
© 2017 CBRE, Inc.

Comparable Special - School No. 2Actual Leases
Tenant NameTenancy Use Type Size (sf)
Term (Mo.)
Type of Lease Start Date
Annual Base Rate
per sf Reimbs. Rent Changes / Steps
Free Rent(Mo.)
TI Allowance
per sfDe La Salle North
Catholic High School
Other 53,643 12 Renewal 4/29/2016 $9.57 NNN N/A N/A N/A
Map & Comments
This is the lase of the former Kenton School occupied by De La Salle North Catholic High School. The school was founded in 2001 and started occupying this space from the Portland Public School District. Details of the lease are considered to be confidential and not disclosed to the appraisers. However, a representative for the school district indicated that the tenant is currently in their renewal lease term at a current rate of $9.57 per square foot (2016 year).
© 2017 CBRE, Inc.

Comparable Special - School No. 3Property Name Parnassus Preparatory SchoolAddress 11201 96th Ave
Maple Grove, MN 55369United States
Government Tax Agency Hennepin
Govt./Tax ID N/A
Unit Mix Detail
Rate Timeframe N/A
Unit Type No. % Size Rent Rent / Area
No information recordedTotals/Avg N/A N/A N/A
Improvements
Land Area 11.500 ac Status ProposedGross Building Area (GBA) 146,855 sf Year Built 1981Total # of Units 1,190 Seat Year Renovated 2016Floor Count 1 Condition Good
Parking Type Surface Exterior Finish EIFS
General Amenities N/A
Rental Survey
Occupancy 100% Owner N/ATenant Size 146,855 sf Management N/ALease Term 360 - 420 Mo(s). Concessions N/AReimbursements Absolute Net Survey Date 09/2016
Rent Changes/Steps Fluctuates based on enrol Survey Notes N/A
© 2017 CBRE, Inc.
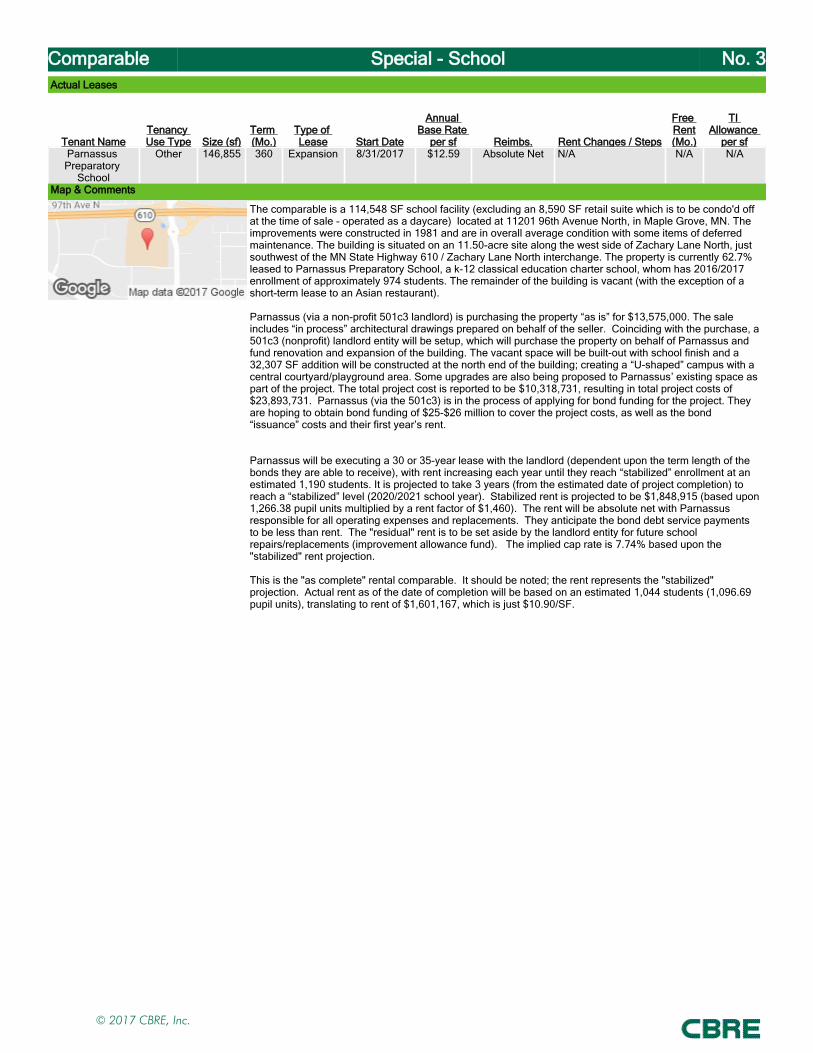
Comparable Special - School No. 3Actual Leases
Tenant NameTenancy Use Type Size (sf)
Term (Mo.)
Type of Lease Start Date
Annual Base Rate
per sf Reimbs. Rent Changes / Steps
Free Rent(Mo.)
TI Allowance
per sfParnassus Preparatory
School
Other 146,855 360 Expansion 8/31/2017 $12.59 Absolute Net N/A N/A N/A
Map & Comments
The comparable is a 114,548 SF school facility (excluding an 8,590 SF retail suite which is to be condo'd off at the time of sale - operated as a daycare) located at 11201 96th Avenue North, in Maple Grove, MN. The improvements were constructed in 1981 and are in overall average condition with some items of deferred maintenance. The building is situated on an 11.50-acre site along the west side of Zachary Lane North, just southwest of the MN State Highway 610 / Zachary Lane North interchange. The property is currently 62.7% leased to Parnassus Preparatory School, a k-12 classical education charter school, whom has 2016/2017 enrollment of approximately 974 students. The remainder of the building is vacant (with the exception of a short-term lease to an Asian restaurant).
Parnassus (via a non-profit 501c3 landlord) is purchasing the property “as is” for $13,575,000. The sale includes “in process” architectural drawings prepared on behalf of the seller. Coinciding with the purchase, a 501c3 (nonprofit) landlord entity will be setup, which will purchase the property on behalf of Parnassus and fund renovation and expansion of the building. The vacant space will be built-out with school finish and a 32,307 SF addition will be constructed at the north end of the building; creating a “U-shaped” campus with a central courtyard/playground area. Some upgrades are also being proposed to Parnassus’ existing space as part of the project. The total project cost is reported to be $10,318,731, resulting in total project costs of $23,893,731. Parnassus (via the 501c3) is in the process of applying for bond funding for the project. They are hoping to obtain bond funding of $25-$26 million to cover the project costs, as well as the bond “issuance” costs and their first year’s rent.
Parnassus will be executing a 30 or 35-year lease with the landlord (dependent upon the term length of the bonds they are able to receive), with rent increasing each year until they reach “stabilized” enrollment at an estimated 1,190 students. It is projected to take 3 years (from the estimated date of project completion) to reach a “stabilized” level (2020/2021 school year). Stabilized rent is projected to be $1,848,915 (based upon 1,266.38 pupil units multiplied by a rent factor of $1,460). The rent will be absolute net with Parnassus responsible for all operating expenses and replacements. They anticipate the bond debt service payments to be less than rent. The "residual" rent is to be set aside by the landlord entity for future school repairs/replacements (improvement allowance fund). The implied cap rate is 7.74% based upon the "stabilized" rent projection.
This is the "as complete" rental comparable. It should be noted; the rent represents the "stabilized" projection. Actual rent as of the date of completion will be based on an estimated 1,044 students (1,096.69 pupil units), translating to rent of $1,601,167, which is just $10.90/SF.
© 2017 CBRE, Inc.
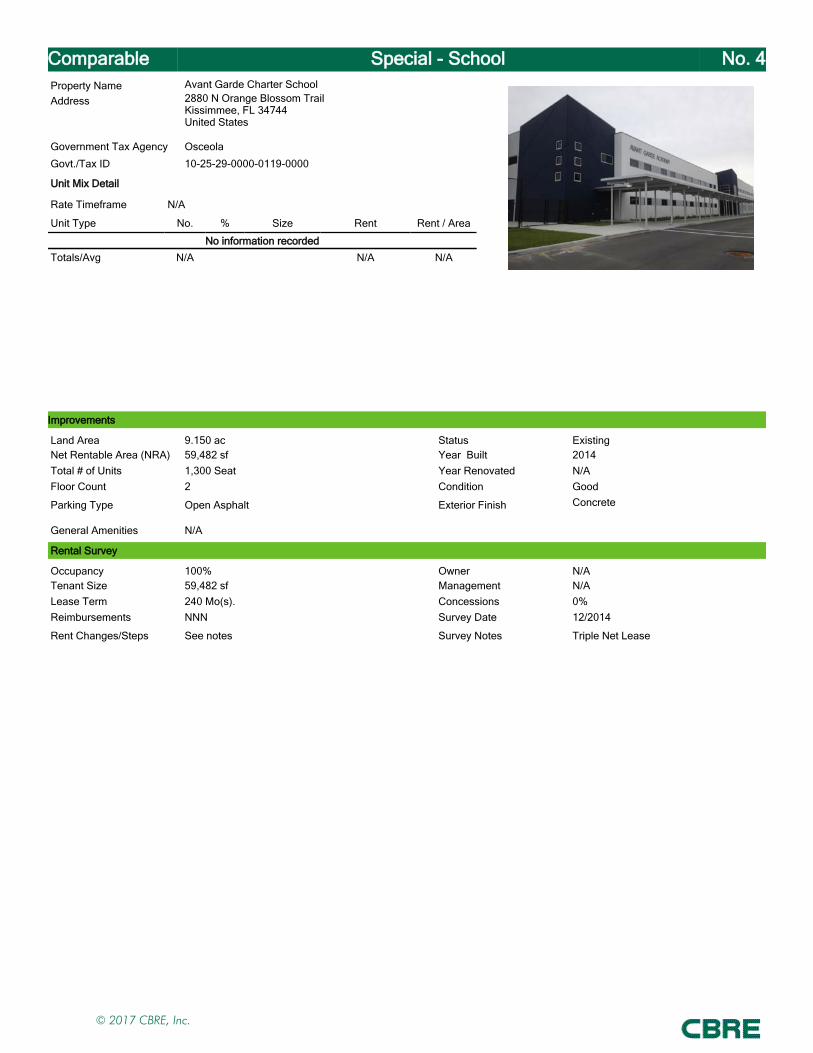
Comparable Special - School No. 4Property Name Avant Garde Charter SchoolAddress 2880 N Orange Blossom Trail
Kissimmee, FL 34744United States
Government Tax Agency Osceola
Govt./Tax ID 10-25-29-0000-0119-0000
Unit Mix Detail
Rate Timeframe N/A
Unit Type No. % Size Rent Rent / Area
No information recordedTotals/Avg N/A N/A N/A
Improvements
Land Area 9.150 ac Status ExistingNet Rentable Area (NRA) 59,482 sf Year Built 2014Total # of Units 1,300 Seat Year Renovated N/AFloor Count 2 Condition Good
Parking Type Open Asphalt Exterior Finish Concrete
General Amenities N/A
Rental Survey
Occupancy 100% Owner N/ATenant Size 59,482 sf Management N/ALease Term 240 Mo(s). Concessions 0%Reimbursements NNN Survey Date 12/2014
Rent Changes/Steps See notes Survey Notes Triple Net Lease
© 2017 CBRE, Inc.
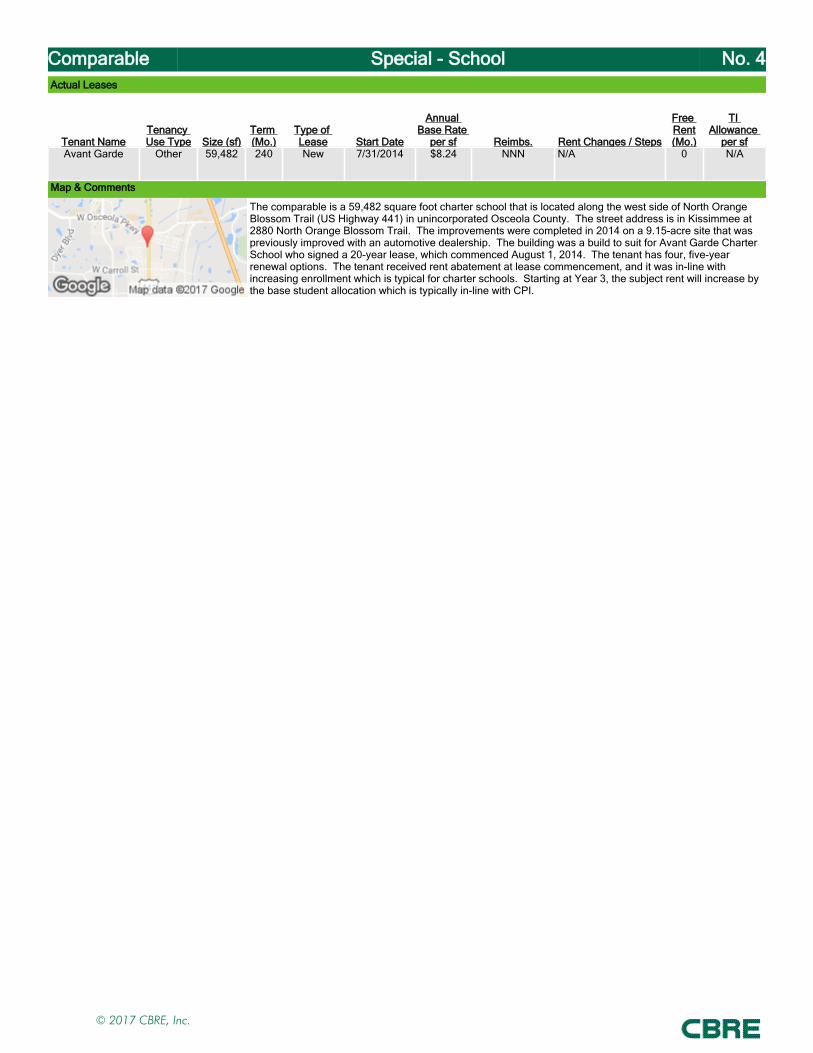
Comparable Special - School No. 4Actual Leases
Tenant NameTenancy Use Type Size (sf)
Term (Mo.)
Type of Lease Start Date
Annual Base Rate
per sf Reimbs. Rent Changes / Steps
Free Rent(Mo.)
TI Allowance
per sfAvant Garde Other 59,482 240 New 7/31/2014 $8.24 NNN N/A 0 N/A
Map & Comments
The comparable is a 59,482 square foot charter school that is located along the west side of North Orange Blossom Trail (US Highway 441) in unincorporated Osceola County. The street address is in Kissimmee at 2880 North Orange Blossom Trail. The improvements were completed in 2014 on a 9.15-acre site that was previously improved with an automotive dealership. The building was a build to suit for Avant Garde Charter School who signed a 20-year lease, which commenced August 1, 2014. The tenant has four, five-year renewal options. The tenant received rent abatement at lease commencement, and it was in-line with increasing enrollment which is typical for charter schools. Starting at Year 3, the subject rent will increase by the base student allocation which is typically in-line with CPI.
© 2017 CBRE, Inc.

Comparable Special - School No. 5Property Name Sage Montessori Charter SchoolAddress 3831 Midway Place NE
Albuquerque, NM 87109United States
Government Tax Agency Bernalillo
Govt./Tax ID N/A
Unit Mix Detail
Rate Timeframe N/A
Unit Type No. % Size Rent Rent / Area
No information recordedTotals/Avg N/A N/A N/A
Improvements
Land Area 2.010 ac Status ExistingNet Rentable Area (NRA) 34,785 sf Year Built 1993Total # of Units Units Year Renovated 2008Floor Count 1 Condition Good
Parking Type N/A Exterior Finish N/A
General Amenities N/A
Rental Survey
Occupancy 100% Owner N/ATenant Size 34,785 sf Management N/ALease Term 12 Mo(s). Concessions N/AReimbursements N/A Survey Date 05/2017
Rent Changes/Steps Flat Survey Notes Confirmed with Broker
© 2017 CBRE, Inc.
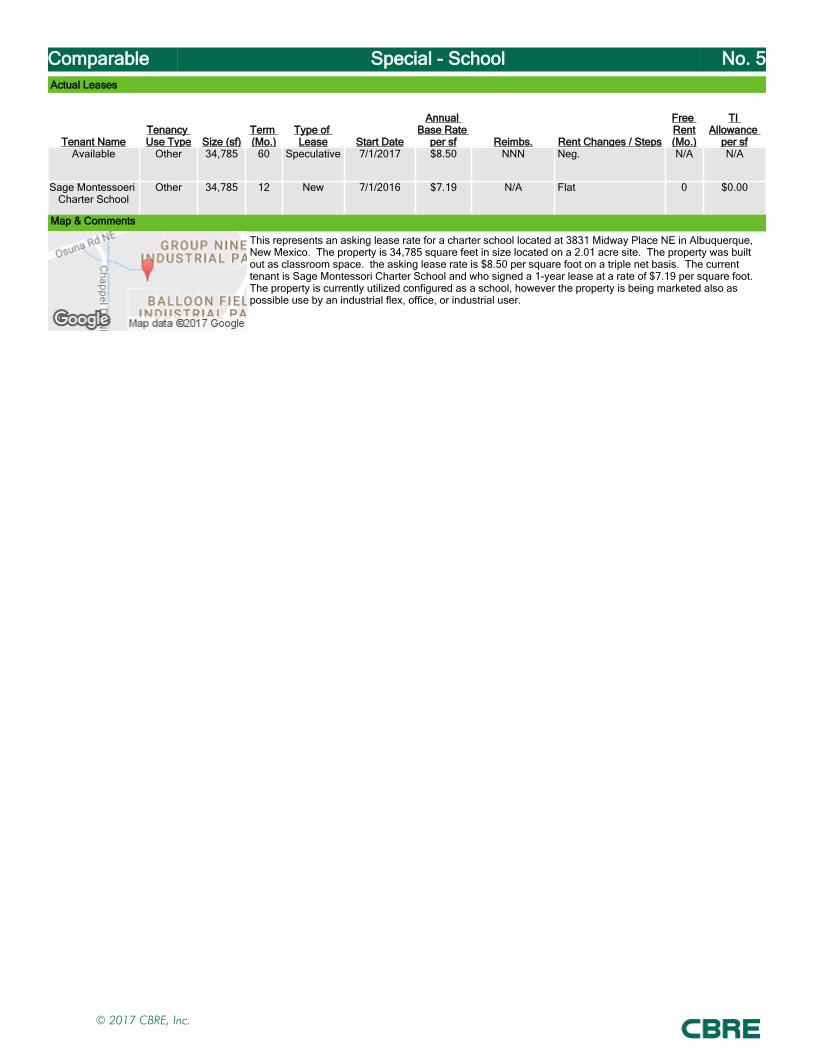
Comparable Special - School No. 5Actual Leases
Tenant NameTenancy Use Type Size (sf)
Term (Mo.)
Type of Lease Start Date
Annual Base Rate
per sf Reimbs. Rent Changes / Steps
Free Rent(Mo.)
TI Allowance
per sfAvailable Other 34,785 60 Speculative 7/1/2017 $8.50 NNN Neg. N/A N/A
Sage Montessoeri Charter School
Other 34,785 12 New 7/1/2016 $7.19 N/A Flat 0 $0.00
Map & Comments
This represents an asking lease rate for a charter school located at 3831 Midway Place NE in Albuquerque, New Mexico. The property is 34,785 square feet in size located on a 2.01 acre site. The property was built out as classroom space. the asking lease rate is $8.50 per square foot on a triple net basis. The current tenant is Sage Montessori Charter School and who signed a 1-year lease at a rate of $7.19 per square foot. The property is currently utilized configured as a school, however the property is being marketed also as possible use by an industrial flex, office, or industrial user.
© 2017 CBRE, Inc.

Comparable Special - School No. 6Property Name Health Leadership High SchoolAddress 1900 Randolph Road
Albuquerque, NM 87106United States
Government Tax Agency Bernalillo
Govt./Tax ID N/A
Unit Mix Detail
Rate Timeframe N/A
Unit Type No. % Size Rent Rent / Area
No information recordedTotals/Avg N/A N/A N/A
Improvements
Land Area 1.020 ac Status ExistingNet Rentable Area (NRA) 15,800 sf Year Built 1984Total # of Units 1 Units Year Renovated N/AFloor Count 2 Condition Good
Parking Type N/A Exterior Finish Tilt-up Concrete
General Amenities N/A
Rental Survey
Occupancy 100% Owner Jim ChynowethTenant Size 15,800 sf Management N/ALease Term 36 Mo(s). Concessions N/AReimbursements NNN Survey Date 05/2017
Rent Changes/Steps Annual $3.10/psf increase Survey Notes Confirmed with Broker
© 2017 CBRE, Inc.
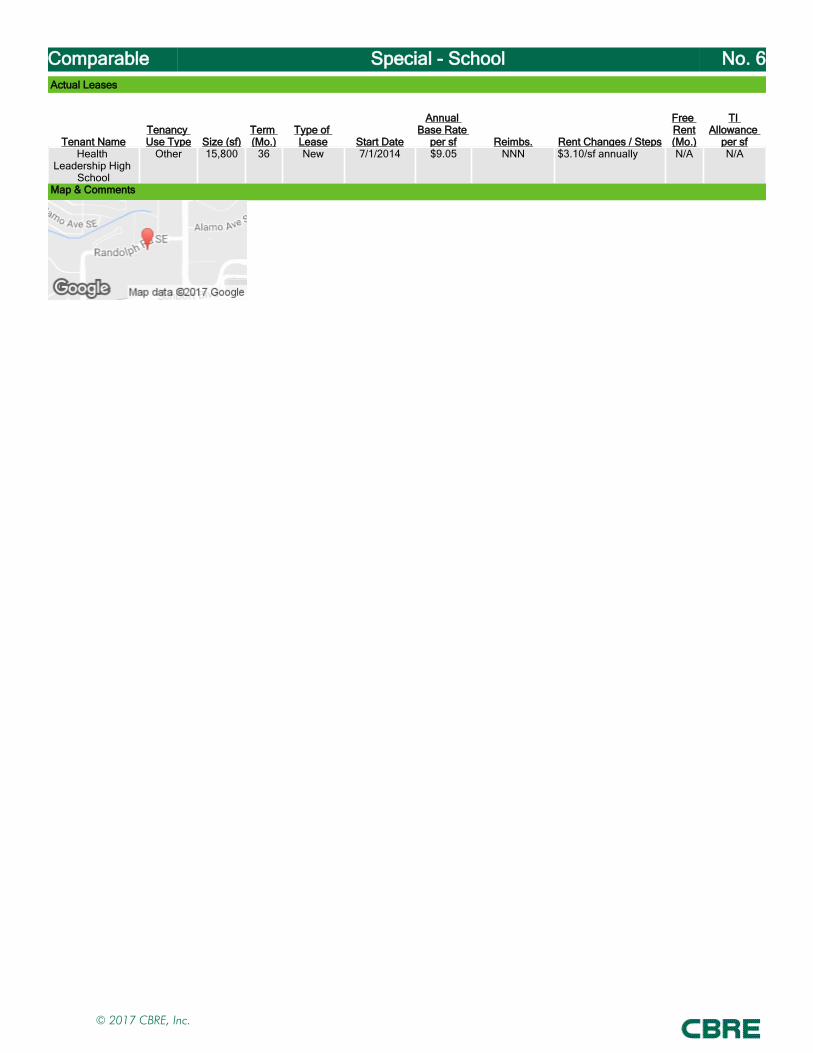
Comparable Special - School No. 6Actual Leases
Tenant NameTenancy Use Type Size (sf)
Term (Mo.)
Type of Lease Start Date
Annual Base Rate
per sf Reimbs. Rent Changes / Steps
Free Rent(Mo.)
TI Allowance
per sfHealth
Leadership High School
Other 15,800 36 New 7/1/2014 $9.05 NNN $3.10/sf annually N/A N/A
Map & Comments
© 2017 CBRE, Inc.
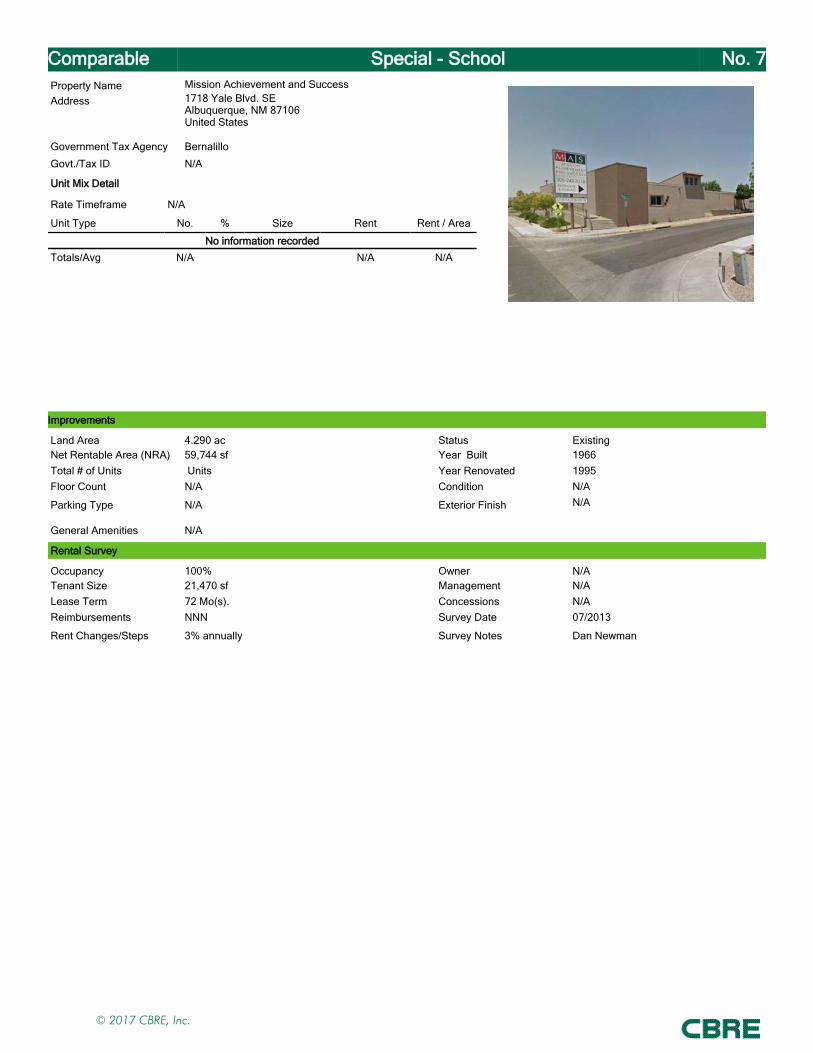
Comparable Special - School No. 7Property Name Mission Achievement and SuccessAddress 1718 Yale Blvd. SE
Albuquerque, NM 87106United States
Government Tax Agency Bernalillo
Govt./Tax ID N/A
Unit Mix Detail
Rate Timeframe N/A
Unit Type No. % Size Rent Rent / Area
No information recordedTotals/Avg N/A N/A N/A
Improvements
Land Area 4.290 ac Status ExistingNet Rentable Area (NRA) 59,744 sf Year Built 1966Total # of Units Units Year Renovated 1995Floor Count N/A Condition N/A
Parking Type N/A Exterior Finish N/A
General Amenities N/A
Rental Survey
Occupancy 100% Owner N/ATenant Size 21,470 sf Management N/ALease Term 72 Mo(s). Concessions N/AReimbursements NNN Survey Date 07/2013
Rent Changes/Steps 3% annually Survey Notes Dan Newman
© 2017 CBRE, Inc.

Comparable Special - School No. 7Actual Leases
Tenant NameTenancy Use Type Size (sf)
Term (Mo.)
Type of Lease Start Date
Annual Base Rate
per sf Reimbs. Rent Changes / Steps
Free Rent(Mo.)
TI Allowance
per sfMission
Achievement and Success
Other 21,470 72 Renewal 7/1/2013 $6.69 NNN 3% annually 0 $0.00
Map & Comments
This is a lease renewal of a charter school located at 1718 Yale Blvd. SE in Albuquerque New Mexico. The lease is for a period of 72 months at a lease rate of $6.69 per square foot in a space that is in a multi-tenant building that is 21,270 square feet in size. The lease rate increased 6% above the previous lease rate of $6.29 per square foot. For the renewal, the landlord agreed to improve the cafeteria space.
© 2017 CBRE, Inc.
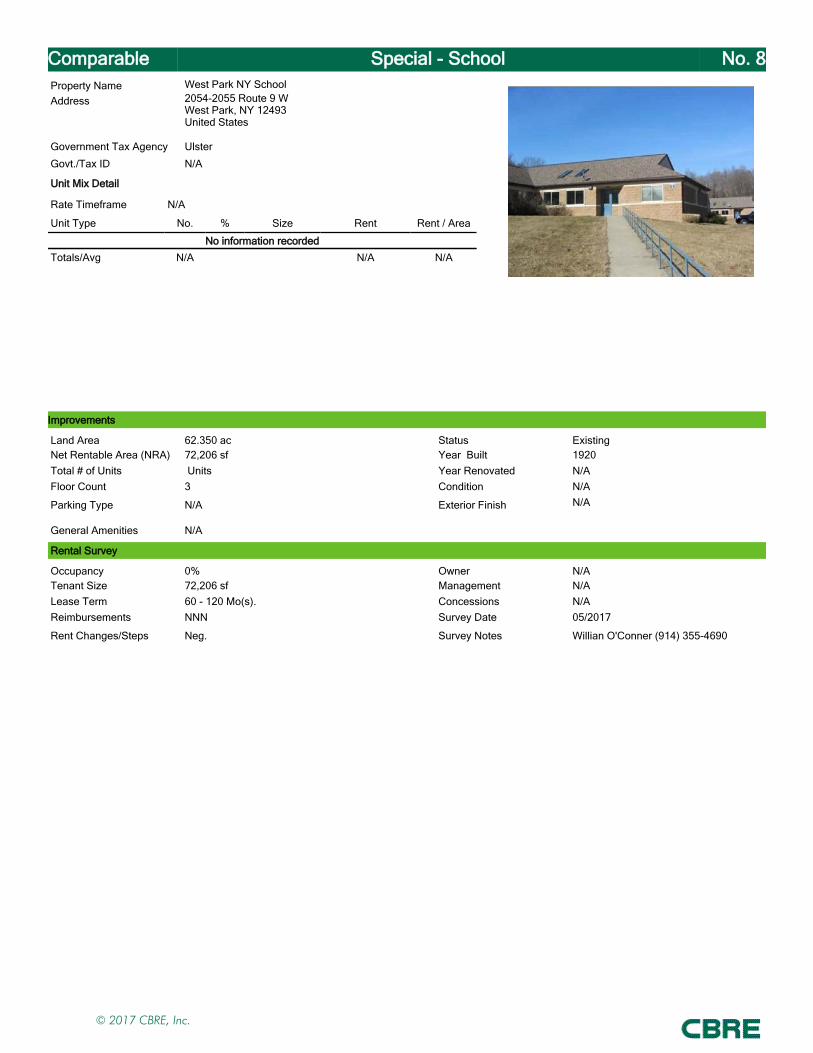
Comparable Special - School No. 8Property Name West Park NY SchoolAddress 2054-2055 Route 9 W
West Park, NY 12493United States
Government Tax Agency Ulster
Govt./Tax ID N/A
Unit Mix Detail
Rate Timeframe N/A
Unit Type No. % Size Rent Rent / Area
No information recordedTotals/Avg N/A N/A N/A
Improvements
Land Area 62.350 ac Status ExistingNet Rentable Area (NRA) 72,206 sf Year Built 1920Total # of Units Units Year Renovated N/AFloor Count 3 Condition N/A
Parking Type N/A Exterior Finish N/A
General Amenities N/A
Rental Survey
Occupancy 0% Owner N/ATenant Size 72,206 sf Management N/ALease Term 60 - 120 Mo(s). Concessions N/AReimbursements NNN Survey Date 05/2017
Rent Changes/Steps Neg. Survey Notes Willian O'Conner (914) 355-4690
© 2017 CBRE, Inc.

Comparable Special - School No. 8Actual Leases
Tenant NameTenancy Use Type Size (sf)
Term (Mo.)
Type of Lease Start Date
Annual Base Rate
per sf Reimbs. Rent Changes / Steps
Free Rent(Mo.)
TI Allowance
per sfAvailable for
LeaseOther 72,206 120 N/A 6/1/2017 $6.50 NNN Neg. N/A N/A
Map & Comments
This is the asking lease of 72,206 square feet of classrooms, dormitories, athletic fields, tennis courts and pool located on a 62.35 acre parcel. The property is along the Hudson River 90 miles north of Manhattan and is available for lease for $6.50 per square foot on a NNN lease basis.
© 2017 CBRE, Inc.
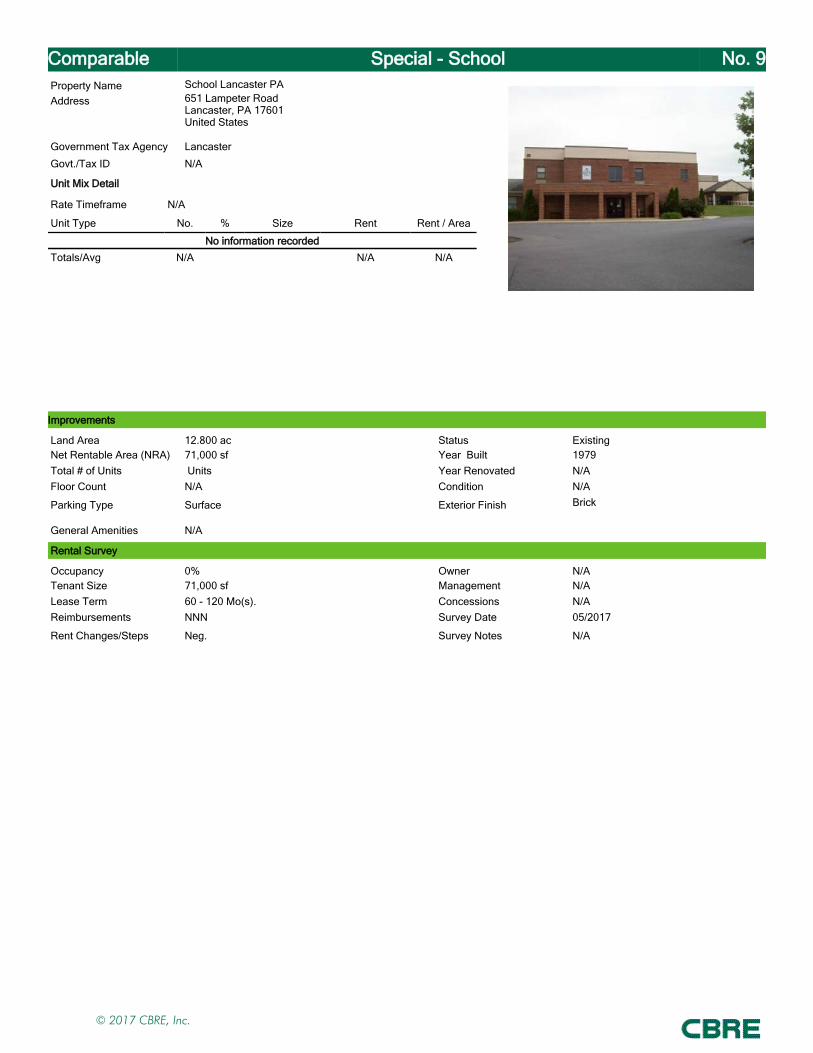
Comparable Special - School No. 9Property Name School Lancaster PAAddress 651 Lampeter Road
Lancaster, PA 17601United States
Government Tax Agency Lancaster
Govt./Tax ID N/A
Unit Mix Detail
Rate Timeframe N/A
Unit Type No. % Size Rent Rent / Area
No information recordedTotals/Avg N/A N/A N/A
Improvements
Land Area 12.800 ac Status ExistingNet Rentable Area (NRA) 71,000 sf Year Built 1979Total # of Units Units Year Renovated N/AFloor Count N/A Condition N/A
Parking Type Surface Exterior Finish Brick
General Amenities N/A
Rental Survey
Occupancy 0% Owner N/ATenant Size 71,000 sf Management N/ALease Term 60 - 120 Mo(s). Concessions N/AReimbursements NNN Survey Date 05/2017
Rent Changes/Steps Neg. Survey Notes N/A
© 2017 CBRE, Inc.

Comparable Special - School No. 9Actual Leases
Tenant NameTenancy Use Type Size (sf)
Term (Mo.)
Type of Lease Start Date
Annual Base Rate
per sf Reimbs. Rent Changes / Steps
Free Rent(Mo.)
TI Allowance
per sfAvailable for
LeaseOther 71,000 120 Speculative 6/1/2017 $5.75 NNN Neg. N/A N/A
Map & Comments
This is the asking lease rate for a school located at 651 Lampeter Road in Lancaster. PA. The building consist of 71,000 square feet of 12-classrooms, bathrooms, large gym and auditorium located on a 12.8-acre parcel of land. The land includes outdoor athletic fields. The asking lease rate is $5.75 per square foot on a NNN lease reimbursement basis.
© 2017 CBRE, Inc.
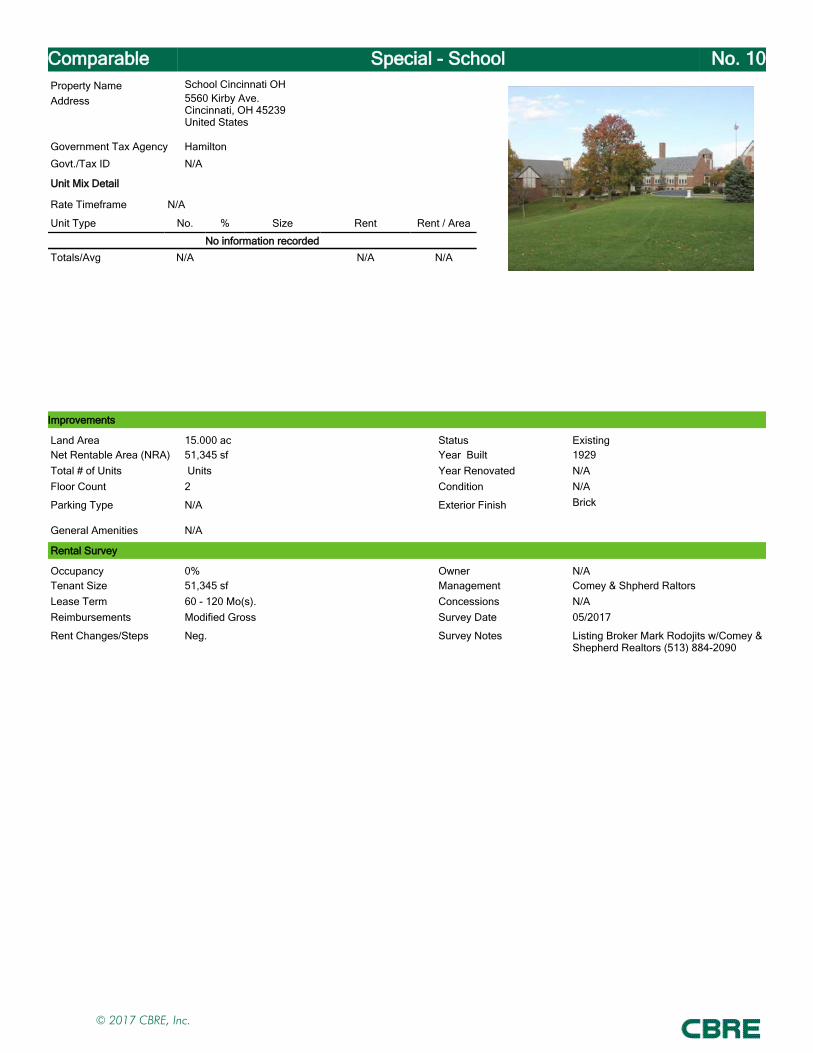
Comparable Special - School No. 10Property Name School Cincinnati OHAddress 5560 Kirby Ave.
Cincinnati, OH 45239United States
Government Tax Agency Hamilton
Govt./Tax ID N/A
Unit Mix Detail
Rate Timeframe N/A
Unit Type No. % Size Rent Rent / Area
No information recordedTotals/Avg N/A N/A N/A
Improvements
Land Area 15.000 ac Status ExistingNet Rentable Area (NRA) 51,345 sf Year Built 1929Total # of Units Units Year Renovated N/AFloor Count 2 Condition N/A
Parking Type N/A Exterior Finish Brick
General Amenities N/A
Rental Survey
Occupancy 0% Owner N/ATenant Size 51,345 sf Management Comey & Shpherd RaltorsLease Term 60 - 120 Mo(s). Concessions N/AReimbursements Modified Gross Survey Date 05/2017
Rent Changes/Steps Neg. Survey Notes Listing Broker Mark Rodojits w/Comey & Shepherd Realtors (513) 884-2090
© 2017 CBRE, Inc.

Comparable Special - School No. 10Actual Leases
Tenant NameTenancy Use Type Size (sf)
Term (Mo.)
Type of Lease Start Date
Annual Base Rate
per sf Reimbs. Rent Changes / Steps
Free Rent(Mo.)
TI Allowance
per sfAvailable for
LeaseOther 51,345 120 Speculative 6/1/2017 $5.65 Modified Gross neg. N/A N/A
Map & Comments
This is the asking lease rate for a school a school campus located at 5560 Kirby Ave. in Cincinnati Ohio. The campus comprises of 51,000 square feet of buildings located on a 15-acre site. The buildings include 20+ classrooms, cafeteria, offices, gym, auditorium and parish center. In addition, the property has baseball and football fields. The buildings were build between 1929 to 1996. The asking lease rate is $5.65 per square foot on a modified gross basis.
© 2017 CBRE, Inc.
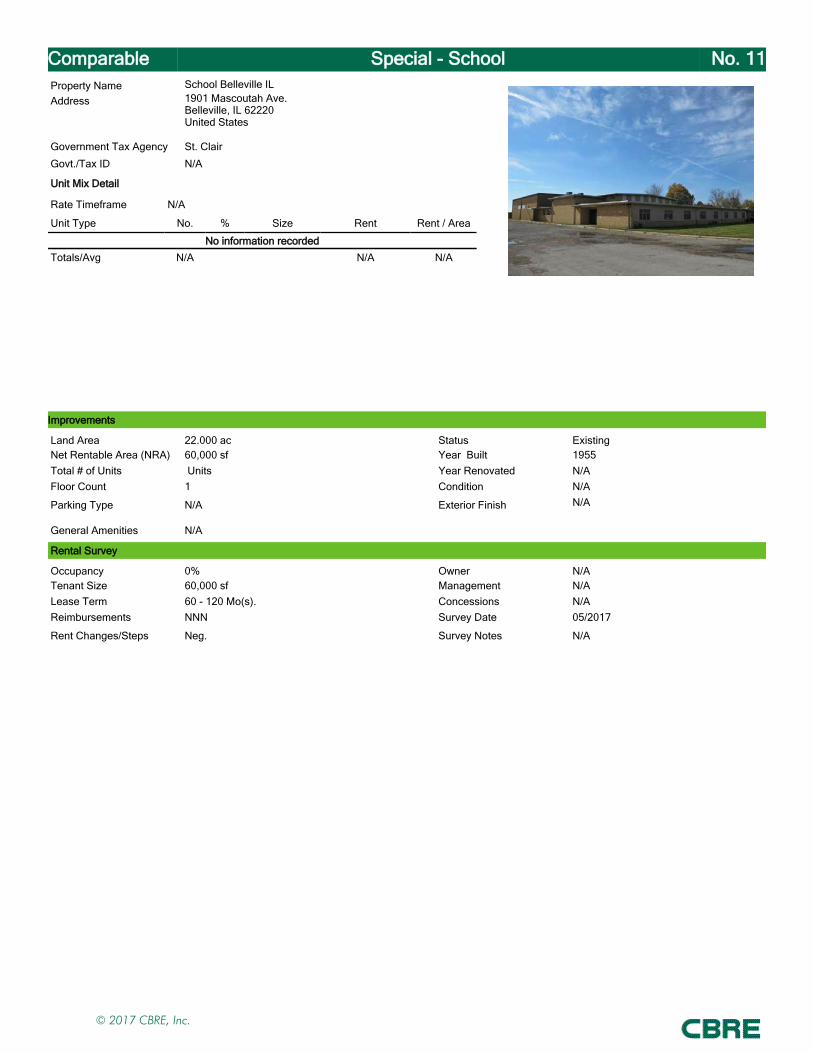
Comparable Special - School No. 11Property Name School Belleville ILAddress 1901 Mascoutah Ave.
Belleville, IL 62220United States
Government Tax Agency St. Clair
Govt./Tax ID N/A
Unit Mix Detail
Rate Timeframe N/A
Unit Type No. % Size Rent Rent / Area
No information recordedTotals/Avg N/A N/A N/A
Improvements
Land Area 22.000 ac Status ExistingNet Rentable Area (NRA) 60,000 sf Year Built 1955Total # of Units Units Year Renovated N/AFloor Count 1 Condition N/A
Parking Type N/A Exterior Finish N/A
General Amenities N/A
Rental Survey
Occupancy 0% Owner N/ATenant Size 60,000 sf Management N/ALease Term 60 - 120 Mo(s). Concessions N/AReimbursements NNN Survey Date 05/2017
Rent Changes/Steps Neg. Survey Notes N/A
© 2017 CBRE, Inc.
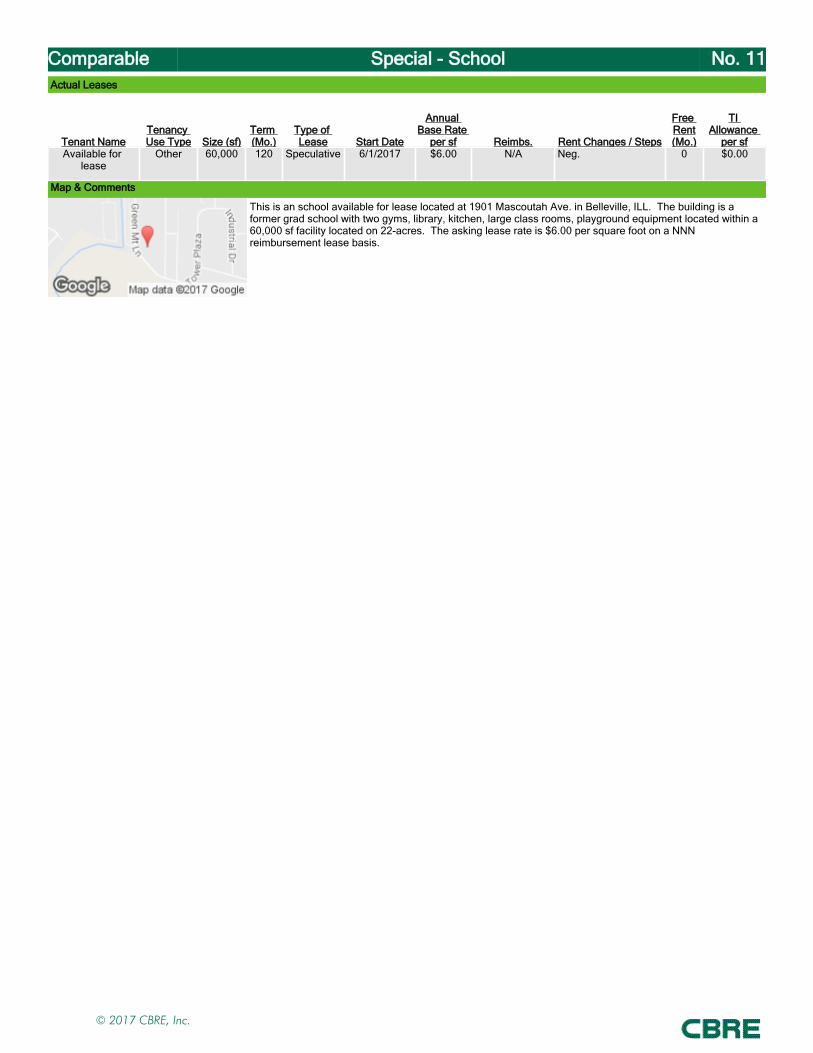
Comparable Special - School No. 11Actual Leases
Tenant NameTenancy Use Type Size (sf)
Term (Mo.)
Type of Lease Start Date
Annual Base Rate
per sf Reimbs. Rent Changes / Steps
Free Rent(Mo.)
TI Allowance
per sfAvailable for
leaseOther 60,000 120 Speculative 6/1/2017 $6.00 N/A Neg. 0 $0.00
Map & Comments
This is an school available for lease located at 1901 Mascoutah Ave. in Belleville, ILL. The building is a former grad school with two gyms, library, kitchen, large class rooms, playground equipment located within a 60,000 sf facility located on 22-acres. The asking lease rate is $6.00 per square foot on a NNN reimbursement lease basis.
© 2017 CBRE, Inc.

Addenda
Addendum D
LEGAL DESCRIPTION FROM LEASE
© 2017 CBRE, Inc.
© 2017 CBRE, Inc.
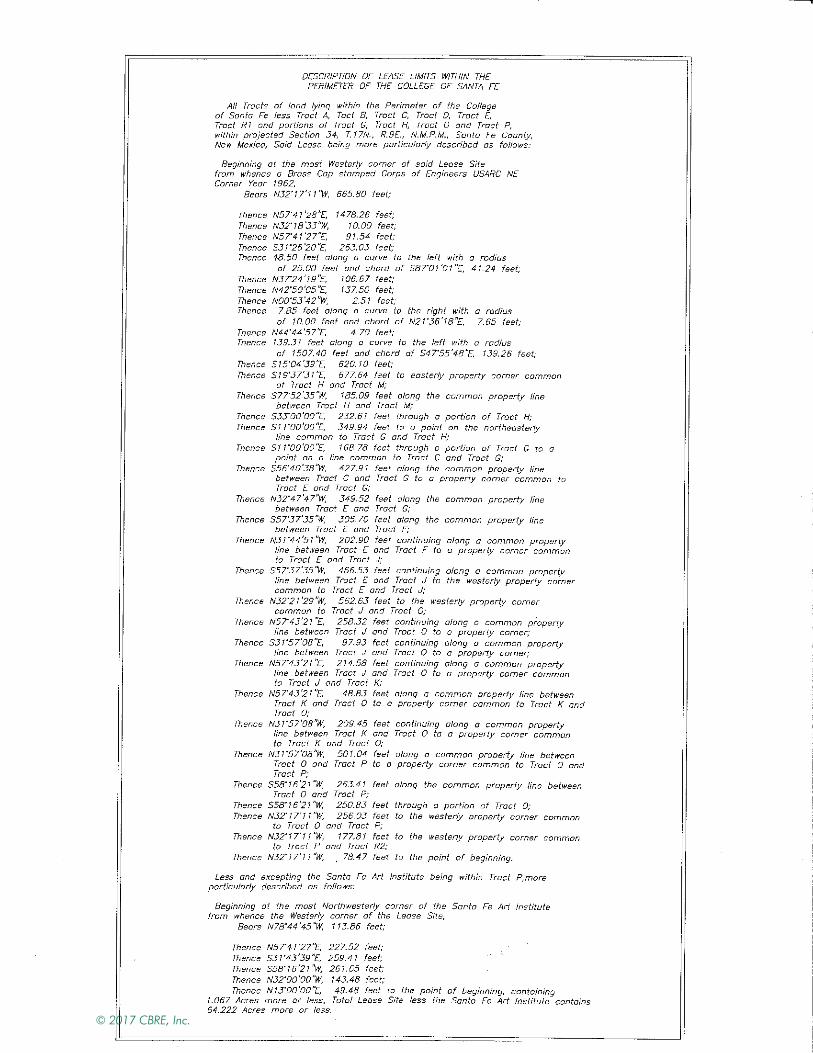
© 2017 CBRE, Inc.
© 2017 CBRE, Inc.

© 2017 CBRE, Inc.

© 2017 CBRE, Inc.
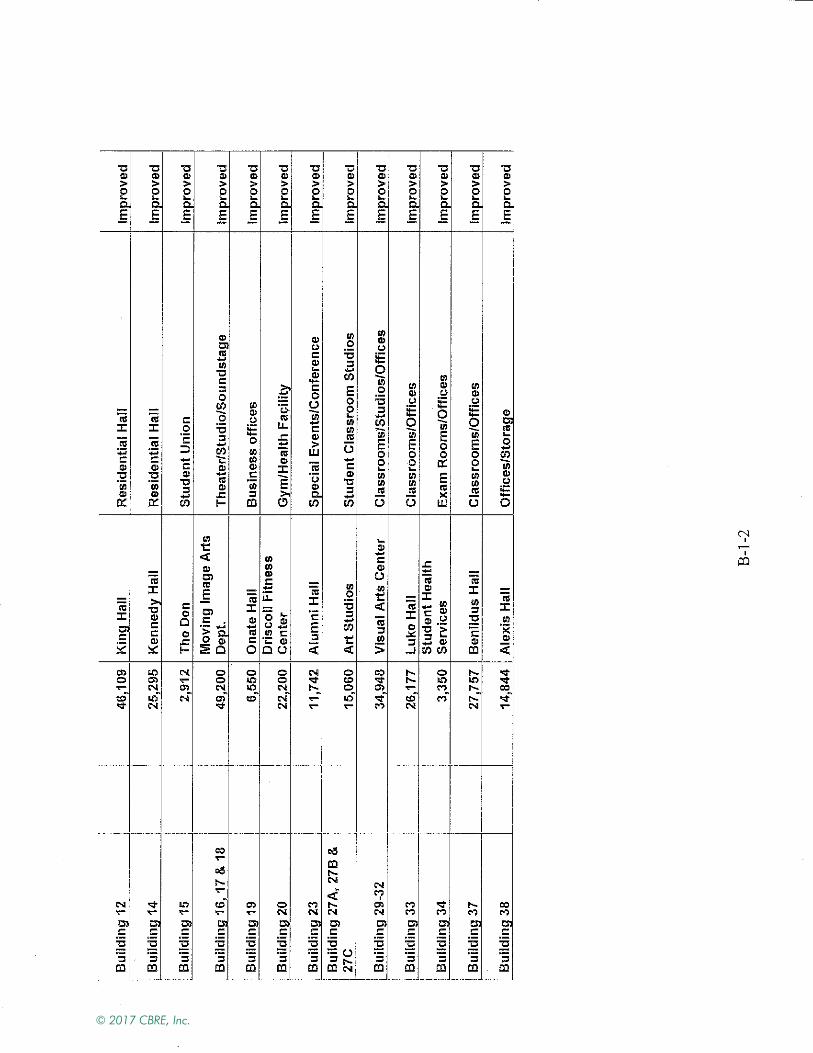
© 2017 CBRE, Inc.

Addenda
Addendum E
CLIENT CONTRACT INFORMATION
© 2017 CBRE, Inc.
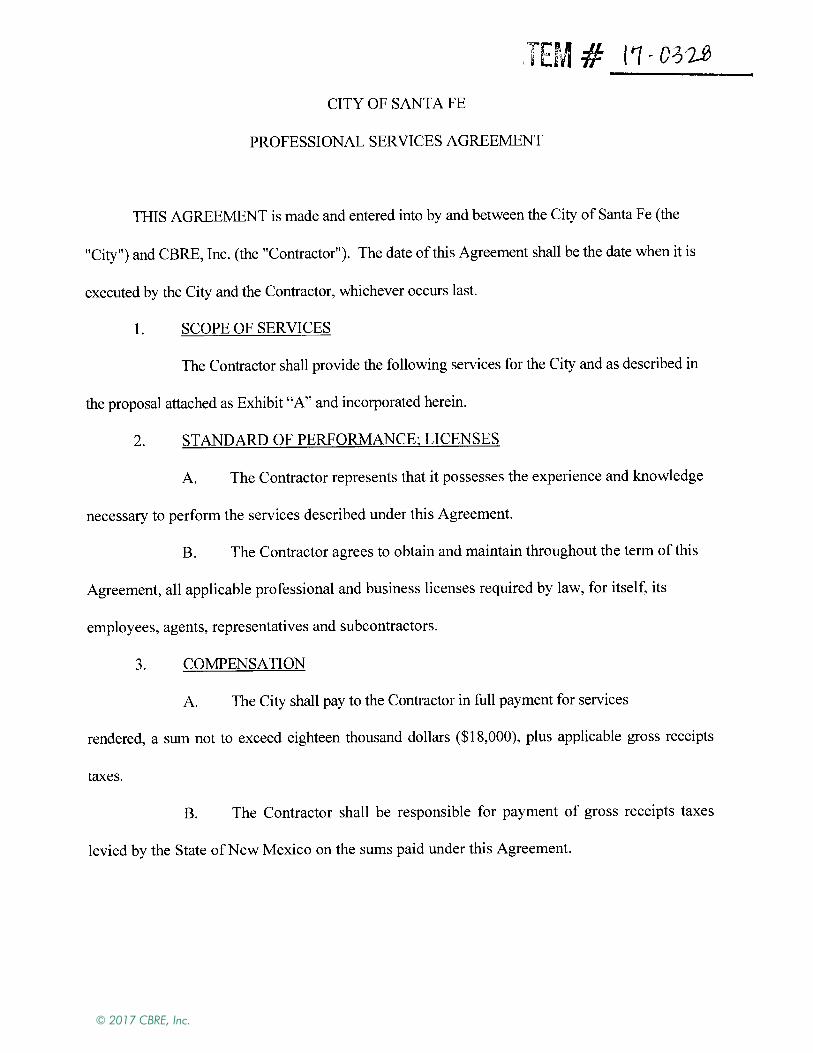
© 2017 CBRE, Inc.
© 2017 CBRE, Inc.
© 2017 CBRE, Inc.
© 2017 CBRE, Inc.
© 2017 CBRE, Inc.

© 2017 CBRE, Inc.

© 2017 CBRE, Inc.

© 2017 CBRE, Inc.
© 2017 CBRE, Inc.
© 2017 CBRE, Inc.
© 2017 CBRE, Inc.
© 2017 CBRE, Inc.
© 2017 CBRE, Inc.
© 2017 CBRE, Inc.
© 2017 CBRE, Inc.
© 2017 CBRE, Inc.

© 2017 CBRE, Inc.

© 2017 CBRE, Inc.
Addenda
Addendum F
APPRAISER QUALIFICATIONS
© 2017 CBRE, Inc.

QUALIFICATIONS
Stephen E. Wilson, MAI, SRA Vice President
CBRE, Inc. Valuation and Advisory Services
6100 Uptown Boulevard, Suite 300 Albuquerque, NM 87110
(505) 837-4935 tel (505) 212-0387 fax
EDUCATION
Bachelor of Science Degree, Accounting, St. John Fisher College, Rochester, New York Associates Degree, Accounting, State University of New York, Alfred, New York
LICENSE(S)/CERTIFICATION(S)
New Mexico Certified General Real Estate Appraiser-License #03364-G
PROFESSIONAL Appraisal Institute, Designated Member (MAI) and (SRA)
EXPERIENCE
2005 - 2007 Certified General Appraiser, Lubawy & Associates, Las Vegas, Nevada 2007 – 2012 Associate Director, Cushman & Wakefield VAS, Las Vegas, Nevada 2012 – 2014 Principal, Wilson Valuation, Las Vegas, Nevada 2014 – Present Vice President, CBRE, Inc., Albuquerque, New Mexico Appraisal experience has been in the fee preparation of real estate appraisals, rent analyses and market studies of commercial and multifamily residential properties. Experience encompasses property types including land, office, office condominiums, retail, industrial, private schools, restaurants, and multifamily properties, including low-income housing (LIHTC) properties. Assignments have been completed in Arizona, Nevada and New Mexico. The Intermountain Region of CBRE, Inc. Valuation and Advisory Services covers the states of Arizona, Colorado, Idaho, Montana, Nebraska, Nevada, New Mexico, North and South Dakota, Utah and Wyoming. The regional office is located in Phoenix, Arizona.
© 2017 CBRE, Inc.
© 2017 CBRE, Inc.
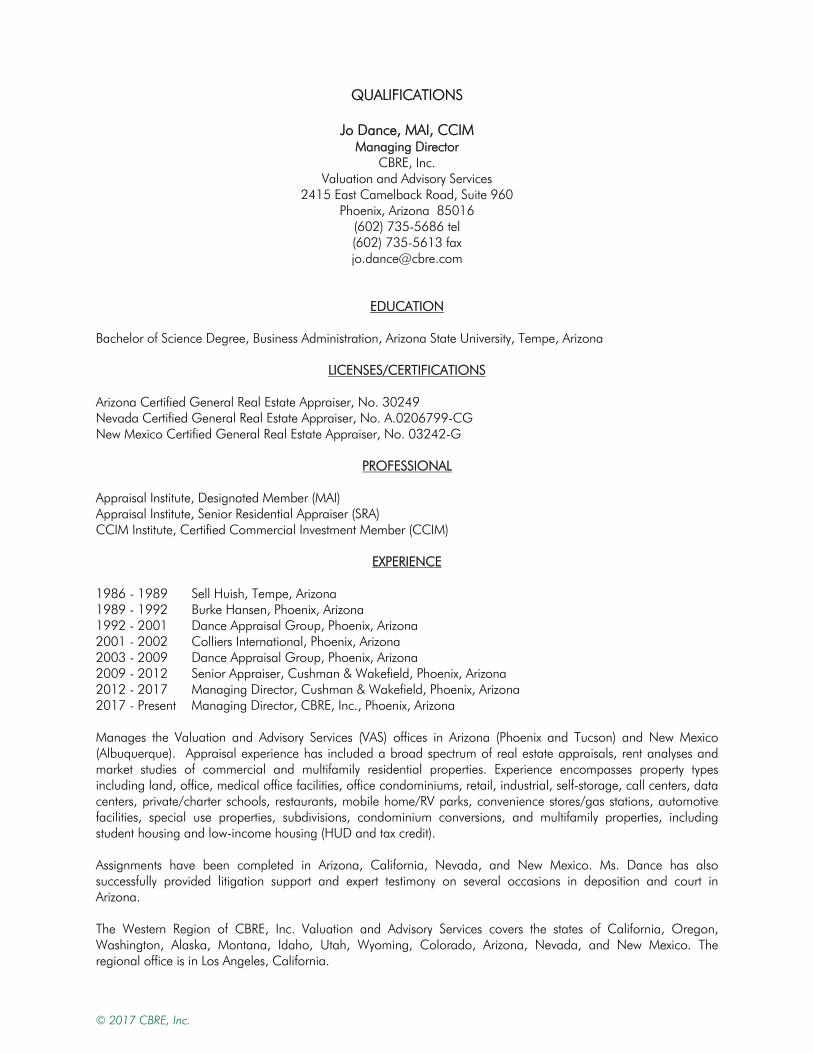
QUALIFICATIONS
Jo Dance, MAI, CCIM Managing Director
CBRE, Inc. Valuation and Advisory Services
2415 East Camelback Road, Suite 960 Phoenix, Arizona 85016
(602) 735-5686 tel (602) 735-5613 fax [email protected]
EDUCATION Bachelor of Science Degree, Business Administration, Arizona State University, Tempe, Arizona
LICENSES/CERTIFICATIONS Arizona Certified General Real Estate Appraiser, No. 30249 Nevada Certified General Real Estate Appraiser, No. A.0206799-CG New Mexico Certified General Real Estate Appraiser, No. 03242-G
PROFESSIONAL Appraisal Institute, Designated Member (MAI) Appraisal Institute, Senior Residential Appraiser (SRA) CCIM Institute, Certified Commercial Investment Member (CCIM)
EXPERIENCE 1986 - 1989 Sell Huish, Tempe, Arizona 1989 - 1992 Burke Hansen, Phoenix, Arizona 1992 - 2001 Dance Appraisal Group, Phoenix, Arizona 2001 - 2002 Colliers International, Phoenix, Arizona 2003 - 2009 Dance Appraisal Group, Phoenix, Arizona 2009 - 2012 Senior Appraiser, Cushman & Wakefield, Phoenix, Arizona 2012 - 2017 Managing Director, Cushman & Wakefield, Phoenix, Arizona 2017 - Present Managing Director, CBRE, Inc., Phoenix, Arizona Manages the Valuation and Advisory Services (VAS) offices in Arizona (Phoenix and Tucson) and New Mexico (Albuquerque). Appraisal experience has included a broad spectrum of real estate appraisals, rent analyses and market studies of commercial and multifamily residential properties. Experience encompasses property types including land, office, medical office facilities, office condominiums, retail, industrial, self-storage, call centers, data centers, private/charter schools, restaurants, mobile home/RV parks, convenience stores/gas stations, automotive facilities, special use properties, subdivisions, condominium conversions, and multifamily properties, including student housing and low-income housing (HUD and tax credit). Assignments have been completed in Arizona, California, Nevada, and New Mexico. Ms. Dance has also successfully provided litigation support and expert testimony on several occasions in deposition and court in Arizona. The Western Region of CBRE, Inc. Valuation and Advisory Services covers the states of California, Oregon, Washington, Alaska, Montana, Idaho, Utah, Wyoming, Colorado, Arizona, Nevada, and New Mexico. The regional office is in Los Angeles, California.
© 2017 CBRE, Inc.

© 2017 CBRE, Inc.