aptamer selection for hedgehog pathway receptor ptch1
TRANSCRIPT

Aptamer Selection for Hedgehog Pathway Receptor PTCH1
Nadine Ahmed
Research report submitted to the Department of
Biochemistry, Microbiology and Immunology
in partial fulfilment of the requirements
for the course BCH 4040
University of Ottawa
Ottawa, Ontario, Canada
April 2014
© April 2014, Nadine Ahmed
ii
1-Abstract
The identification of tumour specific molecular markers is a powerful tool in cancer diagnostics.
Targeting tumour-specific pathways might be the best way for developing nontoxic and efficient
anti-cancer therapies. Hedgehog pathway is a signalling pathway that direct growth and
patterning during embryonic development, while being silenced in adults. Constitutive activation
of the pathway has been associated with several types of cancer, including but not limited to;
basal cell carcinomas, medulloblastoma, brain, and prostate cancer. PTCH1 is the primary
transmembrane receptor of the hedgehog pathway. Thus, allowing for PTCH1 to become a
potential target for anti-cancer therapy. In this project, we utilize aptamer selection methods to
identify aptamers that bind with high specificity and selectivity to the PTCH1. Aptamers are
single stranded oligonucleotides that are identified through a comprehensive selection–
amplification process known as systematic evolution of ligands by exponential enrichment
(SELEX). The starting libraries for aptamers are around 1015 random sequences that are able to
adapt unique secondary and tertiary structures. For SELEX process, we utilized two cell lines;
one over-expressing the protein of interest (293T-PTCH1+) used for positive selection and the
other lacks the endogenous expression of the gene of interest (293T-PTCH1-) and is used for the
negative selection. The evolved pools of selection were amplified using asymmertric-PCR
(method 1) and conventional symmetrical-PCR followed by exonuclease digestion (method 2) to
produce ssDNA enriched pools. Each pool was analyzed using flow cytometry in order to
determine its specificity and selectivity toward the target. Successful aptamer sequence
identification may allow us to exploit PTCH1 receptor for drug delivery, inhibition of hedgehog
pathway or prevention of the replication of Hedgehog regulated cancer cells.

iii
Acknowledgements
I would like to thank my honours supervisor, Dr. Maxim Berezovski, for his guidance on this
project and in my career in science, as well as giving me the opportunity to work in his lab and to
develop essential techniques which I will cherish through out my career in science.
From the research group, I would like to thank Sharoukh Ghobadoloo for his help and
mentorship in developing the selection protocol and the design of the research as well as Nadia
Al-Youssef for your assistance with flow cytometry.
I would like to tremendously thank Darija Muharemagic, Anna Gargaun, Nasrin Khan, Pavel
Milman, Suzy Kosteniuk, Victor Souob and of course Noreen Ahmed for their support through
out the past year.

iv
Table of content
Abstract…………………………………………………………………………………………ii
Acknowledgements……………………………………………………………………………..iii
Statement of contributions……………………………………………………………………..v
List of figures…………………………………………………………………………………..vi
2-Introduction…………………………………………………………………………………..1
2.1 Cancer………………………………………………………………………………..1
2.2Hedgehog Pathway and Cancer……………………………………………………...2
2.3 PTCH1……………………………………………………………………………….4
2.4 Aptamers……………………………………………………………………………..6
3-Material and Methods………………………………………………………………………..9
Cells, antibodies and aptamers…………………………………………………………...9
Cell culturing……………………………………………………………………………..9
3.1Transfection of 293T………………………………………………………………….10
3.2Flow Cytometry verification of transfection………………………………………….10
3.3a Positive selection……………………………………………………………………11
3.3bNegative selection…………………………………………………………………...12
3.4a Method 1 purification and amplification……………………………………………13
3.4b Method 2 purification and amplification…………………………………………...14
3.5 Flow cytometry binding assays……………………………………………………....15
4-Results………………………………………………………………………………………....17
4.1 Verification of PTCH1 expression…………………………………………………...17
4.2 Affinity assay analysis rounds 1-10 using method 1………………………………...19

v
4.3 Median Fluorescence intensity (Method1)………………………………………..23
4.4Affinity assay analysis rounds 1-10 using method 2………………………………25
4.5 Median Fluorescence intensity (Method2)………………………………………..28
5- Discussion………………………………………………………………………………….31
6-conclusion………………………………………………………………………………….39
7-Refrences…………………………………………………………………………………..41

vi
Statement of contributions
Experimental concept
The idea of Cell-SELEX was adapted from Shahrokh Ghobadloo selection protocol, a PhD
student in the Berezovski lab. Added modification was done by Shahrokh Ghobadloo and Nadine
Ahmed.
Transfection of 293T cells to produce the PTCH1+ cell line was performed by Shahrokh
Ghobadloo.
Experimental testing
All rounds of selection were done by Nadine Ahmed. Training for the Coulter FC500 Flow
cytometr (Beckman Coulter, inc) and Guava EasyCyte flow cytometr (Millipore) was given by
Nadia Al-Youssef and Shahrokh Ghobadloo
Writing
This thesis was written and edited by Nadine Ahmed

vii
List of figures
Figure1: Schematic representation of Cell-SELEX method………………………………….16
Figure2: Antibody binding assay and verification of increased expression upon DOX induction………………………………………………………………………………………18
Figure3a: Flow cytometry binding assay for PTCH1+ and PTCH1- with FAM labelled N40 library prior to selection……………………………………………………………………….20
Figure 3b: Flow cytometry binding assay for PTCH1+ and PTCH1- with FAM labelled N40 pools from round 1 to round 6…………………………………………………………………21
Figure3C: Figure 3b: Flow cytometry binding assay for PTCH1+ and PTCH1- with FAM labelled N40 pools from round 7 to round 10………………………………………………….22
Figure4: Median fluorescence intensity of Pools 1-10 when incubated with 293T-PTCH1+ and 293T-PTCH1- cell lines (FAM-labelled N40 aptamers)………………………………………24
Figure 5a: Flow cytometry binding assay for PTCH1+ with CY5 labelled Harvard pools from round 1 to round 6……………………………………………………………………………..26
Figure 5b: Flow cytometry binding assay for PTCH1+ with CY5 labelled Harvard pools from round 7 to round 10…………………………………………………………………………….27
Figure6: Median fluorescence intensity of Pools 1-10 when incubated with 293T-PTCH1+ and 293T-PTCH1- cell lines (CY5 labelled aptamers)……………………………………………...29
Figure 7:Agarose get electrophoresis analysis of aptamers after each round of selection from pools 1-7(CY5 labelled pools)…………………………………………………………………..30

1
2. Introduction
2.1 Cancer
Despite Major advances in cancer research and diagnostic techniques, cancer still remains
a major problem and a leading cause of disease around the world (Hartwell and Kastan, 1994).
This is partially due to the ability of cancer to relapse and metastasize uncontrollably leading for
difficulty in the elimination of the disease (Hartwell and Kastan, 1994). Cancer often is
characterized with uncontrollable cell growth and cell division. This uncontrollable growth is
often directly related to the accumulation of mutations inside the cell, which can develop
spontaneously or can be induced by chemical agents or radiations etc (Hartwell and Kastan,
1994). The aggressiveness of the disease is controlled by different developmental pathways
which usually possesses useful properties during embryonic development and maintenance of
healthy tissues (Bailey et al. 2007). Past therapies have been designed to primarily target the
cells that rapidly proliferate, which results in the development of several side effects due to the
low selectivity and specificity towards the fast growing cell population. The trend in current
cancer therapeutics has evolved to target specific molecular components that are selectively
expressed on cancer cells. As a result, few effective biomarkers, probes and safe therapies started
to exist for the diagnosis and suppression of the development of specific types of cancers (Chen
R. et al., 2006).
Embryonic pathways have been well understood to regulate the maintenance and
development of cancerous tumours as well as cancer stem cell population (Zhao C. et al., 2009).
Cancer stem cells are tumour cell subtypes that are characterized by tumourigenic properties and
the ability to self-renew, produce differentiated progeny and develop resistance to therapy (Reya

2
T. et al., 2001). This class of cells have been termed “cancer stem cells” because they act like
adult stem cells and they possess the ability to give rise to all other cell types in a heterogonous
tumour mass (Reya T. et al., 2001). Several developmental pathways have been found to be
involved in the regulation and maintenance of cancer stem cell sub-population as well as create a
microenvironment that facilitates the development and progression of tumours (Bailey et al.,
2007). Much evidence suggests that cancer tumour cell population utilizes developmental
pathways; such as Hedgehog developmental pathway, to regulate the malignant capacity of a
cancerous population (Zhao C. et al., 2009). As a result, developing probes that target critical
components of such essential pathways in CSCs and tumour masses might provide a possibility
to isolate and characterize cancer cells.
The purpose of this research is to utilize an aptamer selection method in order to select
aptamers against cell surface receptor PTCH1, negative regulatory cell surface receptor of the
Hedgehog developmental pathway. The Hedgehog pathway which is a pathway involved in the
maintenance and regulation of cancerous tumours (Onishi and Katano, 2011). The selected
aptamers can act as a tool for cancer characterization, identification and diagnosis as well as they
might possess therapeutic potential what might eliminate cancer progression, development and
metastasis.
2.2 Hedgehog Pathway and Cancer
The Hedgehog pathway is a developmental pathway that has been initially discovered in
Drosophila melanogaster in the 1980’s and it was found to be evolutionary conserved (Nüsslein-
Volhard, C. and Wieschaus, 1980). This pathway plays an important role in development and
homeostasis of many organs and tissues as well as directing growth and pattering during
3
embryonic development. Furthermore, it has it has been found to be linked to tumourigenesis and
the persistence of cancer in the tumour micro-environment (Scales, S.J. & de Sauvage, F.J. ,
2009)(Gailani, M.R. et al, 1996). Additionally, hedgehog pathway is majorly inactivated in adult
tissue, except for its role in tissue repair and maintenance (van den Brink, 2007). There are three
secreted ligands in the mammalian Hedgehog pathway which regulates the activation of the
pathway in mammalian tissue (Sonic Hedgehog, Indian Hedgehog and Desert Hedgehog),
negative regulatory receptor, PTCH1, positive regulatory protein SMO and transcription factors
involved in the regulation of expression of genes involved in development, growth and tissue
maintenance (Scales S.J. and de Sauvage F.J., 2009). In the absence of the ligand, PTCH1
inactivated the pathway by inhibiting the action of the downstream SMO activations and thus no
transcription of genes involved in development, growth and proliferation (Murone M. et al.,
1999). On the other hand, in the presence of a ligand, PTCH1 allows for the activation of SMO
which leads an activation of a cascade which results in the release of GLI transcription factor
from a suppressive protein complex and their activation. This will eventually lead to the
induction of the expression of several proteins such as D-type cyclins, c-myc, and BCL2, which
are essential for differentiation growth and cell proliferation (Scales, S.J. & de Sauvage,
F.J,2009)( Varjosalo, M. & Taipale, J., 2008).
There are two major mechanisms that hedgehog pathway utilizes which leads to driving
cancers formation and persistence in adult tissue; a ligand dependent mechanism and a ligand
independent mechanism (Ehtesham et al., 2007) (Scales S.J. and de Sauvage F.J., 2009). In the
ligand independent mechanism, a constitutive activation of the Hedgehog pathway is present due
to the accumulation of mutations associated with the positive and the negative regulatory
proteins, SMO and PTCH1 respectively (Scales, S.J. & de Sauvage, F.J,2009)(Watkins et al.,

4
2003). Hyperactive signalling due to the accumulation of mutations in PTCH1 has been
identified in Meddulloblastoma (Berman et al. 2002), basel cell carcinoma and
rhabdomyosarcomas (Hettmer S. et al., 2014). Furthermore, there are paracrine and autocrine
ligand expression mechanisms which lead to the over-expression of the ligand in the tumour
micro-environment, as well as induced over-expression of PTCH1, cell surface receptor (Scales,
S.J. and de Sauvage, F.J, 2009). This results in a ligand dependent activation of the pathway and
eventually leading to cancer development. This mechanism has been linked to many types of
cancer including; but not limited to pancreatic, colon, gastric, lung, breast and prostate cancers,
leukemia and multiple myeloma (Rubin L.L. and de Sauvage F.J., 2006)
1.3 Target receptor PTCH1 and Cancer
PTCH1 is a transmembrane glycoprotein composed of 1447 amino acids, with 12
transmembrane domains (Murone et al., 1999). As previously mentioned it is a major regulator
of the Hedgehog signalling pathway and thus has a major role in cell proliferation, development,
growth and differentiation (Zurawell R.H. et al., 2000). Mutations in PTCH1 is found to have a
major role in driving the formation of several types of cancers such as Meddulloblastoma, basel
cell carcinoma and rhabdomyosarcomas due to its role in causing constitutive and stimulated
activation of the hedgehog pathway (Hettmer S. et al., 2014). Furthermore, the over-expression
of the receptor in adult tissue is a major marker for cancer development in the tissue, and thus
PTCH1 can act as a biomarker for many solid tumours; such as tumours associated with
pancreatic, colon, gastric, lung, breast and prostate cancers. Nakamoura et al. (2007) showed that
targeting PTCH1 with anti-PTCH1 antibodies which recognizes an oligopeptide of PTCH1 on
the cell surface suppresses the hedgehog pathway and pancreatic cancer proliferation, since it has
the ability to silence the Hedgehog stimuli to PTCH1 (Nakamoura et al. 2007). Furthermore,

5
according to You et al. (2010) PTCH1 expression is related to the metastatic potential of
colorectal cancer (CRC). You et. al have provided evidence that an increase in the levels of
mRNA and protein levels of PTCH1 in CRC cell line might suggest a relationship between
PTCH1 expression and the metastatic capacity of CRC (You et. al 2010). The previous findings
provide evidence that PTCH1 can act as a potential biomarker and target for cancer therapy and
treatment.
PTCH1 expression and Hedgehog activation has as well been evident in Cancer stem cell
(CSCs) population (Bar E. et al., 2007). CSCs are a cancer tumour subtype, that are characterized
by their ability to self renew, produce differentiated progeny, metastasize and develop resistance
to anticancer therapy. According to Li et al (2009), cancer stem cell population, which showed
properties of self renewal , were identified in CD44+CD24+ESA+ pancreatic cancer cells, which
provided evidence of the over-expression of cell surface receptor PTCH1 and the Hedgehog
ligand in the tumour micro-environment (Li C. et al., 2009). Identification of the PTCH1, cell
surface marker, in this population of cancer tumour, might provide a novel therapeutic approach
(targeting PTCH1) to suppress the regulation and the growth of this population (which is
resistant to therapy).
Thus, a detection method for the identification of PTCH1 is required to characterize such
receptor in cancer populations. Potential probes can as well be developed to allow for the
characterization of changes to the receptor. Since targeting a critical components of the hedgehog
pathway in CSCs and solid tumour masses, might provide a possibility to suppress the growth of
tumours. Of the many probes undergoing development, Aptamers, a type of designer nucleic
acid, is of high interest in molecular targeting and recognition. Thus, aptamer selection can
provide a novel method to identify probes that are specific to the target of interest and therefore

6
they have the potential to provide a tool to characterize and better study PTCH1 and
consequently, the Hedgehog pathway.
1.4 Aptamers
Aptamers are single stranded DNA or RNA (ssDNA or ssRNA) oligonucleotides that are
able to adapt unique three dimensional conformations which can act as scaffolds for molecular
interactions (Keefe et al. 2010). They are typically 5-25KDa in size and they possess the ability
to bind a wide range of protein targets and other bio-molecules with high affinity and specificity
(Ellington AD and Szostak JW, 1990). Their binding capacity makes them an attractive
alternative to antibodies (Jayasena S.D., 1999). They possess many characteristics which makes
them favourable in research; such as their small size, lack of immunogenicity, ease of isolation
and ease of production (Jayasena S.D., 1999). As previously mentioned, aptamers can bind
simple molecules such as simple as amino acids and as complex as red blood cells, eukaryotic
cell membranes and cell surface proteins and receptors (Ellington AD and Szostak JW, 1990)
(Sefah et al. 2009).
Aptamers are often compared to antibodies due to their shared characteristics of specific target
binding and similar function and application (Jayasena S.D., 1999). Similarly to antibodies,
aptamers can be used for therapeutic and diagnostic purposes (Bunka et. al. 2006). However,
there are some differences between both which predominantly confers advantages to aptamers.
Aptamers are generally cheaper to produce and can be produced in large quantities. On the other
hand, antibodies, require the use of animals to produce an immune response to a specific
molecule, thus making them limited in terms of yield (due to the dependence on the immune
response that the animal produces towards a specific antigen) and more expensive and harder to

7
produce in large quantities (Jayasena S.D., 1999). Furthermore, antibodies tend to degrade faster
than DNA, making DNA aptamers a more attractive choice in terms of stability (Jayasena S.D.,
1999). At elevated temperatures, both antibodies and aptamers are denatured; aptamers regain
their native confirmation as temperature decreases, however antibodies are irreversibly
denatured, and thus losing their activity. This suggests that aptamers can withstand harsher
conditions in comparison to antibodies (Song et al. 2012). These advantageous properties of
aptamers allow us to develop oligonucleotide antagonists for several targets which can survive in
animal model of disease and in humans. However it is essential to modify these aptamers to
become resistant to nuclease activity found in serum (Song et al. 2012). Such modification
include sugar modifications of nucleoside triphosphate, changing the 2’OH groups of ribose to
2’F or 2’NH2 groups in order to produce aptamers with nuclease resistant properties (Brody and
Gold, 2000) as well thiolation of the phosphate backbone (Song et al. 2012). Conjugation of
aptamers with higher molecular weight vehicles is as well required to produce higher weight
molecules and protect aptamers form renal infiltration (such as conjugating aptamers with a PEG
group) (Veronese and Mero, 2008). Thus, aptamers can act as vehicles for drug delivery to
specific target of interest.
Aptamers were initially developed in the early 1990’s by Szostak and Gold Laboratories
using the in vitro SELEX method (Systematic evolution of ligand by exponential enrichment)(
Szostak et al. 1990)(Gold et al. 1990). For this process, a random library of ~ 1015 random
aptamer sequences of fixed length are successively and iteratively partitioned for binding for a
specific target and ultimately amplified after selection due to the presence of conserved regions
in the aptamers which allows primer annealing and thus Polymerase Chain Reaction
amplification. The first-aptamer based drug on the market is pegaptanib sodium (Macugen). The

8
drug is an anti-VEGF165, which prevents angiogenesis and mediates permeability to the eye and
thus preventing the development of age related muscular degeneration (Ng E.W.M. et al. 2006).
Several other aptamer based drugs were released on the market ever since, and others are in
stages of clinical trials. In this research, we employed Cell-SELEX (see figure 1) procedure to
target PTCH1 receptor (Shangguan et al. 2006). Cell-SELEX requires the utilization of a
positive-expressing the receptor and negative cell lines- no endogenous expression (+ selection
and a counter negative selection, respectively).This counter selection strategy is utilized in order
to collect aptamer sequences that specifically interact with the target cell line but not the control
cells. In each round of selection, aptamers that bind to positive cells are retained and the ones
that bind to the negative cells are washed from the system. Thus, allowing the elution of the
bound aptamers and their amplification to produce a pool for the following round of selection
(Song et al. 2012). The purpose of the selection process is to enrich the pools with aptamer
sequences which exclusively bind to the target (Shangguan et al. 2006).
The main objective of the project is to utilize Cell-SELEX method to identify an aptamer
sequence, which binds efficiently and with high specificity to PTCH1 receptor. The selected
aptamers can act as a tool for cancer characterization; identification as well as they might possess
therapeutic potential which might eliminate cancer progression, development and metastasis.
Upon identification of a binding aptamer sequences, several biological assays will be developed
in order to identify the effect of the aptamer on the target receptor.

9
3-Material and Methods
Cells, antibodies and aptamers
Cell lines used in this research include: trancfected 293T (293T-PTCH1+) (human embryonic
kidney) and non-transfected 293T (293T-PTCH1-). N40 library (Integrated DNA Technologies
Inc.) was used for the first set of 10 rounds of selection (method 1). The aptamer library
contained a random around 1015 aptamers, 80 sequences in length; 40 nucleotides random
sequences flanked by 20 conserved nucleotide for primer annealing purposes. Harvard Library
(Integrated DNA Technologies Inc.) was used for the second set of 10 rounds of selection
(method 2). The Harvard aptamer library contained a random around 1015 aptamers, 100
sequences in length; 60 nucleotides random sequences flanked by 20 conserved nucleotide for
primer annealing purposes. Anti-PTCH1 mouse monoclonal antibody was used to verify the
success of PTCH1 transfection in 293T cell line.
Cell culturing
293T cells (transfected(293T-PTCH1+) and non-transfected (293T-PTCH1-) were maintained in
Dulbecco’s Modified Eagle Medium(Thermo scientific ), supplemented with 10% Fetal bovine
serum (Thermo-Fisher) in an Alpha Innotech HeraCell incubator© at 37 oC and 5% CO2 . Cells
were detached from culture plates using Trypsin (Thermo scientific). Cation-free Phosphate
Buffer Saline (PBS) (Thermo scientific) was used for washing the cells during Culturing. Media
was replaced every two to four days as necessary.

10
3.1 Transfection of 293T with a vector containing the gene of interest PTCH1. (Prepared by
Shahrokh Ghaboloo in Dr. Maxim Berezovski’s lab.)
293T cells were transfected with the gene of interest to produce 293T-PTCH1+ cell line. pLVX-
TRE3G-PTCH1 palsmid was subcloned with the gene of interest by Shahrokh Ghaboloo. Once
subcloning was completed, Lenti-viral transfection of the plasmid in 293T cell line took place
with pLVX-TRE3G-PTCH1 and a regulatory plasmid, containing a regulatory gene pLVX-
Tet3G to allow for further control of expression and induction of the over-expression of the
transfected gene of interest upon addition of doxycycline (Thermo-scientific). The lenti-viral
transfection kit (Lenti-X Tet-On 3G inducible expression System kit) was bought from Clontech
inc. and was used for transfection.
3.2 Flow Cytometry verification of transfection
293T transfected cells (293T-PTCG1+) were grown and maintained in Dulbecco modified eagle
eye media supplemented with 10% fetal bovine serum (Thermo-scientific). Positive and
negative cell lines (PTCH1+ and PTCH1-, respectively) were grown until 80-100% confluent
(cells were counted using Millipore MUSETM Cell analyzer (EMD Millipore)). The positive cell
line was grown in media containing 100ng/ml, 500ng/ml, and 1000ng/ul and 2000ng/ul
doxycycline (Thermo-scientific) to determine the proper concentrations to use for the rest of the
selection. The induction with doxycycline was done at least 72 hours prior to flow cytometry
experiment. Once positive cells were 80-100% confluent (non-induced (no addition of DOX as
well as induced with different concentration of DOX), they were washed on 100mm x 20mm
culture plates with 5ml cation free PBS (with no Magnesium and calcium)(Thermo-scientific),
cells were then scraped off the plates using a cell scraper and collected in 15 ml centrifuge tubes.

11
The cells were centrifuged for 5 minutes at 180xg in Sigma 3-16 Refrigerated centrifuge (ATR,
inc.). Following the centrifugation, the supernatant was aspirated and the cell pellets (for the non
induced positive (PTCH1+), induced positive cells with 100ng/mL, 500ng/mL,1000ng/mL and
2000ng/mL DOX induction) were resuspended in 1mL of cation containing PBS. Cells were
then counted using Millipore MUSETM Cell analyzer (EMD Millipore); each flow cytometry
sample containing 100,000 viable cells. Prepared non induced positive, induced positive cells
with 100ng/mL, 500ng/mL,1000ng/mL and 2000ng/mL DOX were then incubated 5ng/ul anti-
PTCH1 mouse monoclonal antibody (BD Pharmigen) for one hour. Following the incubation,
cells were washed twice with cation containing PBS and then centrifuged at 180xg for 5 min in
Sigma 3-16 Refrigerated centrifuge (ATR,inc.). The pellets were then suspended in cation
containing PBS. The positive non induced cells were used as a control. Binding was analyzed on
Beckman Coulter FC500 Flow cytometr (Beckman Coulter, inc).
3.3 Aptamer Selection (Cell- SELEX) Figure (1) shows a schematic presentation of aptamer protocol.
2.3a Positive selection: (only positive selection was performed for the first 3 rounds)
Initially, PTCH1+ cell line was grown in Dulbecco modifies eagle eye medium (Thermo-
Scientific) supplemented with 10% fetal bovine serum (Thermo-Scientific) and as well as
1000ng/ml concentration of doxycycline (Thermo-Scientific). The negative cells were prepared
the same way starting round four of selection. The induction with doxycycline was done at least
72 hours prior to the start of selection and the cells were maintained and the selection was
performed in 100mm x 20mm cell culture plates. Once the plates for the PTCH1+ cells lines
were 80-100% confluent, the plates were washed two times with PBS containing cations
(Thermo-scientific) and 200nM concentration of aptamer library diluted in PBS containing

12
cations (Thermo-scientific),that was heated 95 oC and then snapped cooled on ice for 5 min was
then added to the cells in the plate. The attached cells were incubated at 37 oC on an
incubating/cooling orbital shaker (VWR symphonyTM) for 1 hour at 200 rpm. Following the
incubation the supernatant was removed and the cells were washed on the plated three times
using a cation containing PBS (Thermo-scientific). The cells were then scrapped off using a cell
scrapper and collected in 1mL total volume of PBS. The cell suspension was heated for 10
minutes at 95oC and then centrifuged for 5 minutes at 13,100xg in a PrismR refrigerated
centrifuge (Biotech Inc., Montreal). The supernatant was collected, containing the aptamers that
were bound to the positive cells. Starting round four, a negative counter selection is added
following the completion of the positive round. After round 4 of positive selection, the time of
incubation of the PTCH1+ cells with aptamers started decreasing to 45 minutes at 37oC at
200rpm on an incubating/cooling orbital shaker (VWR symphonyTM).
2.3b Negative selection
Following the collection of the bound aptamer pool from the PTCH1+ cells, incubation with a
PTCH1- cell line took place. 80-100% confluent was first aspirated from the media and the
supernatant for the positive selection was added directly to the plate (after being heated at 95oC
and the snap cooled on ice for maintaining the aptamer conformation). The cells were incubated
with the aptamer pool on 100mm x 20 mm culture plates for an hour at 37oC on on an
incubating/cooling orbital shaker (VWR symphonyTM) at 200 r.p.m. Following the incubation,
the supernatant was collected and centrifuged in PrismR refrigerated centrifuge (Biotech Inc.,
Montreal) at 1000Xg for 5 minutes. The supernatant was collected and the cell debris was
discarded. The selection was performed for 10 rounds. After each round, a series of steps for

13
purification and PCR amplification was performed to generate the aptamer pool for the following
selection.
3.4 After aptamer pool collection in each round, 2 main methods of purification and PCR
amplification were utilized:
3.4a Method 1 (rounds of selection using N40 aptamers library were amplified and purified using
the following method):
Asymmetric PCR was performed to amplify aptamers after every round of selection in order to
concentrate the PTCH1+ cell binders and to produce ssDNA sequences. The concentration of
displaced aptamers of the pool product after the selection was obtained using the NanoDrop-
2000 UV-Vis spectrophotometer (Thermo-scientific). The PCR protocol consisted of a
denaturing step for 2 minutes at 95 oC followed by 30 cycles of 95 oC for 10s, 56 oC for 20s,
72oC for 10s and then hold at 4oC. 50ng of aptamers were used for every PCR reaction in a
reaction mixture containing 1XGC Buffer with MgCl2 at 1.5nM (Kapa Biosystems), dNTPs at
0.2mM (Kapa Biosystems), forward primer (5’-FAM- CTC CTC TGA CTG TAA CCA CG-3’)
(Integrated DNA Technology) at 1uM and reverse primer (5’- GGC TTC TGG ACT ACC TAT
GC-3’) at 0.04uM (Integrated DNA Technology) and KAPA2G polymerase at 0.04 U/uL (Kapa
Biosystems). The PCR products were run on 3% agarose gel in 1XTAE buffer at 150V to
determine the success of the PCR reaction.
Aptamer purification following PCR
The Aptamers were purified after PCR amplification using 30 kDA VNW cut off filters
(Nanosep, PALL). The LATE PCR products were placed on the cutoff filter with 1:1 ratio of
PBS. The aptamers were then centrifuged in PrismR refrigerated centrifuge (Biotech Inc.,

14
Montreal) at 3800 rcf for 13 min at 16 oC. The same volume of PBS was added to the filter and
centrifugation took place in PrismR refrigerated centrifuge (Biotech Inc., Montreal) at 3800 rcf
for 13 min at 16 oC took place twice. 50uL of PBS was added on top of the filter and incubated
for 10 minutes at room temperature. The purified aptamers were then collected and heated at
95oC to denature any nuclease activity. The purified aptamers were then diluted and used for the
start of the following selection.
3.4b Method 2: (rounds of selection using Harvard aptamers library were amplified and purified
using the following method):
Displaced aptamers of the pool product after each performed negative selection from round (4-
10) or directly after positive selection rounds (1-3) were obtained and concentrated to 50uL using
3K 2 amicon ultra filter (EMD Millipore). The product was run on a 1% agarose gel with red gel
at 150V. The aptamer band was then extracted from the gel using ultrafree-DA DNA extraction
from agarose (EMD Millipore). The concentration of the extracted aptamers was obtained using
the NanoDrop-2000 UV-Vis spectrophotometer (Thermo-scientific). A symmetrical PCR
(polymerase Chain reaction) was then performed using Forward CY5 florescent labelled and
reverse 5’-phosphate group primers. The PCR protocol consisted of a denaturing step for 2
minutes at 95 oC followed by 35 cycles of 95 oC for 5s, 56 oC for 20s annealing step, 72 C for
10s and then hold at 4 oC. 50ng of aptamers were used for every PCR reaction in a reaction
mixture containing 1XGC Buffer with MgCl2 at 1.5nM from 5X concentration stock (Kapa
Biosystems), dNTPs at 5uM (Kapa Biosystems), forward primer (5’-CY5- CTC CTC TGA CTG
TAA CCA CG-3’) (Integrated DNA Technology) at 5uM and reverse primer (5’phosphate
group- GGC TTC TGG ACT ACC TAT GC-3’) at 5uM (Integrated DNA Technology) and
KAPA2G Robust Hot Start DNA polymerase at 0.02 U/uL (KAPA Biosystems). The product

15
was then confirmed on 3% agarose gel in 1X TAE buffer at 150V for 15min. The PCR product
was then digested in order to produce ssDNA product. Digestion was done for 2 hours at 37 oC
with lambda exonuclease 1U/mL (New England Biolabs, Inc). The product was then heated at 80
oC for 10 min to deactivate the exonuclease activity. The product was diluted to 1000uL and
used for the selection of the following round.
2.5 Flow cytometry binding assays
Obtained aptamer pools were incubated for five minutes at 95 oC, and then put directly on ice for
5 minutes. 80-100% confluent negative and positive cell plates were washed twice with cation
free PBS and were incubated with the buffer for 10 minutes. The cells were scrapped off using a
cell scraper and the cell suspension was transferred to 15 mL conical tubes. The cells were
centrifuged in Sigma 3-16 Refrigerated centrifuge (ATR,inc.) at 180xg for 5 minutes. The
supernatant was discarded and the pellets were resuspended in 900uL of cation containing PBS.
The cells were then counted with Millipore MUSETM Cell analyzer (EMD Millipore); Each
sample for flow cytometry contained 100,000 viable cells. The aptamers for each round was
added to each flow cytometry sample (positive and negative cells), to an aptamer concentration
of 200nM. The samples were incubated at room temperature for 1 hour. Following the
incubation, the cells were washed with cation containing PBS, to remove any of the non –
binding aptamers. The original library (Harvard and N40 libraries – depending of the assay was
performed for which type of selection) was incubated was used as a positive control with the
positive cell line. Unstained cells were used as negative control. The aptamer binding assay for
the selections using the N40 library was analyzed on Guava EasyCyte flow cytometr (EMD
Millipore); and the aptamer binding assay for the selections done using Harvard library was
analyzed on Beckman Coulter FC500 Flow cytometr (Beckman Coulter, inc).

16
Figure 1: A schematic Representation of Cell-SELEX method. Target gene is induced into negative cell line to produce a stable positive cell line expressing PTCH1 gene on the cell surface. Selection begins with aptamer library binding to the cell line expressing the target. Unbound aptamers are removed and bound are eluted. The eluted aptamers are incubated with the negative cell line. The selection is repeated for 10-15 rounds. After each round, aptamers are amplified and used for the following selection.
17
4- Results
4.1 Verification of PTCH1 expression on positive cell line using flow cytometery (provided by Shahrokh Ghobadloo)
Verification of expression upon induction of transfected cell lines (293T-PTCH1+) using
different concentrations of doxycycline (DOX) were analyzed using Beckman Coulter FC500
flow cytometr (Beckman Coulter, Inc) as shown in figure 2. Transfected Non-DOX induced cell
line was incubated with anti-PTCH1 monoclonal antibody at 5ng/ul and was used as a control.
Transfected cells were induced with different concentration of doxcycline (100ng/mL,
500ng/mL, 1000ng/mL and 2000ng/mL) and incubated with anti-PTCH1 monoclonal antibody
to verify the expression of PTCH1 receptor on cell surface upon treatment with DOX. A positive
shift of florescence in the flow cytometry histogram indicates the increased expression of the
receptor, and thus an increased of antibody binding to the receptor on the cell surface. When
compared to the non-induced cells (non-DOX treated cells), we can see that the florescence
intensity increases (more antibody binding) as the concentration of DOX increases. Induced
Cells treated with 2000ng/mL of DOX showed the highest florescence intensity upon antibody
treatment, while non induced cells showed the lowest shift in florescence intensity. Cells induced
with 100ng/mL, 500ng/mL and 1000ng/mL showed intermediate shift in florescence intensity
upon antibody treatment. However, generally all concentrations of DOX produced a similar shift
in intensity upon induction.

18
Figure 2. Antibody binding assay and verification of increased expression upon DOX induction (by Shahrokh Ghobadloo). Incubation with 5ng/ul anti-PTCH1 antibody with non-DOX inducted positive cell line (293T-PTCH1+) was used as a control, represented with the red histogram. All samples were incubated for an hour at room temperature with anti-PTCH1 monoclonal antibody. Transfacted cell lines (293T-PTCH1+), were induced for PTCH1 expression using 100ng/mL (light green), 500ng/mL(orange), 1000ng/mL(blue) and 2000ng/mL (dark green) concentrations of DOX.

19
4.2 Affinity assay analysis of generated aptamer selection pools using method 1 asymmetric PCR for the production of ssDNA Aptamers (N40- FAM labelled Aptamer Library):
293T cell line (293T-PTCH1-) and 293T-PTCH1+ cell lines were incubated with the N40-FAM
labelled library (prior to any selection) and were used as controls for the selection process. FAM-
labelled aptamers absorb at a wavelength of 492nm and have a maximum emission at a
wavelength of 517nm and thus they are analyzed through FL1 filter. Figure 3a shows the 293T-
PTCH1- cells lines and 293T-PTCH1+ cell lines analysis following their incubation with N40
aptamer library. Each cell line was incubated with 200nM of the library for 1 hour prior to
analysis via flow cytometr. Unstained positive (293T-PTCH1+) and negative cells (293T-
PTCH1-) were used as a control to determine the baseline for florescence shift upon library
binding to cells. A positive, increased shift in fluorescence in flow cytometry histograms
indicates binding of a fluorescently labelled probe. From figure 3a, it can be seen that there is no
significant shift in fluorescence for the positive (293T-PTCH1+) and negative cells (293T-
PTCH1-) stained with N40 library in comparison to the control (Unstained positive (293T-
PTCH1+) and negative cells (293T-PTCH1-)).
Figure 3b and 3c provide flow cytometry analysis for 10 rounds of aptamer selection for PTCH1
cell surface receptor using Cell-SELEX method. Positive and negative cell lines were used in
this assay. Induction of the positive cells was done prior to performing the assay by 72 hours to
allow for PTCH1 expression. Induction was done using 1000ng/mL DOX concentration. Figure
3b, provides the flow cytometry analysis for binding affinity of pools 1-6, while figure 3c
provides the flow cytometry analysis for binding affinity of pools 7-10. Pools were generated by
asymmetric-PCR method to generate ssDNA aptamers for analysis. For the assay, Each pool of a
200nM concentration was incubated with approximately 100,000 viable cells of positive and
negative cell line, 293T-PTCH1+ and 293T-PTCH1- respectively. They were as well compared

20
to 293T-PTCH1- non-aptamer stained sample, as a negative control. A positive, increased shift
in florescence in flow cytometry histograms indicates binding of a fluorescently labelled probe,
and thus aptamer binding.
Figure 3a. Flow cytometery binding assay for PTCH1+ and PTCH1- with FAM labelled N40 library prior to selection. All samples were incubated at room temperature for an hour (A) represents PTCH1+ cells unstained without the N40 library and PTCH1+ cells stained with 200nM of N40 FAM labelled library (in green). (B) Represents PTCH1- cells unstained without N40 library and PTCH1- cells stained with 200nM of N40 FAM labelled library (in pink). Data were analyzed using FL1 filter of Guava EasyCyte flow cytometr.

21
4.2a analysis of rounds (1-6:)
Figure 3b. Flow cytometery binding assay for PTCH1+ and PTCH1- with FAM labelled N40 pools from round 1 to round 6. All samples were incubated at room temperature for an hour. Non-stained PTCH1- cells were used as a baseline control for all the samples (presented with the black histogram) and presented in all panels (R1 to R6). All panels (R1 to R6) contain 293T-PTCH1+ cells and 293T-PTCH1- cells presented with the blue and pink histograms, respectively. All samples (R1 to R6) were incubated with their respective pool (pool 1-6) of 200nM concentration for an hour and then was analyzed using using FL1 filter of Guava EasyCyte flow cytometr.

22
4.2b analysis of rounds (7-10:)
Figure 3C. Flow cytometery binding assay for PTCH1+ and PTCH1- with FAM labelled N40 pools from round 7 to round 10. All samples were incubated at room temperature for an hour. Non-stained PTCH1- cells were used as a baseline control for all the samples (presented with the black histogram) and presented in all panels (R7 to R10). All panels (R7 to R10) contain 293T-PTCH1+ cells and 293T-PTCH1- cells presented with the blue and pink histograms, respectively. All samples (R1 to R6) were incubated with their respective pool (pool 1-6) of 200nM concentration for an hour and then was analyzed using using FL1 filter of Guava EasyCyte flow cytometr for aptamer binding.

23
4.3 Median Fluorescence intensity (Method1)
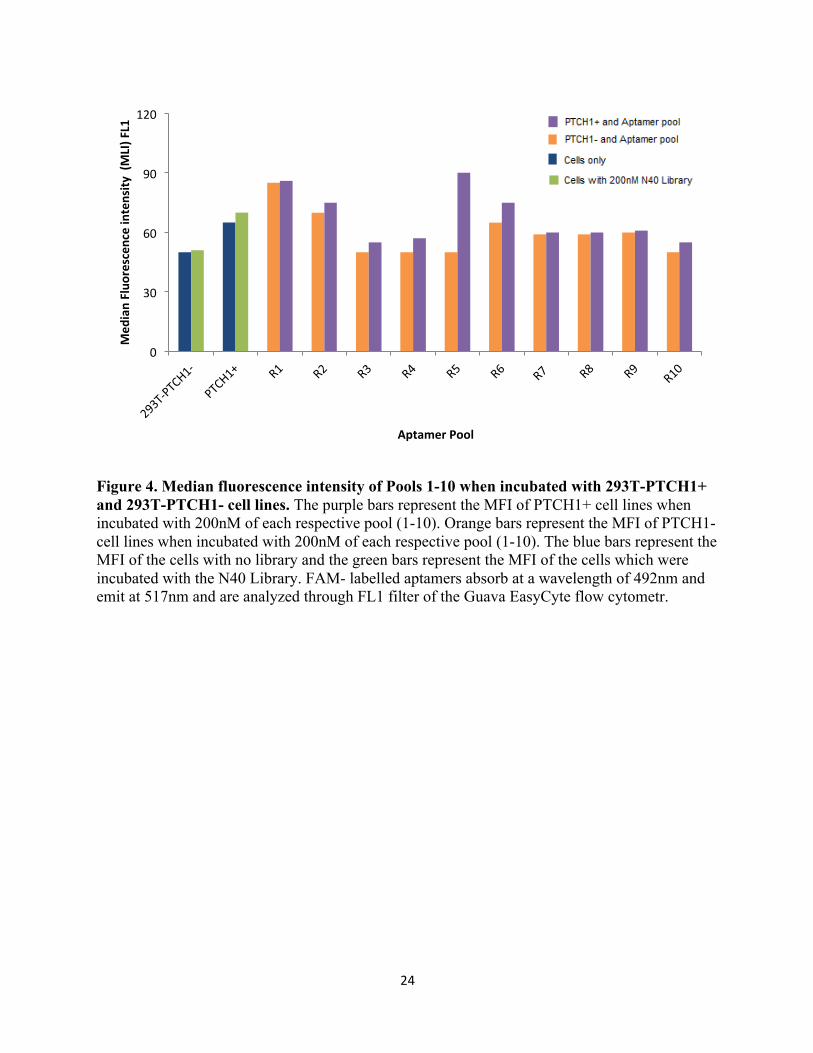
Figure 4 represents the median fluorescence intensity (MFI) of the aptamers with 293T-PTCH1-
and 293T-PTCH1+ cells through the FL1 channel. MFI is a value that represents 50% of the
events, and it generally indicates of the central tendency of the recorded cell population. An
increase in MFI value indicates an increase in fluorescence, and thus an increase in the binding
affinity of the aptamer pool to the tested cell population. From figure 4, it can be found that all of
the pools, except for pool 5, do not show selective binding for the positive cells in comparison to
the negative cell line. Pool 5, however, shows selective binding to the positive cell line (293T-
PTCH1+) in comparison to the negative cell line (293T-PTCH1-). An increase in the MFI of
Positive cell line is as well observed when compared to the original library N40 (with 293T-
PTCH1+ and 293T-PTCH1-). FAM- labelled aptamers absorb at a wavelength of 492nm and
have a maximum emission at a wavelength of 517nm and thus they are analyzed through FL1
filter.
24
Figure 4. Median fluorescence intensity of Pools 1-10 when incubated with 293T-PTCH1+ and 293T-PTCH1- cell lines. The purple bars represent the MFI of PTCH1+ cell lines when incubated with 200nM of each respective pool (1-10). Orange bars represent the MFI of PTCH1- cell lines when incubated with 200nM of each respective pool (1-10). The blue bars represent the MFI of the cells with no library and the green bars represent the MFI of the cells which were incubated with the N40 Library. FAM- labelled aptamers absorb at a wavelength of 492nm and emit at 517nm and are analyzed through FL1 filter of the Guava EasyCyte flow cytometr.
0
30
60
90
120 Med
ian Fluo
rescen
ce intensity
(MLI) FL1
Aptamer Pool
25
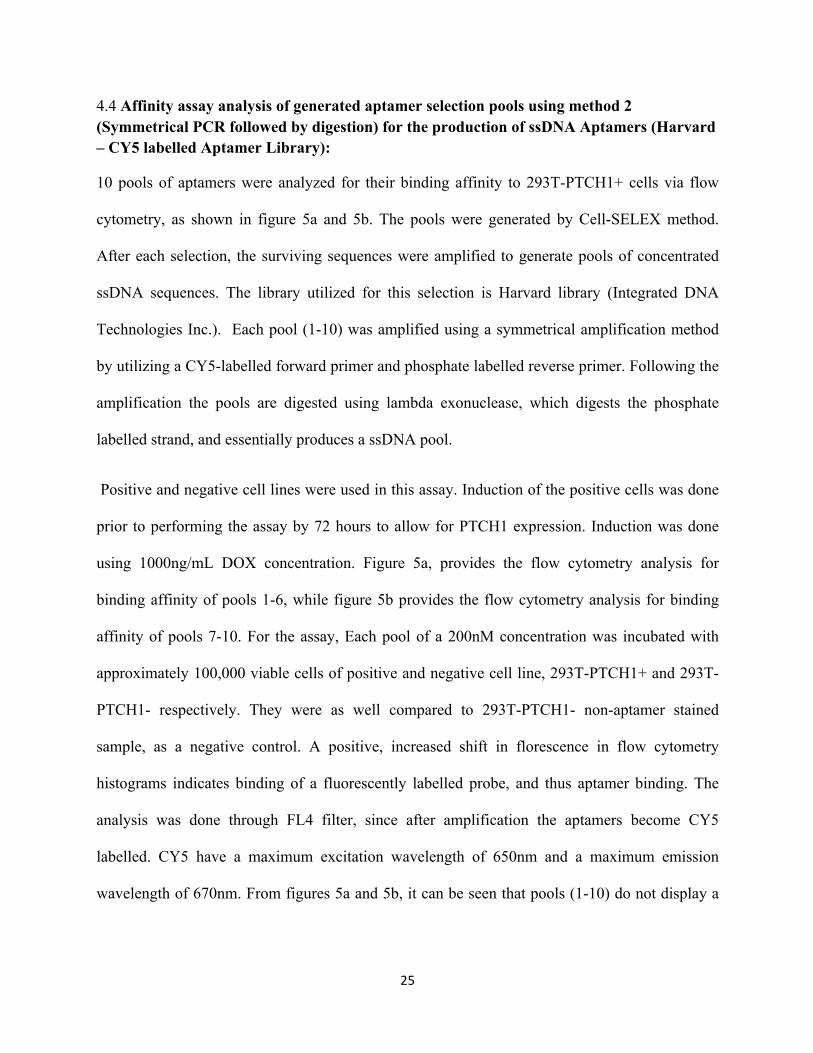
4.4 Affinity assay analysis of generated aptamer selection pools using method 2 (Symmetrical PCR followed by digestion) for the production of ssDNA Aptamers (Harvard – CY5 labelled Aptamer Library):
10 pools of aptamers were analyzed for their binding affinity to 293T-PTCH1+ cells via flow
cytometry, as shown in figure 5a and 5b. The pools were generated by Cell-SELEX method.
After each selection, the surviving sequences were amplified to generate pools of concentrated
ssDNA sequences. The library utilized for this selection is Harvard library (Integrated DNA
Technologies Inc.). Each pool (1-10) was amplified using a symmetrical amplification method
by utilizing a CY5-labelled forward primer and phosphate labelled reverse primer. Following the
amplification the pools are digested using lambda exonuclease, which digests the phosphate
labelled strand, and essentially produces a ssDNA pool.
Positive and negative cell lines were used in this assay. Induction of the positive cells was done
prior to performing the assay by 72 hours to allow for PTCH1 expression. Induction was done
using 1000ng/mL DOX concentration. Figure 5a, provides the flow cytometry analysis for
binding affinity of pools 1-6, while figure 5b provides the flow cytometry analysis for binding
affinity of pools 7-10. For the assay, Each pool of a 200nM concentration was incubated with
approximately 100,000 viable cells of positive and negative cell line, 293T-PTCH1+ and 293T-
PTCH1- respectively. They were as well compared to 293T-PTCH1- non-aptamer stained
sample, as a negative control. A positive, increased shift in florescence in flow cytometry
histograms indicates binding of a fluorescently labelled probe, and thus aptamer binding. The
analysis was done through FL4 filter, since after amplification the aptamers become CY5
labelled. CY5 have a maximum excitation wavelength of 650nm and a maximum emission
wavelength of 670nm. From figures 5a and 5b, it can be seen that pools (1-10) do not display a

26
significant increase in florescence in any of the aptamer pools compared to the original Harvard
library.
4.4a analysis of rounds (1-6:)
Figure 5a. Flow cytometry binding assay for PTCH1+ with CY5 labelled Harvard pools from round 1 to round 6. All samples were incubated at room temperature for an hour. Non-stained PTCH1- cells were used as a baseline control for all the samples (presented with the green histogram) and presented in all panels (R1 to R6). All panels (R1 to R6) contain 293T-PTCH1+ cells and 293T-PTCH1- cells presented with the purple and white histograms, respectively. All samples (R1 to R6) were incubated with their respective pool (pool 1-6) of 200nM concentration for an hour at room temperature and then were analyzed using FL4 filter of Beckman Coulter FC500 Flow cytometr.

27
4.4b analysis of rounds (7-10)
Figure 5b. Flow cytometery binding assay for PTCH1+ with CY5 labelled Harvard pools from round 1 to round 6. All samples were incubated at room temperature for an hour. Non-stained PTCH1- cells were used as a baseline control for all the samples (presented with the green histogram) and presented in all panels (R1 to R6). All panels (R1 to R6) contain 293T-PTCH1+ cells and 293T-PTCH1- cells presented with the purple and white histograms, respectively. All samples (R1 to R6) were incubated with their respective pool (pool 1-6) of 200nM concentration for an hour at room temperature and then were analyzed using FL4 filter of Beckman Coulter FC500 Flow cytometr.

28
4.4 Median fluorescence intensity (Method 2)
Figure 6 represents the median fluorescence intensity (MFI) of the aptamers with 293T-PTCH1-
and 293T-PTCH1+ cells. Fluorescence shift was recorded through the FL4 channel of the flow
cytometr. MFI is a value that represents 50% of the events, and is used as an indicator of the
central tendency of the recorded cell population. An increase in MFI value indicates an increase
in fluorescence, and thus an increase in the binding affinity of the aptamer pool to the tested cell
population. From figure 6, there is no significant increase in the median fluorescence intensity of
any of the aptamer pools compared to the MFI of the original CY5-labelled library. However,
Pool 6, displays a slight selective binding to the positive cell line (293T-PTCH1+) in comparison
to the negative cell line (293T-PTCH1-). CY5- labelled aptamers absorb at a wavelength of 650
nm and have a maximum emission at a wavelength of 670 nm and thus they are analyzed
through FL4 filter. Figure 7, provides the gel electrophoresis picture after symmetric PCR
amplification of each pool after each round of selection (1-7). The PCR product of each round
was confirmed on 3% agarose gel in 1X TAE buffer at 150V for 15min.

29
Figure 6. Median fluorescence intensity of Pools 1-10 when incubated with 293T-PTCH1+ and 293T-PTCH1- cell lines. The purple bars represent the MFI of PTCH1+ cell lines when incubated with 200nM of each respective pool (1-10). Orange bars represent the MFI of PTCH1- cell lines when incubated with 200nM of each respective pool (1-10). The blue bars represent the MFI of the cells with no library and the green bars represent the MFI of the cells which were incubated with Harvard CY5- labelled Library. CY5- labelled aptamers absorb at a wavelength of 650nm and emit at 670nm and are analyzed through FL4 filter of the Beckman Coulter FC500 Flow cytometr.
0
7
14
PTCH1-‐ 293T
PTCH1+ 293T
Pool 1 Pool 2 Pool 3 Pool 4 Pool 5 Pool 6 Pool 7 Pool 8 Pool 9 Pool 10
Med
ian Fluo
rescen
t Inten
sity (FL4)
Aptamer Pools

30
Figure 7. Agarose get electrophoresis analysis of aptamers after each round of selection from pools 1-7. The products were amplifies using symmetrical amplification and they were ran on a 3% agrose gel in TAE buffer at 150V for 15 minutes. Amplified original Harvard library was used as a positive control and a negative control without DNA template was used.

31
5-Discussion:
Hedgehog pathway is an important signalling pathway which affects cell growth, patterning and
differentiation during embryonic development (Ingham PW and McMahon AP, 2001). While
this pathway is inactivated in adult tissue, its uncontrolled activation leads to a wide range of
malignancies (Ingham PW and McMahon AP, 2001). Thus, the pathway plays an important role
in regulating cancer development and maintenance in affected tissues. Targeting specific
components of the hedgehog pathway holds potential for dissecting the molecular mechanisms of
the pathways function, but also provides a potential tool for diagnosis and therapeutics of cancer.
In this research, we have employed a Cell-SELEX, procedure to target the transmembrane
component of the hedgehog pathway, PTCH1 (Transmembrane component of the hedgehog
pathway) with two single stranded aptamer libraries (N40 and Harvard library). Cell- SELEX
displays advantageous properties over conventional SELEX method for the identification of
aptamers due to the ability to select aptamers for live cells (Homann and Goringer, 2014). For
example, Shangguan et al. used human precursor T-cell acute lymphoblastic leukemia cells
(CCRF-CEM) and the human B-cell line from Burkitt's lymphoma (Ramos) for positive and
negative selection steps, respectively, in order to generate a series of aptamers to study cancer
development (Shangguan et al, 2006). Aptamers are a class of oligonucleotides that are viewed
as an appealing alternative to antibodies due to their possible characteristics which allow then to
provide diagnostic and therapeutic potentials (Fang et al., 2003). Aptamers are also able to act as
biosensors and separation devices. All of these applications are based on the aptamers ability to
fold into a three-dimensional structure and binds to target molecules (Sullenger et al. 2002).
Aptamers have been found to bind to their targets with dissociation constants in the low
picomolar (1x10-12 mol/L) to low nanomolar (1x10⁻⁹ mol/L) range. Thus, allowing for specific

32
interactions which results in the differentiation between proteins with similar characteristics
(Rusconi et al. 2000). These aptamers can as well be fluorescently labelled with various probes
(such as FITC), and thus becoming a potential probe for identification of cancer subtypes and
tumours (Zhou J et al. 2010) (Zhang Y et al. 2010). As previously mentioned, in this study, Cell-
SELEX was used to produce aptamers for the target of interest, PTCH1 (Shangguan et al., 2006).
The cell lines used for this procedure were 293T-PTCH1- for the negative selection and 293T-
PTCH1+ for the positive selection. 293T-PTCH1+ was generated by transfecting the 293T
cancer cell line with the human gene PTCH1 to generate a cell line that over-expresses the
receptor on the surface of the cell. Natural selection is induced by sequentially alternating
between the two cell lines. With one cell line (293T-PTCH1+), strong binding aptamers will
bind, while weak binders will be washed off. Once added to the other cell line (293T-PTCH1-),
the binders will be discarded and the weak binders will be collected. With performing multiple
rounds of selection, and decreasing the amount of non-binders in the evolving pools of selection,
we create pools will higher binding affinity to the target compared to the original library and
thus, further allowing for stronger binders to be selected.
The first step of the project was to determine the success of the transfection of the gene of
interest in the 293T cell line to produce 293T-PTCH1+ cell line. The cells were co-transfacted
with a regulator vector and a response vector containing the gene of interest. The expression of
the protein of interest was essentially regulated by the addition of doxycycline to the growth
media, and thus inducing the expression the cell’s surface. Flow cytometry was utilized as a
mean to monitor the expression of the receptor on the target cells by collecting fluorescence data.
Anti-PTCH1 antibody was incubated with transfected 293T-PTCH1+ induced with 100ng/mL,
500ng/mL, 1000ng/mL and 2000ng/mL concentrations of doxycycline. The cells were then

33
analyzed using flow cytometry for the levels of expression by correlating it with the levels of
fluorescence intensity. From figure 2, it can be seen that the cells induced with 2000ng/mL
doxcycline have shown the greatest shift in intensity when compared to the cells non-induced
cells. Cells induced with 500ng/mL and 1000ng/mL display similar expression pattern based on
the displayed fluorescence intensity. A positive fluorescence shift upon induction suggests the
success of transfection and thus the production of a cancer cell line that over expresses the target
receptor.
Once verification of expression was analyzed using flow cytometry, it was possible to start
selection for the PTCH1 receptor. Cell-SELEX was employed as the main method for selection
for this research. In the case of transmembrane receptor, Cell- SELEX allows for aptamer
selection towards the target in its natural glycosylation state and its natural physiological
environment and thus enabling the de novo generation of cell-specific molecular probes (Hicke
BJ et. al 2001). For method 1, FAM-labelled N40 library was utilized, where 10 rounds of
selections were performed. The selection was performed without detailed knowledge about the
complexity of the cell surface molecules displayed on the cells; except that there is an over
expression of the target receptor due to the induced lenti-viral transfection. However, the
abundance of the target protein (PTCH1) should provide sufficient selective pressure to favour
the wanted aptamers (Hicke BJ et. al 2001).
Method 1: Asymmetric PCR amplification of each pool
After each round of selection, the pools were amplified. For the first 10 rounds of selection
attempted, we have employed asymmetric amplification method. Asymmertric-PCR is an
asymmetrical polymerase chain reaction which allows the production of ssDNA target by

34
unequal primer concentrations (Aquiles Sanchez et al, 2003). This method depends on the
depletion of one of the primers during the exponential phase of the PCR; the result is a linear
synthesis of the strand due to extension from the excess primer. This method, used to evolve the
aptamer pool following each round of selection, has presented several problems in amplification
and identification of the amplicon on gel electrophoresis after PCR amplification. This can be
attributed to the efficiency of the process. It has been reported that asymmetric PCR exhibit
60%-70% efficiency in comparison to symmetric PCR which exhibits 90% or more efficiency
(Sanchez et al, 2003). Thus, after each selection, it was essential to perform the PCR several
minor modification in the primer ratio as well as the number of amplification cycles in order to
produce reasonable amount of product to allow for the possibility to proceed to the following
selection (such as modifying the annealing temperature and increasing the concentration of the
template to 50ng/ul in the PCR reaction mixture). After 10 rounds of selection, Flow cytometry
was used as an analysis tool of choice since it count cells while collecting fluorescence data.
Since the aptamers used were FAM-labelled, which is a green fluorophore, it was possible to
compare the binding of each pool to the positive (293T-PTCH1+) cell line and the negative
(293T-PTCH1-) cell line on same spectrum with a maximum emission wavelength of 525(+/-)
25nm. Since the shifts were observed using a histogram-based analysis, which were proportional
to the amount of binding aptamers to each tested sample. Each evolved pool (1-10) was
incubated with the negative cell line, positive cell line. The native library, incubated with both
cell lines, was used as a control to normalize the fluorescence values. From figure 4 and 5, it can
be seen that pool 5 incubated with the positive cell line displays the highest median intensity in
fluorescence (MFI). Thus, displaying an increased binding affinity to the (293T-PTCH1+) cell
line as well as a decreased binding affinity towards the (293T-PTCH1-) cell line. Following pool
35
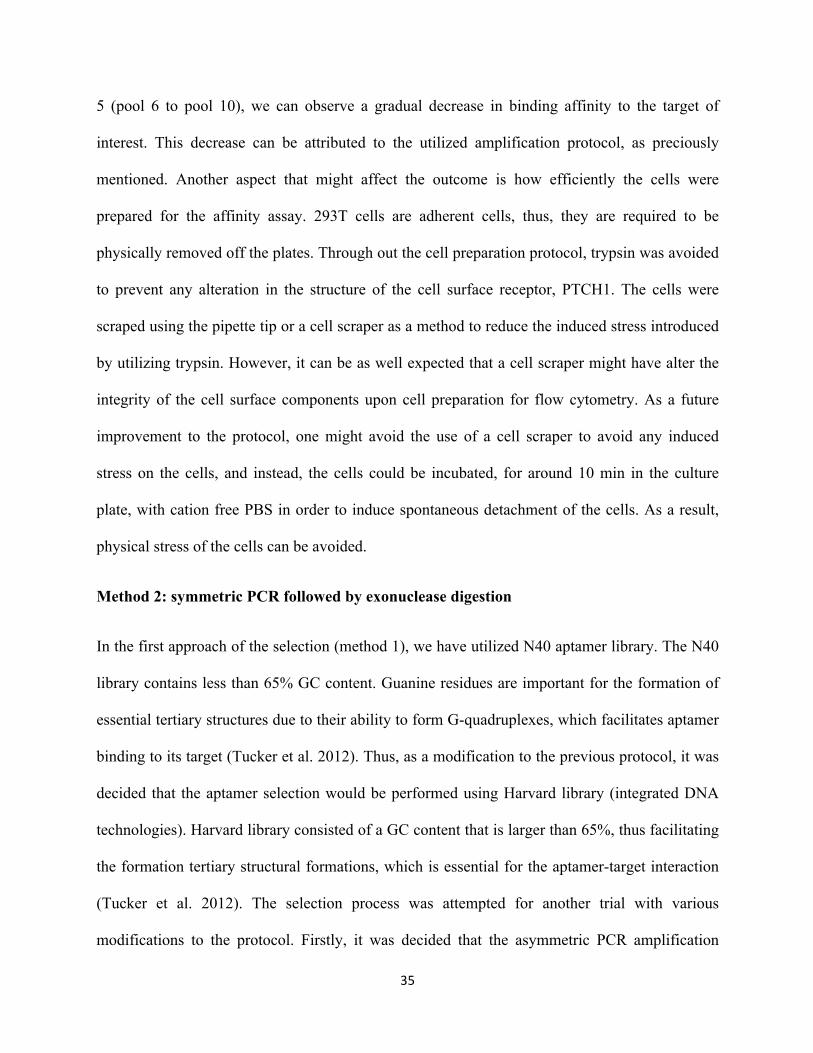
5 (pool 6 to pool 10), we can observe a gradual decrease in binding affinity to the target of
interest. This decrease can be attributed to the utilized amplification protocol, as preciously
mentioned. Another aspect that might affect the outcome is how efficiently the cells were
prepared for the affinity assay. 293T cells are adherent cells, thus, they are required to be
physically removed off the plates. Through out the cell preparation protocol, trypsin was avoided
to prevent any alteration in the structure of the cell surface receptor, PTCH1. The cells were
scraped using the pipette tip or a cell scraper as a method to reduce the induced stress introduced
by utilizing trypsin. However, it can be as well expected that a cell scraper might have alter the
integrity of the cell surface components upon cell preparation for flow cytometry. As a future
improvement to the protocol, one might avoid the use of a cell scraper to avoid any induced
stress on the cells, and instead, the cells could be incubated, for around 10 min in the culture
plate, with cation free PBS in order to induce spontaneous detachment of the cells. As a result,
physical stress of the cells can be avoided.
Method 2: symmetric PCR followed by exonuclease digestion
In the first approach of the selection (method 1), we have utilized N40 aptamer library. The N40
library contains less than 65% GC content. Guanine residues are important for the formation of
essential tertiary structures due to their ability to form G-quadruplexes, which facilitates aptamer
binding to its target (Tucker et al. 2012). Thus, as a modification to the previous protocol, it was
decided that the aptamer selection would be performed using Harvard library (integrated DNA
technologies). Harvard library consisted of a GC content that is larger than 65%, thus facilitating
the formation tertiary structural formations, which is essential for the aptamer-target interaction
(Tucker et al. 2012). The selection process was attempted for another trial with various
modifications to the protocol. Firstly, it was decided that the asymmetric PCR amplification

36
protocol was not efficient. Since the purity and yield of ssDNA can affect the success of each
application, thus it was decided that the pools after each round would be amplified with a
symmetric PCR protocol, since symmetric PCR exhibits 90% or more efficiency in amplification
(Sanchez et al, 2003). The symmetrical PCR was performed using Forward CY5 florescent
labelled primer and reverse 5’-phosphate group primers. Lambda exonuclease enzyme contains
an increased exoribonuclease activity in the 5’->3’ direction, which efficiently digests the
5’phosphorylated DNA strand (Avci-Adali et. al, 2009). Thus, for our protocol, ssDNA enriched
pools were generated using symmetrical PCR followed by Lambda exonuclease digestion. Cell-
SELEX was utilized as a method for selection, and the selection was done on cell culture plates.
Each of the pools was initially incubated with the positive cell line for an hour, and then the
binding aptamers were retained and incubated with the negative cell line for the counter
selection. The non-binders were collected and amplified using the method described above, in
order to generate the ssDNA enriched pool for the following selection round. Aptamer affinity
analyses were performed using flow cytometry, following the generation of 10 rounds of aptamer
selection. Affinity analysis are essential in order to determine which pool exhibits the highest
binding affinity to the target before cloning the pool and sending it for sequencing. The use of a
CY5 labelled forward primer during the amplification process allowed for the generation of CY5
labelled aptamers following every round of amplification. CY5-labelled aptamers allowed for
easy detection of aptamer-cell binding. FL4 channel was utilized to examine the binding
efficiency of each aptamer pool to the positive cell line in comparison to the negative cell line,
since; CY5 has an emission wavelength peak of 670 nm. Figures 5a and 5b, provides the binding
affinity of each pool (1-10) after the selections were completed. 200nM of each pool was tested
with the positive and negative cells. 200nM of the library was as well used in order to normalize

37
the fluorescence intensity. The flow cytometry histograms do not provide a significant shift in
intensity (or a positive shift in intensity) upon incubation with the positive cell line in
comparison to the negative cell line (for all rounds of selection). From figure 6, it can be seen
that pool 6 shows a slightly higher binding affinity for the positive cell line in comparison to the
negative counterpart. However, the shift is not to a high degree. Since the outcome of the affinity
assay did not provide a potential pool which displays a high degree of selectivity to the target, it
is suggested that more rounds of selection would be performed in order to select and to saturate
more target-sensitive aptamer sequences which may display a higher degree of specificity. For
the Aptamer selection method performed, only 10 rounds of selection were done; increasing the
numbers of rounds might provide a pool with the expected outcome. According to literature,
most selections requires approximately around 20 pools/ rounds of aptamer selection in order to
achieve excellent enrichment of the binding aptamers (Shangguan et al., 2006). Based on the
data, it is obvious that the selection protocol must be improved in order to achieve the desired
results; obtain sequences that selectively bind to the positive cell line (293T-PTCH1+) (thus
PTCH1) and does not bind to negative cell line(293T-PTCH1-). Cell-SELEX Method provides
several advantages for aptamer selections over strategies when selecting for transmembrane
proteins such as the capability of recognizing the target protein in its natural glycosylation state
and presented in its physiological environment. However, there are some disadvantages
associated with the process as well. An important disadvantage of this strategy is the lack of
knowledge of the identity and abundance of the effective targets on the positive cell line and the
possibility that unwanted aptamers may dominate the selection and therefore preventing any
specific binding in the process (such as the results in figure 6) and preventing the emergence of
the molecules of interest (Hicke BJ et al., 2001). However, the abundance of the target protein

38
and an appropriate selection design might provide adequate specific pressure to concentrate the
binding aptamers (Hicke BJ et al., 2001). Another major obstacle in the process the separation of
2 DNA strands to yield one of the 2 strands as single-stranded DNA aptamer. A modification of
the protocol for ssDNA production may be required to eliminate any sources of errors associated
with this step in the protocol. As a possible modification, ssDNA enriched pool (using
symmetrical PCR) could be produced by labelling the complementary strand of DNA with
biotin, following that we can separate the DNA strand using streptavidin-coated magnetic beads.
The magnetic beads will prevent the mobilization of the dsDNA and the non biotin labelled
strand will be eluted and collected, while the labelled one will be trapped in the column (Paul A.
et al., 2001). This method might be a more accurate method since it might ensure that only
ssDNA are present in the eluted product, thus preventing dsDNA from interfering with the
binding assay results.
As for future work, we will sequence pool 5 (Method 1: asymmetric PCR for ssDNA production)
which displays a greater degree of affinity to the positive target cell line (293T-PTCH1+) in
comparison to the negative cell line (293T-PTCH1-). Following sequencing, the obtained
aptamer sequences from the pool will be tested individually for binding to the target cell line
using flow cytometry. In order to test whether the target of the aptamers are in fact membrane
protein, PTCH1, 293T-PTCH1+ cells will be treated with a protease for a short period of time
before the treatment with the obtained aptamers and check using flow cytometry if the aptamers
have lost their binding capacity (Shangguan et al. ,2006). If the binding capacity is lost, it could
be deduced that the binding aptamers are removed by the protease, and thus concluding the target
is a membrane protein. Since PTCH1 is a dominant membrane protein in 293T-PTCH1+ cells it
could be deduced that the target is in fact PTCH1. Other cell lines which display endogenous

39
expression of PTCH1 could be used to determine the affinity of each sequence to the cell line.
According to Nakamura et al., suppression of the hedgehog pathway by utilizing anti-PTCH1
antibody suppresses the hedgehog pathway activity and thus the proliferation of pancreatic
cancer cells. Therefore, we can utilize pancreatic cancer cell lines to determine the binding
affinity of the obtained aptamers to the cell line. The aptamers could as well be added to the
growth media of the cells and after a specific amount of time, we could perform cell count assay
using flow cytometry to determine if the cell number have decreased in comparison to a control
sample (cells without aptamers). For method 2, we will continue the selection till round 15-20
and repeat the binding assay to verify if there is acquired binding. We will as well start the
selection with the modified protocol for ssDNA production (Strepdavidin-coated beads) (Paul A.
et al., 2001) and check using flow cytometry if the affinity has been affected. Masking DNA or
BSA will be used as well during preparation of the samples for flow cytometry in order to
eliminate high amounts of unspecific binding during performing the assay.
6- Conclusion:
The use of aptamers is increasing as they offer high selectivity and affinity to their targets.
Aptamers are promising diagnostic tools in human therapy for widespread diseases such as
cancer and neurodegeneration. Aptamers encompass a wide range of advantages that make them
an attractive probe for studying several cell surface markers that are associated with several
pathways involved in differentiation, apoptosis, development and cell proliferation. These
advantages include small size, high affinity and specificity and rapid tissue penetration for drug
delivery. In this study, we target PTCH1 receptor, an integral component of the Hedgehog
Pathway. Cell-SELEX protocol is utilized in this study in order to identify aptamer sequences
that specifically target PTCH1 receptor. However, several modifications to the protocol are

40
suggested in order to optimize the selection process. Suggestion for improved selection to the
receptor includes increasing the concentration of the aptamers during the affinity assays.
Optimizing the amplification protocol for the production of ssDNA enriched pools and increases
the number of rounds of selection to 20 rounds. We have as well identified pool 5 (using method
1 for ssDNA production: asymmetric PCR.) which display selective affinity to the positive cell
line 293T-PTCH1+. The pool will be sent for sequences and the aptamers obtained will be tested
individually for their affinity to the positive cell line. In conclusion, identifying aptamers that
bind to PTCH1 in Hh signalling pathway may alter the integrity of the receptor and allow us to
exploit it in various means such as utilizing aptamers as a vehicle for drug delivery, diagnosis
probe or a method for cancer inhibition. PTCH1 aptamers may highlight the significance of the
Hh pathway and provide a possible molecular target for cancer treatment (depending on the
function of the identified aptamer). Further research for the identification of aptamer molecules
that might inhibit the function of target peptides may shed new light on anti-cancer treatment and
Hedgehog related carcinomas.

41
7- References
Avci-Adali M., Paul A., Wilhelm N., Ziemer G., Wendel HP., (2009) Upgrading SELEX technology by using lambda exonuclease digestion for single-stranded DNA generation. Molecules, 15(1),1-11.
Angela Paul, Meltem Avci-Adali, GerhardZiemer, and Hans P.Wendel. Oligonucleotides. September 2009, 19(3): 243-254.
Bailey JM, Singh PK, Hollingsworth MA (2007). Cancer metastasis facilitated by developmental pathways: sonic hedgehog, Notch, and bone morphogenic proteins. J Cell Biochem.102, 829–39.
Bar EE, Chaudhry A, Lin A, et al (2007). Cyclopamine-mediated Hedgehog pathway inhibition depletes stem-like cancer cells in glioblastoma. Stem Cells. 25, 2524.
Berman DM, Karhadkar SS, Hallahan AR, et al (2002). Medulloblastoma growth inhibition by Hedgehogpathway blockade. Science. 297, 1559–61.
Brody,E.N. and Gold, L. (2000) Aptamers as therapeutic and diagnostic agents. J. Biotechnol. 74, 5–13.
Chen, R., Pan, S., Yi, E. C., Donohoe, S., Bronner, M. P., Potter, J. D., Goodlett, D. R., Aebersold, R., and Brentnall, T. A. (2006). Quantitative proteomic profiling of pancreatic cancer juice. Proteomics. 6, 3871–3879.
Ehtesham M, Sarangi A, Valadez JG et al.(2007). Ligand-dependent activation of the hedgehog pathway in glioma progenitor cells.Oncogene. 26, 5752–5761. Ellington AD, Szostak JW (1990) In vitro selection of RNA molecules that bind specific ligands. Nature 346, 818–822.

42
Fang, X., Sen, A., Vicens, M., Tan, W. (2003). Synthetic DNA aptamers to detect protein molecular variants in a high-throughput fluorescence quenching assay. Chembiochem. 4, 829-834.
Gailani, M.R. et al (1996). The role of the human homologue of Drosophila patched in sporadic basal cell carcinomas. Nat. Genet. 14, 78–81.
Hartwell LH, Kastan MB (1994): Cell cycle control and cancer. Science 266,1821-1828.
Hettmer S, et al. (2014). Myogenic Tumors in Nevoid Basal Cell Carcinoma Syndrome. J Pediatr Hematol Oncol.
Hicke BJ, Marion C, Chang YF, Gould T, Lynott CK, et al. (2001) Tenascin-C aptamers are generated using tumor cells and purified protein. J Biol Chem. 276, 48644–48654.
Homann M. Goringer HU(1999). Combinatorial selection of high affinity RNA ligands to live African trypanosomes. Nucleic Acids Res. 27,2006–2014.
Ingham PW, McMahon AP (2001). Hedgehog signaling in animal development: paradigms and principles. Genes Dev. 15(23),3059–87. Keefe, A. D., Pai, S., & Ellington, A. (2010). Aptamers as therapeutics. Nature Reviews.Drug Discovery, 9(7), 537-550.
Li C., et al (2007). Identification of pancreatic cancer stem cells. Cancer Res. 67, 1030–1037
Murone M, Rosenthal A, de Sauvage FJ. (1999). Sonic hedgehog signaling by the patched-smoothened receptor complex. Curr Biol. 92, 76–84.
Nakamura M, Kubo M, Yanai K, Mikami Y, Ikebe M, Nagai S, Yamaguchi K, Tanaka M and Katano M (2007). Anti-patched-1 antibodies suppress hedgehog signaling pathway and pancreatic cancer proliferation. Anticancer Res. 27, 3743-3747.

43
Ng,E.W.M., Shima,D.T., Calias,P., Cunningham,E.T., Guyer,D.R. and Adamis,A.P. (2006) Pegaptanib, a targeted anti-VEGF aptamer for ocular vascular disease. Nat. Rev. Drug Discov. 5,123–132.
Nüsslein-Volhard, C. & Wieschaus, E (1980). Mutations affecting segment number and polarity in Drosophila. Nature. 287, 795–801.
Onishi H. and Katano M. (2011). Hedgehog signaling pathway as atherapeutic target in various types of cancer. Cancer Science,vol. 102(10), 1756–1760.
Reya T, Morrison S.J., Clarke M.F., Weissman I.L. (2001). Stem cells, cancer, and cancer stem cells. Nature. 414,105–111.
Rubin LL, de Sauvage FJ. (2006). Targeting the Hedgehog pathway in cancer. Nat Rev Drug Discov. 5(12),1026–33.
Rusconi, C. P., & Scardino, E. (2002). RNA aptamers as reversible antagonists of coagualtion facor IXa. Nature. 419, 90-94.
Sanchez JA, Pierce KE, Rice JE, Wangh LJ. (2004). Linear-after-the-exponential (LATE)-PCR: an advanced method of asymmetric PCR and its uses in quantitative real-time analysis. Proc Nat Acad Sci USA. 101,1933-1938.
Scales, S.J. & de Sauvage, F.J (2009). Mechanisms of Hedgehog pathway activation in cancer and implications for therapy. Trends Pharmacol. Sci. 30, 303–312.
Sefah, K., Phillips, J. A., et al. (2009). Nucleic acid aptamers for biosensors and bio-analytical applications. The Analyst. 134(9), 1765-1775.
Shangguan D. Li Y. Tang Z, et al (2006). Aptamers evolved from live cells as effective molecular probes for cancer study. Proc Natl Acad Sci USA. 103,11838–11843.
Song, K.M.; Lee, S.; Ban, C (2012). Aptamers and their biological applications. Sensors. 12, 612–631.
Sullenger, B. A., & Gilboa, E. (2002). Emerging clinical applications of RNA. Nature. 418(6894), 252-258.

44
Tuerk C, Gold L (1990).Systematic evolution of ligands by exponential enrichment: RNA ligands to bacteriophage T4 DNA polymerase. Science. 249, 505–510.
Tucker WO, Shum KT, Tanner JA.(2012). G-quadruplex DNA aptamers and their ligands: structure, function and application. Curr. Pharm. Des. 18, 2014-2026.
Varjosalo,M. & Taipale,J.(2008). Hedgehog: functions and mechanisms. Genes Dev. 22, 2454–2472.
Van den Brink, G.R (2007). Hedgehog signaling in development and homeostasis of the gastrointestinal tract. Physiol. Rev. 87, 1343–1375.
Veronese FM, Mero A. (2008). The impact of PEGylation on biological therapies. BioDrugs. 22, 315–329.
Watkins, D. N. et al. (2003). Hedgehog signalling within airway epithelial progenitors and in small-cell lung cancer. Nature. 422, 313–317.
You S, Zhou J, Chen S (2010). PTCH1, a receptor of Hedgehog signalling pathway, is correlated with metastatic potential of colorectal cancer. UpsJ Med Sci. 115(3), 169-75.
Zhao C, Chen A, et al (2009). Hedgehog signalling is essential for maintenance of cancer stemcells in myeloid leukaemia. Nature. 458, 776–9.
Zhou, J., Battig, M. R., & Wang, Y. (2010). Aptamer-based molecular recognition for biosensor development. Analytical and Bioanalytical Chemistry. 398, 2471-2480.
Zhang Y. Chen Y. Han D, et al (2010). Aptamers selected 1 by cell-SELEX for application in cancer studies. Bioanalysis. 2, 907–918.
Zurawel R. H., Allen C., Wechsler-Reya R., Scott M. P., Raffel C. (2000). Evidence that haploinsufficiency of ptch leads to medulloblastoma in mice. Genes Chromosomes Cancer. 28, 77-81.