aquifer mapping and management : an approach in indian ... · inputs for implementing artificial...
TRANSCRIPT

Add your company logo here on master slide
Add your company logo and other footers here on master slide
Aquifer Mapping and Management :
An Approach in Indian Perspective
Dr. R. C. Jain Formerly Chairman, Central Ground Water Board and Central Ground Water Authority

Add your company logo here on master slide
Ground water -the backbone of India’s agriculture and drinking water security - under tremendous stress
India - The largest consumer of groundwater in the world - estimated usage 245 bcm per year
GW meets nearly 60 per cent of the demand for irrigation and about 80 per cent of the domestic water demand.
Out of 6607 Blocks in the country 2077 Blocks of the country are either in Overexploited (1071), Critical (217) Semi-Critical (697) Stage or are Salinity affected (92) as per the assessment made in the year 2011.
Sustainability of this resource is vital to ensure food and drinking water security

Add your company logo here on master slide
Hence, Groundwater resources are simply perceived as a part of watersheds, landscapes, river basins, villages, blocks, districts, states etc, but
aquifers are seldom considered.
Most groundwater-related interventions are currently part of other programmes like : Integrated Watershed Management Programme (IWMP), River basin management and other programmes on water
resources and rural development, including the Mahatma Gandhi Rural Employment Guarantee Scheme (MGNREGS).
However, there is no dedicated programme on groundwater management in the country today.

Add your company logo here on master slide
Hence,It is imperative to design an aquifer mapping programme with a clear-cut groundwater management
purpose.
Even today a good “strike” of groundwater is considered a sound measure of success, without any reference to the strength and
potential of the aquifers behind
“sources of water supply”.
Specific programs such as drinking water and sanitation still seem to be bound to sources rather than resources.
This approach is restrictive and concludes at understanding groundwater prospects with a special reference to locating drinking water sources
Add your company logo here on master slide
5
Rationale for Aquifer Management
• Aquifers are the repositories for ground water storage – their
dimensions, characteristics, quality, storage etc. need to be
ascertained to manage them
• Ground water has a complex nature of occurrence, recharge,
discharge etc.
• Shift from “ground water development” to ground water
management” .
• What is needed is a standard methodology for aquifer mapping and
management which ingrains the principles and practices of
participatory management .
Add your company logo here on master slide
Aquifer Mapping & Management Programme
• National Aquifer Mapping and Management Programme (NAQUIM) commenced from year 2012.
• Four major components – Mapping of aquifers, resource, quality, recharge potential
– Ground Water Modeling and Management Plan
– Dissemination of Data/information / plan
– Participatory management of the resource
• Out of 23 lakh sq.km mappable area, around 8.89 lakh sq.km area is envisaged to be covered in first phase (2012-17- XII FYP) and remaining during second phase .

Add your company logo here on master slide
Area for Aquifer Mapping during XII
Plan
(2012-17)
5.25 lakh sq.km
3.64 lakh sq.km
Total OE/Critical Blocks- 1288 Being covered (1127) •Priority areas in 8 states- 915 •Other areas- 212

Add your company logo here on master slide
Approach for Aquifer Mapping Program
• Identification of areas and their prioritization in consultation with State governments.
• Status of data availability and compilation.
• Identification of data gaps. • Generation of data for filling up the
gaps. • Geology • Hydrogeology • Remote Sensing • Geophysics • Exploration • Water Quality etc.
• Processing and compilation of thematic maps on GIS Platform.
• Assessment of Potentiality of Aquifer • Assessment of ground water resources • Identification of aquifer issues such as
• Ground water stressed areas • Water quality vulnerable areas • Water logging areas • Non potential ground water areas • Recharge areas
• Development of ground water management plans for supply and demand side management through aquifer response modelling .
• Development of Aquifer Information and Management System(AIMS)
Add your company logo here on master slide
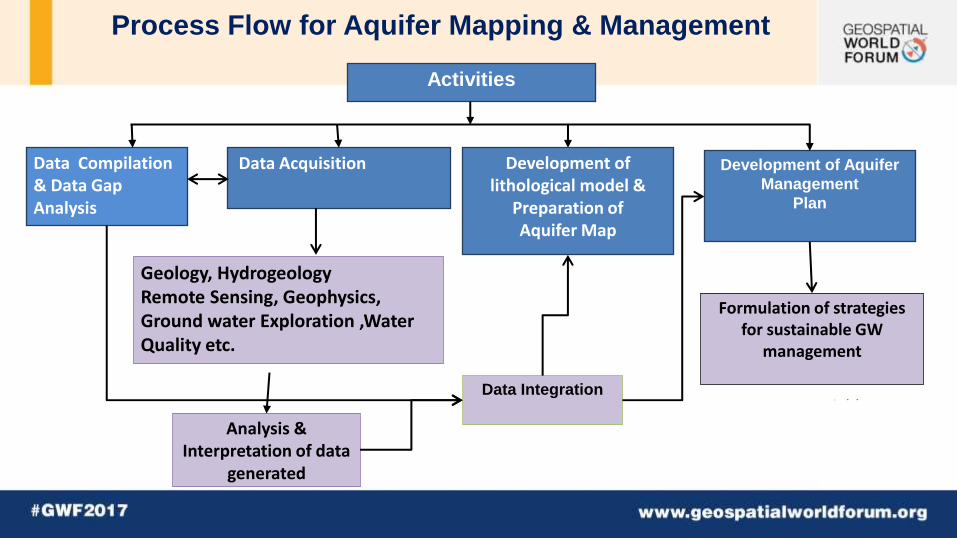
Process Flow for Aquifer Mapping & Management
Activities
Data Integration
Data Compilation & Data Gap Analysis
Data Acquisition Development of lithological model &
Preparation of Aquifer Map
Development of Aquifer
Management
Plan
Formulation of strategies for sustainable GW
management
Analysis & Interpretation of data
generated
Geology, Hydrogeology Remote Sensing, Geophysics, Ground water Exploration ,Water Quality etc.

• First Layer (Sandstone)
Aquifer - I (Sandstone)
Aquifer – IV (Sandstone)
Sixth layer (Clay)
Aquifer - III (Sandstone)
Perumal Eri
Neyveli Lignite Mine
4500 GPM pumping
1. Sea water intrusion – Threat along the coast .( Aquifer units – I to II)
2. Heavy withdrawal for Lignite mining (45,000 GPM) (Aquifer – III)
3. Pumping for irrigation, Industries & Domestic . (aquifer I & II)
4. Desilting of Perumal Eri.(will induce recharge & would have influence on Aquifer – I)
5. Aquifer – IV ( For future drinking use-Chennai)
Basement
Aquifer Management Plan – Lower Vellar Watershed,Cuddalore district , Tamilnadu

Recommended Strategies
Sr. No
Management
Options
Upper Cuddalore Aquifer
(Aquifer unit-I)
Lower Cuddalore aquifer
(Aquifer Unit-II)
Upper Neyveli Sandstone
(Aquifer Unit-III)
Middle Neyveli Sandstone
aquifer
(Aquifer Unit-IV)
Vulnerability Domestic & Irrigation Irrigation & Industrial Mining & Irrigation
Drinking water supply to Chennai
1 Threat of sea water intrusion
Vulnerable (0-5 Km from coast)
Vulnerable (0-5 Km from coast)
Vulnerable(0-5 Km from coast)
Vulnerablae (0-5Km from coast)
2 Decline in GW Level Vulnerable in central portion Entire aquifer NO NO
3 Management
option
Change in crop that requires less water than
paddy and sugarcane following a drought year .
Periodic Monitoring for water level and quality
along the coast.
Change in crop that requires less water
than paddy and sugarcane following a drought year .Periodic
Monitoring for Piezometric level &
quality along the coast.
Periodic Monitoring for
piezometric level and
quality along the coast and
around Neyveli lignite mine
Periodic Monitoring for
piezometric level and
quality along the coast.

Heliborne Geophysical Surveys Automated water level and water quality monitoring
High accuracy survey equipment -DGPS
ADVANCED TECHNOLOGY FOR AQUIFER MAPPING
Add your company logo here on master slide
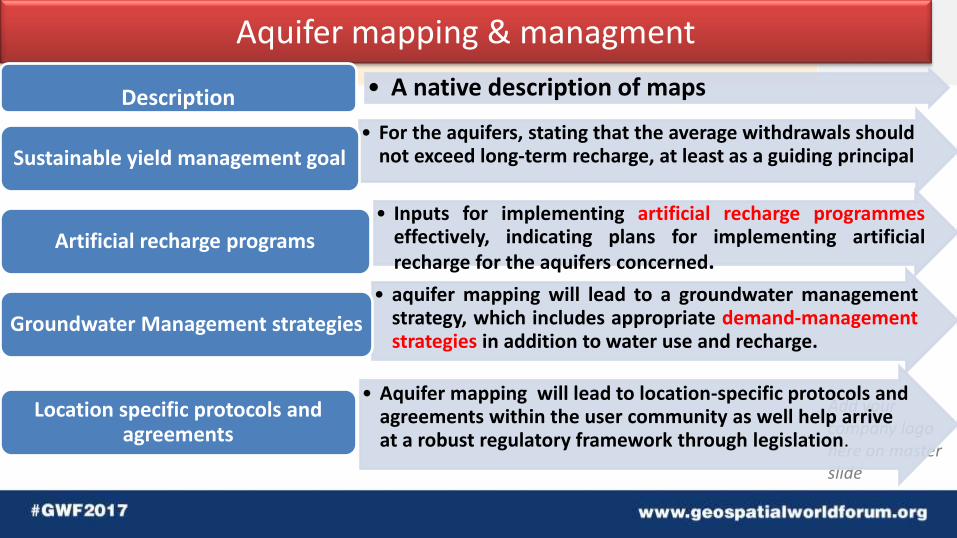
Aquifer mapping & managment
• A native description of maps
Description • For the aquifers, stating that the average withdrawals should
not exceed long-term recharge, at least as a guiding principal
Sustainable yield management goal
• Inputs for implementing artificial recharge programmes effectively, indicating plans for implementing artificial recharge for the aquifers concerned.
Artificial recharge programs
• aquifer mapping will lead to a groundwater management strategy, which includes appropriate demand-management strategies in addition to water use and recharge.
Groundwater Management strategies
• Aquifer mapping will lead to location-specific protocols and agreements within the user community as well help arrive at a robust regulatory framework through legislation.
Location specific protocols and agreements

Sum up
“Know your Aquifer…Manage your Aquifer…!”
So what is the Essence? • Demystification of Science of Hydrogeology
• Infusion of a sense of ownership amongst stakeholders
• Effort by Government and community to work in tandem for sustainable management