arcmap basics - vam resource center - wfp
TRANSCRIPT

1
Oscar Gobbato
WFP Liberia Country Office
GIS training - Summary
Objectives
1 To introduce to participants the basic concepts and techniques in using Geographic
Information System (GIS)
2 To equip participants with practical GIS skills to produce Layout Map for the report
Session 1
Introduction to GIS
1. Recognizing ArcMap user interface
2. Learning about the basic mapping functions of ArcMap
3. Exploring and query map data under ArcMap environment
4. File Management : Shape file and Raster files format
Session 2
Exploring GIS
1. File management exploring ArcCatalog
2. Creating a new layer file and use of editing tool in ArcMap
3. Creating a layer from Gps Data
4. Selecting features by creating a query
5. External Tables and joins
6. Spatial Join
7. Preparing Map Layout (functions)
8. Changing the Symbology options
9. GIS resources: books and websites

2
Session 1: Introduction to GIS - ArcMap Basics
Objectives
To recognize ArcMap (ArcView 9.x) user interface
To learn about the basic mapping functions of ArcMap
To explore and query map data under ArcMap environment
Task 1: Recognizing ArcMap user interface
Toolbars:
Look at the top of the ArcMap window. There are four bars shown as below. We will use
these buttons to perform various GIS functions.
Draw Tool
Map Window
Table of Content
(TOC)
Main Menu
Standard Bar
Tools Bar

3
1. Main Menu:
a. Getting help in the ArcMap
Click the What’s This? Button
With the Help pointer, click the item in the ArcMap window about which you
want more information
b. Using the Help Contents to get help
Click the Help menu and click ArcGIS Help
Click the Contents tab
Double-click a book to see a list of topics in that category
Click the topic you want to read
2. Standard:
3. Tools:
4. Draw Tool: used to add map elements
New Save
Open
Paste
Add
Scale
Editor
ArcCatalog
Help
Full Extent
Pan
Fixed
Zoom Out
Fixed
Zoom In
Zoom out
Zoom in Identify
Select
Zoom to
Select Measure
Find
4
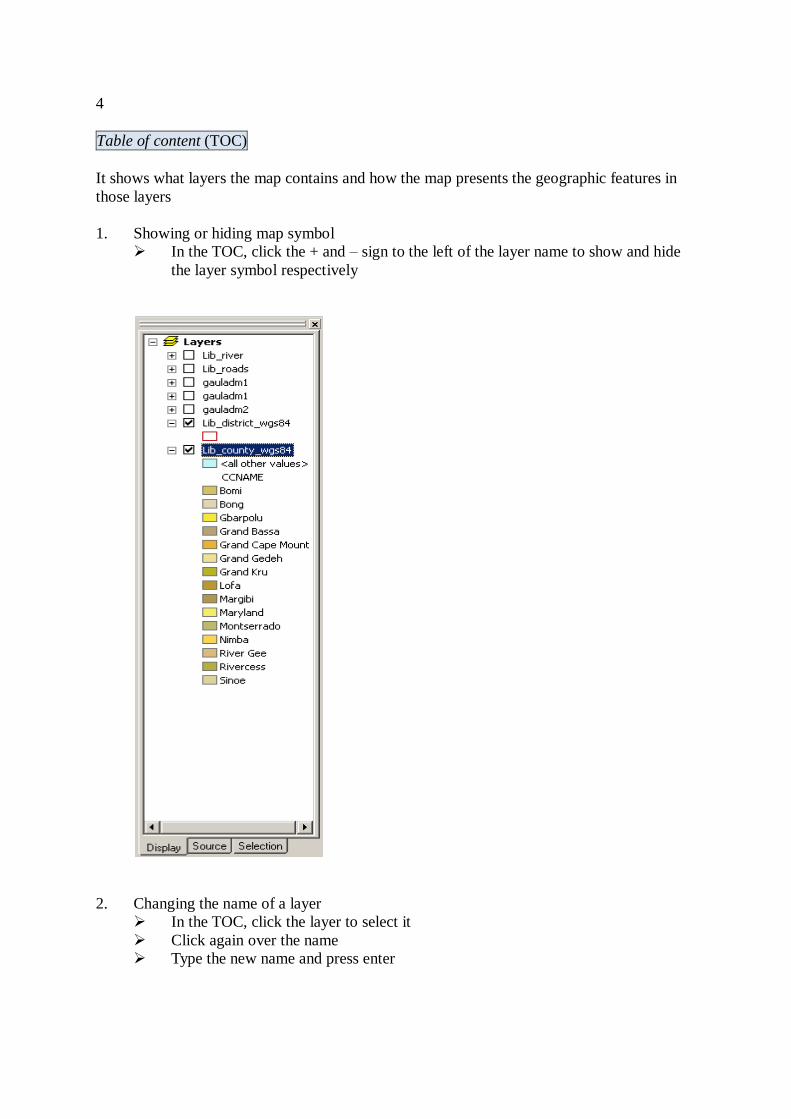
Table of content (TOC)
It shows what layers the map contains and how the map presents the geographic features in
those layers
1. Showing or hiding map symbol
In the TOC, click the + and – sign to the left of the layer name to show and hide
the layer symbol respectively
2. Changing the name of a layer
In the TOC, click the layer to select it
Click again over the name
Type the new name and press enter

5
3. Changing the display symbol for the layer
In the TOC, click the box on the left of the layer name to show symbol
Click the symbol (for ex. Bomi, see below Color Preview)
Select symbol in symbol selector interface

6
4. Changing a layer’s drawing order
In the TOC, click and drag the layer up or down
Release the mouse pointer to drop the layer in its new position
5. Removing a layer
In the TOC, right-click the layer you want to remove
Click Remove

7
6. Copy and past a Layer into the same TOC
In the TOC, after to select the layer you want to copy and right click from the list
select “Copy” and than go on the top of TOC select “Layers” and than right click
and select “Paste Layer(s)”,you will have a duplication of the layer chosen into
TOC

8
7. Using Source Instead of Display on the TOC
In the TOC, on the bottom click on the Source instead of Display using that you
can visualize the path where are the layers of the Project (when you use this it’s
not possible to change layer’s order)

9
Map window
Use 2 buttons or use View menu on the Standard toolbar to quickly switch between data view
and layout view
1. Data View is an all-purpose view for exploring, displaying, and querying the data on the
map. But the view hides all the map elements on the layout, e.g. titles, North arrows.
(From “Main Menu” “View” and than “Data View”).
2. Layout View is for laying out a map. In it, we can do almost everything in data view,
plus design a map / arrange map elements.
Main Menu
Main Menu

10
One click on Layout View and we will get a Layout bar (as below)
Map Window change as well (see below).
We will use Layout view every time we have to produce a Map (A4,A3 for paper format
Or for digital format Jpeg, Png)
Layout Bar

11
Every time we have to add a function to our Project we have to go to Main menu bar
Toolbars after that check in to activate the functionality you want to get.
Another way for activate (or for switch off ) all the functionality you need to use
Main Menu Tools Customize, where you find all the functionality and where
choice the right one you need, check in (check out for excluding)See below.

12
Check in to activate the bar you are interested or uncheck to switch off for excluding that bar.
See below the screen shot:
The lonely functionality you cannot excluding is Main Menu (of course) otherwise
There isn’t way to check in or check out all others functionality.

13
To visualize or to switch off the TOC:
From Main Menu
Window
Table of Contents

14
Task 2: Learning about the basic mapping functions of ArcMap
Open a Project (.Mxd) from the Startup dialog box
Start ArcMap
Click to open “an existing map” option
Click OK
In the dialog box click the Look in dropdown arrow and navigate to the folder that
contains the Project .Mxd
Select the Projects you want to open and

15
Click open
Otherwise if there is no Project (.Mxd) and you want to make it a new one click on
“A new empty map” after that you have to import the layers you want to working
on.
2. Adding a map layer
Click the Add Data button on the “Standard toolbar”
Navigate to the map folder
Selected layer and Add

16
3. Displaying a layer (turning on / off the map display)
In the TOC, check the box next to the layer’s name when you display a layer. But
uncheck it when you turn the layer off.
4. Overlapping map layers
In the TOC, click and drag the layer up or down
Release the mouse pointer to drop the layer in its new position
5. Moving around the map on data view
Zooming in or out
Click and drag a rectangle defining the area you want to zoom in or out
Zooming in or out a fixed amount
Move the mouse pointer over the map display
Click once to zoom around a point
Zooming to the full extent of the data
Click the Full Extent button
Zooming to a specific scale
Type the appropriate scale in the scale bar
Moving back or forward one display
Click the Back or Forward Extent buttons
6. Saving a map document (Project and all changing done ex: Name of layers, scale etc)
Click the Save button on the Standard toolbar

17
Task 3: Exploring and query map data under ArcMap environment
1. Identifying features by pointing at them
Click the Identify tool on the Tools toolbar
Before to move the mouse pointer over the selected feature choice from the layers
for which one you want to get information
Move the mouse pointer over the selected feature on Map Window
All the Field Names of the database
Specific record of
The database
Specific record
of the database
All Layers into
TOC
Layer chosen

18
2. Viewing a layer’s attribute table
In the TOC, right-click the layer for which you want to display the attribute table
Click Open Attribute Table

19
The “Feature ID” is a counter of the records automatic after to created the Shapefile
Starting to 0 until 15 (in our example), the rest of the Fields are created and populated.
3. Finding features with particular attributes
Click the Find button on the Tools toolbar
If you are seeking a Record name containing in a layer that is on TOC:
Click the In layers dropdown arrow and click the layer you want to search
Type the string you want to find in the Find text box
Uncheck Find features that are similar to or contain the search string if the string must
match exactly
Search for the string in all fields, in a specific field, or in the primary display field
Click “Find”
Feature ID County Records

20
On the bottom of the window we have the information requested:
”Value” record,”Layer”,”Field”.
4. Measuring distance
Click the Measure button on the Tools toolbar
Measure
Line
Measure
A Feature
Snap to Feature
Show Total
Choose Unit
Clear & Reset
In the case we want to measure a linear distance between two points in Kilometers, Meters,
Decimal Degrees:

21
Click on Choose Unit
Distance
Choice Kilometers or what you want (Meters, Decimal Degrees)
Come back to Measure Line and go to the Map Window and use the mouse
pointer to draw a line representing the distance you want to measure.
The line can have more than one line segment
Double-click to end the line
Task 4: File management: Shapefile and Raster files structure
a) Shapefiles
Shapefiles are a vector format invented by ESRI. They are very easy to use because they
contain the data in a table format, where each feature (vector element) is independent from
the other ones.
Shapefiles consist of the following files:
*.SHP the main “shape” file. It contains the shapes
*.DBF the attribute table. This is a standard DBF version 4 file
*.SHX this links the first two files together
ESRI also uses the following files together with shapefiles to add extra functionality:
*.SBN, *.SBX these are index files that speed up the usage of shapefiles.
*.AUX this is extra information ArcMap needs for all layers
*.PRJ this is the projection file (see section about projections) in text
Format
The Symbology in Arc Map/ArCatalog for the three Feature Class are:

22
b) Image Files
Image files are graphical files that are georeferenced (see previous section). A graphical file
can be one of many formats (JPG, BMP, TIF, GIF…..)
The files that will be associated with it for georeferencing are:
*.JGW the world file containing coordinates for
or (.BPW, TFW, GFW…) positioning, scaling and rotating the image.
*.PRJ the projection file (see section on projections)
ArcMap also creates the following files for each image layer:
*.RRD the pyramid file (a type of indexing for faster use of rasters)
*.AUX extra information
The Symbol representing the Raster file is:
c) Grids
Grids are raster layers like images. The difference between images and grids is that an image
is a picture (it is used for visual interpretation by the user) while a grid is a matrix of values
and each pixel value has a meaning. For example in a digital elevation model, each pixel’s
value represents the height in meters above sea level.
A grid can also has an attribute table just like a vector layer, but the attribute table has one
record for each value that is present in the grid. The attribute table shows the number of
pixels present for each value.
Each grid is held in a series of files that are contained within a sub-directory. The files all
have a *.ADF file extension.
Feature Point Class
Feature Line Class
Feature Polygon Class
Tables Class
Raster /Grid

23
d) ArcMap Project
When a project is saved in ArcMap, all the information is written in a file with a MXD
extension.
This file does not contain any data. All the data (layers and tables) are stored externally and
the MXD file only contains links to these files.
The MXD file contains the all the display properties of layers, symbology (legends), page
layouts with all the graphical elements, and everything that is configured in ArcMap.
The Symbology representing the Project .Mxd containing the Feature Classes is:
Project (.Mxd)

24