arkansas animal science department report 1999
TRANSCRIPT

University of Arkansas, FayettevilleScholarWorks@UARK
Research Series Arkansas Agricultural Experiment Station
1-1-2000
Arkansas Animal Science Department Report1999Zelpha B. JohnsonUniversity of Arkansas, Fayetteville
D. Wayne KelloggUniversity of Arkansas, Fayetteville
Follow this and additional works at: https://scholarworks.uark.edu/aaesser
Part of the Animal Diseases Commons, Animal Experimentation and Research Commons,Animal Studies Commons, and the Beef Science Commons
This Report is brought to you for free and open access by the Arkansas Agricultural Experiment Station at ScholarWorks@UARK. It has been acceptedfor inclusion in Research Series by an authorized administrator of ScholarWorks@UARK. For more information, please contact [email protected],[email protected].
Recommended CitationJohnson, Zelpha B. and Kellogg, D. Wayne, "Arkansas Animal Science Department Report 1999" (2000). Research Series. 133.https://scholarworks.uark.edu/aaesser/133

A R K A N S A S A G R I C U L T U R A L E X P E R I M E N T S T A T I O NDivision of Agriculture University of ArkansasJanuary 2000 Research Series 470
Animal ScienceAnimal ScienceAnimal ScienceAnimal ScienceAnimal ScienceDepartment Report • 1999Department Report • 1999Department Report • 1999Department Report • 1999Department Report • 1999
Animal ScienceAnimal ScienceAnimal ScienceAnimal ScienceAnimal ScienceDepartment Report • 1999Department Report • 1999Department Report • 1999Department Report • 1999Department Report • 1999
Arkansas
Zelpha B. Johnson andD. Wayne Kellogg,
Editors
Zelpha B. Johnson andD. Wayne Kellogg,
Editors

Agricultural Experiment Station, University of Arkansas Division of Agriculture, Fayetteville. Milo J. Shult, Vice Presidentfor Agriculture and Director; Charles J. Scifres, Associate Vice President for Agriculture. 1M100. The Arkansas Agricul-tural Experiment Station follows a nondiscriminatory policy in programs and employment. ISSN: 0099-5010 CODEN:AKAMA6.
Editing and cover design by Karen Eskew

ARKANSAS ANIMAL SCIENCEDEPARTMENT REPORT 1999
Edited by
Zelpha B. JohnsonResearch Assistant Professor
and
D. Wayne KelloggProfessor
Department of Animal ScienceUniversity of Arkansas
Arkansas Agricultural Experiment StationFayetteville, Arkansas 72701

The faculty and staff of the Animal Science Program are pleased to present the second edition of Arkansas AnimalScience. We hope you will find the reports of the research, teaching, and extension programs useful in your research,educational or production programs.
The key event this year was the long-awaited dedication of the Pauline Whitaker Animal Science Center on April 17,1999. Along with a major gift from the Pauline Whitaker family, other major contributions were made from the ArkansasCattlemen’s Association, Arkansas Pork Producers Association and the Arkansas Farm Bureau Federation, including con-tributions from county Farm Bureaus, county Cattlemen’s Associations, breed associations and the U of A Division ofAgriculture. A significant number of private gifts were contributed by friends, alumni, faculty, and staff.
The main building covers over 45,000 square feet, including the arena with 750 chairback seats and a 25,000 squarefoot arena floor. Three formal classrooms and a large reception area with adjoining kitchen and conference room completethe building. An animal preparation and holding barn plus pastures are adjacent to the building. The Dorothy E. KingEquine Pavilion, scheduled for construction this fall, will provide an outdoor arena and specialized facilities for horsesadjacent to the Pauline Whitaker Animal Science Center. The facility has already had tremendous impacts on our ability torecruit students and provide programming to our clientele.
In addition to teaching and research activities, the Animal Science Program offers a number of educational programsfor the Arkansas livestock industries. Livestock producers, who are applying extension recommended management prac-tices, have improved livestock efficiency. These programs include, but are not limited to, the Arkansas Beef ImprovementProgram, beef quality assurance, bull evaluation, dairy cattle, horses, grazing schools, steer feedout, pasture management,and 4-H livestock projects. These programs are delivered by Animal Science and County Extension Faculty.
INTRODUCTION
Sincerely,
Keith LusbyDepartment HeadFayetteville
Tom TroxelSection LeaderLittle Rock

INTERPRETING STATISTICS
Scientists use statistics as a tool to determine what dif-ferences among treatments are real (and therefore biologi-cally meaningful) and what differences are probably due torandom occurrence (chance) or some other factors not re-lated to the treatment.
Most data will be presented as means or averages of aspecific group (usually the treatment). Statements of prob-ability that treatment means differ will be found in most pa-pers in this publication, in tables as well as in the text. Thesewill look like (P < .05); (P < .01); or (P < .001) and meanthat the probability (P) that any two treatment means differentirely due to chance is less than 5, 1, or .1%, respectively.Using the example of P < .05, there is less than a 5% chancethat the differences between the two treatment averages arereally the same. Statistical differences among means are of-ten indicated in tables by use of superscript letters. Treat-ments with the same letter are not different, while treatmentswith no common letters are. Another way to report means isas mean + standard error (e.g. 9.1 + 1.2). The standard errorof the mean (designated SE or SEM) is a measure of howmuch variation is present in the data – the larger the SE, themore variation. If the difference between two means is lessthan two times the SE, then the treatments are usually notstatistically different from one another. Another estimate ofthe amount of variation in a data set that may be used is thecoefficient of variation (CV) which is the standard error ex-pressed as a percentage of the mean.
Some experiments will report a correlation coefficient(r) which is a measure of the degree of association betweentwo variables. Values can range from –1 to +1. A strong posi-tive correlation (close to +1) between two variables indi-cates that if one variable has a high value then the other vari-
able is likely to have a high value also. Similarly, low valuesof one variable tend to be associated with low values of theother variable. In contrast, a strong negative correlation co-efficient (close to –1) indicates that high values of one vari-able tend to be associated with low values of the other vari-able. A correlation coefficient close to zero indicates thatthere is not much association between values of the two vari-ables (i.e. the variables are independent). Correlation ismerely a measure of association between two variables anddoes not imply cause and effect.
Other experiments use similar procedures known as re-gression analysis to determine treatment differences. Theregression coefficient (usually denoted as b) indicates theamount of change in a variable Y for each one unit increasein a variable X. In its simplest form (i.e. linear regression),the regression coefficient is simply the slope of a straightline. A regression equation can be used to predict the valueof the dependent variable Y (e.g. performance) given a valueof the independent variable X (e.g. treatment). A more com-plicated procedure, known as multiple regression, can be usedto derive an equation that uses several independent variablesto predict a single dependent variable. Associated statisticsare r2, the simple coefficient of determination, and R2, themultiple coefficient of determination. These statistics indi-cate the proportion of the variation in the dependent variablethat can be accounted for by the independent variables.
Genetic studies may report estimates of heritability (h2)or genetic correlation (rg). Heritability estimates refer to thatportion of the phenotypic variance in a population that isdue to heredity. A genetic correlation is a measure of whetheror not the same genes are affecting two traits and may varyfrom –1 to +1.

ADFI = average daily feed intakeADG = average daily gainavg = averageBW = body weightcc = cubic centimetercm = centimeterCP = crude proteinCV = coefficient of variationcwt = 100 poundsd = day(s)DM = dry matterDNA = deoxyribonucleic acid°C = degrees Celsius°F = degrees fahrenheitEPD = expected progeny differenceF/G = feed:gain ratioFSH = follicle stimulating hormoneft = foot/feetg = gram(s)gal = gallon(s)h = hour(s)in = inch(es)IU = international unitskcal = kilocalorie(s)kg = kilogram(s)
COMMON ABBREVIATIONS
L = liters(s)lb = pound(s)LH = lutenizing hormonem = metersmg = milligram(s)mcg = microgram(s)mEq = millequivalent(s)min = minutes(s)mo = month(s)N = nitrogenNS = not significantppb = parts per billionppm = parts per millionr = correlation coefficientr2 = simple coefficient of determinationR2 = multiple coefficient of determinationRNA = ribonucleic acids = second(s)SD = standard deviationSE = standard errorSEM = standard error of the meanTDN - total digestible nutrientswk = week(s)wt = weightyr = year(s)

TABLE OF CONTENTS
Developing Future Leaders of the Animal IndustriesC. Rosenkrans, Jr., and W. Kellogg ........................................................................................................................ 9
Teaching Concepts of Forage Quality and Estimation of Energy in Forages on a Graduate LevelW.K. Coblentz, C.P. West, and K. Anschutz .......................................................................................................... 11
Efficacy of Mannan Oligosaccharide (Bio-Mos®) Addition at Two Levels of Supplemental Copper onPerformance and Immunocompetence of Early Weaned Pigs
E. Davis, C. Maxwell, B. Kegley, B. de Rodas, K. Friesen, and D. Hellwig ........................................................ 15
Effect of Feeding Bacillus Cultures on Performance of Growing-Finishing Swine and on PenCleaning Characteristics
C.V. Maxwell, M.E. Davis and D. Brown ............................................................................................................. 19
Influence of Magnesium-Mica on Performance and Carcass Quality Traits of Growing-Finishing SwineJ. Apple, C. Maxwell, B. de Rodas, J. Davis, and L. Rakes ................................................................................. 23
Effect of Magnesium-Mica on Pork Loin Quality During Extended Refrigerated StorageJ. Apple, J. Davis, L. Rakes, C. Maxwell, F. Pohlman, and B. de Rodas ............................................................. 29
Effect of Dietary Chromium-L-methionine on Glucose Metabolism of Growing PigsB. Kegley, C. Maxwell, and T. Fakler................................................................................................................... 32
Estimation of Litter Environmental and Maternal Effects for Performance Test Traits of Large White SwineZ. Johnson, J. Chewning, and R. Nugent, III ....................................................................................................... 37
Genetic Parameters for Production Traits and Measures of Residual Feed Intake in Large White SwineZ. Johnson, J. Chewning, and R. Nugent, III ....................................................................................................... 41
Effect of Timing of Artificial Insemination on Gender Ratio in Beef CattleR.W. Rorie and T.D. Lester ................................................................................................................................... 47
Effect of Estrous Parameters and Time of Insemination on Pregnancy Rate in Beef CattleR.W. Rorie and T.D. Lester ................................................................................................................................... 50
Evaluation of a Two-part Melengestrol Acetate Estrus Synchronization RegimeS. Wright, D. Kreider, R. Rorie, N. Huber, and G. Murphy .................................................................................. 53
Persistent Efficacies of Doramectin and Ivermectin in Arkansas Stocker CalvesT.A. Yazwinski, C. Tucker, Z. Johnson, H. Featherston, and S. Copeland ........................................................... 56
Factors Influencing Sale Price Among Bulls Enrolled in an On-Farm Bull Testing ProgramS. McPeake and C. Cochran ................................................................................................................................ 61
Arkansas Steer Feedout Program 1997-1998T. Troxel, G. Davis, S. Gadberry, S. McPeake, and W. Wallace ........................................................................... 64
The Impact of Feeding Poultry Litter on Microbial Contamination of Beef CarcassesJ.R. Davis, J.K. Apple, D.H. Hellwig, E.B. Kegley, and F.W. Pohlman ............................................................... 69
Effect of Shade Type on Cow Growth PerformanceK. Coffey, D. Hubbell, and K. Harrison ............................................................................................................... 72
Performance of Fall-Calving Cows Fed Zeolite While Grazing Fescue During the WinterK. Coffey, D. Hubbell,III, C. Rosenkrans, Jr., W. Coblentz, Z. Johnson, and K. Harrison .................................. 75
Performance of Stocker Calves Backgrounded on Winter Annuals or Hay and GrainK. Coffey, D. Shockey, W. Coblentz, C. Rosenkrans, Jr., S. Gunter, and G. Montgomery .................................... 77
Effect of Pre-weaning and/or Pre-vaccination on Weight Change During the Weaning ProcessK. Coffey, D. Hellwig, C. Rosenkrans, Jr., W. Coblentz, D. Hubbell, III, Z. Johnson,K. Harrison,and B. Watson ....................................................................................................................................................... 80
Effect of Agrado® on Performance and Health of Calves new to the Feedlot EnvironmentB. Kegley, D. Hellwig, D. Gill, and F. Owens ...................................................................................................... 84
Production of Stocker Cattle Supplemented with Defatted Rice Bran while Grazing Bermudagrass PastureL.B. Daniels, K.P. Coffey, K.F. Harrison, D. Hubbell, III, and Z.B. Johnson ...................................................... 88

AAES Research Series 470
8
Developing Beef Heifers During the Winter Months with Stockpiled Bermudagrass ForageL.B. Daniels, A.H. Brown, Jr., K.F. Harrison, D. Hubbell, III, and Z.B. Johnson ............................................... 89
Use of Soft-Red Winter Wheat Forage for Stocker Cattle Production During the Fall and WinterL.B. Daniels, K.F. Harrison, D. Hubbell, III, A.H. Brown, Jr., E.G. Kegley, K.P. Coffey, W. Coblentz,Z.B. Johnson, and R. Bacon ................................................................................................................................. 91
Evaluation of Pattern of Gain Using Dry-Lot or Wheat-Ryegrass Pasture Programs in Developing Heifersfor Breeding
P. Beck, S. Gunter, M. Phillips, and D. Kreider ................................................................................................... 97
Diet and Pattern of Gain of Weaned Calves Affects Subsequent Performance on GrassP. Beck, S. Gunter, K. Cassida, and M. Phillips ................................................................................................. 102
Limit-Fed, High-Concentrate Diets for Maintaining Beef Cows During Drought Periods in the SoutheastUnited States
S. Gunter, P. Beck, J. Weyers, and K. Cassida.................................................................................................... 107
Performance of Growing Calves Supplemented with Bioplex® Copper Pre- or Post-Shipping to a FeedlotS. Gunter, P. Beck, B. Kegley, K. Malcom-Callis, and G. Duff ...........................................................................111
Escape Protein for Growing Cattle Grazing Stockpiled Tall FescueP. Beck, S. Gunter, M. Phillips, and K.Cassida .................................................................................................. 116
Genotype x Environment Interactions in Angus, Brahman, and Reciprocal Cross Cows and their CalvesGrazing Common Bermudagrass, Endophyt-Infected Tall Fescue Pastures, or Both Forages
A.H. Brown, Jr., M.A. Brown, W.G. Jackson, and J.R. Miesner ......................................................................... 120
Postweaning Performance of Calves from Angus, Brahman, and Reciprocal Cross Cows Grazing Endophyte-Infected Tall Fescue or Common Bermudagrass
M.A. Brown, W.A. Phillips, A.H. Brown, Jr., S.W. Coleman, W.G. Jackson, and J.R. Miesner .......................... 125
Body Measurements as Tools for Prediction of a Heifer’s Probability of CalvingC.F. Rosenkrans, Jr., A.H. Brown, Jr., and Z.B. Johnson ................................................................................... 129
Evaluation of Hospital Treatment Regimens for the University of Arkansas Beef Research Facility at SavoyS. Copeland, D.H. Hellwig, E.B. Kegley, Z.B. Johnson, and Z. Krumpleman ................................................... 132
Reduction of E. coli and Salmonella typhimurium in Ground Beef Utilizing Antimicrobial Treatments Priorto Grinding
F.W. Pohlman, M.R. Stivarius, K.S. McElyea, J.K. Apple, M.G. Johnson, and A.L. Waldroup ......................... 135
Performance and Ensiling Characteristics of Tall Growing Soybean Lines Used for SilageV. Nayigihugu, W. Kellogg, D. Longer, Z. Johnson, and K. Anschutz ................................................................ 142
Nutrient Composition of Hays Produced in ArkansasG. Davis, T. Troxel, and S. Gadberry ................................................................................................................. 148
A Summary of 1998 Hay Production Costs for Three Farms Enrolled in the Arkansas Beef ImprovementProgram Hay Quality Project
S. Gadberry, J. Jennings, G.Van Brunt, J. Hawkins, T. Thompson, and T. Troxel ............................................. 152
Evaluation of Seeding Rate and Herbicide Treatment on Growth and Development of Sod-Seeded Oat,Wheat, and Rye
W.K. Coblentz, K.P. Coffey, J.E. Turner, K.F. Harrison, L.B. Daniels, C.F. Rosenkrans, Jr.,and D.S. Hubbell, III .......................................................................................................................................... 162
Forage Quality Characteristics and Dry Matter Digestion Kinetics of Sod-Seeded Cereal Grains inNorthern Arkansas
W.K. Coblentz, K.P. Coffey, J.E. Turner, D.A. Scarbrough, J.S. Weyers, K.F. Harrison, L.B. Daniels,C.F. Rosenkrans, Jr., D.W. Kellogg, and D.S. Hubbell, III ................................................................................ 168
A Field Trial on the Effectiveness of Popular Anthelmintics in Arkansas HorsesS. Ryan, R. McNew, T. A. Yazwinski, C. Tucker, S. Copeland, and P. Turchi ..................................................... 175
1998 Dairy Herd Improvement Herds in ArkansasJ.A. Pennington .................................................................................................................................................. 180
Comparison of Magnesium Sources on Muscle Color and Tenderness of Finishing SheepJ. Apple, B. Watson, K. Coffey, and B. Kegley ................................................................................................... 185

Arkansas Animal Science Department Report 1999
9
Undergraduate Studies
Diversity is a great opportunity for broadening studenteducation. During the 1999-2000 academic year we willunveil our new undergraduate courses related to companionanimals. Three new courses will be offered: Animal Behav-ior, Companion Animal Management, and Parasitisms ofDomesticated Non-Herbivores.
Animal Behavior is a sophomore-level course taught byDr. Hayden Brown. This course is aimed at understandingwhy animals do what they do. Specifically, students will studyhow environmental, genetic, nutritional, and physiologicalfactors control the way livestock and pets behave. Compan-ion Animal Management is a sophomore-level course taughtby Dr. Dianne Hellwig. While this course will primarily con-sider the genetics, nutrition, physiology and management ofdogs and cats, some attention also will be given to pet birdsand reptiles. Our third new course, Parasitisms of Domesti-cated Non-Herbivores, is a junior level course taught by Dr.Tom Yazwinski. As the name implies, this course will pri-marily cover parasites of pets, birds, and swine. Collectively,we believe these courses will enhance the educational op-portunities for students who come from urban areas or whojust want to know more about companion animals. Our hopeis that these courses will not only serve our current clientele,but prove attractive to students in other disciplines and col-leges within the university.
In addition to the courses related to companion animals,we are building and investing in our equine program. Laterthis year, our plans are to open the Dorothy E. King EquinePavilion and to hire an instructor for equine and equestriancourses. Programs for students and the public are planned atthe new facilities, which should result in quick recognitionof the usefulness of such facilities.
Developing Future Leaders of the Animal Industries
Charles Rosenkrans, Jr., and Wayne Kellogg1
Story in Brief
Numerous former students who had majored in Animal or Poultry Science at the University of Arkansas havemade very significant impacts in allied industries and academia. Our objective is to continue graduating studentswho make a difference. Curricula is a very dynamic process, and we are continuing to make changes to our under-graduate and graduate degree programs. To ensure excellence, we are offering new courses, and improving aca-demic policies and procedures.
1 Both authors are associated with the Animal Science Department, Fayetteville.
Undergraduate Programs
The University of Arkansas experienced a fairly flat in-crease (1.4%) in student enrollment in comparison to spring1998. However, the Bumpers College had an increase ofnearly 15%, by far the largest in the university. That increasein enrollment can be attributed to a large number of factorsincluding recruitment programs and development of the Ar-kansas Consortium for Teaching Agriculture (ACTA). Ani-mal Science had one of the largest increases in enrollmentamongst the agriculture departments. We had 117 students,which is a 26% increase when compared with 1998.
While Animal Science enrollment is growing, we arenot going to rest. Our recruitment program includes a moreorganized faculty effort and considerably more lucrativescholarship program. We continue to support Animal Sci-ence courses with our ACTA partners through distance edu-cation and cooperative syllabi. This relatively new partner-ship has already resulted in considerable interest in AnimalScience transfers to the University of Arkansas.
Retention can be a serious problem in open enrollmentpublic institutions, and is a problem at the University of Ar-kansas. The University of Arkansas has implemented a in-cremental increase in admission requirements; however, ad-ditional programs are needed to increase retention. We be-lieve that offering a student-centered academic program withinteresting and challenging curricula is key. Our retentionprogram will include both peer-to-peer mentoring andfaculty-student mentoring, as well as faculty advising. Imple-mentation of the electronic degree audit system will allowfaculty more time for advising students as opposed to justclass scheduling. In total, we hope to continue attracting goodstudents who have the drive to succeed and become the lead-ers of agriculture.

AAES Research Series 470
10
Graduate Programs
Our graduate enrollment is growing again. Currently wehave 31 students with 20 on assistantship with the largestpercentage of those students being Master of Science candi-dates. During the past three years most of the attention incurricula has focused on undergraduate studies. That mo-mentum is now shifting to the graduate program.
The physiology groups of Animal Science and PoultryScience reorganized two 4-hour general physiology coursesinto six 2-hour modular courses. Those 8-week block coursesare: Neurophysiology, Cardiovascular Physiology, EndocrinePhysiology, Respiratory Physiology, Gastrointestinal andDigestive Physiology, and Renal Physiology. This changewill allow for greater student/mentor variety in course se-lection and instructor specialization for each course. In ad-dition, the modular format will be more conducive for deliv-ery via distance education.
An interdepartmental group of monogastric nutrition-ists is developing a series of integrated course offerings.Those courses include adding a laboratory methods course,and a protein metabolism course. In addition, our facultyinterested in meats, muscle biology, and food safety are dis-cussing curriculum opportunities with Poultry Science andFood Science faculty.
Collectively, our undergraduate and graduate teachingprograms is preparing students for the diverse career oppor-tunities that await them. The combination of coursework,internships, and extracurricular activities allow our studentsto become aquainted with unique opportunities in the ani-mal industry.

Arkansas Animal Science Department Report 1999
11
Introduction
Teaching concepts of forage quality is best accomplishedwith laboratory experience to support the theoretical con-cepts discussed in the classroom. Many students, who maynever conduct forage quality analysis on a routine basis, stillneed to have some understanding of these concepts in theirfuture careers. Students that pursue careers as consultants orin some other extension-related field can benefit greatly fromhaving some knowledge of what information can and cannot be gleaned from each laboratory procedure. In addition,an appreciation for the time, expense, and logistical require-ments necessary to conduct these procedures may also be ofgreat benefit when these students join the professional workforce. In order to provide graduate-level students with thistype of training, a laboratory study problem was designedfor the students enrolled in Forage-Ruminant Relations(ANSC/AGRN 6253). One concept that often surprises stu-dents, producers, and county extension personnel is that thereis no standard method of estimating the energy content offorages. Because the direct determination of the digestibleenergy content of feedstuffs using animals is prohibitivelyexpensive and time consuming, energy estimates are usu-ally predicted from equations that use values obtained fromroutine forage quality procedures. However, these predic-tion equations are not standardized across the country, re-gion, or even within a given state. For instance, foragesamples sent to the University of Arkansas Agricultural Ser-vices Laboratory will have the associated energy contentpredicted by equations that are different from those used by
Teaching Concepts of Forage Quality and Estimation ofEnergy in Forages on a Graduate Level1
W.K. Coblentz2, C.P. West3, and K. Anschutz2
Story in Brief
This report describes a laboratory exercise for graduate students that was designed to provide practical expe-rience in conducting forage quality analysis. Students in Forage-Ruminant Relations (ANSC/AGRN 6253) werepaired and assigned a bermudagrass hay sample selected from the Arkansas Hay Show. A set of laboratory proce-dures was completed for each sample and the results were reported orally and in a written report. The energycontent of these forages was predicted by several equations used routinely across the United States. Most studentsfelt the activity was useful and should be repeated in subsequent classes. This activity may have been most benefi-cial to students pursuing advanced degrees in programs other than ruminant nutrition; these students may have noother exposure to these procedures during their advanced academic training.
1 Students in ANSC/AGRN 6253 included Indi Braden, Stephanie Williamson, Dana Mattke, Mike Nihsen, Jeff Weyers, Dean Scarbrough,Levi McBeth, Keith Lesmeister, Eric Oxford, and Clay Bailey.
2 Department of Animal Science, Fayetteville.3 Department of Crop, Soil and Environmental Sciences, Fayetteville.
private laboratories. In addition, some states have one pre-diction equation for all forages, while other states have sepa-rate equations for different forage types (legumes, corn si-lage, cool-season grasses, warm-season grasses, etc.). Ourobjectives in designing this problem were twofold: 1) supple-ment classroom discussions about forage quality with valu-able laboratory experience; and 2) demonstrate the differ-ences in predictive equations for the energy content of for-ages that can occur across the country.
Procedures
Sample Selection and Analyses. During the 1998 Ar-kansas Hay Show held in conjunction with the ArkansasCattlemen’s Association Convention, four high-qualitysamples of bermudagrass hay were selected for this project.Most prediction equations for energy rely heavily on the aciddetergent fiber (ADF) concentration as the predictor vari-able; however, the University of Arkansas prediction equa-tion for energy or total digestible nutrients (TDN) also in-cludes concentrations of neutral detergent fiber (NDF) andcrude protein (CP). The four bermudagrass samples wereselected because they had similar levels of ADF, but a widerange of CP concentrations (Table 1). Selection was basedon the required laboratory analysis submitted with each en-try in the hay show. An alfalfa sample that had been ana-lyzed previously (Coblentz et al., 1998) was included as acontrol. All samples were dried to constant weight at 122oFand subsequently ground through a 1-mm screen with a Wileymill (Arthur H. Thomas, Philadelphia, Pennsylvania).

AAES Research Series 470
12
Samples were analyzed in the University of Arkansas Rumi-nant Nutrition Lab for nitrogen (N), NDF, ADF, cellulose,lignin, in vitro dry matter disappearance (IVDMD), and invitro organic matter disappearance (IVOMD). Total plant Nwas determined using a macro-Kjeldahl procedure (KjeltecAuto 1030 Analyzer, Tecator, Inc., Herndon, Virginia); CPwas calculated as percent N x 6.25. Neutral detergent fiber(omitting sulfite), ADF, lignin, cellulose, hemicellulose,IVDMD, and IVOMD were determined by or calculated onthe basis of batch procedures outlined by ANKOM Technol-ogy Corp. (Fairport, New York). Prior to analysis, one samplewas assigned to a pair of students. Each student conductedthese analyses in duplicate on their sample.
Energy Equations. After completing the assigned labo-ratory procedures for each sample, students were asked tocalculate TDN using the appropriate prediction equations ofthree states (Arkansas, Missouri, and Florida). Equations areshown below.Florida:
(all forages) TDN = organic matter x(26.8 + [0.595 x IVOMD]) / 100
Arkansas:(legume) TDN = 73.5 + (0.62 x CP) - (0.71 x ADF)(warm-season grass) TDN = 111.8 +
(0.95 x CP) - (0.36 x ADF) - (0.7 x NDF)
Missouri:(legume) TDN = 97.192 - (1.0664 x ADF)(grasses) TDN = 93.9656 - (0.9632 x ADF)
At the end of the semester, students were asked to makean oral presentation in class and submit a written report oftheir work. Results were tabulated and discussed in class. Inthe written report, students were required to evaluate thisactivity and make suggestions to improve it for subsequentclasses. At least one question on the final exam, which wasan oral exam, was based on the class reports and subsequentclassroom discussion.
Results
Forage Analysis. Mean values for quality indices of eachforage sample (from each pair of students) are shown in Table2. Although the students were successful in achieving rela-tively good precision in most laboratory procedures (datanot shown), class results did not agee well with those sub-mitted at the Arkansas Hay Show. Forages B, C, and D hadsimilar ADF concentrations (range = 33.0 to 34.2), but thesevalues were substantially higher than those submitted withthe samples (range = 26.1 to 28.4). Our ADF concentrationfor forage A (25.0%) was somewhat lower than the submit-ted value (28.0%). Generally, agreement between class andsubmitted CP concentrations was better than for ADF. Theseresults illustrated the differences that can occur between labo-ratories.
Digestibility and Energy Calculations. Determinationsof IVDMD, IVOMD, and calculations of TDN are shown inTable 3 and indicate clearly the high quality of thesebermudagrass hays. Estimates of TDN by the Arkansas equa-tion were consistently higher than other estimates; the inclu-sion of CP as a predictor variable in the Arkansas equationfor warm-season grasses clearly had a large impact on pre-dicted TDN values (Fig. 1). Prediction of TDN by other equa-tions was clearly less sensitive to CP concentrations. Con-siderable class discussion time was devoted to possible ex-planations for this trend. Current management practices,particularly the heavy reliance on poultry litter or commer-cial N fertilizer, may drive CP concentrations in bermudagrassbeyond the range in which the Arkansas TDN equations weredeveloped. When this happens, substantial overestimationof TDN may occur.
Class Evaluation. All students were required to evalu-ate this activity in their final written report. Most commentswere favorable; students generally recommended that thisproject be repeated in subsequent classes because it gavethem some practical experience with forage analysis thatcould be useful in the future. Students liked being pairedbecause they could share laboratory responsibilities whenconflicts arose with other commitments. Most felt the workload was reasonable, given there was no scheduled labora-tory period. Some students expressed frustration with someof the calculations. In-depth example calculations will beprovided if the activity is repeated in the future.
Implications
This activity was conducted in an effort to promote bet-ter understanding of forage quality analysis. In addition, itwas designed to help students understand the problems in-herent in predicting the energy content of forages. Studentsgenerally felt the activity was helpful in meeting these goals.This activity may have been most beneficial to students pur-suing advanced degrees in programs other than ruminantnutrition; these students may have no other exposure to theseprocedures during their advanced academic training.
Literature Cited
Coblentz, W.K., et al. 1998. J. Dairy Sci. 81:150-161.

Arkansas Animal Science Department Report 1999
13
Fig. 1. Relationship between CP concentration and predicted TDN values for four bermudagrass samplesselected from the Arkansas Hay Show and evaluated by the students enrolled in ANSC/AGRN 6253.
Table 1. Laboratory analyses submitted with hay samples at the 1998 Arkansas Hay Show.The alfalfa sample had been evaluated previously (Coblentz et al., 1998) and was placed in the
project as a control.
Forage Crude protein ADF
% %Bermudagrass A 22.4 28.0Bermudagrass B 19.6 26.1Bermudagrass C 17.3 27.9Bermudagrass D 15.4 28.4Alfalfa 21.1 34.7

AAES Research Series 470
14
Table 2. Analysis of five test forages by five student pairs.
CrudeForage DM1 OM Ash NDF ADF Hemicellulose Cellulose Lignin Nitrogen protein
% -------------------------------------------------% of DM -----------------------------------------Bermudagrass A 95.3 91.7 8.26 66.1 25.0 41.1 24.5 2.71 3.80 23.9Bermudagrass B 95.9 93.9 6.15 68.2 34.2 34.0 27.4 3.51 3.28 20.5Bermudagrass C 93.0 92.0 7.98 71.0 33.0 38.0 27.3 3.85 2.92 18.3Bermudagrass D 94.4 93.3 6.69 73.6 33.4 40.3 29.6 3.19 2.64 16.5Alfalfa 93.0 90.1 9.97 42.6 31.8 10.8 25.1 5.97 3.41 21.4
1 Abbreviations: DM = dry matter, OM = organic matter, NDF = neutral detergent fiber, and ADF = acid detergentfiber.
Table 3. Determinations of digestibility and energy calculations for five test forages.
Arkansas TDN Missouri TDN Florida TDNForage IVDMD1 IVOMD equation equation equation
% % % % %Bermudagrass A 71.8 70.9 79.2 69.9 63.3Bermudagrass B 67.9 67.3 71.3 61.0 62.8Bermudagrass C 62.1 63.3 67.6 62.2 59.3Bermudagrass D 61.4 59.7 64.0 61.8 58.2Alfalfa 71.4 71.8 64.2 63.3 62.6
1 Abbreviations: IVDMD = in vitro dry matter disappearance, IVOMD = in vitro organic matter disappearance,and TDN = total digestible nutrients.

Arkansas Animal Science Department Report 1999
15
Introduction
Swine production in the southern states has increasedrapidly with most of the increase occurring in sow farms.Typically, pigs are commingled at weaning and reared inoffsite nursery units before being transported to the corn beltfor finishing. The stress of commingling pigs prior to thenursery phase of production and of long distance hauling tofinishing presents a challenge for the swine industry. Growthpromoters such as antibiotics and pharmacological levels ofcopper are commonly added to feed to overcome the poten-tial performance and health problems associated with thesestressful production practices. However, concern over bac-terial resistance to antibiotics and environmental problemswith additions of high levels of trace minerals has challengedthe swine industry to develop alternative products. Polysac-charides derived from yeast cell walls have been shown toimprove performance and enhance immune function. Forinstance, the addition of mannan oligosaccharide (Bio-Mos®)to milk replacer improved gain and intake in young calves(Dvorak and Jacques, 1997). The objective of this studywas to assess the efficacy of Bio-Mos addition to the diets of
Efficacy of Mannan Oligosaccharide (Bio-Mos®) Addition at Two Levelsof Supplemental Copper on Performance and Immunocompetence of
Early Weaned Pigs
Ellen Davis, Charles Maxwell, Beth Kegley, Brenda de Rodas,Kim Friesen, and Dianne Hellwig1
Story in Brief
An experiment involving 216 weanling barrows (1/2 Large White x Duroc x Landrace; 12.7 lb BW and 21 ±2 days of age) was conducted to determine the efficacy of dietary Bio-Mos® addition at two levels of supplemen-tal copper on performance and immune response. Pigs were blocked based on body weight and penned in groupsof six (9 pens/treatment) in an offsite nursery. Dietary treatments were arranged as a 2 x 2 factorial consisting oftwo copper levels (10 and 185 ppm) with and without Bio-Mos (0 or .2%). Experimental diets were fed through-out the study (day 0 to 38, postweaning) and contained 1.50% lysine during Phase 1 (day 0 to 10), 1.35% lysineduring Phase 2 ( day 10 to 24), and 1.20% lysine during Phase 3 (day 24 to 38). Two pigs from each pen were bledto measure in vitro cellular immune response using a lymphocyte blastogenesis assay. During Phase 1, ADG andADFI increased with the addition of Bio-Mos at 10 ppm copper, but decreased at 185 ppm copper (interaction, P< .002 and P < .1, respectively). Similarly, F/G was lower when Bio-Mos was added to diets containing 10 ppmcopper, but increased when Bio-Mos was added at 185 ppm supplemental copper (interaction, P < .02). Pigs feddiets with 185 ppm copper during Phases 2 and 3 had greater (P < .04) ADG and ADFI than those fed 10 ppmcopper, while Bio-Mos addition during Phase 3 resulted in improved ADG (P < .04) and F/G (P < .09) comparedto diets devoid of Bio-Mos. This study indicates that the performance response to Bio-Mos in Phase 1 varied withlevel of dietary copper. However, in Phases 2 and 3, diets containing either Bio-Mos or 185 ppm copper resultedin improved performance.
1 All authors are associated with the Department of Animal Science, Fayetteville.
weanling pigs, and compare their performance to pigs fedhigh copper diets.
Experimental Procedures
A total of 216 weanling barrows were transported to anoffsite nursery and blocked according to initial body weight(BW). Pigs within each block were allotted into equal sub-groups (six pigs/pen) and randomly assigned to treatmentswithin each block. Four dietary treatments consisting of twolevels of inorganic copper (10 or 185 ppm) with and withoutthe addition of Bio-Mos (0 or 0.2%) were arranged as a 2 x 2factorial and fed during Phase 1 (day 0 to 10), Phase 2 (day10 to 24), and Phase 3 (day 24 to 38). Basal diets in each ofthe three phases (Table 1) were supplemented with 0.07%copper sulfate (CuSO4) or 0.2% Bio-Mos at the expense ofcorn to provide four diets in each phase with and withoutBio-Mos and with and without 175 ppm supplemental CuSO4.
Pig BW and feed intake were determined at the initia-tion and termination of Phase 1, and weekly during Phases 2and 3. Average daily gain, ADFI, and F/G were calculated.In vitro cellular response was measured using a lymphocyte

AAES Research Series 470
16
blastogenesis assay (Blecha et al., 1983). One 15 ml hep-arinized blood sample was taken via venipuncture for isola-tion of mononuclear cells from two randomly selected pigsin each pen (total of 18 pigs/treatment, 72 pigs total). Sampleswere obtained on day 28, 30, 32, and 34 of the study with25% of the pens sampled on each of the four days. Phytohe-magglutinin (PHA) and pokeweed mitogen (PWM) wereused as mitogens at a concentration of 50 and 25 mg/ml,respectively. Incubation, radioactive labeling, and cell har-vesting followed procedures outlined by van Heugten andSpears (1997).
Performance data and lymphocyte proliferation wereanalyzed as a randomized complete block design with penas the experimental unit. Analysis of variance was performedusing the GLM procedure of SAS (1988), and the effects ofCuSO
4, Bio-Mos, and CuSO
4 x Bio-Mos interaction were
evaluated.
Results and Discussion
Treatment means are presented where a CuSO4 x Bio-
Mos interaction was observed (Table 2), while data in whichno interaction was observed and the results of the lympho-cyte proliferation assay are presented as main effect means(Table 3). During Phase 1, ADG, ADFI, and F/G improvedwith the addition of Bio-Mos at 10 ppm copper, but ADGand ADFI decreased and F/G increased with Bio-Mos addi-tion at 185 ppm copper (interaction, P < .02, P < .1, P < .02,respectively). Pigs fed diets supplemented with 185 ppmcopper during Phase 2 and Phase 3 had greater ADG (P <.003 and P < .02 for Phases 2 and 3, respectively) and ADFI(P < .02 and P < .04 for Phases 2 and 3, respectively) thanthose fed diets with 10 ppm copper. Feed conversion waslower (P < .02) during Phase 2 when pigs were fed the higherlevel of copper. Additionally, ADG (P < .04) and F/G (P <.09) were improved in pigs fed diets supplemented with Bio-Mos in Phase 3 compared to pigs fed diets without Bio-Mos.For the overall trial (day 0 to 38), pigs fed diets containing185 ppm copper had greater (P < .003) ADG and ADFI, andlower (P < .003) F/G than those fed diets containing 10 ppmcopper. Pigs fed Bio-Mos had improved ADG (P < .04) andF/G (P < .01) than those fed diets with no Bio-Mos.
The performance results of this study are consistent withprevious results in young pigs and poultry. As in the presentstudy, Schoenherr et al. (1994) and Van der Beke (1997) re-ported improved weight gain and feed efficiency in wean-ling pigs when oligosaccharides were added to the diet, andaddition of Bio-Mos improved rate of gain (Stanley et al.,1996) and efficiency (Kumprecht and Zoba, 1997) in broilerchicks.
Previous research has reported that a yeast glucan en-hances non-specific immunity in fish (Raa et al., 1992;Engstad et al., 1992). In the present study, the effect of Bio-Mos on the immunocompetence of weanling pigs was evalu-ated by mitogen-stimulated lymphocyte proliferation. Al-though proliferation was numerically greater in stimulatedcell cultures from pigs fed Bio-Mos, neither Bio-Mos nor
dietary copper had a significant effect on lymphocyte prolif-eration. This lack of significant response may be attributedto the high level of variability observed in the animals thatwere sampled.
Implications
Pig performance in response to Bio-Mos addition dur-ing Phase 1 varied with level of dietary copper. However, inPhases 2 and 3, diets containing either Bio-Mos or 185 ppmcopper resulted in improved performance. This study sug-gests that Bio-Mos may be an acceptable alternative to theinclusion of high levels of dietary copper in nursery pig di-ets.
Literature Cited
Blecha, F., et al. 1983. J. Anim. Sci. 56:396.Dvorak, K.A. and K.A. Jacques. 1997. J. Anim. Sci. 75(Suppl.
1):22.Engstad, R.F., et al. 1992. Fish and Shellfish Immunology.
2:287.Kumprecht, I. and P. Zoba. 1997. Poultry Sci.76(Suppl
1):132.Raa, J. et al. 1992. In: Diseases in Asian Aquaculture. I.M.
Shariff, R.P. Subasinghe, and R.J. Authur (eds.). pp 39-50.
SAS. 1988. SAS Inst. Inc., Cary, North Carolina.Schoenherr, W.D., et al. 1994. J. Anim. Sci. 72(Suppl. 1):57.Stanley, V.G., et al. 1996. Poultry Sci. 75(Suppl 1):61.Van der Beke, N. 1997. Thesis, Department of Biotechno-
logical Sciences, Landscape Management and Agricul-ture, Gent, Belgium.
van Heugten, E. and J.W. Spears. 1997. J. Anim. Sci. 75:409.

Arkansas Animal Science Department Report 1999
17
Table 1. Composition of basal dietsa.
Item, % Phase 1 Phase 2 Phase 3
Yellow corn 39.32 48.11 62.375Steam rolled oats 5.00 - -Deproteinized whey 17.50 10.00 -Processed soy protein (Optipro) 6.75 - -Soybean meal, 48% CP 10.00 28.30 30.00AP-301 2.00 2.00 -AP-920 3.75 - -Select menhaden fish meal 8.50 4.00 -Soybean oil 4.00 4.00 -Fat - - 4.00Ethoxyquin .03 .03 .03Lysine HCl - - .16Threonine .05 - -Methionine .15 .08 .02Tylan-40 - - .125Neoterromycin 10/5 1.00 1.00 -Mineral premix (NB-8557B)b .10 .15 .15Vitamin premix (NB-6157B)b .15 .25 .25Dicalcium phosphate 1.30 1.40 1.88Calcium carbonate .10 .38 .61Salt .30 .30 .40Calculated compositionLysine 1.50 1.35 1.20Threonine .98 .87 .77Tryptophan .27 .26 .24Met + Cys .90 .82 .72Calcium .90 .80 .80Phosphorus .80 .70 .70Metabolizable energy, kcal/lb 1537 1542 1563Lactose 14.53 8.3 -
a Basal diets were supplemented with 0.07% CuSO4 or 0.2% Bio-Mos to provide four diets in each phase with
and without Bio-Mos and with and without 175 ppm copper from CuSO4. Copper and Bio-Mos were added at
the expense of corn.b Vitamins and minerals met or exceeded NRC requirements, 1998.
Table 2. Treatment means showing interaction effects of Bio-Mos and CuSO4 on gain, feed intake, and
feed conversion of segregated early weaned pigs.
Control CuSO4
Bio-Mos CuSO4/Bio-Mos
Treatment1 2 3 4 SE
Phase 1 (d 0 to 10) ADG, lb a .23 .48 .35 .41 .03 ADFI, lb b .54 .69 .60 .62 .04 F/G a 2.50 1.47 1.79 1.50 .13
a CuSO4 x Bio-Mos“ interaction; P < .02.
b CuSO4 x Bio-Mos“ interaction; P < .10.
AAES Research Series 470
18
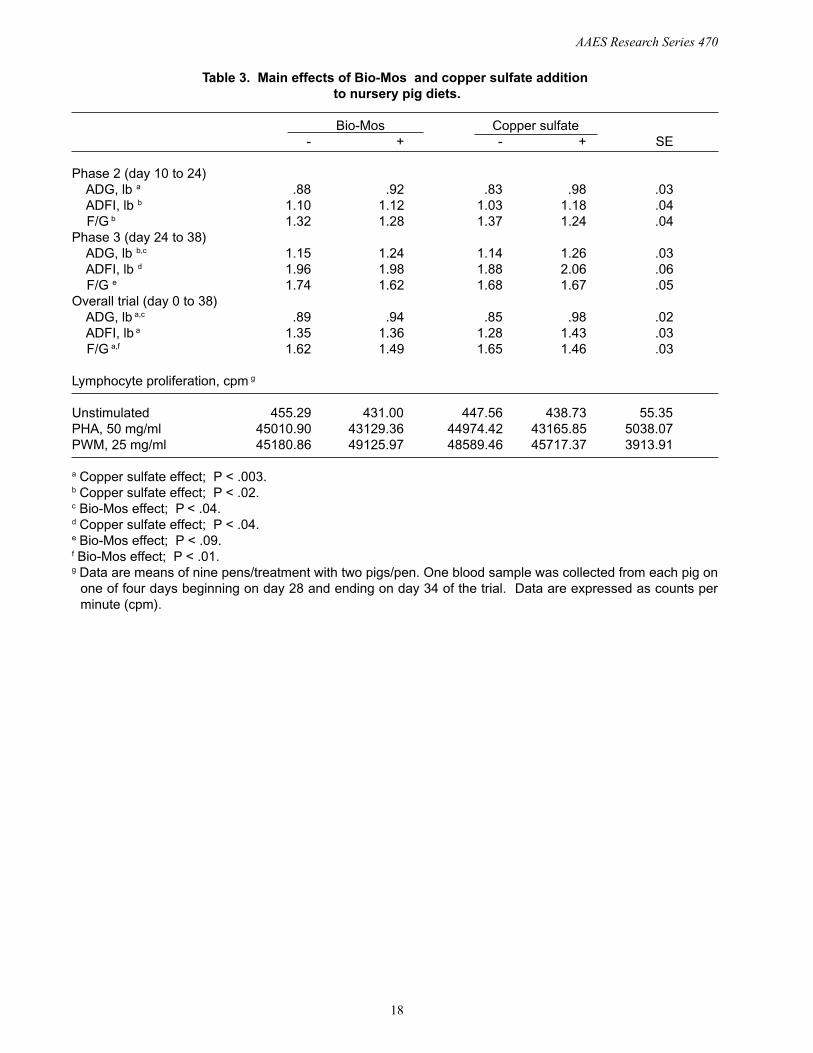
Table 3. Main effects of Bio-Mos and copper sulfate addition to nursery pig diets.
Bio-Mos Copper sulfate- + - + SE
Phase 2 (day 10 to 24) ADG, lb a .88 .92 .83 .98 .03 ADFI, lb b 1.10 1.12 1.03 1.18 .04 F/G b 1.32 1.28 1.37 1.24 .04Phase 3 (day 24 to 38) ADG, lb b,c 1.15 1.24 1.14 1.26 .03 ADFI, lb d 1.96 1.98 1.88 2.06 .06 F/G e 1.74 1.62 1.68 1.67 .05Overall trial (day 0 to 38) ADG, lb a,c .89 .94 .85 .98 .02 ADFI, lb a 1.35 1.36 1.28 1.43 .03 F/G a,f 1.62 1.49 1.65 1.46 .03
Lymphocyte proliferation, cpm g
Unstimulated 455.29 431.00 447.56 438.73 55.35PHA, 50 mg/ml 45010.90 43129.36 44974.42 43165.85 5038.07PWM, 25 mg/ml 45180.86 49125.97 48589.46 45717.37 3913.91
a Copper sulfate effect; P < .003.b Copper sulfate effect; P < .02.c Bio-Mos effect; P < .04.d Copper sulfate effect; P < .04.e Bio-Mos effect; P < .09.f Bio-Mos effect; P < .01.g Data are means of nine pens/treatment with two pigs/pen. One blood sample was collected from each pig on
one of four days beginning on day 28 and ending on day 34 of the trial. Data are expressed as counts perminute (cpm).

Arkansas Animal Science Department Report 1999
19
1 All authors are associated with the Department of Animal Science, Fayetteville.
Effect of Feeding Bacillus Cultures on Performance of Growing-Finishing Swineand on Pen Cleaning Characteristics.
C.V. Maxwell, M.E. Davis, and D. Brown1
Story In Brief
A total of 112 crossbred gilts and barrows (Hampshire x Duroc sires mated to crossbred sows) were used in thisstudy to determine the effect of feeding Bacillus cultures (MicroSourceTM “S”) on gain, feed efficiency, time re-quired to clean pens, and on the dispersion characteristics of manure build-up in the pen. Average daily gain wassimilar among pigs fed the control diet or those fed MicroSource “S” in the starter, grower, and finisher diets andfor the overall study. Pigs fed MicroSource “S” tended to consume less feed and tended to be more efficient in thestarter, grower, and finisher phase of the study and for the overall study when compared to those fed the controldiet. The time required to dissolve the manure mat was reduced by 33% in samples from pens where MicroSource“S” was fed when compared to samples from pens fed the control diet devoid of MicroSource “S”. The improveddispersion characteristics resulted in a 17.5% reduction in the time required to clean pens. This study suggests thatfeeding MicroSource “S” results in similar gain to control animals with a small reduction in feed intake, which isaccomplished by a small improvement in feed efficiency. In addition, this study suggests that the manure decom-position process by which MicroSource “S” prevents solids build-up in pits is enhanced prior to the placement ofmanure in the pit.
Introduction
Two major problems with the management of swinemanure from pit storage systems are the production and ac-cumulation of noxious odors and ammonia in confinementbuildings and a build-up of manure solids. In recent years,the control of odors from swine production facilities has be-come a major issue for producers. With this has come aplethora of new manure treatment products. Unfortunately,many products on the market today which claim to reduceodor problems have no proven efficacy and are costly. Al-though some products have been shown to reduce odors, noneof these products has effectively or economically addressedthe cause of the problem, i.e. the decomposition process.Therefore, symptoms are treated but the root problem is notaddressed.
Recently, researchers at Agtech Products, Inc. have de-veloped a feed additive consisting of viable Bacillus bacte-ria which were selected for their ability to alter the decom-position process and effectively prevent the build-up of sol-ids, volatile fatty acids, and ammonia in swine manure(Hammond et al., 1998; Turner et al., 1998). This feed addi-tive is now commercially available from Loveland Indus-tries, Inc., of Greeley Colorado and is marketed as Micro-SourceTM “S”. The partial decomposition of the manure sol-ids build-up in pens appears to reduce the difficulty and time
required to clean pens between groups of pigs. AlthoughMicroSource “S” may have an effect on altering the nutrientdegradation process in the intestinal tract, studies have notbeen conducted to determine the effect of MicroSource “S”on feed efficiency or pig performance. Therefore, this studywas conducted to determine the effect of feeding Micro-Source “S” on performance and pen cleaning characteristics.
Experimental Procedures:
Allotment of pigs: A total of 112 crossbred gilts andbarrows (Hampshire x Duroc sires mated to crossbred sows)were used in this study, which was conducted at the Univer-sity of Arkansas swine farm. Pigs were moved from nurseryfacilities and fed the same medicated starter diet for one weekprior to the initiation of the trial. Pigs were blocked by weightand allotted within block to equal subgroups (seven pigs/pens) based on litter and sex. Treatments were then assignedto pens within each of the weight groups. A total of eightpens were randomly allotted to each of two treatments, whichcontinued throughout the starter, growing, and finishing pe-riods. Pens assigned to treatment were scattered throughoutthe growing-finishing building to avoid direct contact of pigsfrom Bacillus treated pens with those receiving the controldiet.

AAES Research Series 470
20
Experimental Treatments:
Two dietary treatments consisted of two levels ofMicroSource “S” (0, or .05% MicroSource “S”) in the starter,grower, and finisher diets (Table 1). The specific diets con-sisted of the following:
1) Treatment 1 - Control diet devoid of MicroSource “S”.2) Treatment 2 - Control diet + 0.05% MicroSource “S” (1 lb of MicroSource “S” per ton of feed).
A three-phase finishing program was used in the studywith diet transition from starter to grower and from growerto finisher occurring when the mean weight of each blockreached approximately 75 and 150 pounds, respectively. Thecontrol diet met or exceeded NRC (1988) requirements. Dietswere formulated to contain 1.1% lysine during the starterperiod, 0.96% lysine during the grower period and 0.85%lysine during the finisher period.
Performance data: Pigs were removed from the studyweekly as individuals reached approximately 230 pounds.Data collected were average daily gain, average daily feedintake, and feed required per unit of gain during the starter,grower, and finisher periods.
Pen cleaning time: The actual time required to cleanpens with a combination of scraping and high pressure clean-ing (2200 PSI high pressure cleaner) was determined uponcompletion of the feeding trial.
Dispersibility of manure build-up in the pen: Pens usedin this study were 5’ x 13’ with 9’ of solid concrete and 4’ ofconcrete slats over a pit. Manure build-up typical of par-tially slatted pens was evident during the study. Two approxi-mately 100-gram samples of the manure solids build-up (ma-nure mat) in the solid concrete section in each pen were ob-tained from two locations in the pen. A small rectangularshaped manure mat sample weighing approximately 4.0g(3.85 to 4.09g) was cut from each manure mat. The sampleswere placed in a beaker with 500 ml of water at 25°C with astirrer. The time required to completely disperse the solidmass with stirring action as evidenced by visual inspectionwas determined (minutes/g of sample).
Statistical Analysis: Performance data were analyzedas a randomized complete block design with pen as the ex-perimental unit and blocks based on initial body weight.Analysis of variance was performed using the GLM proce-dures of SAS (1988).
Results and Discussion
Average daily gain was similar among pigs fed the con-trol diet or those fed MicroSource “S” for each phase of thestudy as well as overall (Table 2). Pigs fed MicroSource “S”
consumed less feed in the starter, grower, and finisher phaseof the study and overall when compared to those fed the con-trol diet with differences approaching significance in thegrower phase (P=.12) and for the overall study (P=.13). Themagnitude of reduction in feed intake was 2.7% for the overallstudy. Similarly, feed efficiency was improved in pigs fedMicroSource “S” in each phase of the study with differencesapproaching significance in the starter (P<.1) and for theoverall trial (P=.14). The magnitude of improvement in feedefficiency was 4.3% for the overall study. This study sug-gests that pigs fed MicroSource “S” have similar gain whencompared to non-supplemented pigs, which is the result of asmall reduction in feed intake accompanied by a small im-provement in feed efficiency.
The time required to pressure wash pens of theMicroSource “S” treated group was reduced by 17.5% fromcontrol group time, although differences were not signifi-cant. Correspondingly, the time required to dissolve the ma-nure mat was reduced by 33% (P < .03) in samples frompens where MicroSource “S” was fed as compared to samplesfrom pens fed the control diet devoid of MicroSource “S”.The observation that the decomposition process of the ma-nure mat was enhanced in pens when pigs are fedMicroSource “S” is consistent with the observation that vi-able Bacillus strains selected for their ability to alter the de-composition process can effectively prevent solids build-upin pits (Hammond et al., 1998). This study suggests that thedecomposition process is enhanced prior to the placementof manure in the pit. Alteration of the decomposition pro-cess has also been associated with a reduction in volatilefatty acids in swine manure (Hammond et al., 1998) and re-duced ammonia volatilization (Turner et al., 1998).
Literature Cited
Hammond, E., T. Rehberger, J. O’Neil, T. Parrott, and A.Veldkamp. 1998. pp. 113-116. Proceedings of the Ameri-can Association of Swine Practitioners. Des Moines, Iowa.
SAS. 1988. SAS Inst. Inc., Cary, North Carolina.Turner, L.W., R.S. Gates, G.L. Cromwell, J.L. Tarabe, and
H.J. Monegue. 1998. Continuous measurement of ammo-nia and harmful gaseous emissions from simulated ma-nure pits. Paper 984059, Annual Meeting of ASAE, Or-lando Florida.

Arkansas Animal Science Department Report 1999
21
Table 1. Composition of research diets.
Starter Grower FinisherIngredient, % Control Treatment Control Treatment Control Treatment
Corn 62.660 62.610 64.540 64.490 68.860 68.810Soybean Meal, 48% 31.160 31.160 26.110 26.110 22.250 22.250Fat, An & Veg 2.600 2.600 5.650 5.650 5.500 5.500Phosphate, Dical 1.650 1.650 1.800 1.800 1.400 1.400Limestone 0.970 0.970 0.920 0.920 1.210 1.210Salt 0.500 0.500 0.500 0.500 0.500 0.500Vit TM Premix 0.250 0.250 0.250 0.250 0.150 0.150Tylosin - 40 0.125 0.125 0.125 0.125 0.050 0.050Copper sulfate 0.050 0.050 0.070 0.070 0.050 0.050Ethoxyquin 0.030 0.030 0.030 0.030 0.030 0.030MicrosourceTM “S” 0.000 0.050 0.000 0.050 0.000 0.050
Composition calculated, TotalProtein, crude 19.880 19.880 17.620 17.620 16.090 16.090Lysine 1.100 1.100 0.960 0.960 0.850 0.850Methionine 0.330 0.330 0.300 0.300 0.280 0.280Met & Cys 0.650 0.650 0.590 0.590 0.550 0.550Threonine 0.780 0.780 0.690 0.690 0.630 0.630Tryptophan 0.270 0.270 0.230 0.230 0.210 0.210Calcium 0.800 0.800 0.800 0.800 0.700 0.700Phosphorus 0.690 0.690 0.690 0.690 0.600 0.600
Composition calculated, AvailableProtein, Dig. 16.050 16.050 14.280 14.280 13.100 13.100Lys - Swine Dig. 0.910 0.910 0.780 0.780 0.690 0.690Met - Swine Dig. 0.270 0.270 0.250 0.250 0.230 0.230M & C - Sw. Dig. 0.470 0.470 0.420 0.420 0.400 0.400Thr - Swine Dig. 0.590 0.590 0.520 0.520 0.470 0.470Trp - Swine Dig. 0.170 0.170 0.150 0.150 0.130 0.130Phosphorous 0.450 0.450 0.470 0.470 0.390 0.390

AAES Research Series 470
22
Table 2. Effect of MicrosourceTM-“S” on performance of growing-finishing pigsand pen cleaning characteristics.a
Control MicrosourceTM-“S” Std Err
Phase 1b
ADG, kg 0.50 0.50 0.019 ADFI, kg 1.28 1.25 0.044 Feed:gain 2.56 2.51 0.113Phase 2c
ADG, kg 0.86 0.87 0.024 ADFI, kgd 2.34 2.25 0.036 Feed:gaine 2.73 2.60 0.047Phase 3f
ADG, kg 1.00 1.02 0.031 ADFI, kg 3.02 2.97 0.067 Feed:gain 3.02 2.92 0.070Combinedg
ADG, kg 0.79 0.80 0.012 ADFI, kgh 2.21 2.15 0.027 Feed:Gaini 2.79 2.67 0.059Clean Time, min Scrape time 19.11 19.84 6.55 Wash time 13.60 11.22 2.07 Total time 32.71 31.06 8.46Dissolve Time, minj 54.38 36.40 5.64
aData is comprised of 96 pigs (16 pens with six pigs/pen and eight pens/treatment).bPhase 1 consisted of pigs from 50-75 lb.cPhase 2 consisted of pigs from 75-150 lb.dTreatment effect, P=.12.eTreatment effect, P<.10.f Phase 3 consisted of pigs from 150-230 lb.gCombined data is comprised of pigs from 50 to 230 lb.hTreatment effect, P=.13.i Treatment effect, P=.14.j Time Required to dissolve manure mat in water. Treatment effect, P <.03.

Arkansas Animal Science Department Report 1999
23
Influence of Magnesium-Mica on Performance and Carcass Quality Traits of Growing-Finishing Swine1
Jason Apple, Charles Maxwell, Brenda de Rodas, Jesse Davis, and Lillie Rakes2
Story in Brief
A total of 120 crossbred gilts and barrows were used to determine the effect of feeding Magnesium-Micaduring the growing-finishing period on gain, efficiency of gain, and on carcass traits. Inclusion of Magnesium-Mica in the diet at 1.25 or 2.50% had no deleterious (P > .10) effect on average daily gain, average daily intake, orfeed efficiency. Carcasses from pigs fed 1.25% Magnesium-Mica were trimmer (P < .05) and had higher (P < .10)lean muscle yields than carcasses from pigs fed the control diet. Additionally, pork loins from pigs fed 1.25%Magnesium-Mica had higher (P < .05) ultimate muscle pH values, and lower (P < .10) CIE a* and b* valuescompared to pork loins from swine fed the control diets or 2.50% Magnesium-Mica. Results from this studysuggest that Magnesium-Mica addition to swine diets may reduce cost of gain without affecting performance, andmay provide ingredients that improve lean muscle yields and affect pork quality.
Introduction
Magnesium-Mica is used primarily in the feed industryas a pellet binder and as a carrier for micro-mineral premixes.Some studies, however, indicate that Magnesium-Mica mayhave additional nutritional benefits beyond the excellentphysical characteristics. In a recent study in our laboratory(Maxwell et al., 1998), inclusion of Magnesium-Mica in thediet of growing-finishing swine at levels of 1.25 or 2.50%had no deleterious effect on average daily gain (ADG), av-erage daily feed intake (ADFI), or feed-to-gain ratio (F:G),and decreased the cost of gain. Color score measured at the10th rib was improved in carcasses from pigs fed Magne-sium-Mica when compared to carcasses from pigs fed a con-trol diet devoid of supplemental magnesium. This is consis-tent with the observations of D’Souza et al. (1998), who re-ported improvements in subjective color scores of pork frompigs fed a diet supplemented with magnesium-aspartate. Ad-ditionally, D’Souza and co-workers (1998) found that inclu-sion of magnesium-aspartate in the diet of finishing pigs re-duced longissimus muscle drip loss percentage. Therefore,the primary objective of this study was to confirm the ef-fects of Magnesium-Mica in the diet of growing-finishingpigs on performance traits and to further evaluate the effi-cacy of Magnesium-Mica in improving carcass quality.
Experimental Procedures
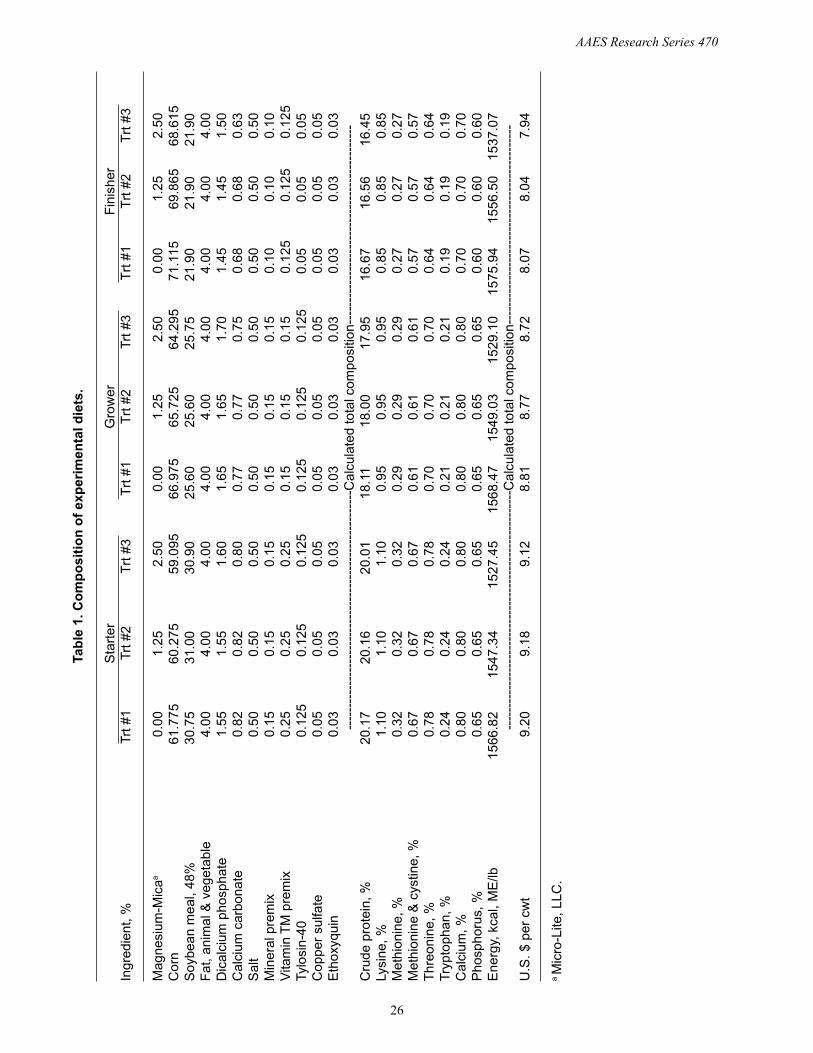
One hundred and twenty crossbred gilts and barrowswere moved from the nursery unit to the University of Ar-kansas Swine Farm, and blocked by weight, litter, and sexand randomly allotted to 24 pens (five pigs/pen) at an aver-age weight of 45 to 50 lb. Pigs were fed a three-phase dietwith transition from starter to grower and from grower tofinisher occurring when the mean weight of each blockreached approximately 75 and 150 lb, respectively. A totalof eight pens were randomly allotted to each of three treat-ments: 1) control diet (0%) that met or exceeded NRC (1988)requirements; 2) control diet supplemented with 25 lb of Mag-nesium-Mica per ton of feed (1.25%) added at the expenseof corn; and 3) control diet supplemented with 50 lb of Mag-nesium-Mica per ton of feed (2.50%) added at the expenseof corn. All pigs received a standard corn-soybean meal dietformulated to contain 1.1% lysine during the starter phase,0.95% lysine during the growing period, and 0.85% lysineduring the finishing phase (Table 1). During each feedingphase, farm personal recorded ADG, ADFI, and F:G infor-mation.
When the lightest block averaged 235 lb, all pigs weretransported approximately 450 miles to the Seaboard Farms,Inc., pork packing plant in Guymon, Oklahoma. After a 24-
1 The authors wish to express their appreciation to Ben Wheeler (Seaboard Farms, Inc.) and Brent Green (PIC USA) for assisting withcarcass data collection. Additionally, the authors would like to thank Joe Liebbrandt, Ashley Hays, Ellen Davis, and Lance Kirkpatrick foranimal care and performance data collection, Lillie Rakes, Jesse Davis, John Hankins, Levi McBeth, and Matt Stivarius for assisting withloin fabrication and data collection, and Dr. Zelpha Johnson for statistical consultation.
2 All authors are associated with the Department of Animal Science, Fayetteville.

AAES Research Series 470
24
hour chilling and tempering period, carcasses were fabri-cated, and subjective evaluations of muscle firmness, mar-bling, and color (NPPC and Japanese color scores) were madeby plant personnel on the loin eye muscle of boneless porkloins after a 30-minute “bloom” period. CommissionInternationale de L’Eclairage (CIE) L*a*b* (CIE, 1976) re-flectance values were measured with a Minolta CR-310BChroma Meter (Minolta Camera, Higashi-Hu, Osaka, Japan)and 24-hour muscle pH was measured using an automatedpH probe on each loin. Boneless pork loins were subsequentlyvacuum-packaged and shipped to the University of Arkan-sas Red-Meat Abattoir for further carcass quality measure-ments. At approximately 48 hours postmortem, a 2-inch portionof the loin (cranial end) was removed, and a 2-g sample wasexcised for muscle pH measurement following the protocoloutlined by Bendall (1973). Boneless loin chops were re-moved perpendicular to the muscle fiber orientation in thefollowing order: 1) 1-inch thick chop; 2) 1.5-inch thick chop;3) 1-inch thick chop; and 4) 1.5-inch thick chop.
The two 1.5-inch thick chops were used for drip lossdeterminations following the suspension procedure ofHonikel et al. (1986). A 1.5-inch diameter core was removedfrom each 1.5-inch thick chop, weighed, and suspended on afishhook (barb removed) mounted to the lid of a plastic con-tainer (18 inches deep x 15 inches wide x 24 inches long),and stored at 34°F. After 48 hours, each core was blottedwith a paper towel and reweighed. The loss in weight due todrip and evaporation was divided by the original weight, mul-tiplied by 100, and reported as drip loss percentage. Twoadditional 1-in thick chops were removed from the loin, and,after a 45-minute bloom period, NPPC and Japanese colorscores were recorded, along with marbling scores. Also, CIEL*a*b* values were collected with a Hunter MiniScan XE(Hunter Associates Laboratory, Inc., Reston, Virginia).
Performance data were analyzed as a randomized com-plete block design with pen as the experimental unit andblocks based on initial weight. Analysis of variance was per-formed using the GLM procedure of SAS (1988). Linear andquadratic polynomials were used to detect the response toinclusion level of Magnesium-Mica in the diet (0, 1.25, and2.50%). Pork quality data was also analyzed with the GLMprocedure, and Magnesium-Mica level, sex and block werethe main effects in the model. Means were separated statisti-cally using the least significant difference procedure (SAS,1988).
Results and Discussion
Inclusion of Magnesium-Mica in the diet at either 1.25or 2.50% had no effect (P > .10) on ADG, ADFI, or feedefficiency (F:G) during the starter, grower, or finisher peri-ods (Table 2). This is consistent with our laboratory’s earlierfindings (Maxwell et al., 1998). Moreover, Coffey and Brazle(1995) and Coffey et al. (1995) reported that performance ofcattle was not affected by inclusion of Magnesium-Mica infeedlot diets.
The effects of Magnesium-Mica on carcass characteris-tics are presented in Table 3. Pigs fed the control diet werefatter (P < .05) at the 10th rib than pigs fed 1.25% Magne-sium-Mica. Even though loin eye depth was not affected (P> .10) by inclusion of Magnesium-Mica, pigs fed 1.25%Magnesium-Mica had higher (P < .10) lean muscle yieldsthan pigs fed the control diets. In our earlier trial (Maxwellet al., 1998), we failed to observe any differences in backfatmeasurements, loin eye area, or percent muscle. Our infor-mation also contradicts the findings of D’Souza et al. (1998)and Schaefer et al. (1993), who reported that inclusion ofmagnesium-aspartate in the finishing diets of pigs had noeffect on carcass fat and muscling measurements.
Inclusion of Magnesium-Mica in growing-finishing di-ets had no effect (P > .10) on marbling scores, firmness scores,or NPPC color and Japanese color scores (Table 3). More-over, magnesium-supplementation had no effect (P > .10)on loin eye muscle pH or Minolta CIE L*, a*, and b* values.Pork quality data collected at the University of Arkansas 48hours after slaughter are presented in Table 4. Pork loins frompigs fed 1.25% Magnesium-Mica had higher (P < .05) musclepH values than pigs fed the control diet or 2.50% Magne-sium-Mica. Inclusion of Magnesium-Mica in the diets ofgrowing-finishing swine had no (P > .10) appreciable ef-fects on marbling or color scores. Additionally, Magnesium-Mica had no effect (P > .10) on objective measurements oflightness/darkness (L* values) taken at the University ofArkansas some 48 hours after slaughter. However, loin eyemuscles from pigs fed 1.25% Magnesium-Mica were less (P< .10) red and less (P < .05) yellow (indicated by lower a*and b* values, respectively) than the loin eye muscle frompigs fed the control diet or 2.50% Magnesium-Mica. Addi-tionally, the loin eye muscle from pigs fed 1.25% Magne-sium-Mica had a lower (P < .05) mean saturation index com-pared to the other dietary treatments, indicative of a less vivid,or pure, color.
Typically, the higher the muscle pH the darker the color,and muscle pH values below 5.3 are used to define the PSEcondition in pork muscle. Even though the loin eye musclefrom pigs supplemented with 1.25% had the highest musclepH values, the muscle color was determined to be less red(lower a* values) and less “vivid” (lower saturation indexvalues) than loin eye muscles from pigs fed control diets or2.50% Magnesium-Mica.
The failure of dietary inclusion of Magnesium-Mica toimprove loin eye muscle color was somewhat disturbing con-sidering that previous research from our laboratory showedthat the mean NPPC color score increased with increasingMagnesium-Mica in the diet (Maxwell et al., 1998). How-ever, this may be attributed to two primary differences be-tween these trials. First, the genetics of pigs at the Univer-sity of Arkansas Swine Farm have changed considerably sincethe initial study, with a concerted effort to remove all hal-othane-positive and carrier genetics. Second, carcasses werechilled differently following slaughter. Pigs in the previousstudy (Maxwell et al., 1998) were slaughtered at the Univer-sity of Arkansas and carcasses were chilled conventionally

Arkansas Animal Science Department Report 1999
25
for 24 hours in a 34°F cooler, whereas carcasses in the presentstudy were exposed to a rapid-chill system (carcasses areexposed to –40°F temperatures during the first 4 to 6 hoursof chilling, then stored at 34°F until fabrication at approxi-mately 24 hours postmortem). This system has been shownto effectively reduce the incidence of pale, soft, and exuda-tive (PSE) carcasses. In the first study (Maxwell et al., 1998),the improvement in NPPC color scores was attributed to areduction in carcasses receiving a color score of 1, which isindicative of PSE meat; thus, the rapid-chill system, em-ployed in the present study, could have reduced and/or elimi-nated any marginally PSE-type carcasses.
Finally, inclusion of Magnesium-Mica in diets of grow-ing-finishing swine had no effect (P > .10) on drip loss per-centages (Table 4). Our results conflict with those of Schaeferet al. (1993) and D’Souza et al. (1998), who reported thatsupplementing finishing diets with magnesium-aspartate, ata rate of 40 g/pig for five days prior to slaughter, reduced thepercentage of drip loss. Again, the failure to elicit an effecton drip loss may be a reflection in the genetic-line of swineused and the different chilling procedures used during eachexperiment
Implications
Results from this study confirm that inclusion of Mag-nesium-Mica in the diet of growing-finishing swine at a levelof 1.25 or 2.50% has no deleterious effects on live animalperformance, and may decrease cost of gain. Even thoughno improvements in pork color, and other pork quality at-tributes, were noted, inclusion of Magnesium-Mica at a rateof 1.25% may have beneficial effects on fat depth and leanmuscle yields.
Literature Cited
Bendall, J.R. 1973. In: G. H. Bourne (ed.). Structure andFunction of Muscle. Vol. 2. p 244. Academic Press, NewYork.
CIE. 1976. Commission Internationale de l’Eclairage, Paris.Coffey, K.P., and F.K. Brazle. 1995. Southeast Agric. Res.
Center, Agric. Exp. St., Kansas State Univ., Manhattan.Prog. Rep. 733:15.
Coffey, K.P., et al. 1995. Southeast Agric. Res. Center, Agric.Exp. St., Kansas State Univ., Manhattan. Prog. Rep.733:20.
D’Souza, D.N., et al. 1998. J. Anim. Sci. 76:104.Honikel, K.O., et al. 1986. Meat Sci. 16:267.Maxwell, C.V., et al. 1998. Ark. Anim. Sci. Dept. Rep. 1:115.NPPC. 1991. Procedures to Evaluate Market Hogs (3rd Edi-
tion). Des Moines, Iowa.NRC. 1988. Nutrient Requirements of Swine (10th Edition).
National Academy Press, Washington, DC.SAS. 1988. SAS Inst., Inc., Cary, North Carolina.Schaefer, A.L., et al. 1993. Can. J. Anim. Sci. 73:231.
AAES Research Series 470
26
Tab
le 1
. Co
mp
osi
tio
n o
f ex
per
imen
tal d
iets
.
Sta
rter
Gro
wer
Fin
ishe
rIn
gred
ient
, %Tr
t #1
Trt #
2T
rt #
3T
rt #
1T
rt #
2Tr
t #3
Trt
#1
Trt
#2
Trt
#3
Mag
nesi
um-M
icaa
0.00
1.25
2.50
0.00
1.25
2.50
0.00
1.25
2.50
Cor
n61
.775
60.2
7559
.095
66.9
7565
.725
64.2
9571
.115
69.8
6568
.615
Soy
bean
mea
l, 48
%30
.75
31.0
030
.90
25.6
025
.60
25.7
521
.90
21.9
021
.90
Fat
, ani
mal
& v
eget
able
4.00
4.00
4.00
4.00
4.00
4.00
4.00
4.00
4.00
Dic
alci
um p
hosp
hate
1.55
1.55
1.60
1.65
1.65
1.70
1.45
1.45
1.50
Cal
cium
car
bona
te0.
820.
820.
800.
770.
770.
750.
680.
680.
63S
alt
0.50
0.50
0.50
0.50
0.50
0.50
0.50
0.50
0.50
Min
eral
pre
mix
0.15
0.15
0.15
0.15
0.15
0.15
0.10
0.10
0.10
Vita
min
TM
pre
mix
0.25
0.25
0.25
0.15
0.15
0.15
0.12
50.
125
0.12
5Ty
losi
n-40
0.12
50.
125
0.12
50.
125
0.12
50.
125
0.05
0.05
0.05
Cop
per
sulfa
te0.
050.
050.
050.
050.
050.
050.
050.
050.
05E
thox
yqui
n0.
030.
030.
030.
030.
030.
030.
030.
030.
03--
----
----
----
----
----
----
----
----
----
----
----
----
----
Cal
cula
ted
tota
l com
posi
tion-
----
----
----
----
----
----
----
----
----
----
----
Cru
de p
rote
in, %
20.1
720
.16
20.0
118
.11
18.0
017
.95
16.6
716
.56
16.4
5Ly
sine
, %1.
101.
101.
100.
950.
950.
950.
850.
850.
85M
ethi
onin
e, %
0.32
0.32
0.32
0.29
0.29
0.29
0.27
0.27
0.27
Met
hion
ine
& c
ystin
e, %
0.67
0.67
0.67
0.61
0.61
0.61
0.57
0.57
0.57
Thr
eoni
ne, %
0.78
0.78
0.78
0.70
0.70
0.70
0.64
0.64
0.64
Tryp
toph
an, %
0.24
0.24
0.24
0.21
0.21
0.21
0.19
0.19
0.19
Cal
cium
, %0.
800.
800.
800.
800.
800.
800.
700.
700.
70P
hosp
horu
s, %
0.65
0.65
0.65
0.65
0.65
0.65
0.60
0.60
0.60
Ene
rgy,
kca
l, M
E/lb
1566
.82
1547
.34
1527
.45
1568
.47
1549
.03
1529
.10
1575
.94
1556
.50
1537
.07
----
----
----
----
----
----
----
----
----
----
----
----
----
--C
alcu
late
d to
tal c
ompo
sitio
n---
----
----
----
----
----
----
----
----
----
----
--U
.S. $
per
cw
t9.
209.
189.
128.
818.
778.
728.
078.
047.
94
a M
icro
-Lite
, LLC
.

Arkansas Animal Science Department Report 1999
27
Table 2. Effect of Magnesium-Mica level on performance of growing-finishing pigs.a
Magnesium-Mica, %Item 0 1.25 2.50 SEM
StarterADG, lb 1.36 1.23 1.36 0.079ADFI, lb 3.28 3.04 3.21 0.125F:G 2.44 2.49 2.36 0.089
GrowerADG, lb 2.05 2.00 1.96 0.037ADFI, lb 5.46 5.17 5.24 0.110F:G 2.69 2.59 2.67 0.033
FinisherADG, lb 2.09 2.16 2.05 0.064ADFI, lb 6.49 6.78 6.97 0.436F:G 3.10 3.17 3.41 0.185
Pig weightInitial weight, lb 59.88 59.88 59.88 0.02Phase 1, lb 84.39 82.48 84.26 1.25Phase 2, lb 152.33 149.42 149.89 1.96Phase 3, lb 239.49 238.68 234.81 3.52
aNo treatment effects were noted (P > .10).
Table 3. Effects of Magnesium-Mica on Fat-O-Meter® information and pork qualitydata collected at the Seaboard Farms, Inc., packing plant.
Magnesium-Mica, %Item 0 1.25 2.50 SEM
Hot carcass weight, lb 177.60 173.80 182.30 132.0010th rib fat depth, in 1.00d 0.83e 0.93de 0.0310th rib loin eye depth, in 1.98 1.92 2.05 0.04Lean muscle yields, % 49.08g 50.66f 50.04fg 4.85Muscle pH 5.62 5.63 5.60 0.06Marbling scorea 2.17 2.07 2.01 0.35NPPC firmness scorea 2.45 2.16 2.49 0.40Japanese color scoreb 4.12 4.10 4.04 0.07Minolta CIE valuesc
L* 52.82 52.36 52.45 17.91a* 8.62 8.05 8.24 4.23b* 7.30 7.04 6.86 3.41
a 1 = devoid to practically devoid marbling and very soft; 3 = small to modest marbling and slightly firm; and 5 =moderately abundant or greater marbling and very firm. Scores of 1 and 5 for marbling and 1 and 2 for firmnessare considered unacceptable by the NPPC (1991).
b Six-point scale, where 1 = light and 6 = dark.c L* = 0 is black and 100 is white; a* = red is positive and green is negative; and b* = yellow is positive and blue
is negative.d,e Within a row, means lacking a common superscript letter differ (P < .05).f,g Within a row, means lacking a common superscript letter differ (P < .10).

AAES Research Series 470
28
Table 4. Effects of Magnesium-Mica on pork quality data collected at theUniversity of Arkansas Red-Meat Abattoir.
Magnesium-Mica, %Item 0 1.25 2.50 SEM
Muscle pH 5.62g 5.76f 5.60g 0.06Marbling scorea 2.22 2.25 2.22 0.40NPPC color scorea 2.61 2.57 2.63 0.22Japanese color scoreb 3.03 2.97 3.10 0.26Hunter CIE valuesc
L* 51.32 51.66 51.38 8.63a* 7.04i 6.35h 7.04i 1.48b* 15.23f 14.62g 15.26f 0.80
Hue angled 65.35 66.58 65.29 14.53Saturation indexe 16.82f 15.97g 16.83f 1.11Drip loss, % 2.12 2.55 2.18 1.81
a1 = devoid to practically devoid marbling and pale, pinkish-gray color; 3 = small to modest marbling and reddish-pink color; and 5 = moderately abundant or greater marbling and dark purplish-red color. Scores of 1 and 5 formarbling and color are considered unacceptable by the NPPC (1991).
bSix-point scale, where 1 = light and 6 = dark.c L* = 0 is black and 100 is white; a* = red is positive and green is negative; and b* = yellow is positive and blueis negative.
dHue angle represents a change from red color (the greater the value the farther from red the muscle color).eSaturation index represents the “vividness” of the color (the greater the value the more highly colored themuscle color).
f,gWithin a row, means lacking a common superscript letter differ (P < .05).h,iWithin a row, means lacking a common superscript letter differ (P < .10).

Arkansas Animal Science Department Report 1999
29
Effect of Magnesium-Mica on Pork Loin Quality DuringExtended Refrigerated Storage1
Jason Apple, Jesse Davis, Lillie Rakes, Charles Maxwell, Fred Pohlman, and Brenda de Rodas2
Story in Brief
Boneless pork loins from 120 crossbred gilts and barrows fed diets containing 0, 1.25, or 2.50% Magnesium-Mica (MgM) were vacuum-packaged and transported to the University of Arkansas Red-Meat Abattoir. At ap-proximately 48 hours postmortem, pork loins were fabricated into loin chops, and 0-week data were collected bytrained personnel. The remaining portion of each pork loin was re-vacuum-packaged and stored at 34°F for either4 or 8 weeks. There were no (P > .10) treatment x storage interactions for any pork quality trait, and inclusion ofMgM in the diet had no (P > .10) effect on pork quality. Loins stored for 4 and 8 weeks had higher (P < .05)marbling scores than loins processed 48 hours after slaughter. Loin chops became lighter (P < .05), redder (P <.05), and more yellow (P < .05) as storage time increased from 0 to 8 weeks. The saturation index increased (P <.05) as storage length increased, indicating that the vividness, or purity, of the muscle color improved duringstorage. Loins stored for 4 and 8 weeks had higher (P < .05) purge and lower (P < .05) drip losses than loinsvacuum-packaged for only 48 hours after slaughter. Length of refrigerated storage appears to improve somequality characteristics of vacuum-packaged boneless pork loins. However, inclusion of MgM in the diet prior toslaughter had no appreciable effects on pork quality during refrigerated storage.
Introduction
Supplementing finishing diets with magnesium has beenshown to have positive effects on pork quality, especiallymuscle pH, color, and water-holding capacity (Schaefer etal., 1993; D’Souza et al., 1998). In our laboratory, Maxwellet al. (1998) included Magnesium-Mica in starter-grower andfinishing diets, and showed that muscle color was improvedby magnesium.
Nutritional modification of pork quality has receivedconsiderable attention in the past decade because of porkexports to Japan. The Japanese market has developed a strin-gent set of quality standards that must be met before a porkproduct can enter their country. Because the Japanese pur-chase fresh pork, pork is typically vacuum-packaged to main-tain pork quality during transportation and refrigerated stor-age. It appears that magnesium-supplementation has somepositive effects on pork quality; however, no information isavailable concerning the effect of magnesium-supplementa-tion on pork quality during refrigerated storage. Therefore,the aim of this project was to determine the effect of Magne-sium-Mica - supplemented in the growing-finishing diets ofpigs - on pork quality traits during a 56-day refrigerated stor-age period.
Experimental Procedures
One hundred and twenty crossbred gilts and barrowswere moved from the nursery unit to the University of Ar-kansas Swine Farm, and blocked by weight, litter and sex,and randomly allotted to 24 pens (five pigs/pen) at an aver-age weight of 45 to 50 lb. Pigs were fed a three-phase dietwith transition from starter to grower and from grower tofinisher occurring when the mean weight of each blockreached approximately 75 and 150 lb, respectively. A totalof eight pens were randomly allotted to each of three treat-ments: 1) control diet (0%) that met or exceeded nutrientrequirements for growing-finishing swine (NRC, 1988); 2)control diet supplemented with 25 lb of Magnesium-Mica(MgM) per ton of feed (1.25%) added at the expense of corn;and 3) control diet supplemented with 50 lb of MgM per tonof feed (2.50%) added at the expense of corn. All pigs re-ceived a standard corn-soybean meal diet formulated to con-tain 1.1% lysine during the starter phase, 0.95% lysine dur-ing the growing period, and 0.85% lysine during the finish-ing phase. When the lightest block averaged 235 lb, all pigswere transported approximately 450 miles to the SeaboardFarms, Inc., pork packing plant in Guymon, Oklahoma.
1 The authors wish to express their appreciation to Matt Stivarius, Kathy McElyea, Levi McBeth, and Jerry Stephenson for loin fabricationand data collection, and Dr. Zelpha Johnson for statistical consultation.
2 All authors are associated with the Department of Animal Science, Fayetteville.

AAES Research Series 470
30
After a 24-hour chilling and tempering period, pork car-casses were fabricated, and vacuum-packaged, and bonelesspork loins were vacuum-packaged and shipped to the Uni-versity of Arkansas Red-Meat Abattoir. Upon arrival, porkloins were removed from their vacuum-packs to collect ini-tial quality data. The remaining portion of the pork loins werevacuum-packaged in 3 mL polyethylene-nylon vacuum bags(Koch Supplies Inc., Kansas City, Missouri; oxygen trans-mission rate = 0.6 cc/100 in2/24 hours; water vapor trans-mission rate = 0.6 g/100 in2/24 hours). The re-packaged loinswere placed in wax-coated boxes, and stored at 34°F for ei-ther 4 or 8 weeks.
At approximately 48 hours postmortem, and after 4 and8 weeks of storage, pork loins were removed from thevacuum-packages, blotted with paper towels, and a 2-inchportion of the loin was removed and discarded. The amountof purge (moisture) collected within the package was mea-sured in a graduated cylinder. Two 1.5-inch thick chops werefabricated for drip loss determinations following the suspen-sion procedure of Honikel et al. (1986). A 1.5-inch diametercore was removed from each 1.5-inch thick chop, weighed,and suspended on a fishhook (barb removed) mounted to thelid of a plastic container (18 inches deep x 15 inches wide x24 inches long), and stored at 34°F. After 48 hours, eachcore was blotted with a paper towel and reweighed. The lossin weight due to drip and evaporation was divided by theoriginal weight, multiplied by 100, and reported as drip losspercentage. Two additional 1-inch thick chops were removedfrom the loin, and, after a 45-minutes bloom period, U.S.(NPPC, 1991) and Japanese color scores were recorded, alongwith marbling scores. Also, CIE L*, a*, and b* (CIE, 1976)values were collected with a Hunter MiniScan XE (HunterAssociates Laboratory, Inc., Reston, Virginia).
Pork quality data were analyzed as a split-plot design(Gill and Hafs, 1971) using the GLM procedure of SAS(1988) with MgM level (tested by the loin within treatmentmean square error) as the sole source of variation in the wholeplot, and storage length, and storage length x MgM levelinteraction as sources of variation in the subplot. Compari-sons among treatments within a given time of measurementwere made only if a significant (P < .05) storage length xMgM level interaction was apparent. Least squares meanswere calculated for main effects and the interaction effect,and were separated statistically using the least significantdifference procedure (SAS, 1988).
Results and Discussion
There were no significant (P > .10) MgM level x stor-age length interactions for any pork quality trait. Addition-ally, marbling score, NPPC and Japanese color scores, CIEvalues, drip loss, and purge loss were not affected (P > .10)by inclusion of MgM in the diet (Table 1).
The effects of refrigerated storage on pork quality at-tributes are presented in Table 2. Loins stored for 4 and 8weeks had higher (P < .05) marbling scores than loins pro-cessed 48 hours after slaughter. Even though length of stor-
age had no (P > .10) effect on Japanese color scores, U.S.color scores increased (P < .05) from 0 to 4 weeks, but de-clined (P < .05) from 4 to 8 weeks to values similar to 0-week chops. Both Smith et al. (1974) and Hall et al. (1980)failed to note changes in color scores for chops from vacuum-packaged loins stored up to 28 days.
Pork chop CIE L* values increased as storage time in-creased – indicating that the loin became lighter with ex-tended storage. Also, chops from loins stored 8 weeks wereredder (P < .05) and more yellow (P < .05) than chops fromloins stored 4 weeks or 48 hours. The saturation index repre-sents the “vividness” or “purity” of a color, and the satura-tion index increased (P < .05) as storage length increased,indicating that the vividness, or purity, of the muscle colorimproved during storage.
Loins stored for 4 and 8 weeks had higher (P < .05)purge losses than loins vacuum-packaged for only 48 hoursafter slaughter. This concurs with the results of Lee et al.(1985), who reported significant purge losses with extendedvacuum-storage (up to 49 days) at 37.5°F. On the other hand,the 0-week samples had higher (P < .05) drip loss percent-ages than loins stored for 4 or 8 weeks, which conflicts withthe findings of Weakley et al. (1986), who reported reducedmoisture losses from vacuum-packaging pork loins storedfor up to 28 days.
Implications
Length of refrigerated storage appears to improve sev-eral quality characteristics of vacuum-packaged bonelesspork loins. Storage of loins for 8 weeks resulted in highermarbling scores and redder, more vivid colored loin chops;however, loin chop color was lighter and a greater amountof the loin weight was lost as purge. The inclusion of Mag-nesium-Mica in the diet prior to slaughter had no appreciableeffects on pork quality during refrigerated storage.
Literature Cited
CIE. 1976. Commission Internationale de l’Eclairage, Paris.D’Souza, D.N. et al. 1998. J. Anim. Sci. 76:104-109.Gill, J.L., & H.D. Hafs. 1971. J. Anim. Sci. 33:331.Hall, L.C., et al. 1980. J. Food Prot. 43:272.Honikel, K.O., et al. 1986. Meat Sci. 16:267.Lee, B.H., et al. 1985. Meat Sci. 13:99.Maxwell, C.V., et al. 1998. Ark. Anim. Sci. Res Rep. 1:115.NPPC. 1991. Procedures to Evaluate Market Hogs (3rd Edi-
tion). Des Moines, Iowa.NRC. 1988. Nutrient Requirements of Swine (10th Edition).
National Academy Press, Washington, DC.SAS. 1988. SAS Inst., Inc., Cary, North Carolina.Schaefer, A.L., et al. 1993. Can. J. Anim. Sci. 73:231.Smith, G.C., et al. 1974. J. Food Sci. 39:1140.Weakley, D.F., et al. 1986. J. Food Sci. 51:281.

Arkansas Animal Science Department Report 1999
31
Table 1. Effect of Magnesium-Mica on the least squares means (± SE) for pork quality.
Magnesium-Mica, %Item 0 1.25 2.50
Marbling scorea 2.43 ± 0.11 2.46 ± 0.11 2.43 ± 0.13U.S. color scorea 2.63 ± 0.07 2.65 ± 0.07 2.61 ± 0.08Japanese color scoreb 3.11 ± 0.08 2.97 ± 0.08 3.07 ± 0.09CIE valuesc
L* 53.01 ± 0.54 53.51 ± 0.55 53.70 ± 0.63a* 8.24 ± 0.24 7.59 ± 0.25 8.11 ± 0.28b* 16.71 ± 0.18 16.22 ± 0.18 16.62 ± 0.21
Saturation indexd 18.67 ± 0.23 17.94 ± 0.24 18.52 ± 0.27Drip loss, % 1.47 ± 0.15 1.66 ± 0.15 1.46 ± 0.17Purge loss, mL 27.54 ± 2.43 27.69 ± 2.48 31.01 ± 2.82
a 1 = devoid to practically devoid marbling and pale, pinkish-gray color; 3 = small to modest marbling andreddish-pink color; and 5 = moderately abundant or greater marbling and dark purplish-red color. Scores of 1and 5 for marbling and color are considered unacceptable by the NPPC (1991).
b Six-point standard, with 1 = light and 6 = dark.c L* = 0 is black and 100 is white; a* = red is positive and green is negative; and b* = yellow is positive and blue
is negative.d Saturation index represents the “vividness” of the color (the greater the value the more highly colored the
muscle color). No treatment effects were noted (P > .10).
Table 2. Effect of refrigerated storage on least squares means (± SE) for pork quality.
Storage length, weekItem 0 4 8
Marbling scorea 2.25e ± 0.04 2.48f ± 0.07 2.58f ± 0.07U.S. color scorea 2.60e ± 0.04 2.74f ± 0.06 2.55e ± 0.06Japanese color scoreb 3.03 ± 0.04 3.13 ± 0.06 2.98 ± 0.06CIE valuesc
L* 51.55e ± 0.17 53.68f ± 0.29 54.99g ± 0.29a* 6.77e ± 0.06 8.33f ± 0.10 8.85g ± 0.11b* 15.02e ± 0.05 17.01f ± 0.09 17.51g± 0.09
Hue angled 65.85e ± 0.19 64.14f ± 0.33 63.19f ± 0.33Saturation indexd 16.52e ± 0.06 18.98f ± 0.11 19.63g ± 0.11Drip loss, % 2.27e ± 0.11 1.51f ± 0.18 0.81g ± 0.19Purge loss, mL 3.03e ± 1.85 37.85f ± 3.18 43.35f ± 3.22
a 1 = devoid to practically devoid marbling and pale, pinkish-gray color; 3 = small to modest marbling andreddish-pink color; and 5 = moderately abundant or greater marbling and dark purplish-red color. Scores of 1and 5 for marbling and color are considered unacceptable by the NPPC (1991).
b Six-point standard, with 1 = light and 6 = dark.c L* = 0 is black and 100 is white; a* = red is positive and green is negative; and b* = yellow is positive and blue
is negative.d Hue angle represents a change from red color (the greater the value the farther from red muscle color).
Saturation index represents the “vividness” of the color (the greater the value the more highly colored themuscle color).
e,f,g Within a row, least squares means lacking a common superscript letter differ (P < .05).

AAES Research Series 470
32
Effect of Dietary Chromium-L-methionine on Glucose Metabolism of Growing Pigs1
Beth Kegley2, Charles Maxwell2, and Tim Fakler3
Story in Brief
This study evaluated the effect of chromium as chromium-L-methionine on glucose tolerance and insulinsensitivity in pigs. Pigs were fed a control diet or a diet supplemented with 400 ppb Cr as chromium-L-methion-ine. Twenty-eight crossbred barrows (initial BW was 62.4 lb; 14 pigs/treatment) were housed in pens (sevenpigs/pen; two pens/dietary treatment) and fed their respective diets for a period of 36 or 37 days prior to themetabolic challenges and blood sampling. Pigs fed diets supplemented with chromium-L-methionine had afaster (P < .02) glucose clearance rate from 10 to 15 minutes after glucose infusion. There was a dietary treat-ment by time interaction after the insulin infusion. Pigs supplemented with chromium-L-methionine had lower(P < .05) plasma glucose concentrations from 45 to 120 minutes after the insulin infusion. The return to basalglucose concentration was slower for pigs that were fed diets supplemented with chromium-L-methionine. Thesedata indicate that chromium-L-methionine was a bioavailable source of chromium. Using other bioavailablesources, chromium supplementation has been shown to increase percentage carcass lean in market hogs, andincrease litter size in sows.
Introduction
Chromium was shown to be essential for normal glu-cose metabolism in the rat in 1959. Recent work has shownthat supplementation with chromium as chromium picolinateaffects glucose metabolism in the pig. Supplementation ofchromium picolinate has also increased lean carcass percent-age in finishing pigs, and increased litter size in sows (NRC,1997). Presently, chromium picolinate is the only source ofchromium approved by the FDA for use in swine diets. Thisinvestigation was conducted to demonstrate a metabolic ef-fect of supplementing chromium as chromium-L-methion-ine to swine rations. The rate of glucose clearance after anexogenous glucose infusion and after an exogenous insulininfusion was determined.
Experimental Procedures
Twenty-eight crossbred barrows weighing 62.4 lb (55to 61 days of age) were used. Barrows were from Duroc xLandrace x Yorkshire sows and were sired by Tyson line Xboars. Pigs were blocked by weight and randomly assignedto pens (two pens/block) with seven pigs per pen, and penswithin block were randomly assigned to treatment, resultingin two replicate pens per dietary treatment. Five feet by thir-teen feet pens were located in a curtain sided building.
Dietary treatments included a control diet, and a dietsupplemented with 400 ppb chromium. The source of chro-mium was chromium-L-methionine (Zinpro Corp., Eden Prai-rie, Minnesota). Diets exceeded the nutrient needs of the pigsbased on NRC (1988) recommendations and were providedby Consolidated Nutrition. The researchers were blind to ex-perimental treatments. Pigs were allowed ad libitum accessto water and feed.
Pigs were fed their respective diet for 34 or 35 days. Onday 35 and 36, pigs in one pen per dietary treatment werefitted with an indwelling jugular catheter. At the time ofcannulation the BW of the pigs was 100.3 + 11.9 lb. Aftercatheterization, pigs were housed individually in 4 ft x 6 ftpens bedded with wood shavings. Pigs were allowed ad li-bitum access to water, and were offered 2 lb of feed aftercannulation and 5 lb on the day between cannulation andbleeding.
Approximately 30 hours post-catheterization, the pigswere fasted for 15 to 18 hours. After the fast, the effect ofchromium-L-methionine on glucose metabolism was deter-mined by conducting an intravenous glucose tolerance test(IVGTT) followed 3 hours later by an intravenous insulinchallenge test (IVICT). These tests involved glucose (500mg glucose/2.2 lb of BW) and insulin (.1 IU insulin/2.2 lb ofBW) infusions followed by serial blood sampling at -10, 0,
1 Appreciation is expressed to Zinpro Corp. for providing financial assistance for this project.2 Department of Animal Science, Fayetteville3 Zinpro Corp., Eden Prairie, Minnesota.
Arkansas Animal Science Department Report 1999
33
5, 10, 15, 30, 45, 60, 90, and 120 minutes relative to dosing.Glucose clearance (percentage/minute) and half life werecalculated for time intervals between 5 and 30 minutes forthe IVGTT, and between 0 and 15 minutes for the IVICT(Kaneko, 1989).
Plasma glucose concentrations were determined usinga spectrophotometric procedure in a commercially availablekit (Sigma). Plasma insulin concentrations were determinedusing a commercially available solid phase radioimmunoas-say kit (Diagnostic Products Corporation).
Data were analyzed by ANOVA using the GLM proce-dure of SAS (1988). The model for glucose clearance rates,half lives, and area under the curve included treatment. Themodel for plasma glucose after the infusions included ef-fects of treatment, pig nested within treatment, time, and theinteraction of time by treatment. The error term for treat-ment was pig nested within treatment. Pig was the experi-mental unit.
Results and Discussion
Of the twenty-eight pigs that were fed, 19 catheters werefunctional throughout the sampling period. There were nomissing samples in this data (nine pigs on the control, and10 pigs on the chromium supplemented diet).
Intravenous Glucose Tolerance Test. Pigs supplementedwith chromium-L-methionine had lower (P < .06) plasmaglucose concentrations before and during the IVGTT (Fig.1). When statistically analyzed by time, pigs fed diets supple-mented with chromium-L-methionine had lower plasma glu-cose concentrations at -10 (P < .07), 0, and 15 (P < .05) minafter glucose infusion. Pigs supplemented with chromium-L-methionine had an 8.6% lower baseline plasma glucoseconcentration than pigs consuming the control diet. Fifteenminutes after the glucose infusion pigs supplemented withchromium-L-methionine had an 11.9% lower (P < .05) plasmaglucose concentration than control pigs. Because pigs supple-mented with chromium-L-methionine had lower baselineplasma glucose concentrations, area under the curve was notaffected by treatment at any time point.
Supplemental chromium-L-methionine increased theglucose clearance rate (P < .03) and decreased glucose halflife (P < .02) from 10 to 15 minutes after the glucose infu-sion (Table 1). However, glucose clearance rates and half-life were not significantly affected (P > .10) by treatment atother time points.
There was a tendency (P < .12) for an interaction oftime by dietary treatment on plasma insulin concentrationsduring the glucose tolerance test (Fig. 2). When statisticallyanalyzed within a sampling time, plasma insulin concentra-tion was lower (P < .02) before the glucose tolerance test forpigs fed the diet supplemented with chromium-L-methion-ine. The area under the insulin curve (Table 1) also tended (P< .14) to be smaller from 0 to 120 minutes after the glucoseinfusion for pigs fed the diet supplemented with chromium-L-methionine.
Intravenous Insulin Challenge Test. There was a sig-nificant interaction of time by dietary treatment on plasmaglucose concentrations (P < .02) during the insulin infusion(Fig. 3). There was a tendency for supplemental chromium-L-methionine to increase (P < .12) glucose clearance ratefrom 5 to 15 minutes after the insulin infusion (Table 2).Pigs that were fed diets supplemented with chromium-L-me-thionine had lower (P < .05) plasma glucose concentrationsfrom 45 to 120 minutes after insulin infusion than did pigsfed the control diet. Pigs supplemented with chromium-L-methionine had 20, 21, 19, and 15% lower plasma glucoseconcentrations at 45, 60, 90, and 120 minutes after infusionas compared to the pigs fed the control diet. Therefore, areaunder the curve was greater (P < .03) for the pigs fed dietssupplemented with chromium-L-methionine. The return tobasal glucose concentration was more gradual for pigs thatwere fed diets supplemented with chromium-L-methionine.Tissues from these pigs that were fed supplemental chro-mium-L-methionine might have been more sensitive to theinsulin, or the insulin might have had a longer lasting effectin these pigs.
There were no effects of supplementing chromium-L-methionine on plasma insulin concentrations after the insu-lin infusion (Fig. 4). However, immediately before the infu-sion, pigs fed supplemental chromium-L-methionine had alower (P < .05) concentration of plasma insulin.
In summary, chromium-L-methionine supplementationincreased the sensitivity of pigs to an insulin challenge.Supplementation with chromium-L-methionine also in-creased the glucose clearance rate from 10 to 15 minutesduring a glucose tolerance test.
Implications
Through altering glucose and insulin metabolism, thisstudy demonstrated that chromium-L-methionine is abioavailable chromium source for growing pigs. Researchwith other chromium sources has shown that chromiumsupplementation increases the percentage carcass lean inmarket hogs, and increases the number of pigs born to sows.
Literature Cited
Kaneko, J.J. 1989. In: J.J. Kaneko (ed.) Clinical Biochem-istry of Domestic Animals (4th Ed.). Academic Press,San Diego, California.
NRC. 1988. Nutrient Requirements of Swine. 9th rev. ed.Natl. Acad. Sci., Washington, DC.
NRC. 1997. The Role of Chromium in Animal Nutrition,Washington. DC.
SAS. 1988. SAS Inst., Inc. Cary, North Carolina.

AAES Research Series 470
34
Table 1. Effect of dietary chromium-L-methionine on glucose and insulin metabolism after an intrave-nous glucose tolerance test (mean ± SE).
Supplemental Cr level, ppbItem 0 400 P value
Number of pigs 9 10
Glucose Clearance, %/min 10 to 15 min 3.34 ± 0.334 4.50 ± 0.317 0.03 15 to 30 min 4.14 ± 0.405 4.52 ± 0.384 0.50 Half life, min 10 to 15 min 21.7 ± 1.50 16.4 ± 1.43 0.02 15 to 30 min 17.3 ± 1.56 16.9 ± 1.48 0.85
Insulin Area under the curve, µIU of plasma insulin/ml * min 0 to 120 min 1,000 ± 187 590 ± 178 0.14
Table 2. Effect of dietary chromium-L-methionine on glucose and insulin metabolism after anintravenous insulin challenge test (mean ± SE).
Supplemental Cr level, ppbItem 0 400 P value
Glucose Area under the curve, mmol of plasma glucose/L * min 0 to 120 minutes -150 ± 13 -200 ± 12 0.02 Clearance, %/minutes 0 to 15 min 8.05 ± 0.627 9.29 ± 0.595 0.17 5 to 15 min 9.09 ± 0.839 10.99 ± 0.796 0.12 Half life, min 0 to 15 min 8.8 ± 0.54 7.8 ± 0.51 0.21 5 to 15 min 7.8 ± 0.52 6.8 ± 0.50 0.16
Insulin Area under the curve, µIU of plasma insulin/ml * min 0 to 120 min 1600 ± 177 1760 ± 168

Arkansas Animal Science Department Report 1999
35
Fig. 1. Effect of dietary chromium-L-methionine on glucose metabolism after an intravenous glucosetolerance test.A
A Effect of dietary treatment for all sampling times (P<.06).B Effect of dietary treatment (P<.07).C Effect of dietary treatment (P<.05).
Fig. 2. Effect of dietary chromium-L-methionine on insulin metabolism after an intravenous glucosetolerance test.A
A Interaction of time by dietary treatment (P<.12).B Effect of dietary treatment (P<.02).

AAES Research Series 470
36
Fig. 3. Effect of dietary chromium-L-methionine on glucose metabolism after an intravenous insulinchallenge test.A
A Interaction of time by dietary treatment (P<.02).B Effect of dietary treatment (P<.05).
Fig. 4. Effect of dietary chromium-L-methionine on insulin metabolism after an intravenous insulinchallenge test.
A Effect of dietary treatment (P<.05).

Arkansas Animal Science Department Report 1999
37
Estimation of Litter Environmental and Maternal Effectsfor Performance Test Traits of Large White Swine
Zelpha Johnson1, Jeff Chewning2, and Russ Nugent, III2
Story in Brief
The objective of this study was to investigate the importance of litter environmental effects, maternal geneticeffects, and the covariance between additive genetic effects of the animal and maternal genetic effects for perfor-mance test traits for a population of purebred Large White swine. Boars were individually penned at approxi-mately 100 days of age and fed a corn-soybean meal diet for approximately 77 days. Weights and feed intake wererecorded. Backfat and loin eye area were measured over the 12th rib at the end of the test using B-Mode ultra-sound equipment. Daily feed intake, feed:gain ratio and ADG were calculated. Data were available for years 1990to 1997. Four models were examined. Model 1 included only the additive genetic effect of the animal; Model 2added the common litter environmental effect; Model 3 added the maternal genetic value assumed to be uncorrelatedwith the additive genetic effect. Model 4 was the same as Model 3 with additive and maternal genetic effectsassumed to be correlated. Ratios of likelihoods were used to compare models. Common litter environmentaleffects were important (P < .01) for all traits measured and explained from 13 to 40% of the phenotypic variation.The maternal genetic value and the correlation between maternal and direct genetic effects were important sourcesof variation for some traits but had little effect on the estimation of heritability.
1 Department of Animal Science, Fayetteville.2 The Pork Group, Rogers.
Introduction
Mixed-model procedures have become the method ofchoice for estimating breeding values of animals. They pro-vide best linear unbiased predictors (BLUP) of breeding val-ues, and also simultaneously estimate genetic and environ-mental effects, taking into account relationships among ani-mals. It is important to have accurate estimates of variancecomponents for any random effects that may be included inthe model. Maternal effects, if present, may present an ob-stacle to genetic improvement of traits. Although these ef-fects are strictly environmental with respect to offspring, theycan have both environmental and genetic components withrespect to the dam. Maternal additive genetic effects, ifpresent, may bias estimates of direct additive genetic effectsbecause both are transmitted from one generation to the next.Therefore, maternal effects, if important in the populationfor a trait, should be included in the evaluation model. It isalso important to identify relationships of maternal effectswith direct effects. For litter bearing species, common litterenvironmental effects for some traits may be important. Thus,identification of the most appropriate model for subsequentcalculations of breeding values is important.
The objective of this study was to determine the impor-tance of litter environmental effects and maternal genetic
effects, as well as the correlation between maternal geneticeffects and random animal genetic effects, for performancetraits of Large White boars.
Materials and Methods
Data evaluated were performance test records fromLarge White boars from a commercial swine operation from1990 to 1997. Boars born to approximately 60% of the lit-ters were culled at weaning based on a maternal breedingvalue (index) for the dam. These index values were based onnumber born alive, farrowing interval, and weaning weightof the dam. Boars that were not culled were grown to 100days of age. At this time, boars to be individually pen testedwere selected primarily on phenotypic weight, with someconsideration given to the maternal index.
Boars to be performance tested were individually pennedin 2.79 m2 pens on slatted concrete floors at approximately100 days of age (79 to 134 days; mean = 100.4 days) forapproximately 77 days. A pelleted corn-soybean meal dietformulated to contain 1.14% lysine, 19% protein, and 3,344kcal/kg ME was offered ad libitum. Exact composition ofthe diet varied due to ingredient cost. Ending test age rangedfrom 156 to 211 days, with a mean of 176.2 days. Boars (n =7,722) were weighed at the beginning (WT100) and end of

AAES Research Series 470
38
the test (WT177), and feed intake was recorded. Boars weretypically fed three to four times a week; however, feed wasonly weighed back at the end of the test. Backfat (n = 7,715)and loin eye area (LEA; n = 7,711) were measured at the 12th
rib upon completion of the test using B-Mode ultrasoundequipment. Backfat was measured 4 cm off the midline withskin excluded. Average daily gain (ADG; n = 7,711), aver-age daily feed intake (ADFI; n = 7,541) and feed:gain ratio(F:G; n = 7,541) were calculated.
Variance components and genetic parameters for eachtrait were estimated by four animal models usingMTDFREML (Boldman et al., 1993; Boldman and VanVleck, 1991). Model 1 included only the additive geneticeffect of the animal (d), Model 2 included (d) and the com-mon litter environmental effect, Model 3 included (d), thematernal genetic value (m), assumed to be uncorrelated withd, and the common environmental effect, and Model 4 wasthe same as Model 3, but with d and m assumed to be corre-lated. In all models, the convergence criterion (i.e., varianceof the simplex values) for all runs was 10–9. All analysesincluded pedigrees back to 1990 giving 92,145 animals inthe relationship matrix. Fixed effects were contemporarygroups (defined by month test started and barn of origin;boars originated from four barns) and initial test age as acovariate. There were 339 contemporary groups, and num-ber of observations in a contemporary group ranged from 8to 204 (mean = 77).
Genetic parameters estimated were direct additive heri-tability (h2
d), maternal heritability (h2
m), the correlation be-
tween d and m (rd,m
) and total heritability (Ferraz and Johnson,1993; h2
t = [σ2
d + .5σ2
m + 1.5σ(d,m)]/σ2
p, where σ2
d is the
estimate of variance for direct genetic effects, σ2m is the esti-
mate of variance for maternal genetic effects and σ(d,m) isthe estimate of covariance between direct and maternal ge-netic effects and σ2
p is the estimate of phenotypic variance).
The ratio of variance of common environmental effects as-sociated with the litter (c2) to σ2
p was also estimated.
The method described by Ferraz and Johnson (1993) tocalculate ratios of likelihoods was used to compare models.The ratio –2[log Λ
i – log Λ
j] is asymptotically distributed as
chi-square with degrees of freedom equal to the differencein the number of parameters in the Models i and j, where Λis the value of the likelihood function for the model, afterthe convergence criterion was reached.
Results and Discussion
A property of these methods of analysis is that the largerthe value of the likelihood function, the better the modelexplains the variation in the data. When a parameter is addedto an analysis, the value of the likelihood function shouldincrease, and the likelihood ratio test can be used to test sig-nificance of the changes in the likelihoods. Results of thesetests are presented in Table 1.
For all traits examined, significantly larger likelihoodvalues were obtained when Model 2 was used compared withModel 1 indicating that permanent environmental litter ef-
fects were important for all traits. For WT100, LEA andWT177, significantly larger likelihoods were obtained whenModel 3 was compared to Model 2 indicating that maternalgenetic effects were important for these traits. Generally,larger likelihoods were not obtained for Model 4 when com-pared to Model 3 indicating that including the correlationbetween direct and maternal genetic effects did not add sig-nificant information. Exceptions were backfat and WT177where the correlation between direct and maternal geneticeffects did provide significant information.
Estimates of genetic, environmental, and phenotypicparameters obtained from each model are presented in Table2. Estimates from all models are presented for comparisonpurposes, although the estimates most appropriate for backfatand WT177 would be those from Model 4. Estimates mostappropriate for WT100 and LEA would be those from Model3, and for ADG, ADFI and F:G, estimates from Model 2would be most appropriate.
Estimates of environmental litter effects (c2) ranged from.13 for backfat to .40 and .37 for WT100. Within a trait theseestimates were similar for all models. Even though statisti-cally significant for three traits, estimates of h2
m were low
for all traits ranging from 0 to .06. The estimates of herita-bility of direct genetic effects (h2
d) for all traits decreased
when environmental effects of litters were introduced fromModel 1 to Model 2, but generally the addition of maternaleffects in Models 3 and 4 did not cause important changes inthe estimates of this parameter. Exceptions are that h2
d for
WT100 declined from .20 to .15 from Model 2 to Model 4;however, total h2 only declined from .20 to .17. Estimates ofh2
d for backfat increased from .36 to .43 from Model 2 to
Model 4; however total h2 stayed constant at .36. All esti-mates of the correlation between direct and maternal effectswere negative ranging from -.11 for WT100 to -.64 for F:G;however addition of these effects was only important forbackfat and WT177. Although statistically significant, thesevalues had little effect on the estimation of total heritabilityfor backfat. Total heritability did decline from .25 for Model2 to .19 for Model 4 for WT177 indicating that this correla-tion is more important for this trait.
In conclusion, environmental litter effects are impor-tant in the estimation of genetic parameters of performancetest data in this population of Large White swine and shouldbe included in any genetic evaluation program. For practicalpurposes, both maternal effects and the correlation betweenmaternal and direct effects could be ignored for most othertraits examined, with the possible exception of WT177.
References
Boldman, K., et al. 1993. A manual for use of MTDFREML- A set of programs to obtain estimates of variances andcovariances. ARS, USDA, Washington, DC.
Boldman, K.G., and L.D. Van Vleck. 1991. J. Dairy Sci.74:4337-4343.
Ferraz, J.B.S., and R.K. Johnson. 1993. J. Anim. Sci. 71:850-858.

Arkansas Animal Science Department Report 1999
39
Table 1. Values of the differences between the likelihood functions of two different animal modelsa totest the difference between models for performance test traits of Large White boars.
Trait Model 1 – Model 2 Model 2 – Model 3 Model 3 – Model 4
Weight at 100 d, kg 575.63** 13.48** .17Average daily gain, kg 103.00** 0 2.39Average daily feed intake, kg 154.43** 2.39 1.52Feed:gain 185.71** 1.35 3.08Backfat, cm 62.56** .82 4.48*Loin eye area, cm2 102.29** 5.29* .76Weight at 177 days, kg 162.76** 4.08* 7.24**
aAsymptotically distributed as chi-square with 1 degree of freedom.* P < .05.** P < .01.
Table 2. Estimates of genetic parameters obtained from Model 1 through Model 4 forperformance test traits of Large White boars.
Parametera Model 1 Model 2 Model 3 Model 4
Weight at 100 days, kgh2
d.50 .20 .15 .15
h2m
.06 .07r
d,m-.11
c2 .40 .37 .37h2
t.50 .20 .18 .17
Average daily gain, kgh2
d.36 .24 .24 .26
h2m
0 .03r
d,m-.46
c2 .18 .18 .18h2
t.36 .24 .24 .21
Average daily feed intake, kgh2
d.38 .23 .22 .24
h2m
.01 .02r
d,m-.40
c2 .22 .22 .22h2
t.38 .23 .22 .21
Feed:gainh2
d.29 .16 .15 .18
h2m
0 .01r
d,m-.64
c2 .26 .26 .26h2
t.29 .16 .15 .14
continued

AAES Research Series 470
40
Table 2. Continued.
Parametera Model 1 Model 2 Model 3 Model 4
Backfat, cmh2
d.46 .36 .36 .43
h2m
.00 .02r
d,m-.59
c2 .13 .13 .13h2
t.46 .36 .36 .36
Loin eye area, cm2
h2d
.33 .24 .24 .26h2
m0 .02
rd,m
-.33c2 .18 .18 .18h2
t.33 .24 .24 .23
Weight at 177 days, kgh2
d.40 .25 .22 .26
h2m
.03 .09r
d,m-.49
c2 .22 .21 .20h2
t.40 .25 .24 .19
a h2d is direct additive heritability, h2
m is maternal heritability, r
d,m is the correlation between direct and maternal
effects, c2 is the proportion of the variance associated with common litter environmental effects, and h2t is the
total heritability of the trait.

Arkansas Animal Science Department Report 1999
41
Genetic Parameters for Production Traits and Measures ofResidual Feed Intake in Large White Swine
Zelpha Johnson1, Jeff Chewning2, and Russ Nugent, III2
Story in Brief
The purpose of this study was to estimate genetic parameters for ADG, backfat thickness, loin eye area, andmeasures of feed intake and efficiency for purebred Large White boars born from 1990 to 1997. Boars wereindividually pen tested for approximately 77 days starting at 100 days of age. Daily feed intake, ADG, andfeed:gain ratio were computed. Four measures of residual feed intake were estimated as the difference betweenactual feed intake and that predicted from models that included various other performance test traits. Geneticparameters were estimated using a model that included fixed effects of contemporary groups and initial test ageas a covariate and random animal and litter effects. Heritability estimates for test ADG, daily feed intake, feed:gain,backfat, loin eye area, and the four measures of residual feed intake were .24, .23, .16, .36, .24, .17, .11, .15, and.10, respectively. Genetic correlations indicated that selection for reduced residual feed intake could be madewithout adversely affecting ADG. Backfat should also decrease, and loin eye area should increase. The amount ofchange in backfat or loin eye area would depend on the measure of residual feed intake used.
1Department of Animal Science, Fayetteville2The Pork Group, Rogers
Introduction
Feed costs represent a major portion of the total cost ofswine production. Individual animals differ in their abilityto efficiently use feed. Selecting the most efficient animalsmay significantly lower production costs. Direct selectionfor genetic improvement in feed efficiency, however, has notbeen widely practiced for a number of reasons. It is difficultto measure for individual pigs and results in high labor andequipment costs. Direct selection for feed efficiency has notalways been effective, and may not be the best way to im-prove this trait because of complex additive and multiplica-tive relations. This may be partly due to the fact that feedefficiency is not a directly measurable trait; it is usually com-puted as the ratio of feed intake to product produced. Analternative measure for expressing feed efficiency is residualfeed intake, which measures feed intake adjusted for energyrequirements for maintenance and production and, by defi-nition, has zero phenotypic correlation with these traits. Varia-tion in this measure may reflect differences in the efficiencywith which animals digest and use energy for maintenanceand production. Inclusion of this trait in a breeding programdepends on its heritability and its relationships with othertraits of interest.
The objectives of this study were to estimate geneticparameters for ADG, backfat, and loin eye area and severalmeasures of residual feed intake for a population of LargeWhite swine and to examine genetic and phenotypic rela-tionships of residual feed intake to these production traits.
Materials and Methods
Data evaluated were performance test records fromLarge White boars collected in a commercial swine opera-tion from 1990 to 1997. Boars born to approximately 60%of the litters were culled at weaning based on a maternalbreeding value (index) for the dam. These index values werebased on number born alive, farrowing interval, and wean-ing weight. Boars that were not culled were grown to 100 dof age. At this time, boars to be individually pen tested wereselected primarily on phenotypic weight, with some consid-eration given to the maternal index.
Boars were individually penned in 2.79 m2 pens on slat-ted concrete floors at approximately 100 days of age (79 to134 days; mean = 100.4 days) for approximately 77 days.They were fed for ad libitum consumption a pelleted corn-soybean meal diet that was 1.14% lysine, 19% protein, and3,344 mcal/kg ME. Exact composition of the diet varied dueto ingredient cost. Ending test age ranged from 156 to 211days, with a mean of 176.2 days. Boars were weighed at thebeginning and end of the test and feed intake was recorded.Boars were typically fed three to four times a week; how-ever, feed was only weighed back at the end of the test.Backfat and loin eye area (LEA) were measured at the 12thrib at the end of the test using B-Mode ultrasound equip-ment. Backfat was measured 4 cm off the midline with skinexcluded. Average daily gain (ADG), average daily feed in-take (ADFI), and feed:gain ratio (F:G) were calculated. Num-ber of records was 7,722 for ADG, 7,542 for ADFI and F:G,

AAES Research Series 470
42
7,716 for backfat, and 7,712 for LEA.Heritabilities and genetic correlations were estimated
using the MTDFREML program of Boldman et al. (1993)and Boldman and Van Vleck (1991) using single- and mul-tiple-trait analyses. All analyses included pedigrees back to1990 giving 92,145 animals in the relationship matrix. Mod-els included fixed effects of contemporary groups (definedby month test started and barn of origin; boars originatedfrom four barns) and initial test age as a covariate, as well asrandom litter and animal effects. Preliminary analyses of per-formance test data indicated that maternal effects were notimportant; therefore, they were not included in the reportedanalyses.
In this type of analysis, it is important that contempo-rary groups be connected. That is, sires should be used inmore than one contemporary group, and contemporary groupsshould represent more than one sire. In the population fromwhich these boars were selected, there were 339 contempo-rary groups, with number of observations in a contemporarygroup ranging from 8 to 204 (mean = 77). There were 9,076litters from 713 sires. Ninety-seven of the sires were used inmore than one barn. The frequency distribution for numberof litters sired by each sire is shown in Table 1. While 177 ofthe 713 sires represented in this data set only had one litterrepresented, over half the sires had more than seven litters.As another check on connectedness, frequency distributionsfor number of contemporary groups in which a sire was rep-resented and number of sires represented in a contemporarygroup are given in Table 2. For example, 63 sires were rep-resented in more than 15 contemporary groups. Number ofsires in a contemporary group ranged from two to more than25. Ten contemporary groups had more than 25 sires repre-sented.
Four measures of residual feed intake were estimatedas the difference between actual feed intake and that pre-dicted from single-trait analyses for ADFI, with various com-binations of production traits included as covariates. Theseanalyses included the contemporary group effect and ran-dom animal effects, but not litter effects. Mrode and Kennedy(1993) used a similar procedure to estimate measures of re-sidual feed intake. Model 1 included covariates of initial testage, initial test weight, and ADG (RFI1); Model 2 includedinitial test age, initial test weight, ADG, and backfat (RFI2);Model 3 included initial test age, initial test weight, ADG,and loin eye area (RFI3); and model 4 included initial testage, initial test weight, ADG, backfat, and loin eye area(RFI4). Including a covariate in the analysis of a trait adjuststhat trait for the covariate. Thus, for example, in Model 1,feed intake is adjusted for initial test age, initial test weightand test ADG, with the assumption that this adjusted mea-sure of feed intake (residual feed intake) will reflect differ-ences in feed intake above what is needed for maintenance(test weight) and production (ADG). Regression coefficientsfrom these single-trait analyses were used to estimate mea-sures of residual daily feed intake (RFI1 to RFI4) for eachpig to be used in multiple-trait analyses. As an example ofhow this is done, predict (or estimate) ADFI for each pig for
model 1, using the equation ADFI = b0 + b1(initial test age)+ b2(initial test weight) + b3(ADG) and calculate ADFI. Theregression coefficients, b0, b1, b2, and b3 come from theanalysis described above and initial test age, initial test weightand ADG are the actual observed values for each pig. This isthe ADFI that is estimated to be necessary for maintenanceand gain at this age, weight and ADG. The difference be-tween this predicted ADFI and the actual ADFI of each pigwould be RFI1. Measures for RFI2, RFI3, and RFI4 are ob-tained similarly, with the production traits of backfat andloin eye area being added one at a time or together.
Results and Discussion
Phenotypic average initial test weight was 117 lb. Overthe years included in this study, boars gained an average of2.20 lb a day and ate an average of 5.95 lb of feed a day.Results of analyses for single-trait models for performanceand feed conversion traits are in Table 3. Several estimatesof heritability for each trait were obtained through the vari-ous analyses. There were nine different estimates for ADG,backfat, and LEA, and four for ADFI, F:G, and the measuresof RFI. Heritability estimates did not differ by more than1% for any of these analyses; therefore, results of the single-trait analyses are reported for simplicity. Heritabilities ofADG, backfat, and LEA were .24, .36, and .24, respectively.Heritability of ADFI was .23. Estimates of heritability ofresidual DFI measures were similar to those for F:G (.16;Table 3), ranging from .10 to .17. Measures of residual DFIthat included backfat had lower estimates of heritability thanthose without backfat included (RFI2 and RFI4 vs RFI1 andRFI3).
Litter effects were significant sources of variation forall traits examined with the proportion of phenotypic varia-tion accounted for by litter effects ranging from .13 to .26(Table 3). Estimates of heritability with litter effects in themodel were around 10% lower than those obtained with onlyrandom animal effects in the model (Johnson, et al., 1998).Feed conversion, growth, and feed intake are interrelated,and no single character can be fully understood without con-sideration of the others. Genetic (r
g) and phenotypic (r
p) cor-
relations among production traits and measures of feed con-version are in Table 4. Unfavorable genetic (.37) and pheno-typic correlations (.46) were found between ADG andbackfat, implying that as ADG increases so does backfat.Loin eye area was positively associated with ADG (r
g = .36)
and negatively associated with backfat (rg = -.27). Both ADG
and backfat were genetically correlated with ADFI (rg = .82
and .64, respectively), although LEA was not. Phenotypiccorrelations were slightly lower, being .72 for ADG withADFI and .57 for backfat and ADFI. Thus, faster growingboars had greater daily feed intakes; so did fatter boars. Thefeed:gain ratio was negatively correlated with ADG (r
g =
-.32) and positively correlated to backfat (rg = .40); thus, ADG
and backfat were both favorably related genetically with F:G.Loin eye area had a negative genetic correlation (-.52) withF:G, implying that boars with larger LEA were more effi-

Arkansas Animal Science Department Report 1999
43
cient. Lower correlations were found between backfat andLEA (r
g = -.27 and r
p = .04).
Estimates of genetic and phenotypic correlations be-tween production traits and measures of residual daily feedintake are in Table 5. Genetic correlations between ADG andresidual daily feed intake were small and positive (.11 to.18). Backfat was genetically correlated with residual feedintake, particularly when residual feed intake was not ad-justed for backfat (.67 for RFI1 and RFI3). Correlations wereall positive, however, indicating that selection for decreasedresidual feed intake would result in decreased backfat. Nega-tive genetic correlations were found between loin eye areaand all measures of residual ADFI, with estimates beinghigher for measures of residual feed not adjusted for backfat(-.51 with RFI1 and -.48 with RFI3 vs. -.31 with RFI2 andRFI4). As expected, phenotypic correlations between ADGand measures of residual feed intake were near zero (esti-mates of zero; Table 5) because residuals from the popula-tion regression are uncorrelated with all variables in the re-gression. Likewise, RFI would be uncorrelated with backfatwhen it is in the model and with LEA when it is in the model.However, backfat was phenotypically correlated with RFI1(.33) and RFI3 (.32), and phenotypic correlations of loin eyearea with RFI1 and RFI2 were low and negative.
In summary, faster-gaining boars had a tendency to eatmore (r
g = .82) and, when one looks at gross feed efficiency,
were more efficient (rg = -.32). The fatter boars also ate more
(rg = .64) but were less efficient (r
g = .40). Relationships of
ADG with residual feed intake, however, were low (.11 to.18). Genetic correlations of backfat with measures of RFIwere positive, and genetic correlations of loin eye area withmeasures of RFI were negative. These correlations varieddepending on whether RFI was adjusted for backfat.
Implications
Results of this study indicate that residual feed intakeis low to moderately heritable and should respond to selec-tion. Genetic correlations indicate that it should be possibleto select for reduced residual feed intake without adverselyaffecting average daily gain. Backfat should also decrease,and loin eye area should increase. The amount of change inbackfat or loin eye area would depend on which measure ofresidual feed intake is used.
Literature Cited
Boldman, K., et al. 1993. A manual for use of MTDFREML- A set of programs to obtain estimates of variances andcovariances. ARS, USDA, Washington, DC.
Boldman, K. G., and L. D. Van Vleck. 1991. J. Dairy Sci.74:4337-4343.
Johnson, Z. B., et al. 1998. J. Anim. Sci. 76:(Suppl.1):51,(Abstr.).
Mrode, R. A., and B. W. Kennedy. 1993. Anim. Prod. 56:225-232.

AAES Research Series 470
44
Table 1. Frequency distribution for number of litters per sire.a
Number of litters/sire Number of sires
1 1772 363 354 285 316 177 168 279 1310 1611 2212 1813 1414 1715 1816 1017 1018 1019 2120 1321 1922 1323 1424 925 9
26-30 3331-35 1836-40 1341-45 1346-50 11> 50 12
a For example, 177 sires had only one litter, 36 sires had two litters, etc. Twelve sires had more than 50 litters.

Arkansas Animal Science Department Report 1999
45
Table 2. Frequency distributions for number of contemporary groups in which a sire was representedand for number of sires represented in a contemporary group.
Number of contemporary groups Number of sires represented in which a sire was representeda in a contemporary groupb
Contemporary Number of sires Number of sires Number ofgroup represented classification contemporary
classification groups
1 189 1-3 42 54 4 33 53 5 64 40 6 75 33 7 116 31 8 207 31 9 258 40 10 239 39 11 2810 31 12 2211 15 13 2412 29 14 1613 28 15 1414 18 16 1415 19 17 15
16-20 31 18 2421-25 18 19 2526-30 8 20 20>30 6 21 16
22 923 624 525 6
> 25 10
a For example, 189 sires were represented in only one contemporary group, 54 sires were represented in twocontemporary groups, etc. Six sires were represented in more than 30 contemporary groups.
b For example, four contemporary groups had < 4 (1 to 3) sires represented, three contemporary groups hadfour sires represented, etc. Ten contemporary groups had > 25 sires represented.

AAES Research Series 470
46
Table 3. Results of analyses of single trait models with initial test age as a covariate.
Heritability Litter variance relativeTrait estimate (h2) to phenotypic variance (c2)
ADG .24 .18Daily feed intake .23 .22Feed:gain .16 .26Backfat .36 .13Loin eye area .24 .18Residual feed intake 1a .17 .26Residual feed intake 2b .11 .26Residual feed intake 3c .15 .26Residual feed intake 4d .10 .26
a Adjusted for initial test age and weight and test ADG.b Adjusted for initial test age and weight, test ADG and backfat.c Adjusted for initial test age and weight, test ADG and loin eye area.d Adjusted for initial test age and weight, test ADG, backfat and loin eye area.
Table 4. Estimates of genetic (rg) and phenotypic (r
p) correlations between performance
and feed conversion traits.
ADG Backfat Loin eye areaTrait r
gr
pr
gr
pr
gr
p
Backfat .37 .46Loin eye area .36 .31 -.27 .04Average daily feed intake .82 .72 .64 .57 .00 .18Feed:gain -.32 -.39 .40 .14 -.52 .16
Table 5. Estimates of genetic (rg) and phenotypic (r
p) correlations between measures
of residual daily feed intake and performance traits.
ADG Backfat Loin eye areaResidual daily feed intake r
gr
pr
gr
pr
gr
p
Residual feed intake 1a .11 .01 .67 .33 -.51 -.10Residual feed intake 2b .17 .01 .22 .02 -.31 -.05Residual feed intake 3c .12 .01 .67 .32 -.48 -.03Residual feed intake 4d .18 .01 .20 .02 -.31 -.01
a Adjusted for initial test age and weight and test ADG.b Adjusted for initial test age and weight, test ADG and backfat.c Adjusted for initial test age and weight, test ADG and loin eye area.d Adjusted for initial test age and weight, test ADG, backfat and loin eye area.

Arkansas Animal Science Department Report 1999
47
Effect of Timing of Artificial Insemination on Gender Ratio in Beef Cattle
Rick W. Rorie and Toby D. Lester1
Story In Brief
A study was carried out to determine effect of timing of insemination on the gender of offspring in cattle.The estrous cycles of Angus heifers (n = 41) and cows (n = 98) were synchronized and a HeatWatch® electronicestrus detection system was used to monitor for onset of estrus. Animals were artificially inseminated at ap-proximately 20 or 10 hours before expected ovulation. Sixty to 80 days after insemination, ultrasonography wasused to confirm pregnancy status and to determine the gender of fetuses. Twenty-nine of 41 heifers and 69 of 98cows were detected in estrus after synchronization and were inseminated, with 20 of 29 heifers and 48 of 69cows subsequently confirmed pregnant. Neither the length of estrus nor intensity (number of mounts) affectedpregnancy rate or gender ratio (P > 0.42). Timing of insemination had no effect on gender ratio (P = 0.88). Nodifferences (P = 0.49) were detected in the gender ratios resulting from different sires or semen batches. Incontrast to a previously reported study, our results indicate inseminating beef cattle at approximately 20 or 10hours before expected ovulation does not alter the gender ratio of the resultant calves.
1Both authors are associated with the Department of Animal Science, Fayetteville.
Introduction
Numerous efforts have been directed toward develop-ing procedures for preselecting the gender of offspring. Re-cently, Wehner et al. (1997) reported that timing of insemi-nation could be used to alter the gender ratio in cattle. Intheir study, cows were inseminated either early or late inrelation to onset of estrus (estimated as 20 ± 3 and 10 ± 2hours before ovulation, respectively). The authors reportedthat the early inseminations resulted in mostly heifer calvesand late inseminations resulted in mostly bull calves. If tim-ing of insemination can be used to alter the gender of off-spring in cattle, it could have a substantial economic impactand practical application to the beef and dairy industries.Therefore, the objective of the present study was to furtherinvestigate the effect of timing of insemination in relation toonset of estrus and ovulation on the gender ratio of offspringin beef cattle.
Experimental Procedures
Forty-one nulliparous purebred Angus heifers and 98Angus cows (parity 1 to 7) were used for this study. Theanimals were owned and maintained by a local producer-cooperator. The cows were 45 to 60 days postpartum, andall animals had a body condition score (BCS) of 6 to 7. Theheifers were synchronized by feeding 0.5 mg/head/day ofmelengestrol acetate (MGA) for 16 days. Seventeen daysafter MGA withdrawal, heifers were given an injection of
PGF2alpha (Lutalyse®). The cows were synchronized bytreatment with GnRH (Cystroelin®) followed 7 days later byPGF2alpha treatment.
A HeatWatch® electronic estrus detection system wasused to continuously monitor cows and heifers for onset ofestrus, based on mounting activity. Patches containing mountdetection transmitters were placed on all animals at the timeof PGF2alpha injection. Onset of estrus was presumed tooccur when three or more mounts (each of a duration of 1second or more) were detected within a 4-hour period. Basedon a study by Looper et al. (1998), it was assumed that ovu-lation would occur approximately 32 hours after the onset ofestrus. In order to time inseminations approximately 20 or10 hours before ovulation, animals were artificially insemi-nated at either 8 to 10 hours (early group) or 20 to 25 hours(late group) after the onset of estrus. An experienced techni-cian performed all inseminations. Sire selection for eachmating was predetermined by the producer-cooperator. Sireand semen lot or freeze date were recorded for each breed-ing in order to later determine any effect on gender ratio.After insemination, mount detection transmitters were re-moved from the cows and heifers. Starting 18 days post-insemination, animals were visually observed twice daily forreturn to estrus.
At 60 to 80 days of gestation, ultrasonography was per-formed on all animals by an experienced technician, to con-firm pregnancy status and to determine gender of fetuses.Fetal size (crown to rump length) was used to confirm fetalage. The gender of fetuses was determined by identification

AAES Research Series 470
48
of the fetal prepuce and/or scrotum, or the absence of thesestructures and the presence of a vulva. Breeding dates andgender of calves were subsequently confirmed at calving.Data on pregnancy status and gender were analyzed using ageneralized linear model with probit link function. Includedas variables in the model were parity (cows vs. heifers), timeof insemination, sire or semen batch, length of estrus andintensity (mounting activity) of estrus.
Results and Discussion
Twenty-nine of 41 (70.7%) heifers and 69 of 98 (70.4%)cows were detected in estrus within 5 days of synchroniza-tion treatment and were inseminated. The pregnancy rate wassimilar for heifers and cows (P = 0.95). Twenty of 29 (68.9%)heifers and 48 of 69 (69.5%) cows were confirmed pregnantand had their fetuses sexed by ultrasonography (Table 1).The mean insemination times for the early and late groupswere 9.0 ± 0.1 and 22.9 ± 0.3 hours after onset of estrus,respectively. Based on ovulation occurring at 32 hours afterthe onset of estrus, the early and late inseminations wouldhave been at least 20 and no more than 10 hours before ovu-lation, respectively. Timing of insemination had no effect ongender ratio (P = 0.89). The percentage of bulls and heiferswas similar in both insemination groups.
Although Wehner et al. (1997) reported over 90% accu-racy in preselecting the gender of calves by timing insemi-nations at approximately 20 or 10 hours before expected ovu-lation, we were unable to detect any effect of time of insemi-nation on gender ratio in the present study. However, ourresults are in agreement with recent studies in dairy cattle.Jobst and Nebel (1998) analyzed data (representing 11 herdsand 822 calvings) for differences in the male to female ratioof dairy calves born as the result of inseminations occurringat 0 to 8, 8 to 16, or 16 to 24 hours after the onset of estrus.All cows included in Jobst and Nebel’s study had been con-tinuously monitored with a HeatWatch system for actual onsetof estrus, and calving dates were used to confirm breedingdates. The authors reported that overall, 53.5% of the calvesborn were bulls. There was no effect of parity, herd or timeof insemination on the ratio of bull to heifer calves at calv-ing. Another study in dairy cattle (Pursley et al., 1998) re-ported an increase in the percentage of females born as theresult of inseminating at either 0 or 32 hours after onset ofestrus, but no effect on the gender ratio of calves resultingfrom inseminations at 8, 16, and 24 hours after onset of es-trus.
A recent study by Chandler et al. (1998) reported thatwithin sires, the ratio of X- to Y-bearing spermatazoa fromdifferent ejaculates of semen can vary significantly and thisvaried ratio translates into altered sex ratio of offspring.Therefore, we recorded the sire and semen lot or freeze datefor each insemination. Semen from 13 sires representing 17lots was used to inseminate the cows and heifers. All semenlots were represented in both insemination groups. The num-ber of pregnancies resulting from different lots of semenranged from 1 to 12. Overall, no detectable differences
(P = 0.49) were found in the gender ratios resulting fromdifferent sires or semen lots. Although there were differencesnoted in the percentage of bull and heifer calves resultingfrom insemination with different lots of semen, there werenot enough calves produced from the various lots for mean-ingful comparison. Semen from the same sire but two dif-ferent lots was used to inseminate all of the heifers in thepresent study. There was a tendency (P = 0.08) for more fe-male pregnancies in heifers than cows (65 vs. 41.7%, re-spectively), regardless of time of insemination.
Length of estrus ranged from 0.5 to 20 hours, with amean of 8.6 ± 3.7 hours. The number of mounts occurringduring estrus ranged from four to 152, with a mean of 33.8 ±27.8. Neither the length of estrus nor intensity (number ofmounts) had an effect on conception rate or gender ratio (P >0.42). The time of insemination after the onset of estrus hadno effect on pregnancy rate (P = 0.94). The results of ourstudy indicate that acceptable pregnancy rates can beachieved in beef cattle over a range of insemination times ifthe time of actual onset of estrus is known. Pregnancy rateswere almost identical (69%) for our early and late insemina-tions. Within the range noted in this study, length, and in-tensity (number of mounts) of estrus were related to preg-nancy rate. Studies with dairy cattle also report no differ-ences in pregnancy rate due to intensity or duration of estrus(Dransfield et al., 1998).
Implications
These results indicate that timing inseminations in beefcattle to occur at either 20 or 10 hours before ovulation doesnot alter the gender ratio. However, the results do indicatethat acceptable pregnancy rates can be achieved over a rangeof insemination times if the time of actual onset of estrus isknown.
References
Chandler, J.E., et al. 1998. J. Dairy Sci. 81:1855-1867.Dransfield, M.B.G., et al. 1998. J. Dairy Sci. 81:1874-1882.Jobst, S.M. and R.L. Nebel. 1998. J. Dairy Sci. 81(Suppl.
1):244.Looper, M.L., et al. 1998. J. Anim. Sci. 76(Suppl. 1):215.Pursley, R.J., et al. 1998. J. Dairy Sci. 81:2139-2144.Wehner, G.R., et al. 1997. Anim. Reprod. Sci. 46:27-34.

Arkansas Animal Science Department Report 1999
49
Table 1. Effect of time of insemination after the onset of estrus on pregnancy rate andgender ratio in cattle.
Inseminated 8 to 10 Inseminated 20 to 25hours after the onset hours after the onset
Item of estrus of estrus Overall
No. inseminated 56 42 98
No. (%) pregnant 39 (69.6) 29 (69.0) 68 (69.4)
No. (%) bulls 21 (53.8) 15 (51.7) 36 (52.9)
No. (%) heifers 18 (46.2) 14 (48.3) 32 (47.1)

AAES Research Series 470
50
Effect of Estrous Parameters and Time of Insemination onPregnancy Rate in Beef Cattle
Rick W. Rorie and Toby D. Lester1
Story in Brief
This study evaluated the effect of interval from synchronization treatment to onset of estrus, intensity (mountingactivity) and length of estrus, and timing of insemination on pregnancy rate in beef cattle. An electronic estrousdetection (HeatWatch®) system was used to continuously monitor onset of estrus. Cows detected in estrus (n =295) were artificially inseminated between 7.5 and 26 hours after the onset of estrus. Pregnancy was confirmedby ultrasonography at 60 to 80 days of gestation. Overall, the single-service pregnancy rate was 71.5%. Withinthe range of insemination times in this study, pregnancy rate was not affected (P = .54). Pregnancy rate was notaffected by the interval from synchronization treatment to estrus (P = .93). Length of estrus ranged from .5 to 23.3hours and was not related (P = .82) to pregnancy rate. Comparison of data for open and pregnant cows indicateda possible trend for reduced fertility in animals with fewer mounts during estrus (P = .16). The results of this studyindicate that subsequent pregnancy rate is unrelated to the interval from synchronization treatment to onset ofestrus or length of estrus, but may be affected by estrus intensity. Knowing the actual time of onset of estrusallows for flexibility in time of insemination without compromising pregnancy rate.
Introduction
The general recommendation for artificial inseminationof cattle is to observe cows at least twice daily and insemi-nate approximately 12 hours after detection of standing es-trus. When cows are observed twice daily, there can be adifference of several hours between detected and actual on-set of estrus. This difference might affect subsequent preg-nancy rates. The HeatWatch® electronic estrus detection sys-tem allows for convenient, continuous monitoring for onsetof estrus (based on mounting activity), so that the effect ofactual time of insemination on pregnancy rate can be deter-mined. This system also provides information on length ofestrus and mounting activity that could be related to the suc-cess rate of artificial insemination. There are conflicting re-ports on the effect of time of insemination and other factorson conception rates in dairy cattle. In the present study, theHeatWatch system was used to evaluate the effect of inter-val from synchronization treatment to onset of estrus, lengthand intensity (mounting activity) of estrus, and timing ofinsemination on pregnancy rate in beef cattle.
Experimental Procedures
Angus cows and heifers ranging in body condition from5 to 7 were used for this study. The cows were parity 1 to 8and were 45 to 60 days postpartum. Heifers were synchro-nized by feeding 0.5 mg/head/day of melengestrol acetate
(MGA) for 14 days. Seventeen to 18 days after MGA with-drawal, heifers were given an injection of prostaglandin F2(Lutalyse®). The cows were synchronized by treatment withgonadotropin-releasing hormone (Cystroelin®) followed 7days later by Lutalyse treatment. A HeatWatch electronicestrus detection system was used to continuously monitorthe cows and heifers for mounting activity. The patches con-taining mount detection transmitters were placed on all ani-mals at the time of Lutalyse injection. Onset of estrus waspresumed to occur when three or more mounts with a dura-tion of at least 1 second each were detected within a 4-hourperiod.
Animals detected in estrus (n = 295) were inseminatedonce, from 7.5 to 26 hours after the actual onset of estrus.An experienced technician performed all inseminations.Approximately two weeks after insemination, all animalswere placed with clean-up bulls. Ultrasonography was usedat 60 to 80 days of gestation to determine pregnancy status.Fetal crown-to-rump length (fetal size) was measured to de-termine if pregnancy resulted from artificial insemination ornatural service. Cows or heifers confirmed pregnant by natu-ral service were excluded from data analysis. Data for tim-ing of insemination, interval from synchronization treatmentto estrus, length of estrus and mount activity were catego-rized for analysis. The effect of these parameters on preg-nancy rate was then evaluated by chi-square analysis. Analy-sis of variance was used to compare each parameter for openvs. pregnant cows.
1Both authors are associated with the Department of Animal Science, Fayetteville.

Arkansas Animal Science Department Report 1999
51
Results and Discussion
Overall, 211 of 295 cows and heifers were confirmedpregnant for a single-service conception rate of 71.5%. Theinterval from synchronization treatment to onset of estrusranged from 4 to 147 hours. For analysis, data were catego-rized into 24-hour intervals (Table 1). The majority (74%)of the animals exhibited estrus 24 to 72 hours after synchro-nization treatment. The interval from synchronization treat-ment to onset of estrus had no effect on subsequent preg-nancy rate (P = .93).
Pregnancy rate was compared for insemination timescategorized in 4-hour intervals (Table 2). Pregnancy rateswere similar among insemination times (P = .54). Our find-ings are supported by a study in dairy cattle, which reportedpregnancy rates were similar for insemination occurring 0to 24 hours after the onset of estrus. These results suggestthat when the actual onset of estrus is known, timing of in-seminations can be adjusted for convenience (within reason)without compromising pregnancy rate. However, it is likelythat the optimum time of insemination could vary due to anumber of factors such as semen quality and placement, andenvironment.
The period of standing estrus of individual cows andheifers ranged from less than 1 hour to almost 24 hours inthis study. Pregnancy rate was similar (P = .82) regardless oflength of estrus (Table 3). About 35% of the animals in thisstudy had an estrus period of 8 hours or less. It is likely thatsome of these animals would have not been detected in es-trus if they had be visually observed only twice daily. It wouldappear that the HeatWatch system’s default parameters of
three or more mounts of 1 second or more each within a 4-hour period is adequate for identifying most animals in es-trus. However, some animals may only exhibit one or twomounts during their entire estrus period. It has been reportedthat animals that exhibit only one mount, but for several sec-onds duration, may become pregnant after insemination.However, the pregnancy rate is reduced in these animals.
Mounting activity ranged from four to over 147 mountsduring estrus (Table 4). Numerically, pregnancy rate washigher for animals with 30 to 50 total mounts during estrus.However, statistical analysis reveals no difference in preg-nancy rate due to mounting activity (P = .23). Comparisonof all pregnant vs. open cows (Table 5), reveals a trend(P = .16) for cows with fewer mounts during estrus to havereduced fertility. Some studies with dairy cattle indicate fer-tility is reduced in cows with few mounts during estrus whileothers report no effect of mounting activity on pregnancyrate. The interval from synchronization treatment to estrus,length of estrus and interval from onset of estrus to insemi-nation were similar for open and pregnant cows (P > .32).
Implications
Timing of artificial insemination can be adjusted withinreason without compromising pregnancy rate if the actualonset of estrus is known. Length of estrus, and time requiredfor animals to exhibit estrus after synchronization treatmentdo not appear to be related to subsequent pregnancy rate.Further study is needed to assess the effect of estrus inten-sity on pregnancy rate.
Table 1. Effect of interval from PGF2 Alpha Treatment to estrus on subsequent pregnancy rate.
Interval, PGF2 alpha No. of Category Percentto estrus (h) animals Mean ± SE pregnant
< 24 15 14.1 ± 1.96 73.3 ± .12> 24 to 48 84 38.3 ± .83 67.9 ± .05> 48 to 72 134 58.9 ± .65 72.4 ± .04> 72 to 96 39 83.9 ± 1.21 74.4 ± .07> 96 23 117.5 ± 1.58 73.9 ± .09

AAES Research Series 470
52
Table 2. Effect of interval from onset of estrus to insemination on conception rate.
Onset of estrus No. of Category Percentto A.I. (h) animals Mean ± SE pregnant
< 8 10 7.0 ± .42 80.0 ± .14> 8 to 12 69 9.8 ± .16 68.1 ± .05> 12 to 16 69 14.3 ± .16 68.1 ± .05> 16 to 20 67 17.8 ± .16 77.6 ± .05>20 to 24 66 22.3 ± .16 68.2 ± .06> 24 14 25.8 ± .36 85.7 ± .12
Table 3. Effect of length of estrus on subsequent pregnancy rate.
Length of No. of Category Percentestrus (h) animals Mean ± SE pregnant
< 4 19 2.7 ± .25 68.4 ± .10> 4 to 8 86 6.6 ± .12 68.6 ± .05> 8 to 12 114 10.1 ± .10 71.9 ± .06> 8 to 16 55 13.9 ± .15 72.7 ± .06> 16 to 20 15 18.1 ± .28 86.7 ± .12> 20 to 24 6 21.8 ± .45 66.7 ± .19
Table 4. Effect of mounting activity on subsequent pregnancy rate.
Number of No. of Category Percentmounts animals Mean ± SE pregnant
< 10 66 7.0 ± 1.20 65.2 ± .0611 to 20 70 15.3 ± 1.16 65.7 ± .0521 to 30 53 24.9 ± 1.33 71.7 ± .0631 to 40 31 35.5 ± 1.75 87.1 ± .0841 to 50 28 44.8 ± 1.84 82.1 ± .0951 to 60 15 56.5 ± 2.51 66.7 ± .12> 60 32 92.0 ± 1.72 75.0 ± .08
Table 5. Comparison of estrous parameters of open and pregnant beef cows.
Pregnancy statusItem Open Pregnant P-value
No. of animals 84 211Interval to estrus (h) 58.0 ± 2.75 58.0 ± 1.73 .778No. of mounts 27.0 ± 2.97 31.9 ± 1.87 .164Length of estrus 9.6 ± .45 10.2 ± .28 .318Interval to A.I. (h) 15.9 ± .59 16.2 ± .37 .629

Arkansas Animal Science Department Report 1999
53
Evaluation of a Two-Part Melengestrol AcetateEstrus Synchronization Regime
Shelley Wright, David Kreider, Rick Rorie, Natalie Huber, and Gary Murphy1
Story in Brief
An experiment was conducted using postpartum beef cows to evaluate the use of a two-part MelengestrolAcetate (MGA) treatment to synchronize estrus. Cows were randomly assigned to treatment groups by dayspostpartum and lactation status. Initial body weights were similar (P = .26) between the Control (107 ± 29 lb;mean ± standard error) and Treatment group (1029 ± 30 lb). Initial body condition scores (BCS) for the Controland Treatment groups were also similar (4.6 ± .1 vs. 4.8 ± .1; P = .19). Both the Control and Treatment groupsreceived 5 lb of supplement per head per day containing .5 mg MGA for 14 consecutive days followed by a 17-day withdrawal during which cows received 5 lb per head per day of supplement without MGA. On day 17 afterthe MGA withdrawal, cows in the Control group received a 25-mg intramuscular injection of prostaglandin F2
(Lutalyse®), while cows in the Treatment group were fed supplement containing MGA at .5 mg/head/day for anadditional 5 days. In the 10 days following the Lutalyse injection (Control group) or the second MGA with-drawal (Treatment group), estrus was monitored by a Heat Watch® (DDX, Denver) electronic estrus detectionsystem. Cows that were detected in estrus in the morning were artificially inseminated that evening and cows thatwere in estrus in the evening were inseminated the following morning. During the 10-day period in which estruswas monitored, 79% (30/38) of the control group were detected in estrus compared to 86% (31/36) animals in theTreatment group. Conception rates determined by ultrasound at approximately 30 days after artificial insemina-tion were 48.1% and 46.6% for the Control and Treatment groups respectively and were not different (P = .91).This study suggests that a two-part MGA feeding regime could be used successfully to synchronize estrus inpostpartum beef cows.
1All authors are associated with the Department of Animal Science, Fayetteville.
Introduction
The effectiveness of an estrus synchronization systemis measured by its ability to elicit a fertile, tightly synchro-nized estrus in a majority of treated females (Odde, 1990).Ideally, a system should be cost-effective, require minimumlabor, entail limited animal handling, and be user-friendly toa producer (Odde, 1990; Patterson et al., 1992). Orally ad-ministered Melengestrol Acetate (MGA) has been proven toeffectively suppress estrus and achieve estrus synchroniza-tion. However, estrus with low fertility is normally a conse-quence of estrus synchronized with MGA. Research hasshown that the low fertility is the result of the developmentof a persistent follicle on the ovary of some animals that hasan extended life span during the MGA treatment. The per-sistent follicle is caused by the frequent pulsatile release ofLH due to incomplete suppression of LH release by the lev-els of MGA fed (McDowell et al., 1998). Melengestrol Ac-etate withdrawal results in ovulation of the persistent (aged)follicle which usually has low fertility. Further research hasshown that treatment with MGA initiated when a functionalcorpus luteum is present usually does not result in develop-ment of a persistent follicle with low fertility (Yelich et al.,
1997). The objective of this study was to determine if a two-part MGA treatment would effectively synchronize estrusand give acceptable conception rates in suckled postpartumbeef cows.
Materials and Methods
Primiparous (first calf) and multiparous cows from thecrossbred (predominantly Angus) beef herd at the Univer-sity of Arkansas research unit at Savoy were used to com-pare two estrus synchronization regimes. At the start of theexperiment (day 0), all 74 cows were weighed and assigneda body condition score (BCS) of 1 to 9 (1 = extremely ema-ciated, 9 = extremely obese). Animals were then randomlyassigned to one of two treatment groups. Both the Controland Treatment groups received 5 lb of supplement (Table 1)per head per day containing .5 mg MGA for 14 consecutivedays (day 0 to day 14) followed by a 17-day withdrawal (day15 to day 31) during which cows received 5 lb per head perday of supplement without MGA. On day 31, cows in theControl group received a 25-mg intramuscular injection ofprostaglandin F
2 (Lutalyse®, Pharmacia-Upjohn, Kalamazoo)
and cows in the Treatment group received supplement con-

AAES Research Series 470
54
taining MGA at .5 mg/head/day for an additional 5 days. Allcows on all treatments were bunk fed and were kept on thesame pastures or hay (mixed fescue (Festuca arundinacea)and clover (Trifolium repens, Trifolium dubium) during thefirst 31 days of the experiment (14 days on MGA + 17-daywithdrawal). The application of treatments is illustrated inFig. 1. Cows had free access to water and mineral supple-ment during the entire experiment. In the 10 days followingthe Lutalyse injection (Control group; day 31 to day 41) orthe second MGA withdrawal (Treatment group; day 36 today 46) estrus was monitored by a Heat Watch (DDX, Den-ver) electronic estrus detection system. Cows displaying es-trus in the morning were artificially inseminated that eveningand cows displaying estrus in the evening were inseminatedthe following morning. Pregnancy rates were determined atapproximately 30 days from the last day of artificial insemi-nation in both groups by ultrasonography.
Differences in the percentage of animals that exhibitedestrus after treatment and pregnancy rate to artificial insemi-nation were compared using Chi- Square analysis in JMP ofSAS (1989). Time to estrus after Lutalyse injection or MGAwithdrawal was compared by ANOVA of JMP of SAS (1989).There was no significant difference in treatment effects dueto maternal status (primiparous vs. multiparous); therefore,data for primiparous and multiparous cows were combinedfor the analysis of results.
Results
Body weight and BCS data for the two treatments aresummarized in Table 2. Average body weight and BCS scoresat the start of the experiment were not significantly differentbetween the two treatments. Percent of cows showing estrusand time to estrus after the first MGA withdrawal (day 15 today 31) are shown in Table 3. A total of 77.7% (57/74) ani-mals were detected in estrus at an average time of 110.7 ±4.2 hours. There was no difference in the response of Con-trol and Treatment groups in time to estrus or percent in es-trus after the first MGA withdrawal.
Data for estrus response and pregnancy rates to AI afterthe Lutalyse injection and the second MGA withdrawal arepresented in Table 4. Seventy-nine percent (30/38) of the
Control animals were detected in estrus compared to 86%(31/36) of the Treatment group. Hours to estrus were nu-merically lower for the Control group (93.5 ± 12.5) com-pared to the Treatment group (116.6 ± 12.8) but were notsignificantly different. Pregnancy rates at 30 days after thelast artificial insemination were not different between thetreatments (48.1% vs. 46.6% for Control and Treatment,respectively) .
Discussion
The two-part MGA estrus synchronization regime evalu-ated in this experiment resulted in a numerically higher per-centage of cows in estrus than the Control group althoughthe comparison was not statistically different. Pregnancy toartificial insemination was comparable for both groups. Thedata presented suggests that a two-part MGA regime mightbe a successful and easily adapted method of estrus synchro-nization in beef cows. There was no evidence in this study tosuggest the second short-term exposure to MGA used in thisexperiment had detrimental effects on pregnancy rate whencompared to the commonly used method of synchronizationused in the Control group.
Implications
Results of this study indicate that a two-part MGA es-trus synchronization may offer an effective way to synchro-nize animals, with the advantage of a more cost effectiveprogram that does not require the handling of cattle for oneor more injections. Pregnancy rates were similar to the morecommonly used protocol of MGA followed by a Lutalyseinjection. Further research is needed to substantiate theseresults and to better evaluate pregnancy rates to artificial in-semination following synchronization by this method.
Literature Cited
JMP for Windows. 1989. Ver. 3.2.5. SAS Inst. Inc. Cary, NC.McDonnell, C.M., et al. 1998. J. Anim. Sci. 76:850-855.Odde, K.G. 1990. J. Anim. Sci. 68:817.Patterson, D.J., et al. 1995. J. Anim. Sci. 73:954-959.Yelich, J.V., et al. 1997. J. Anim. Sci. 75:745-754.
Table 1. Composition of cow supplement.
Ingredient Pounds
Corn 1,750Soybean meal 180Molasses 46Limestone 20Vitamins A, B, & E premix 4

Arkansas Animal Science Department Report 1999
55
Table 2. Body weight and BCS (Mean + SE) by treatment group.
Treatment group Number Body weight (lb) BCS1
Control 38 1,076 + 29 4.6 + .1Treatment 36 1,029 + 30 4.8 + 1
1Scores 1 to 9; 1 = extremely emaciated, 9 = extremely obese.
Table 3. Estrus response after first MGA withdrawal and hours to estrus.
Treatment group % in estrus Number/Total Avg. hours to estrus
Control 76.3 29/38 115.0 + 6.6Treatment 77.8 28/36 106.3 + 6.7Total 77.7 57/74 110.7 + 4.2
Table 4. Estrus response and pregnancy rates after Lutalyse injection or second MGA withdrawal.
Percent in Avg. hours Percen PregnantTreatment group estrus Number/total to estrus at 30 days
Control 79 30/38 93.5 + 12.5 48.1Treatment 86 31/36 116.6 + 12.8 46.6
Fig. 1. Allocation of treatments.
Control Group
Treatment Group

AAES Research Series 470
56
Persistent Efficacies of Doramectin and Ivermectin inArkansas Stocker Calves
T.A. Yazwinski, Chris Tucker, Zelpha Johnson, Homer Featherston, and Sharon Copeland1
Story in Brief
The persistent efficacies of doramectin injectable solution (DECTOMAX®, Pfizer) and ivermectin inject-able solution (IVOMEC®, Merial) were compared for use in stocker calves. Parasite-free calves were treatedwith the parasiticides, subsequently challenged with infective nematode larvae and then necropsied for parasitecounts. Significantly (P < .05) fewer total nematodes were recovered at necropsy from doramectin-treated calvesthan from ivermectin-treated calves when parasite challenge was given at 14 or 21 days after treatment. Doramectindisplayed a greater magnitude and duration of efficacy than did ivermectin against the establishment of infectionsby Ostertagia, Cooperia, Oesophagostomum, and Trichostrongylus genera nematodes.
1All authors are associated with the Department of Animal Science, Fayetteville
Introduction
Internal parasite control for cattle has evolved in stages.In the 1960s, products that were ineffective, toxic, or bothwere replaced with thiabendazole, levamisole and morantel.In the 1970s, a family of compounds related to thiabenda-zole were isolated and investigated. Those which becamecleared for use in USA cattle were fenbendazole, oxfendazole,and albendazole. In the early 1980s, parasite control en-tered its current era with the availability of macrolides; mol-ecules that are produced by the bacterium Streptomyces andare active not only against nematode parasites, but insectand arachnid parasites as well. The first available macrolidewas ivermectin, followed in the USA by doramectin,eprinomectin and moxidectin. These “endectocides” (prod-ucts which kill both helminths and external parasites) arevery similar in chemical structure, and therefore share manyattributes (Shoop et al. 1995; McKeller and Benchaoui,1996). One characteristic of macrolide preparations is per-sistence i.e. the period of time after treatment when residuallevels of endectocide provide protection against new infec-tions. It is this characteristic of persistence which has beenthe focus of considerable research wherein “safe” post-treat-ment periods are documented for each product and compari-sons are made between products. The data reported here arefrom a study where the protective period of injectableivermectin is compared with the protective period of inject-able doramectin.
Experimental Procedures
Stocker calves (N = 55) were treated with fenbendazoleat the dose rate of 10 mg/kg BW and placed on clean con-crete for the remainder of the study to preclude exposure toany extraneous nematode challenge. Seven days later (14
days before the trial began), the fenbendazole treatments wererepeated; this to insure parasite-free status of all calves. Ontrial day 0, 49 of the calves were selected for the study basedon health and homogeneity of weight, weighed (range was240 to 355 lb), blocked by weight into seven groups of seven,and randomly assigned treatment group designation (1through 7) within each block. Animals were then penned bytreatment group. Treatment groups were treatment withdoramectin (DECTOMAX®, Pfizer) or ivermectin(IVOMEC®, Merial) on day 0, day 7, or day 14 (both givenat the rate of 200 mcg/kg body weight by subcutaneous in-jection). The seventh group of calves served as the control.On trial day 28, each calf was orally administered an infec-tion dose consisting of approximately 15,800 Cooperia, 7,100Ostertagia, 5,100 Trichostrongylus, 2,300 Oesophagostomumand 1,800 Haemonchus L3 larvae of recent field isolation.
On trial days 49, 50, and 51 all animals were fecalsampled for parasite egg counts, euthanized, and necropsiedfor parasite recovery and quantification. All parasitologicaltechniques used have been detailed elsewhere (Yazwinski etal., 1994) and are consistent with the currently governingguidelines (Wood et al., 1995).
The data were analyzed with general linear models(SAS, 1988). One-way analysis of variance was used to as-sess treatment effect on EPG (parasite eggs per gram of fe-ces) and parasite counts. When control animal counts of zerowere observed for a particular parasite, they, and an equalnumber of corresponding zero counts in each of the othergroups were excluded from statistical analysis. Parasite andEPG counts were transformed to the natural log (count + 1)before analysis. All data were back-transformed to geomet-ric means for presentation and persistent efficacy calcula-tions by standard formula.

Arkansas Animal Science Department Report 1999
57
Results
Geometric means of EPG counts as well as incidenceof patent infections, both as determined at necropsy, are pre-sented in Table 1. Animals treated with either avermectin at28 d prior to larval challenge displayed EPG counts similarto control calf levels. Likewise, calves receiving ivermectinat 21 days prior to challenge displayed EPG counts similarto those of control calves (P < .05). Contrastingly, doramectintreatment at 21 days before challenge resulted in EPG levelssignificantly lower than control counts (P < .05). For calvesreceiving treatments at 14 days prior to challenge, necropsyEPG levels were significantly lower for doramectin than forivermectin treated calves, with no patent infections evidentin the doramectin group as opposed to a 57% incidence ofpatency (4/7) for ivermectin treated calves.
Geometric means by treatment group of calculated to-tal nematode counts as seen at necropsy are presented in Table2.Treatment induced percent reductions based on these meansare presented in Table 3. Of the nematodes provided at chal-lenge, H. placei, O. lyrata, C. spatulata, and T. colubriformisfailed to establish in control animals at an incidence thatpermitted definitive treatment group comparisons, and aretherefore not included in this report. When given at 28 dayspre-challenge, doramectin significantly reduced (P < .05) theestablishment of subsequent populations of all Ostertagiaforms as well as fourth stage larvae of Cooperia spp andO. radiatum. Given at the same pre-challenge interval,ivermectin significantly reduced only subsequent populationsof fourth stage larvae of Ostertagia and Cooperia spp.T. axei proved most refractory to persistent anthelmintic ac-tivity with 0.0% reductions in burden establishment for bothavermectins as administered at 28 days pre-challenge.
When given at 21 days prior to nematode challenge,the differences in persistent activity by the two avermectinswere most demonstrable. Of the 13 nematode populations(genus/species/sex/stage of development) quantified atnecropsy and of sufficient incidence to provide meaningfulstatistical inference, eight populations were reduced to a sig-nificantly greater extent when prior treatment was withdoramectin than with ivermectin (P < .05). Of the remainingfive nematode populations, doramectin displayed greaterpercent reductions than did ivermectin although correspond-ing group means were not significantly different.
When given 14 days prior to nematode administration,doramectin and ivermectin reduced subsequent establishmentof parasite populations by 98.8 to 100.0 and 76.4 to 99.6%,respectively. Six of the 13 parasite populations were reducedsignificantly more by doramectin than by ivermectin treat-ment (P < .05).
Discussion
In the current study, persistent efficacies of doramectinand ivermectin were assessed for 14-, 21-, and 28-day inter-vals between treatment and subsequent nematode challenge.Thirteen nematode populations (genus/species/stage/sex)
were quantified at necropsy and analyzed. In no instance wasivermectin significantly more effective than doramectin inpreventing nematode establishment. Conversely, when givenat 14, 21, and 28 days prior to challenge, doramectin reducedsubsequent nematode populations significantly more thanivermectin for six, eight, and two of the l3 quantified nema-tode forms, respectively (P < .05).
According to the World Association for the Advance-ment of Veterinary Parasitology, an anthelmintic is consid-ered effective when a nematode reduction percentage of ≥90% is realized (Wood et al., 1995). Effectiveness forivermectin was shown to persist after treatment for at least14 days, but less than 21 days for Cooperia and Ostertagia.For doramectin, effectiveness against Cooperia was seen tolast at least 21 days but less than 28 days after treatment.For the prophylaxis of Ostertagia infections, an end point ofeffective persistent efficacy was not established fordoramectin in the current study, with ≥ 94.8% reduction inOstertagia infections, which resulted from larvae adminis-tered at 28 days after treatment. The more prolonged persis-tent efficacy conferred by doramectin as opposed toivermectin should prove significant to the well-being of Ar-kansas stocker calves; animals which acquire Ostertagia andCooperia from contaminated pasture at rates that exceed2,000 parasites per calf per day (Yazwinski et al., 1995).
As used in the current study (commercial injectable for-mulations), doramectin far exceeded ivermectin in effectivelyprohibiting post-treatment nematode establishment. Thecause of this enhanced persistence has not to date been to-tally defined. In studies that document the pharmacokineticsof doramectin and ivermectin when administered by subcu-taneous injection (Lanusse et al., 1997; Toutain et al., 1997),doramectin was shown to have greater post-treatment bloodlevels than ivermectin; an element of bioavailability whichmight account for the greater anthelmintic persistence ofdoramectin as compared to ivermectin. However, levels ofcirculating (blood plasma) avermectin may only in part beresponsible for persistent efficacy. Additional factors that mayinfluence persistence include animal sex and fat content, in-testinal tract rate of passage and chemistry, stage of parasitedevelopment, tendencies for some parasites to sequester atsites of low anthelmintic titer and anthelmintic formulation.This last factor is illustrated in a study showing that persis-tence of ivermectin is much greater against worms whendelivered by injection as opposed to pour-on (Yazwinski etal., 1994).
A number of benefits have been ascribed to the persis-tence of anthelmintics (Brunsdon et al., 1989). These ben-efits include protection against re-infection for an extendedposttreatment period, a decrease in the number of antipara-sitic treatments cattle must receive in order to maintain prof-itable production and lastly, a means by which pasture con-tamination may be lessened as a result of grazing by recently-treated animals. Unfortunately, possible negative impacts ofpersistence might also exist. Respective data and/or predic-tions presented to date include; a lessening of host protec-tive immunity resulting in decreased animal performance

AAES Research Series 470
58
during subsequent grazing periods (Vercruysse et al., 1995),a selection for resistant parasites due to challenge duringpersistent yet only partially effective drug presence(McKenna, 1987) and long-term introduction of “ecotoxic”compounds into the environment (Herd et al., 1996). All theabove warrant monitoring, for their documentation in regardto cattle production might well impact on the continued useand benefits of persistent compounds.
Literature Cited
Brundson, R.V., et al. 1989. New Zealand Vet. Jour., 37:15-17.
Herd, R.P., et al. 1996. Int. J. Parasitol. 26:1087-1093.
Lanusse, C., et al. 1997. J. Vet. Pharmacol. Therap., 20:91-99.
McKellar, Q.A. and H.A. Benchaoui. 1996. J. Vet. Pharmacol.Therap. 19:331-351.
McKenna, P.B. 1986. New Zealand Vet. Jour., 34:94-96.SAS. 1988. SAS Inst. Inc., Cary, North Carolina.Shoop, W.L. et al. 1995. Vet. Parasit. 59:139-156.Toutain, P.L., et al. 1997. Vet. Parasitol., 72:3-8.Vercruysse, J., et al. 1995. Vet. Parasit., 58:35-48.Wood, I.B., et al. 1995. Vet. Parasit. 58:181-213.Yazwinski, T.A., et al. 1994. Am. J. Vet. Res. 55:1416-
1420.Yazwinski, T.A., et al. 1995. Am. J. Vet. Res. 56:1599-
1602.
Table 1 - Parasite, fecal egg count data at necropsy.
Compound1 Control DRM IVM DRM IVM DRM IVM
DTA2 NA 28 28 21 21 14 14
EPG, geometric Mean 23ab 22ab 38a 5c 16abc 0d 4c
Egg count positive at necropsy3 7/7 7/7 7/7 5/7 5/64 0/7 4/7
1 Compounds DRM (doramectin) and IVM (ivermectin).2 DTA = days elapsed from treatment to larval challenge.3 No. positive/Total No. in treatment group.4 One animal died prior to scheduled necropsy due to circumstances unrelated to experimental treatment.a, b, c, d Means on the same line with unlike superscripts are different (P < .05).

Arkansas Animal Science Department Report 1999
59
Tab
le 2
- T
reat
men
t g
rou
p, g
eom
etri
c m
ean
s o
f ca
lcu
late
d t
ota
l nem
ato
de
cou
nts
fo
r ca
lves
as
det
erm
ined
at
nec
rop
sy.
D
ays
elap
sed
betw
een
trea
tmen
t and
sub
sequ
ent n
emat
ode
chal
leng
e28
21
1
4
Nem
atod
eN
on-m
edic
ated
Dor
amec
tinIv
erm
ectin
Dor
amec
tinIv
erm
ectin
Dor
amec
tinIv
erm
ectin
Ost
erta
gia
- o
ster
tagi
(fe
mal
e)10
54.5
a30
.2b
377.
1a7.
0b
122.
8a0.
0c
17.5
b
- sp
p (m
ale)
1278
.6a
52.7
b50
4.9a
15.8
b15
0.5ab
0.3
b10
.0b
- E
L441
.2a
0.6
b1.
7b0.
1c
2.9
b0.
1b
0.1
b
- D
L412
5.1a
6.5b
14.9
b4.
9b
11.1
b0.
3b
3.8
b
Tric
host
rong
ylus
a
xei
- ad
ult
266.
8a40
1.9a
307
.9a
41.1
b40
3.7a
0.5
c24
.0b
- L4
29.6
a62
.9a
33.4
a5.
7b
37.7
a 0
.3b
7.0
a
Coo
peria
- s
pp (
mal
e)21
68.5
a14
21.6
a15
31.8
a13
9.2b
906.
3a0.
3c
72.7
b
- o
ncop
hora
(fe
mal
e)90
1.0a
930.
7a89
8.1a
58.2
b50
7.2a
0.2
c20
.7b
- p
unct
ata
(fe
mal
e)41
7.7a
67.1
a26
2.4a
5.8
b97
.8a
0.0
c11
.2b
- s
urna
bada
(fe
mal
e)83
.1a
111.
5a67
.3a
9.2
b30
.4ab
0.1
b1.
7b
- s
pp L
4 6
0.8
a 6
.9b
13.1
b2.
7b
18.0
a0.
0b
1.9
b
Oes
opha
gost
omum
radi
atum
- a
dult
79.
9a
2.3a
23.3
a3.
1a
15.2
a 0
.1a
4.3
a
- L
418
3.1a
11.3
b82
.2ab
10.3
b30
.0ab
0.0
b6.
7b
a, b
, c M
eans
on
the
sam
e lin
e w
ith u
nlik
e su
pers
crip
ts a
re d
iffer
ent (
P <
.05)
.

AAES Research Series 470
60
Tab
le 3
- R
edu
ctio
ns
(%)
in m
ean
nem
ato
de
cou
nts
in m
edic
ated
gro
up
s o
f ca
lves
as
com
par
ed t
o c
ou
nts
in t
he
no
n-m
edic
ated
gro
up
.
D
ays
elap
sed
betw
een
trea
tmen
t and
sub
sequ
ent n
emat
ode
chal
leng
e28
21
1
4N
emat
ode
D
oram
ectin
Ive
rmec
tin
D
oram
ectin
Iv
erm
ectin
Dor
amec
tin
Iv
erm
ectin
Ost
erta
gia
- o
ster
tagi
(fe
mal
e)97
.164
.299
.388
.310
0.00
98.3
- sp
p (m
ale)
95.8
60.5
98.7
88.2
99.9
99.2
- E
L498
.595
.999
.793
.099
.799
.6 -
DL4
94.8
88.1
96.1
91.1
99.7
96.9
Tric
host
rong
ylus
a
xei
- ad
ult
0.0
0.0
84.6
0.0
99.8
90.9
- L4
0.0
0.0
80.7
0.0
98.
876
.4C
oope
ria -
spp
(m
ale)
34.4
29.3
93.5
58.2
99.9
96.6
- o
ncop
hora
(fe
mal
e)0.
00.
393
.543
.799
.997
.7 -
pun
ctat
a (
fem
ale)
83.9
37.1
98.6
97.8
100.
097
.3 -
sur
naba
da (
fem
ale)
0.0
19.0
88.9
63.4
99.8
97.9
- s
pp L
4 8
8.6
78.4
95.5
70.4
100.
096
.8O
esop
hago
stom
um
ra
diat
um -
adu
lt97
.170
.896
.080
.999
.894
.6 -
L4
93.8
55.0
94.3
30.0
100.
096
.3

Arkansas Animal Science Department Report 1999
61
Factors Influencing Sale Price Among Bulls Enrolledin an On-Farm Bull Testing Program
Stan McPeake and Clay Cochran1
Story in Brief
Data was collected on 125 Charolais bulls over a two-year period (1998 and 1999) to determine the relation-ship of various factors on selling price. Factors evaluated were: age of bull, horn classification, sale year, actualbirth weight, adjusted weaning weight, scrotal circumference, average daily gain on test, EPDs for birth weight,weaning weight, yearling weight, milk, and total maternal EPD. A regression analysis was conducted to deter-mine the relative importance of the factors in predicting sale price. The top seven factors affecting sale pricelisted in order of importance are: sale year, adjusted weaning weight, scrotal circumference, horn classification,average daily gain on test, bull age and total maternal EPD. These factors accounted for 67% of the variation insale price.
Introduction
To increase herd productivity and hopefully profitabil-ity, economically important traits (fertility, growth, mater-nal traits, and carcass merit) should be emphasized in selec-tion programs. Since sire selection is responsible for most ofthe genetic improvement within a herd, sound choices ofpotential herd sires are of utmost importance. One way ofdecreasing some of the variation among bulls is by perfor-mance testing on the farm. On-farm bull testing providesboth purebred and commercial producers an opportunity tocompare and evaluate bulls managed under common nutri-tional and environmental conditions. The objective of thisstudy was to determine the influence of bull characteristics,performance measurements and year of sale on the sellingprice of on-farm performance tested bulls.
Experimental Procedures
Performance data were collected during 1998 and 1999on 125 Charolais bulls completing a 112-day on-farm bulltest. The bulls were approximately 7 to 8 months of age atthe beginning of the test period. They were allowed a 21-day warm up period prior to starting the official gain test.Initial weights were taken on all bulls. Upon completion ofthe 112-day test, approximately when bulls were one year ofage, yearling hip heights and scrotal circumference measure-ments were taken.
Bull characteristics and performance data were corre-lated with sale prices of 125 bulls that sold in 1998 and 1999.Variables included were age of bull in years (1, 1.5, and 2),horn classification (polled = 1, dehorned = 2, or scur = 3),year of sale (1998 and 1999), actual birth weight, adjusted
weaning weight, EPDs for birth weight, weaning weight,yearling weight, milk, total maternal, scrotal circumference,and average daily gain along with sale price.
Sale catalogs were available to buyers prior to each sale.The catalogs included identification of each bull, a two-gen-eration pedigree and birth date. Up-to-date EPDs were pro-vided on a supplemental sheet. Breed average EPDs, how-ever, were not provided in the catalog. Performance data re-ported in each catalog were: actual birth weight, adjustedweaning weight, average daily gain and scrotal circumfer-ence. Contributions of each factor (bull characteristics, per-formance data and year of sale) were independently evalu-ated using a multiple regression procedure to obtain partialregressions of sale price on each factor.
Results and Discussion
Phenotypic correlation coefficients between sellingprice, bull characteristics and performance traits measuredduring the study are presented in Table 1. Year of sale, hornclassification, adjusted weaning weight, total maternal EPD,weaning weight EPD, scrotal circumference and averagedaily gain were all significantly (P < .05) correlated withselling price. Adjusted weaning weight, weaning weight EPD,total maternal EPD, scrotal circumference and average dailygain were all positively correlated with selling price.
The negative correlation between selling price and hornclassification indicates that producers paid more for polledbulls as compared to horned bulls that were dehorned. Pro-ducers paid more for polled bulls because calves from thesebulls would be mostly polled depending on whether the bullswere homozygous polled or heterozygous polled. Positivecorrelations were noticed with factors related to weaning
1Both authors associated with the Animal Science Section, Cooperative Extension Service, Little Rock

AAES Research Series 470
62
weight, such as adjusted weaning weight, weaning weightEPD and total maternal EPD. Most commercial producersare interested in selling weaning weight, so this may be onereason that commercial buyers showed such an interest inthese performance traits. Average daily gain and scrotal cir-cumference also had positive correlations with selling price.
Table 2 presents the impact that a per unit change ineach trait had on selling price. Most of the factors examinedmade significant contributions to selling price with the ex-ception of birth weight EPD, weaning weight EPD, yearlingweight EPD, milk EPD and actual birth weight. A 10 lb dif-ferential in adjusted weaning weight was associated with a$20.60 difference in selling price. There was a $209.57 dif-ferential between polled versus horned bulls. An average dailygain differential of 1 lb was associated with a $135.06 dif-ference in selling price. A six-month difference in age ofbull was associated with a differential of $174.65 in sellingprice. A one-year difference in age of bull was associatedwith a differential of $349.30 in selling price.
The ranking of these traits by partial R2 indicates thatproducers are concerned about traits that are related to wean-ing weight, fertility, and marketability.
Implications
It is important to note that both sale order and the physi-cal appearance of the bulls on sale day may have had a pro-found effect on these results. Bulls have phenotypic charac-teristics that may lead to an increase or decrease in price onsale day. The extent to which visual appraisal is used to de-termine price is unknown but may be quite large. In addi-tion, certain pedigrees and bloodlines may have a signifi-cant impact on the selling price of bulls. The reason somebulls sell at a higher price than others is sometimes unex-plainable, but this data indicates that buyers considered traitsmeasured on the bull directly. Some consideration was givento EPD information; however, bull buyers still direct atten-tion to the physical characteristics of the bull. A bull buyershould first evaluate the performance data that is availableon a bull and then decide if he has desirable physical at-tributes.
Acknowledgment
The Cooperative Extension Service, University of Ar-kansas would like to especially thank Tim Leslie and EddieLoggains of Tim Leslie Charolais Ranch for their assistancein collecting data used for this study.

Arkansas Animal Science Department Report 1999
63
Table 1. Significant correlation coefficients between sales price, bull characteristics, performance traits and year of sale.
Price
Year of sale -.49**
Adjusted weaning weight .27**
Scrotal circumference .39**
Horn classification -.28**
Average daily gain .39**
Total maternal EPD .23**
Weaning weight EPD .21*
* Significance level: (P < .05)** Significance level: (P < .01)
Table 2. Partial regressions of sale price on bull characteristics, performance traits, and year of sale.
Trait Regression coefficients Partial R2 Model R2
Year of sale -501.51** .21 .21
Adjusted weaning wt 2.06** .18 .40
Scrotal circumference 18.35** .14 .54
Horn classification - 209.57** .05 .59
Average daily gain 135.06** .03 .62
Age of bull 349.30* .02 .65
Total maternal EPD 9.16** .02 .67
*Significance level: (P < .05) **Significance level: (P < .01)

AAES Research Series 470
64
Arkansas Steer Feedout Program1997-1998
Tom Troxel, George Davis, Shane Gadberry, Stan McPeake, and William Wallace1
Story in Brief
The objective of the Arkansas Steer Feedout Program is to provide cow-calf producers information about thepostweaning performance and carcass characteristics of their calves. Steers that were composed of more than50% English, less than 50% exotic, and less than 25% Brahman breeding had a higher percentage of grade Choicethan steers that did not satisfy the breed type description (54% vs. 25%). Feed cost of gain, quality grade,medicine cost, dressing percentage and fat thickness were significant factors that affected net return. With theinformation gained from this program, cow-calf producers can better evaluate their cattle breeding program.
1All authors are associated with the Animal Science Section, Cooperative Extension Service, Little Rock
Introduction
The Steer Feedout Program allows producers to learnmore about the characteristics of their calf crop and the fac-tors that influence value beyond the weaned-calf phase. TheSteer Feedout Program is not a contest to compare breeds orbreeders, and it is not a retained ownership promotion pro-gram. It creates an opportunity for producers to determinehow their calf crop fits the needs of the beef industry andprovides information needed to determine if changes in ge-netics and/or management factors are warranted.
Experimental Procedures
During the week of October 10, 1997, entries from 103ranches (1,019 head) were placed on feed at Randall CountyFeedyard at Amarillo. Steers came from Texas, New Mexico,Oklahoma, Arkansas, and Florida. Arkansas had 239 (24%)of the 1,019 steers. The Steer Feedout Program was held incooperation with the Texas A&M Ranch-to-Rail program tocompare Arkansas steers with steers from other states. Uponarrival, steers were eartagged, weighed, and processed (im-planted and vaccinated for clostridial and respiratory dis-eases). Each steer was assigned a per hundredweight valuebased on current local market conditions by Federal-StateLivestock Market News Service personnel. This served as abasis for calculating theoretical break-evens and the finan-cial outcome of the program. The steers were sorted intoeleven feeding groups based upon weight, frame, condition,and biological type. Management factors such as process-ing, medical treatments, and diets were the same as the othercattle in the feedyard. Individual animals were selected forslaughter by the feedyard manager when they reached theweight and condition regarded as acceptable for the industryand market conditions. The cattle were sold on a carcass
weight basis with premiums and discounts for various qual-ity grades, yield grades and carcass weights. Feed, process-ing, and medicine costs were financed by the feedyard. Allexpenses were deducted from the carcass income and pro-ceeds were sent to the owner.
Descriptive statistics were computed to describe gen-eral program results. Breed type of each steer enrolled in theprogram was used to group calves according to whether ornot they fit the following criteria: > 50 % English, < 50%exotic, and < 25% Brahman. The main effects of year andgroup and their interaction on the dependent variables yieldgrade, ribeye area, ribeye area/hot carcass cwt., ADG, dress-ing percent, feed cost per pound of gain, and net return weredetermined using the PROC GLM procedure of SAS (1990).Fat thickness was used as a covariant in the model.
Steers were also grouped according to whether or notthey fit an industry standard for carcass merit (at least Choice,yield grade 3.5 or better, with a hot carcass weight between550 and 950 pounds). Data was analyzed in the same man-ner as the breeding group analysis. Least-squares means(SAS, 1990) were computed and reported.
Factors affecting net return of all steers, top 25% (basedon net return), and bottom 25% were determined by yearusing the stepwise method of PROC REG (SAS, 1990). In-dependent variables included in weight, percentage Brah-man, percentage English, percentage exotic breeding, ADG,yield grade, quality grade, feed cost per pound of gain, hotcarcass weight, days on feed, medicine cost, ribeye area,ribeye area/hot carcass cwt., and dressing percentage.
Results and Discussion
On the average, the 1997-98 Arkansas steers had: (1)higher feeder calf value, (2) higher medicine costs, (3) higherdeath loss, and (4) lower gross income value than the 1996-

Arkansas Animal Science Department Report 1999
65
97 Arkansas steers (Table 1). Although the average net re-turn for the 1997-98 steers was -$68.74 with a range from$138.74 to -$215, 35% of the 1997-98 steers had a positivenet return.
The average off-the-truck weight for the Arkansas steerswas 643 lb (420 to 850). The average daily gain, averagedays on feed, feed cost per pound of gain, and total cost perpound of gain were 2.67 lb (1.36 to 4.19), 191 days (154 to215), $0.58 ($0.36 to $1.16), and $0.66 ($0.42 to $1.30),respectively.
The average carcass weight, ribeye area, dressing per-centage, yield grade, and fat thickness were 741 lb (529 to939), 13.6 in2 (9.1 to 19.0), 65% (57.6% to 74.6%), 2.27(1.00 to 4.10), and .36 in (.08 to .84), respectively. Twenty-seven percent of the carcasses graded Choice, whereas 51%,16%, and 7% graded Select, Standard, and dark cutter, re-spectively. No carcasses graded Prime. Carcass value wassix cents lower in 1997-98 ($1.00) than in 1996-97 ($1.06).Therefore, not only did the 1997-98 steers cost more thanthe 1996-97 steers, they were sold for less at the end of thefeeding period.
The percentage English, exotic, and/or Brahman breed-ing were determined for each calf. Steers that were at least50% English, no more than 50% exotic, and less than 25%Brahman were sorted into one group and those steers thatdid not satisfy the breed-type requirement were placed in asecond group (Table 2). Calves that fit the breeding require-ment graded 54% Choice compared with the calves that didnot fit the breed requirement that graded 25% Choice. Afterreviewing the data, there appears to be enough evidence tosupport the recommendation that market cattle should becomposed of at least 50% English, no more than 50% ex-otic, and less than 25% Brahman.
Listed below are the significant factors that affected netreturns of steers for the 1996-97 and 1997-98 Steer FeedoutProgram.
1996-971. Dressing Percentage2. Quality Grade3. ADG4. Percentage of English breeding5. Medicine6. Fat Thickness7. Feed Cost of Gain
1997-981. Feed Cost of Gain2. Quality Grade3. Medicine4. Days on Feed5. Dressing Percentage6. Fat Thickness
Many of the factors that affected net returns are listed inboth years but in a different priority. For example, feed costof gain was seventh in the 1996-97 program but was first in
1997-98. Other factors (quality grade and fat thickness) re-mained the same (2nd and 6th) both years.
1. Feed cost of gain – Feed cost of gain had a negativerelationship to net return. That is, as feed cost of gain de-creases, net return increases. The average feed cost of gainfor the steers in the bottom 25% (based upon net returns)was $.69 per pound as compared to $.48 per pound for thesteers in the top 25%. The average feed cost per pound ofgain for all the steers was $.58.
2. Quality Grade – For the past two years, cattle thatgraded Choice, Select, Standard, and dark cutter had net re-turns of $78.82, $28.85, -$44.15 and -162.64, respectively.Marbling is the main factor that affects a calf’s ability tograde Choice. Three main factors that affect marbling are:(1) the genetic ability to marble; (2) the maturity or the physi-ological age, not the chronological age; and (3) diet. Somecattle breeds report marbling EPDs in their sire summary.Carcass traits such as marbling are highly heritable; there-fore, selecting high marbling EPD bulls can impact the mar-bling ability of their progeny. Breed type can also influencea calf’s ability to grade Choice. Usually, a calf with at leastone-half English breeding has an increased ability to gradeChoice.
The physiological age compared to chronological ageinfluences frame score. Large-framed cattle must be older(chronological) to reach the same physiological age to ex-press marbling as compared to smaller-framed cattle. There-fore, feeding large framed cattle results in excessive feedingand larger carcasses. Steers should have frame scores of 5 to6. That means that at 7 months of age a steer should be 45 to46 inches tall at the hips.
Cattle are more likely to grade Choice when fed a highconcentrate diet versus a high forage diet. Successful feed-lots know how to feed cattle; therefore, the cattle diet is nota factor.
3. Medicine Cost – Healthy calves outperformed sickcalves. A good preconditioning vaccination program will notguarantee a healthy feedyard calf, but it is the best manage-ment tool available.
4. Days on Feed – There was a positive relationship be-tween days on feed and net returns. This was a function ofprice received. April 8 (168 days on feed) was the lowestprice received whereas on April 22 (182 days on feed) wasthe highest price received.
5. Dressing Percentage – Dressing percentage is deter-mined by dividing the hot carcass weight by the slaughterweight multiplied by 100. Dressing percentage is largely afunction of fill and fat; thus, the fatter Prime cattle will dressfrom 65% to 66%. Muscling, however, can also affect dress-ing percent. Thickness, depth and fullness of quarter, andwidth (without excessive fat) of back, loin and rump are in-dications of muscling. Muscling or natural fleshing is inher-ited through the sire and dam.
The current USDA Feeder Cattle Grades use threemuscle thickness scores (1=slightly thick or thicker, 2=nar-row, 3=very narrow). Thickness is related to muscle-to-boneratio and at a given degree of fatness to carcass yield grade.

AAES Research Series 470
66
Thicker muscled animals will have more lean meat. “Double-muscled” animals are included in the Inferior grade (unthriftyanimals). Although such animals have a superior amount ofmuscle, they are graded U.S. Inferior because of their in-ability to produce acceptable degrees of meat quality.
The ideal calf should be Feeder Cattle Grade U.S. 1.Number 1 is thrifty and slightly thick throughout. They showa full forearm and gaskin, showing rounded appearancethrough the back and loin with moderate width between thelegs, both front and rear.
6. Fat Thickness – Fat thickness is the number one fac-tor that determines yield grade. Cattle that are short and have.8 inch or more fat thickness at slaughter will be discounted.Cattle less than 42 inches tall (at the hip) at seven months ofage are too small.
The “frame score” is determined by measuring cattlestanding naturally on a flat, firm surface, legs squarely un-der the body, and head in a normal position. Measurementshould be made directly over the hooks or hips. This can bedone with a device consisting of a cross-arm (with a bubblelevel) attached in a 90-degree angle to an upright. The up-right contains a rule or gauge for measuring.
Frame score is a convenient way of describing the skel-etal size of cattle. The current USDA Feeder Cattle Gradesutilize independent evaluations of three frame sizes (Small,Medium and Large). These USDA Grades define a MediumFrame feeder steer as projected to finish at 1,000 to 1,200pounds. Frame score 5.0 slaughter steers are estimated toaverage 1,150 lb at slaughter. Therefore, USDA Feeder CattleGrade Medium is equal to frame scores 4 through 6, Smallat frame scores 1 through 3 and Large at frame scores 7through 9.
The ideal calf should be between frame scores 5 to 6.That means at 7 months of age the calf should be between 44and 46 inches tall at the hip. It is much easier to produceframe score 5 to 6 calves from frame score 5 to 6 cows.
Table 3 summarizes the performance and carcass datafrom the steers that were in the bottom 25% and top 25%(based on net returns) and the average of all the steers. Thefive main factors that predicted net returns of steers in thebottom 25% were feed cost of gain, quality grade, medicinecost, dressing percentage, and fat thickness. In summary, thecalves in the bottom 25% had high feed and medicine cost,low dressing percent and failed to grade Choice. The cattlethat performed the best were medium to large framed, heavymuscled, gained well, had a high dressing percentage, didnot get sick, and graded Choice.
The beef cattle industry has set the standard that qualitygrade should be Choice, yield grade should be 3.5 or better,and hot carcass weight between 550 and 950 lb. For the lasttwo years of the Steer Feedout Program, only 27% of theArkansas calves fit all those requirements. Those steers hadan average net return of $84.21 whereas the steers that didnot fit all the requirements had a net return of $15.74. Withonly 27% of the Arkansas steers filling the industry needs, itis easy to see the problem with the inconsistency and lack ofquality in the beef product.
Once again, the purpose of the Arkansas Steer FeedoutProgram is to provide the opportunity for cow-calf produc-ers to determine how their cattle fit with the needs of theindustry. We want to congratulate the producers who partici-pated in the 1997-98 Steer Feedout. It takes courage to putyour calves in the feedyard and obtain this data. Sometimeswe don’t like what we find. Hopefully, these cattle produc-ers will take this information and make beef cattle geneticchanges to improve their cattle herd.
Implications
Extremes in net return, health costs, performance fac-tors and carcass parameters exist in the beef industry. Aproducer’s goal should be to reduce these variables and pro-duce a product that meets the needs of all segments of thebeef industry. Value-based marketing at all levels of the in-dustry is rapidly becoming a reality. Ranchers who producea product that meets the demands will be more competitivein the market place.
Acknowledgment
The Arkansas Steer Feedout Program would like to thankSF Services, Merial, and the Arkansas Cattlemen’s Associa-tion for sponsoring the Steer Feedout Tour.
Literature Cited
SAS. 1990. SAS Inst., Inc., Cary, North Carolina.

Arkansas Animal Science Department Report 1999
67
Table 1. Comparison between the steer feedout financial summary for 1996-97 and 1997-98.
Item/year 1996-97 1997-98
Income $770.72 $731.12ExpensesFeeder steer value 352.70 472.05Feed 286.93 280.36Medicine 3.61 8.42Processing 10.46 11.90Death Loss 3.71 13.25Fees 1.40 1.40Interest 7.20 7.90Freight 4.50 3.92Insurance .64 .66
$671.15 $799.86
Total net return $99.57 -$68.74
Table 2. Performance and carcass data of Arkansas steers that fit the breed requirement1 and thosethat did not fit the breed requirement (1996-97 and 1997-98 data combined)
Fit the Did not fitrequirement the requirement Significance
Percent grading Choice 54% 25% P<.01Yield grade 2.44 2.34 NSRibeye area (REA, in2) 13.1 13.6 P<.05REA per 100 lb. carcass weight 1.79 1.83 NSAverage daily gain (lb) 2.99 2.80 P<.01Dressing percentage 64% 64% NSFeed cost per pound of gain .52 .56 P<.01Net return $49.06 $32.08 NS
1At least 50% English, no more than 50% exotic and less than 25% Brahman.

AAES Research Series 470
68
Table 3. The performance of the bottom 25%, average, and top 25% steers based uponnet return (1997-98 data).
Bottom 25% Average Top 25%
Number of steers 57 2291 57In weight (lb) 661 643 609Value/cwt. $75 $74 $72In value $491 $472 $438Muscle score 1.3 1.3 1.4Frame score
Large 90% 73% 60%Medium 10% 27% 40%
Final weight (lb) 1,096 1,150 1,196Average daily gain (lb) 2.28 2.67 3.05Gross income $642 $740 $806Hot carcass weight (lb) 691 742 777Dressing percentage 63.7% 64.5% 65%Interest $8.41 $7.94 $7.67Medicine $18.92 $8.21 $2.24Total feed cost per head $289 $282 $278Total expense $335 $316 $306Net -$183 -$49 $62Days on feed 193 191 193Feed cost per lb of gain $.69 $.58 $.48Total cost per lb of gain $.80 $.65 $.53Ribeye area (in2) 13.7 13.6 13.3Fat thickness (in) .29 .35 .42Quality grade
Prime 0% 0% 0%Choice 9% 27% 53%Select 32% 51% 46%Standard 33% 16% 1%Dark Cutter 26% 7% 0%
Yield grade 1.9 2.3 2.6
1 Ten calves were not used in this data set. Seven calves died, two calves were railed and one carcass wascondemned.

Arkansas Animal Science Department Report 1999
69
The Impact of Feeding Poultry Litter on MicrobialContamination of Beef Carcasses1
J.R. Davis, J.K. Apple, D.H. Hellwig, E.B. Kegley, and F.W. Pohlman2
Story in Brief
The objective of this study was to evaluate the effect of feeding poultry litter on the microbial contaminationof beef carcasses and ground beef. Mature cull beef cows (n = 32) from the University of Arkansas Beef Unit,Savoy, Arkansas were weighed, assigned body condition scores, and randomly assigned treatment diets (as fedbasis) of: 1) ad libitum 80% deep-stacked poultry litter and 20% corn, as well as 2 lb. long-stemmed grass hay;or 2) ad libitum long-stemmed grass hay. Weights and fecal samples were taken every seven days for 14 daysprior to and 56 days after introduction of treatment diets. Subsequently, cattle were humanely harvested at theUniversity of Arkansas Red-Meat Abattoir. The left side of each carcass received a 2% lactic acid rinse, andneck and bung incision samples were taken from both sides of each carcass. Trimmings from both sides of eachcarcass were removed and refrigerated for six days. Purge samples were taken from trimmings, trimmings wereground, and random ground beef grab samples were taken. All fecal samples, neck and bung incision samples,purge, and ground beef samples were analyzed for presence of Salmonella and Escherichia coli O157:H7immediately after collection. No Salmonella or Escherichia coli O157:H7 were detected in any samples at anypoint in this experiment, except those used for positive biological controls in the laboratory.
1 The authors would like to express their sincere appreciation to the Arkansas Beef Council for financial support of this project. Additionally,the authors would like to thank Pete Hornsby for care of the cows, Suzanne Krumpleman, Lillie Rakes, Matt Stivarius, and Doug Gallowayfor assistance in cattle harvest and data collection.
2 All authors are associated with the Department of Animal Science, Fayetteville.
Introduction
Over the last two decades, waste generated by animalfeeding operations has begun to fall under increased scru-tiny. Poultry litter is no exception, and questions arise ofhow to dispose of poultry litter in a manner that is both safeand environmentally friendly. Poultry litter has been usedas a feedstuff for beef cattle and as a fertilizer for pastureland for many years. One of the earliest poultry litter feed-ing trials was published in 1955 (Noland et al., 1955). How-ever, recent reports in the popular press have attempted tolink incidence of E. Coli O157:H7 in ground beef to poultrylitter feeding. Furthermore, Buchannan et al. (1995) reportedthat “a hazard analysis would conclude that E. Coli O157:H7and Salmonella are currently the most important food bornepathogens in which raw beef could be an important vehicle.”Therefore, the objective of this study was to determinewhether feeding of poultry litter directly to beef cattle af-fects the incidence of E. coli O157:H7 and Salmonellatyphimurium found on beef carcasses.
Experimental Procedures
Broiler litter was located from a local producer who co-operated fully with all sampling requirements prior to birdremoval. Cloacal swabs were taken from 50 randomly se-lected birds prior to bird and litter removal, and drag swabswere taken from the poultry house immediately after birdremoval. Approximately 15 tons of litter were purchasedand transported to the U of A Beef Cattle Unit at Savoy, andstacked to a depth of 5 ft as depicted in the Arkansas Coop-erative Extension Publication “Feeding Broiler Litter to BeefCattle” (Davis, 1993.) Immediately after deep-stacking, tem-perature probes were inserted across the stack in order tomonitor temperatures both deep inside the stack and nearthe surface. Samples of litter and hay were taken for proxi-mate analysis in order to formulate treatment and controldiets which were approximately equal in total digestible nu-trients and adequate in crude protein and mineral content.

AAES Research Series 470
70
Thirty-three cull cows were weighed, assigned body con-dition scores, and classified according to source and breedtype on day -15. One cow was removed from the group dueto excessive weight, and the remaining 32 cows were as-signed to treatments. On day -14, cattle were weighed a sec-ond time and grab samples of feces were taken for microbialanalysis. Subsequently, animals were placed into their re-spective pens and care was taken to avoid fence line contactbetween pens of animals at all times. On day -7 and day 0,cattle were weighed again and grab samples of feces weretaken for microbial analysis. This concluded the two-weekobservation prior to introduction of the litter ration to treat-ment animals.
On day 0 animals were introduced to the treatment ra-tions (as fed basis) of: 1) ad libitum 80% deep-stacked poultrylitter and 20% corn, as well as 2 lbs long-stemmed grass hayper head per day, and free-choice block salt; or 2) ad libitumlong-stemmed grass hay and free-choice block mineral.Furthermore, on day 0 all cattle were given a 4-mL injectionof a vitamin A and D mixture containing 500,000 IU of vita-min A/mL and 75,000 IU vitamin D/ mL. On days 7, 14, 21,28, 35, 42, 49, and 56 of the feeding trial, cattle were weighedand grab samples of feces were taken for microbial analysis.
At the conclusion of the 56-day feeding period, cowswere humanely harvested at the University of Arkansas Red-Meat Abattoir. Following standard dressing procedures, bothsides of each carcass were thoroughly rinsed with cold wa-ter, and the left side of each carcass received a 2% lactic acidrinse. Meat samples were removed from the neck and bungregions from both sides of each carcass for microbial analy-sis, and trimmings from both sides of each carcass were re-moved and refrigerated. After six days of refrigerated stor-age at 34°F, samples of purge from lean trimmings were taken,trimmings were ground, and ground beef samples were takenfor microbial analysis.
Microbial analyses were performed as follows:E. coli O157:H7 from feces - A sample of feces was
placed into a tube of Lauryl Sulfate Tryptose (LST) brothwith MUG and incubated. After incubation, samples werestreaked for isolation on selective media. Colony morphol-ogy was compared, and typical colonies were picked andtested for indole production. Indole positive colonies werepicked to LST with MUG tubes containing Durham tubesand observed for gas production and phosphorescence. Gaspositive / phosphorescence negative isolates from Durhamtubes were agglutinated with O157 antisera. The O157 posi-tives were streaked on blood agar plates to facilitate the ex-pression of the :H7 antigen, incubated, and agglutinated with:H7 antisera.
E. coli O157:H7 from meat - Meat samples werestomached in buffered peptone water and incubated. Asubsample of solution was placed into a tube of LST brothwith MUG and incubated. After incubation, samples werestreaked for isolation on selective media. Colony morphol-ogy was compared, and typical colonies were picked andtested for indole production. Indole positive colonies were
picked to LST with MUG tubes containing Durham tubesand observed for gas production and phosphorescence. Gaspositive/phosphorescence negative isolates from Durhamtubes were agglutinated with O157 antisera. O157 positiveswere streaked on blood agar plates to facilitate the expres-sion of the :H7 antigen, incubated, and agglutinated with:H7 antisera.
Salmonella from feces - A sample of feces was placedinto a tube of Tetrathionate broth (HAJNA) and incubated.After incubation, samples were streaked for isolation on se-lective media. Colony morphology was compared, and typi-cal colonies were picked and stab-streaked in Kligler’s IronAgar (KIA) slants. The H
2S positive isolates from KIA slants
were re-streaked on less selective media and agglutinatedwith Salmonella antisera.
Salmonella from meat - Meat samples were stomachedin buffered peptone water and incubated. A subsample ofsolution was placed into a tube of HAJNA and incubated.After incubation, samples were streaked for isolation on se-lective media. Colony morphology was compared, and typi-cal colonies were picked and stab-streaked in KIA slants.H
2S positive isolates from KIA slants were re-streaked on
less selective media and agglutinated with Salmonella antis-era.
Results and Discussion
No Salmonella or Escherichia coli O157:H7 were de-tected in any samples at any point in this experiment (Table1) with the exception of those used for positive biologicalcontrols in the laboratory for the purpose of validating ex-perimental procedures. No Salmonella or Escherichia coliO157:H7 were detected in any cloacal swabs taken from birdsin the house prior to litter removal or from drag swabs takenfrom the litter prior to litter removal. This is consistent withthe report of McCaskey and Gurung (1998) who character-ized poultry litter as an inhospitable environment for Salmo-nella and Escherichia coli survival due to its alkaline pHand ammonia concentration. It is also consistent with thefindings of Martin and McCann (1998) who found no Sal-monella or Escherichia coli O157:H7 in any of 86 samplesof poultry litter from the state of Georgia. No Salmonella orEscherichia coli O157:H7 were detected from any fecalsamples at any point. Additionally, no Salmonella or Escheri-chia coli O157:H7 were detected from neck and bung inci-sion samples, trimming purge samples, or ground beefsamples at any point during this experiment.
Implications
Although not expressly encouraged by the Food andDrug Administration, the feeding of poultry litter to beef cattlehas not been demonstrated to be harmful to beef cattle. Fur-thermore, as this study has demonstrated, feeding poultrylitter to cull beef cows does not increase the incidence of

Arkansas Animal Science Department Report 1999
71
Salmonella or Escherichia coli O157:H7 on beef carcassesor in ground beef.
Literature Cited
Buchannan, R.L., et al. 1995. Tracking Food borne Patho-gens from Farm to Table: Data needs to Evaluate Con-trol Options. pp. 71-80. USDA, ERS. Washington D.C.
Davis, George V. 1993. Ark. Coop. Ext. Pub. FSA3016.Martin, S.A. and M.A. McCann. 1998. J. Appl. Poultry Res.
7:90McCaskey, T.A. and N.K. Gurung. 1998. Proc. 1998 Nat’l.
Poultry Waste Symposium. Auburn University PrintingService. p 94.
Noland, P.R., et al. 1955. J. Anim. Sci. 14:860.
Table 1. Isolation of E. coli O157:H7 and Salmonella.
Bacterial incidence Control Litter-fed
Sample E. coli O157:H7 Salmonella E. coli O157:H7 Salmonella
Fecals none detected none detected none detected none detectedNon-lactic acid-rinsed Neck none detected none detected none detected none detected Bung none detected none detected none detected none detected Trim purge none detected none detected none detected none detected Ground beef none detected none detected none detected none detectedLactic acid-rinsed Neck none detected none detected none detected none detected Bung none detected none detected none detected none detected Trim purge none detected none detected none detected none detected Ground beef none detected none detected none detected none detected
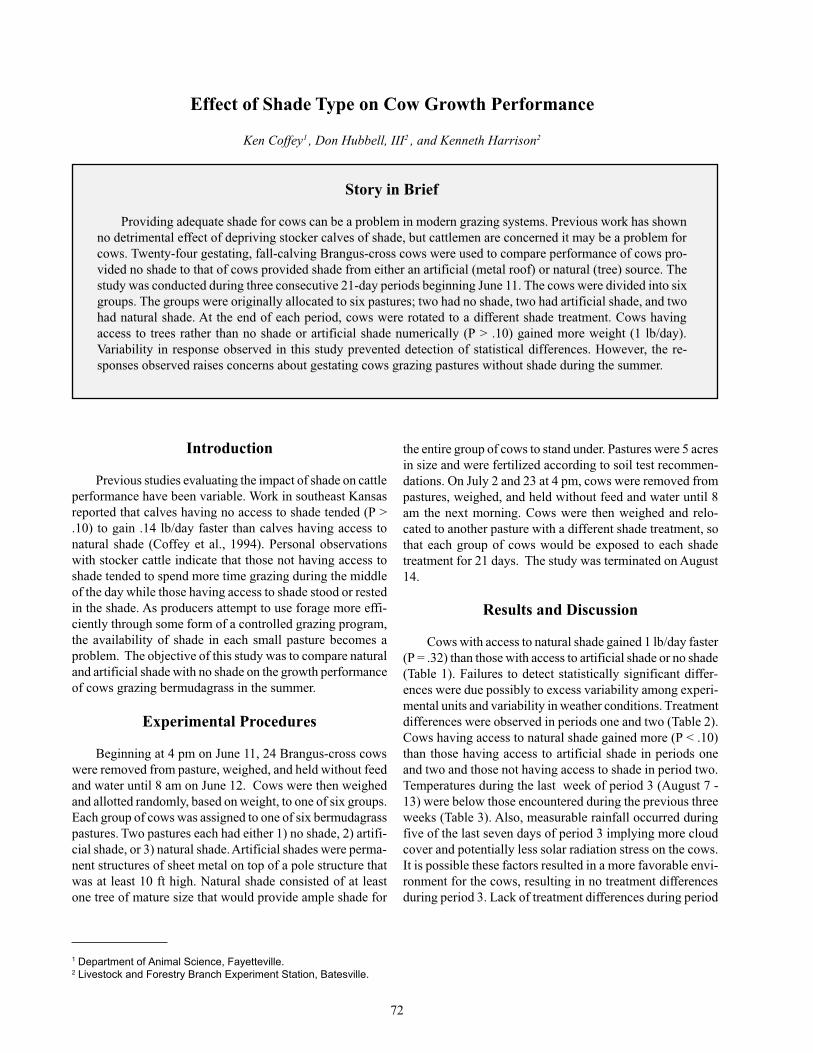
AAES Research Series 470
72
Effect of Shade Type on Cow Growth Performance
Ken Coffey1 , Don Hubbell, III2 , and Kenneth Harrison2
Story in Brief
Providing adequate shade for cows can be a problem in modern grazing systems. Previous work has shownno detrimental effect of depriving stocker calves of shade, but cattlemen are concerned it may be a problem forcows. Twenty-four gestating, fall-calving Brangus-cross cows were used to compare performance of cows pro-vided no shade to that of cows provided shade from either an artificial (metal roof) or natural (tree) source. Thestudy was conducted during three consecutive 21-day periods beginning June 11. The cows were divided into sixgroups. The groups were originally allocated to six pastures; two had no shade, two had artificial shade, and twohad natural shade. At the end of each period, cows were rotated to a different shade treatment. Cows havingaccess to trees rather than no shade or artificial shade numerically (P > .10) gained more weight (1 lb/day).Variability in response observed in this study prevented detection of statistical differences. However, the re-sponses observed raises concerns about gestating cows grazing pastures without shade during the summer.
Introduction
Previous studies evaluating the impact of shade on cattleperformance have been variable. Work in southeast Kansasreported that calves having no access to shade tended (P >.10) to gain .14 lb/day faster than calves having access tonatural shade (Coffey et al., 1994). Personal observationswith stocker cattle indicate that those not having access toshade tended to spend more time grazing during the middleof the day while those having access to shade stood or restedin the shade. As producers attempt to use forage more effi-ciently through some form of a controlled grazing program,the availability of shade in each small pasture becomes aproblem. The objective of this study was to compare naturaland artificial shade with no shade on the growth performanceof cows grazing bermudagrass in the summer.
Experimental Procedures
Beginning at 4 pm on June 11, 24 Brangus-cross cowswere removed from pasture, weighed, and held without feedand water until 8 am on June 12. Cows were then weighedand allotted randomly, based on weight, to one of six groups.Each group of cows was assigned to one of six bermudagrasspastures. Two pastures each had either 1) no shade, 2) artifi-cial shade, or 3) natural shade. Artificial shades were perma-nent structures of sheet metal on top of a pole structure thatwas at least 10 ft high. Natural shade consisted of at leastone tree of mature size that would provide ample shade for
the entire group of cows to stand under. Pastures were 5 acresin size and were fertilized according to soil test recommen-dations. On July 2 and 23 at 4 pm, cows were removed frompastures, weighed, and held without feed and water until 8am the next morning. Cows were then weighed and relo-cated to another pasture with a different shade treatment, sothat each group of cows would be exposed to each shadetreatment for 21 days. The study was terminated on August14.
Results and Discussion
Cows with access to natural shade gained 1 lb/day faster(P = .32) than those with access to artificial shade or no shade(Table 1). Failures to detect statistically significant differ-ences were due possibly to excess variability among experi-mental units and variability in weather conditions. Treatmentdifferences were observed in periods one and two (Table 2).Cows having access to natural shade gained more (P < .10)than those having access to artificial shade in periods oneand two and those not having access to shade in period two.Temperatures during the last week of period 3 (August 7 -13) were below those encountered during the previous threeweeks (Table 3). Also, measurable rainfall occurred duringfive of the last seven days of period 3 implying more cloudcover and potentially less solar radiation stress on the cows.It is possible these factors resulted in a more favorable envi-ronment for the cows, resulting in no treatment differencesduring period 3. Lack of treatment differences during period
1 Department of Animal Science, Fayetteville.2 Livestock and Forestry Branch Experiment Station, Batesville.

Arkansas Animal Science Department Report 1999
73
3 reduced the combined treatment differences observed. Thisalso increased overall treatment variability. All pastures ap-peared to have excess available forage as determined by vi-sual appraisal.
In a previous study evaluating shade effects on stockercattle (Coffey et al., 1994), cattle remained on a particularshade treatment throughout a 112-day experiment, rather thanbeing subjected to each treatment. In this study, cows wereexposed to each treatment for a 21-day period. This couldimpact the results, since the cows might adapt to the lack ofshade if they were without shade for the duration of the study.However, this experimental method imitates situations inwhich cows are moved into and out of pastures with shade.
Implications
Based on this information, although not statistically sig-nificant, it appears that natural shade may be necessary foroptimal cow weight gain. Furthermore, artificial shade maynot sufficiently reduce the impact of heat stress. Therefore,in designing controlled grazing systems, care should be takento insure that natural shade is available for cows during thesummer months.
Literature Cited
Coffey, K. P., et al. 1994. Kansas Agric. Exp. Sta., Rep. ofProgress. 708:1.
Table 1. Gain by cows exposed to different shade treatmentsa.
No Artificial Treeshade shade shade P value
ADG (full) 1.95 2.04 3.09 .32Wt change (full) 41.00 43.00 65.00 .33ADG (shrunk) 1.47 1.80 2.34 .28Wt change (shrunk) 31.00 38.00 49.00 .28Percentage of shrink 6.20 5.90 6.00 .60
aNo statistical differences were detected (P < .10).
Table 2. Daily gain by period from cows exposed to different shade treatments.
No Artificial Treeshade shade shade P value
Period 1 (June 12-July 1) 3.75ab 2.59b 5.12a .076Period 2 (July 2-July 22) .50b .84b 2.39a .080Period 3 (July 23-August 14) 1.59 2.70 1.77 .214
a,b Means within a row without a common superscript letter differ (P < .10).

AAES Research Series 470
74
Table 3. Average high and low ambient temperature and measurable precipitation by period whencows were exposed to different shade treatments.
Low High No. ofTemp. Temp. Precip. Precip.
°F °F inches days
June 12-June 18 87.3 64.4 0.70 3June 19-June 25 93.9 70.9 0.00 0June 26-July 2 94.4 68.4 0.44 4Period 1 average 91.9 67.9 1.14 7
(June 12-July 2)
July 3-July 9 90.7 63.4 0.09 3July 10-July 16 96.0 70.1 0.19 2July 17-July 23 98.6 71.3 0.06 1Period 2 average 95.1 68.3 0.34 6
(July 3-July 23)
July 24-July 30 98.7 73.6 1.42 3July 31-August 6 93.0 63.7 0.00 0August 7-August 13 89.6 66.1 1.03 5Period 3 average 93.5 67.6 2.45 8
(July 24-August 13)

Arkansas Animal Science Department Report 1999
75
Performance of Fall-Calving Cows Fed Zeolite WhileGrazing Fescue During the Winter1
Ken Coffey2 , Don Hubbell3 Charles Rosenkrans, Jr.2, Wayne Coblentz2, Zelpha Johnson2, and Kenneth Harrison3
Story in Brief
A number of products have been tested that potentially bind to tall fescue toxins. One hundred twenty-eightfall-calving cow/calf pairs (1108 and 305 lb for cows and calves, respectively) grazing tall fescue pastures wereallocated to supplements containing either no supplemental zeolite, or zeolite supplemented at .3 or .6 lb/dayduring 56-day winter grazing studies conducted for two years. Supplements were fed Monday through Friday.No treatment differences were observed for cow or calf gain, cow body condition score change, or milk produc-tion. Therefore, the zeolite evaluated in this study does not appear to positively impact production by cowsgrazing endophyte-infected fescue pastures in the winter.
Introduction
Infection of tall fescue with the endophytic fungusNeotyphodium coenophialum causes reduced milk produc-tion, weight gain, and conception rates of cows (Ashley etal., 1987). Although certain mined clays have been shown tobind the toxins produced by this endophytic fungus, only alimited number of these binding agents actually bind to thosetoxins in the rumen environment because of the abundanceof other compounds present in rumen fluid. Compounds thathave been successful in binding fescue toxins from rumenfluid have been evaluated in production situations to a verylimited extent (Samford et al., 1993). The objective of thisstudy was to determine the effect of feeding different levelsof a zeolite that was shown to bind fescue toxins on weightand body condition score changes and milk production bycows and growth of calves grazing endophyte-infected stock-piled fescue.
Experimental Procedures
Winter grazing studies were conducted in 1997 and 1998beginning in mid-January, using a total of 128 fall-calvingcows and their calves. Cows and calves were weighed ontwo days in mid-January of each year without prior removalfrom pasture and water and assigned randomly by weightand age to one of eight endophyte-infected fescue pastures(12.3 to 14.5 acres each). Pasture groups were assigned ran-domly to the following treatments: 1) 3 lb/day of a rice bran-based control supplement (two groups), 2) 3 lb/day of the
rice bran supplement with .3 lb of zeolite added daily (threegroups), or 3) 3 lb/day of the rice bran supplement with .6 lbof zeolite added daily (three groups). Supplements were fedMonday through Friday. Milk production was measured bythe weigh-suckle-weigh technique on day 28 during bothyears of the study. The weigh-suckle-weigh technique con-sisted of separating cows from calves for approximately 12-hours, allowing calves to nurse cows to remove milk thenseparating them again for approximately 16 hours. Calveswere held in pens without access to feed or water during theseparation period, and cows were allowed to graze a com-mon pasture of mixed forages. Calves were weighed, reunitedwith their dams for approximately 20 minutes, then weighedagain when ceased nursing the cows. Body condition scoreswere evaluated by an experienced technician at the begin-ning and end of the study. Cattle groups were moved through-out the eight pastures at 14-day intervals to minimize theimpact of pasture variation on animal production. Cows andcalves were weighed without prior removal from pasture andwater on two days at the end of the 56-day grazing period.Data were analyzed statistically using PROC MIXED pro-cedures of SAS (1988).
Results and Discussion
Although differences in animal performance betweenyears was detected (P < .05) the year x treatment interactionwas not significant (P > .10) for any of the measurementsreported. Therefore, main effects of treatment were averagedacross years and presented in Table 1. No differences (P >
1 Appreciation is expressed to Armbruster Consulting, Amarillo, Texas for providing the experimental zeolite and to Riceland Foods,Stuttgart, Arkansas for providing rice bran for the study.
2 Department of Animal Science, Fayetteville.3 Livestock and Forestry Branch Experiment Station, Batesville.

AAES Research Series 470
76
.10) were detected for cow or calf weight or milk produc-tion. Likewise, no differences were detected in cow bodycondition score change. Since no differences among treat-ments were detected in either year, it is unlikely that thisparticular zeolite will alleviate the depressions in cow andcalf growth performance caused by consuming infected fes-cue forage. Possible reasons for this are 1) the zeolite usedin this study may not be effective in binding sufficient quan-tities of toxins; 2) the fescue toxicity problem may not havebeen severe enough during the winter period to illicit a gainresponse, 3) the fescue toxicity problem was manifested inother symptoms not measured in this experiment, or 4) thezeolite used in this study may have some detrimental effectsby binding beneficial nutrients, thus off-setting any benefi-cial aspects (Mumpton and Fishman, 1977). In either case,zeolite was ineffective in increasing weight gain by cowsand calves grazing winter fescue.
Implications
Numerous products are available that have shown po-tential to offset fescue toxicity in controlled laboratory andin vitro situations. To date, most of these have failed to ben-efit animals in production situations. Specific zeolites maybind tall fescue toxins, but their ability to reduce the impactof tall fescue toxins is probably minimal during the wintergrazing period. Therefore, products claiming to bind tall fes-cue toxins should be evaluated under production situationsto determine their use.
Literature Cited
Ashley, T.L., et al. 1987. J. Anim. Sci. 65(Suppl. 1):49.Mumpton, F.A. and P.H. Fishman. 1977. J. Anim. Sci.
45:1188-1203.Samford, M.D., et al. 1993. J. Anim. Sci. 71(Suppl. 1):78.SAS. 1988. SAS Inst., Inc. Cary, North Carolina.
Table 1. Effect of zeolite supplementation on cow and calf performance two-year average.a
Item Control .3 lb/day .6 lb/day SE
Cows:Initial wt, lb 1113 1103 1107 16.9Final wt, lb 1074 1055 1056 16.5Gain, lb -39 -48 -51 6.3Initial body condition score 5.5 5.6 5.3 .11Body cond. score change -.03 -.10 .07 .102Milk production, lb 8.0 7.5 7.4 .91
Calf:Initial wt, lb 306 302 306 8.7Final wt, lb 398 398 401 10.5Gain, lb 92 96 95 3.4Daily gain, lb 1.63 1.71 1.70 .060
aNo significant differences were detected (P < .10).

Arkansas Animal Science Department Report 1999
77
Performance of Stocker Calves Backgrounded on WinterAnnuals or Hay and Grain1,2
Ken Coffey3, David Shockey4, Wayne Coblentz3, Charles Rosenkrans, Jr.3,Stacey Gunter5, and Greg Montgomery6
Story in Brief
A two-year study involving 120 crossbred calves (574 lb) was conducted during the winters of 1998 and1999 to compare winter backgrounding programs in southeastern Arkansas. Calves were fed either bermudagrasshay and a grain sorghum-based supplement or grazed pastures of bermudagrass and dallisgrass that wereoverseeded with 1) annual ryegrass, 2) wheat and ryegrass, or 3) rye and ryegrass for 112 days beginning in mid-December of each year. Calves fed the hay + supplement treatment gained less weight (P < .05), and had a highercost of gain, and lower return per head than calves that grazed the winter annual forages. Cost of gain waslowerand return/head was higher (P < .05) for annual ryegrass than for rye+ryegrass while that of wheat+ryegrasswas intermediate and did not differ (P > .10) from either of those two treatments. Winter annual forages offerpotential to increase the profitability of stocker calves in southern Arkansas by retaining ownership until spring.Stocker programs involving only grain and hay during the winter and spring are probably not profitable.
Introduction
Winter backgrounding programs for stocker calves in-volving hay and supplemental grain are expensive both perday and per pound of gain produced. An alternative is tooverseed existing warm-season grass pastures with winterannual forages. Considerable research has been conductedin the lower south with winter annuals as forage. Responsesto these systems in Arkansas differ because of colder wintertemperatures and a shorter fall growing season. The objec-tive of this study was to evaluate growth and economic re-turn from calves grazing pastures overseeded with annualryegrass, wheat and ryegrass, or rye and ryegrass comparedwith those of calves fed bermudagrass hay and supplemen-tal grain in drylot during winter and spring.
Materials and Methods
One hundred twenty crossbred calves (574 lb) were usedin a two-year grazing study during the winter months of 1997and 1998. Calves were weighed on two consecutive days inmid-December of 1997 and 1998, stratified by weight andsex, and allocated randomly to 1 of 12 groups of five head
each. In 1997, four groups were heifers and eight groupswere steers. One group of heifers and two groups of steerswere placed on one of four backgrounding programs. In 1998,one group of steers, one group of heifers, and one group ofmixed steers and heifers were allocated to each treatment.Three winter annual forage treatments consisted of grazing5-acre bermuda/dallisgrass pastures that were overseededwith 1) 30 lb/acre of ‘Marshall’ ryegrass, 2) 30 lb/acre ofMarshall ryegrass plus 120 lb/acre of ‘Madison’ soft wheat,or 3) 30 lb/acre of Marshall ryegrass plus 100 lb/acre of‘Bonel’ rye. In a fourth backgrounding treatment, calves wereplaced on dormant bermudagrass pastures and fedbermudagrass hay ad libitum plus a grain sorghum supple-ment. All calves had been weaned and vaccinated in Octo-ber prior to beginning the grazing period.
Pastures were disked lightly with the disk angle removedfrom the disk and were overseeded by broadcasting the re-spective forages in late-September. Pastures were then har-rowed lightly to help incorporate seed. Fifty lb/acre of nitro-gen, phosphate, and potash were applied in late-November.An additional 50 lb/acre of nitrogen was applied in earlyFebruary.
1 Appreciation is expressed to Boehringer Ingelheim Vetmedica, Inc. for providing cattle vaccinations and to Ft. Dodge Animal Health, Inc.for providing dewormer.
2 Mention of specific varieties does not imply endorsement by the Division of Agriculture of those named varieties, nor does it implycriticism of other such varieties that are not mentioned.
3 Department of Animal Science, Fayetteville.4 Former Research Specialist. Southeast Research and Extension Center, Monticello.5 Southwest Research and Extension Center, Hope.6 Research Specialist. Southeast Research and Extension Center, Monticello.

AAES Research Series 470
78
Calves grazing the winter annual pastures were fed 2 lb/head daily of a grain sorghum-based supplement containingtrace mineral salt, necessary minerals, and monensin (200mg/head). Calves fed bermudagrass hay (11.7% crude pro-tein, 58% TDN) were also fed a ground grain sorghum-basedsupplement at 1% of body weight and cottonseed meal at.65 lb/day. The supplement contained trace mineral salt, lime-stone, and monensin (200 mg/head). Square bales ofbermudagrass hay were fed daily in feed bunks to providead libitum consumption.
Interim weights were measured without prior removalfrom feed and water at 28-day intervals throughout the study.Calves were weighed without prior removal from feed andwater on two consecutive days in early April to determineending weights. Costs associated with the differentbackgrounding programs were determined using the costspresented in Table 1. Available forage was measured monthlyby clipping three random 20” x 20” areas per pasture. Sta-tistical analyses were conducted using SAS (1988) proce-dures for a repeated measures analysis of variance.
Results and Discussion
Total weight gain and return ($/head) were greater (P <.05) and cost of gain was lower (P < .05) from calves graz-ing annual forages compared with those fed hay and grain(Table 2). Weight gains did not differ (P > .10) among theannual forage treatments, but cost of gain was lower (P <.05)and return was higher (P < .05) from calves grazing annualryegrass compared with those grazing rye+ryegrass. Costof gain ($/cwt) and return ($/head) from calves grazingwheat+ryegrass was intermediate among the winter annualtreatments and did not differ (P > .10) from either those graz-ing ryegrass or those grazing rye+ryegrass. Gain during thefirst and last 28 d of the experiment was lower (P < .05)from calves fed hay and grain compared with those grazingannual forages. Calf gain during the two remaining 28-dayperiods did not differ (P > .10) among treatments. Overallgain by calves grazing sod-seeded winter annual pasturesare comparable to those from other studies (Moyer et al.,1995). Diets for calves fed hay and grain were formulatedbased on feeding 1% of body weight as ground grain sor-ghum and were estimated to produce 1.5 lb/day gain. Aver-age hay consumption was 8.6 lb/day. Increasing levels ofsupplemental grain have been shown to have a negative im-pact on forage intake and cost efficiency (Goetsch et al., 1991;Freeman and Coffey, 1993).
Average available forage ranged between 800 and 1250lb/acre. Although 800 lb/acre is considered somewhat limit-ing for optimal animal intake, weight gains did not reflect arestriction in intake. Therefore, the annual forage treatmentsoffer the potential to provide economical gain on calvesweaned in the fall and held through the winter.Implications
Winter annual grazing programs have been tried in vari-ous locations with variable success. One key to success forthese programs is to have adequate forage to graze as early
as possible in the fall. This may be difficult to achieve insod-seeding situations. However, the options evaluated inthis study demonstrate that disking pastures and using an-nual ryegrass alone or in combination with rye or wheat mayprovide winter grazing for fall-weaned calves to produceeconomical weight gain allowing cattle producers in south-eastern Arkansas to obtain a profit by retaining ownership oftheir calves.
Literature Cited
Freeman, A.S. and K.P. Coffey. 1993. Kansas Agric. Exp.Sta. Rept. of Progress 678.
Goetsch, A.L., et al. 1991. J. Anim. Sci. 69:2634-2645.Moyer, J.L., et al. 1995. The Prof. Anim. Scientist 11:67-73.SAS. 1988. SAS Inst., Inc., Cary, North Carolina.

Arkansas Animal Science Department Report 1999
79
Table 1. Costs used in calculating economic returns for different backgroundingprograms in southeast Arkansas.
Item Cost/unit
Cattle processing, $/head 10.00Grain sorghum supplement, $/cwt 4.75Hay, $/cwt 2.00Cottonseed meal, $/cwt 10.00Ammonium nitrate, $/cwt 9.4519-19-19 fertilizer, $/cwt 7.50Spreading cost (each spreading), $/acre 2.50Rye seed, $/cwt 17.00Wheat seed, $/cwt 6.00Ryegrass seed, $/cwt 38.00Seeding cost, $/acre 10.00Interest rate, % 9.0Assumed death loss, % 1.0
Table 2. Weight and gain by steers on different backgrounding programs in southeast Arkansas.
Hay + Rye + Wheat +Supplement Ryegrass Ryegrass Ryegrass SE
Initial wt., lb 573 572 574 575 5.9Weight, lb, at:
d 28 573b 616a 617a 613a 9.2d 56 632b 676a 682a 665a 17.1d 84 703 758 759 739 20.4d 112 732b 836a 817a 813a 16.3
Gain, lb 158b 265a 242a 237a 15.9Daily gain, lb 1.42b 2.36a 2.16a 2.12a .142Cost, $/cwt gain 77.21a 39.12c 51.15b 46.26bc 3.802Return, $/head -40.25c 27.80a -0.98b 11.02ab 9.359Gain, lb
d 0-28 0b 44a 44a 37a 6.9d 29-56 59 60 65 52 10.8d 57-84 71 82 77 74 7.5d 85-112 29b 78a 58a 74a 7.4
a,b,c Means within a row without a common superscript letter differ (P < .05).

AAES Research Series 470
80
Effect of Pre-Weaning and/or Pre-Vaccination on Weight Change During the Weaning Process1
Ken Coffey2 , Dianne Hellwig2, Charles Rosenkrans, Jr.2, Wayne Coblentz2, Don Hubbell, III3 , Zelpha Johnson2, Kenneth Harrison3, and Butch Watson2
Story in Brief
One hundred forty-four fall-born calves (444 lb initial body weight [BW]) were used in a two-year study toevaluate the impact of pre-shipment vaccination and/or weaning on weight change of calves at different timesduring the weaning process. Calves were allocated randomly by weight and sex into eight groups each year.Half of the calves within each group received vaccinations against infectious bovine rhinotracheitis (IBR),bovine virus diarrhea (BVD), parainfluenza (PI
3), bovine respiratory syncytial virus (BRSV), five strains of
Leptospira sp., H. somnus, and Pasturella haemolytica on day 0 (EV) and half were not vaccinated until day 29(LV). Half of the groups of calves were weaned on day 14 of the study (EW), and half of the groups wereweaned on day 28 (LW). All calves were loaded and transported to a local auction barn on day 28 and broughtback to the station and vaccinated on the morning of day 29. Early-weaned calves that were not vaccinated priorto shipping had lower (P < .05) gain from day 0 until the morning of shipping than calves on the other treatmentsin year one. Those calves (EW-LV in year one) also gained less from day 0 until weighing at the auction barnthan EV calves that were either late or early weaned. No differences in weight gain were detected (P > .10) inyear 2. Early-weaned calves lost more (P < .10) weight between being weighed at the auction barn and return tothe research station and required more (P < .05) days to regain transit weight loss than late-weaned calves.Therefore, weaning calves two weeks prior to shipping them to an auction barn appears to provide little benefit,but vaccinations four weeks prior to shipping could result in extra weight for calves sold.
Introduction
In a recent survey of cattlemen from 25 different states,animal health was rated as the most important criteria in de-termining profitability of stocker or feeder cattle (Neal etal., 1998). Numerous pre-weaning vaccination programshave been established in different states to encourage pro-ducers to produce healthier calves for buyers. Acceptanceof these programs by cow-calf producers has been less thandesirable because of lack of a perceived premium for pre-conditioned calves. The purpose of this study is to evaluatecalf management methods to 1) reduce weight loss duringweaning, 2) to reduce stresses associated with weaning, and3) to increase animal resistance to foreign pathogens con-tacted at an auction barn environment.
Experimental Procedures
A total of 144 fall-born suckling calves grazed with theirdams in eight groups of eight (1998) or 10 (1999) head eachon eight different pastures of Neotyphodium coenophialum-infected fescue. Calves were allocated randomly to four treat-
ments in a 2 x 2 factorial arrangement of a split-plot experi-ment to compare early (EW) with late weaning (LW) andpre-weaning vaccination (EV) with no pre-weaning vacci-nation (LV). Half of the calves within each group were de-wormed and vaccinated against infectious bovinerhinotracheitis (IBR), bovine virus diarrhea (BVD), parain-fluenza (PI3), bovine respiratory syncytial virus (BRSV), fivestrains of Leptospira sp., H. somnus, and Pasturellahaemolytica on day 0 (28 days prior to shipping all calves toa local auction barn) of the study and half of the calves werenot vaccinated against these organisms until they returnedfrom an auction barn on day 29. All calves were vaccinatedagainst clostridial infections on day 0.
Four groups of calves each year were weaned in a dry-lot on day 14 and fed bermudagrass hay with 4 lb/day of arice bran supplement. At 7:00 am on day 28, all calves weregathered, weighed, transported approximately 10 miles toan auction barn, and placed in pens without feed and water.Calves were weighed at approximately 8:30 pm then placedin pens with access to water only.
1 Appreciation is expressed to Boehringer Ingelheim Vetmedica, Inc. for providing vaccines.2 Department of Animal Science, Fayetteville.

Arkansas Animal Science Department Report 1999
81
Calves were returned to the research facility on themorning of day 29. Calves previously dewormed and vacci-nated received a booster vaccination against the previously-mentioned organisms. Those calves that were not vaccinatedpreviously were dewormed and received their first vaccina-tion against the aforementioned organisms. All calves wereweighed and placed in eight drylot pens by treatment group.Calves were fed hay to appetite and fed a supplement of ricebran and minerals at a level of 4 lb/head daily.
All calves were weighed on day 32 and moved to pas-tures of common bermudagrass overseeded with rye andannual ryegrass (1998) or orchardgrass (1999). Rice branand mineral supplementation was continued for 21 days.Calves were observed daily for 21 days for signs of illnessand treated when their temperature reached or exceeded 104°F. Calves receiving their first vaccination on day 29 receiveda booster vaccination on day 50 of the study.
Weight data were analyzed by analysis of variance(PROC MIXED; SAS, 1990) using initial weight as acovariate. Morbidity data were analyzed by Chi-Squareanalysis.
Results and Discussion
A year x weaning treatment x vaccination treatment in-teraction was detected (P < .10) for most of the weight andgain variables. In 1998, auction-barn weights and weightswhen the calves returned to the station were lower (P < .05)from EW-LV than for the other treatments (Table 1). Thosecalves also weighed less (P < .05) than EW-EV and LW-EVcalves prior to shipping them to the auction barn. No differ-ences in calf weights were detected (P > .10) in 1999.
Gain data (Table 2) followed similar patterns as wereobserved for animal weight. In 1998, calves weaned earlyand not vaccinated until day 29 (EW-LV) gained 17, 11, and15 lb less (P < .05) prior to shipping than EW-EV, LW-LV,and LW-EV calves, respectively. Weight gain from day 0until day 50 was greater (P < .05) from LW-LV and LW-EVcompared with EW-LV.
The 3-way interaction was not detected (P > .10) forweight losses resulting from transportation to and from theauction barn (Table 3). Calves not weaned prior to transportlost 3 lb less weight (P < .10), shrank .6% less (P < .10) andrequired 2.9 fewer (P < .05) day to regain weight lost duringtransportation than calves weaned two weeks prior to trans-portation, regardless of vaccination treatment. Vaccine treat-ment did not impact weight loss during transit to, during,and from the auction barn.
Morbidity rate did not differ (P > .10) among treatments(Table 4). In 1998, EV calves numerically had lower mor-bidity than LV calves, but these trends did not hold in 1999.Early weaned calves had numerically higher morbidity in1998 and numerically lower morbidity in 1999.
When averaged across years, the results in this studyshow some benefits of early vaccination but not of weaningcalves two weeks prior to transporting them to an auctionfacility. It also shows that response to these programs varies
under different circumstances. Calves were weaned in mid-May in 1998. During that time, ambient temperatures werehigh and animals displayed symptoms of heat stress duringthe weaning process. In 1999, calves were weaned in mid-April during more moderate temperatures. It is possible thatless environmental stress in 1999 negated treatment differ-ences. It is also possible that two weeks is insufficient timeto allow calves to recover prior to additional stresses of trans-port to an auction facility. If this is the case, calves that areearly weaned are subjected to multiple stressors over an ex-tended period rather than one stress over a shorter period.
Calves in this study were exposed to some but not all ofthe stresses normally presented to weaned calves. Althoughcalves were transported to an auction facility, they were ex-posed only to calves on either side of the pen they werehoused in. In many situations, calves are commingled withcalves from numerous locations, thereby exposing them tomultiple organisms. This reduced exposure is the probablereason for a somewhat lower morbidity than expected in thesestudies. With reduced morbidity, response to treatmentswould be expected to also be reduced.
Implications
Producing healthy calves should be a high priority forArkansas producers based on recent surveys. Responses topre-weaning vaccination programs will probably be basedon the level of stress and disease exposure to which calvesare subjected. Weaning calves two weeks prior to shippingwill probably provide little additional benefit to the sellerother than their cattle might spend less time bawling at theauction barn. However, vaccination against respiratory in-fection prior to transport may improve weight gain and shouldprovide immunity when calves are exposed to stressful situ-ations.
Literature Cited
Neal, J.B. et al., 1998. J. Anim. Sci. 76(Suppl. 2):7.SAS. 1990. SAS Inst., Inc., Cary, North Carolina.

AAES Research Series 470
82
Table 1. Weight (lb) of stocker calves at various times during the weaning process that were vacci-nated early or late and weaned early or late.
Early wean Late weanEarly vac Late vac Early vac Late vac SE
1998day 14 486a 477b 484ab 482ab 4.3day 28 (7 am pre-ship) 500a 483b 498a 494ab 5.2day 28 (8 pm at salebarn) 489a 475b 489a 484a 4.5day 29 (at research station) 472a 457b 474a 471a 4.3day 50 521bc 512c 540ab 550a 8.0
1999day 14 475 480 477 475 3.9day 28 (7 am pre-ship) 506 513 513 509 4.9day 28 (8 pm at salebarn) 490 496 495 491 4.3day 29 (at research station) 468 473 475 471 4.0day 50 541 548 543 532 7.6
a,b,cMeans within a row without a common superscript letter differ (P < .05).
Table 2. Gain (lb) by stocker calves at various times during the weaning process that werevaccinated early or late and weaned early or late.
Early wean Late weanEarly vac Late vac. Early vac Late vac SE
1998day 0-14 42a 33b 40ab 38ab 4.1day 0 - pre-ship 55a 38b 53a 49a 5.2day 0 - salebarn 44a 30b 44a 39ab 4.5day 0 - 50 76bc 67c 95ab 105a 8.0
1999day 0-14 31 36 33 31 3.9day 0 - pre-ship 61 68 68 64 4.9day 0 - salebarn 45 51 50 46 4.3day 0 - 50 96 103 98 87 7.6
a,b,cMeans within a row without a common superscript letter differ (P < .05).
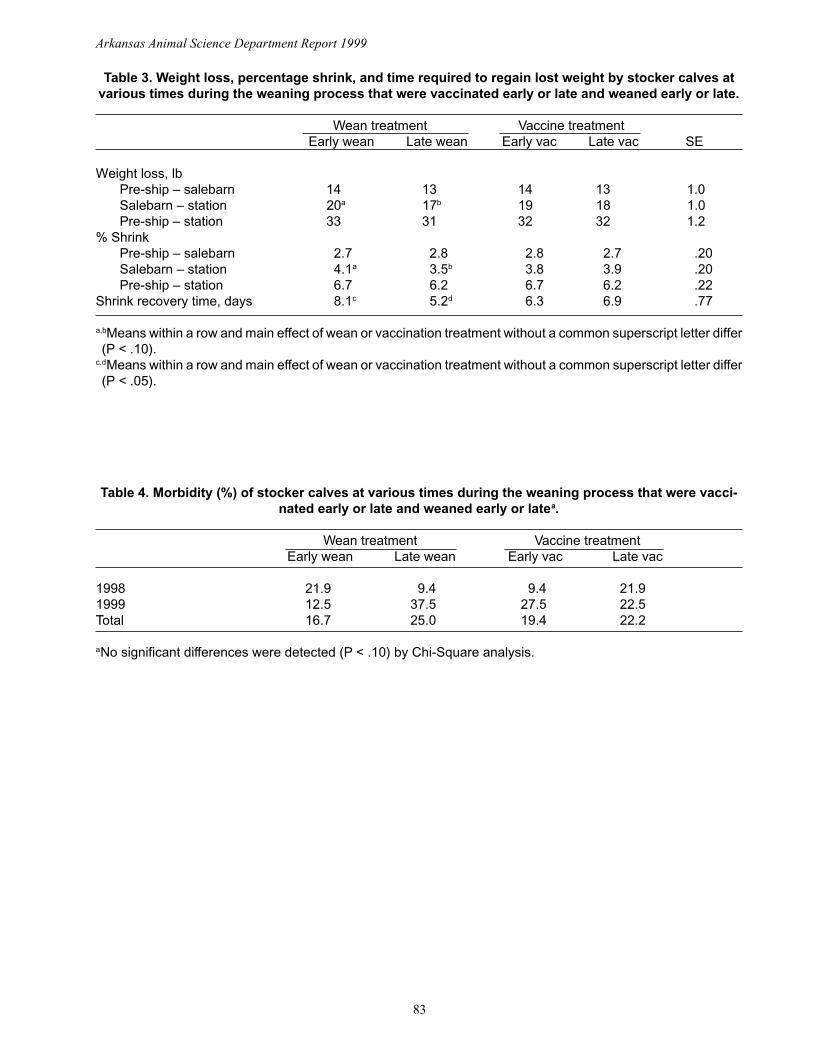
Arkansas Animal Science Department Report 1999
83
Table 3. Weight loss, percentage shrink, and time required to regain lost weight by stocker calves atvarious times during the weaning process that were vaccinated early or late and weaned early or late.
Wean treatment Vaccine treatmentEarly wean Late wean Early vac Late vac SE
Weight loss, lbPre-ship – salebarn 14 13 14 13 1.0Salebarn – station 20a 17b 19 18 1.0Pre-ship – station 33 31 32 32 1.2
% ShrinkPre-ship – salebarn 2.7 2.8 2.8 2.7 .20Salebarn – station 4.1a 3.5b 3.8 3.9 .20Pre-ship – station 6.7 6.2 6.7 6.2 .22
Shrink recovery time, days 8.1c 5.2d 6.3 6.9 .77
a,bMeans within a row and main effect of wean or vaccination treatment without a common superscript letter differ(P < .10).
c,dMeans within a row and main effect of wean or vaccination treatment without a common superscript letter differ(P < .05).
Table 4. Morbidity (%) of stocker calves at various times during the weaning process that were vacci-nated early or late and weaned early or latea.
Wean treatment Vaccine treatmentEarly wean Late wean Early vac Late vac
1998 21.9 9.4 9.4 21.91999 12.5 37.5 27.5 22.5Total 16.7 25.0 19.4 22.2
aNo significant differences were detected (P < .10) by Chi-Square analysis.

AAES Research Series 470
84
Effect of Agrado® on Performance and Health of Calves Newto the Feedlot Environment1
Beth Kegley2, Dianne Hellwig2, Don Gill3, and Fred Owens3
Story in Brief
Two experiments were conducted to determine the effect of an antioxidant (Agrado®) on the growth, feed:gainratio, and health of receiving calves. In Experiment 1, 96 heifer calves were purchased at sale barns and deliv-ered as one group to the research facility in Savoy, Arkansas. All heifers were fed a totally mixed ration contain-ing cottonseed hulls, cracked corn, and soybean meal for 42 days. Treatments consisted of 0 or 150 ppm Agrado.Fewer (P < .05) of the heifers fed supplemental Agrado became sick (73 vs. 83%); therefore, medication costswere lower (P < .05) for heifers fed supplemental Agrado ($6.32 vs. 9.49). Average daily gain and feed:gainratio were not affected (P > .10). In Experiment 2, 86 bull and steer calves were purchased at sale barns. Bullswere castrated after arrival at Savoy. Steers were managed and fed as in Experiment 1 for this 41-day study.There was no significant effect (P > .10) of dietary treatment on the number of sick calves or medication costs.Supplemental Agrado improved (P < .04) feed:gain ratio for the first 28 days. Supplementation with Agradoimproved the health of receiving cattle in one of two experiments; feed:gain ratio was improved during the first28 days in the other experiment.
2Department of Animal Science, Fayetteville3Department of Animal Science, Oklahoma State University, Stillwater
Introduction
Dysfunction of the immune system results in signifi-cant annual losses to livestock producers. Morbidity is acostly economic problem that may, in part, be addressed bynutritional intervention. Nutritional status can have profoundeffects on immune function; energy, protein, minerals, andvitamins all can affect immunocompetence.
Oxidants (including free radicals) can damage animaltissues. Oxidants are produced during metabolism; oxidantproduction may increase with detoxification of many com-pounds, exercise, stress, tissue injury, and infection. The ra-tio between antioxidants and free radicals may become un-balanced under such conditions. Antioxidant nutrients in-clude: vitamin E, β-carotene, and the trace elements (sele-nium, copper, zinc, iron and manganese) acting as compo-nents of enzymes.
An antioxidant mixture commercially available to thefeed industry is Agrado® (Solutia Inc., St. Louis, Missouri).The primary chemical in this product is ethoxyquin.Ethoxyquin has been used for many years as a feed preser-vative. It also extends the shelf-life of poultry meat. No re-search has been published on the effects of this compoundon bovine immune function or growth performance. There-fore, the objective of these experiments was to determinethe effect of supplementing Agrado in the receiving rationon growth performance and immune function of transport-stressed calves.
Experimental Procedures
Experiment 1. Ninety-six mixed breed heifer calves (454± 3.1 lb initial BW), purchased at sale barns by an orderbuyer, were delivered as one group to the University of Ar-kansas Stocker and Receiving Cattle Research facility onDecember 4, 1997. Heifers were injected with clostridial andviral respiratory vaccines, a pour-on insecticide was used,and any horns were tipped. All heifers were branded andidentified with ear-tags. Heifers were allocated randomlywithin eight weight blocks to two dietary treatments, withsix heifers in each of 16 pens for a total of 48 heifers pertreatment.
All heifers were fed a totally mixed ration formulated tomeet NRC (1996) recommendations (Table 1). Dietary treat-ments consisted of 0 or 150 ppm Agrado. Heifers were ob-served daily during the 42-day study for signs of morbidity.Rectal temperature (≥ 104°F) and clinical signs were used toidentify morbid calves. Calves with rectal temperatures ≥104°F were treated with antibiotic(s) following a preplannedprotocol. If animals did not respond to the first antibioticadministered, the next antibiotic in the protocol was used.Success of antibiotic treatment was examined by a drop inbody temperature of at least 2°F within 24 hours, along withremission of clinical signs and return to normal activity.
Body weights were obtained upon arrival and on day14, 26, and 42. Feed intakes were recorded daily and heifers
1Appreciation is expressed to Solutia Inc. for providing financial assistance for this project.

Arkansas Animal Science Department Report 1999
85
were bled via jugular venipuncture on day 0, 26, and 42.Serum was analyzed for antibody response to infectious bo-vine rhinotracheitis virus, bovine viral diarrhea, and parain-fluenza-3 virus vaccines.
Experiment 2. Eighty-six mixed breed bull and steercalves (522 ± 4.9 lb initial BW), purchased at sale barns byan order buyer, were delivered as one group to the Univer-sity of Arkansas Stocker and Receiving Cattle Research fa-cility on March 18, 1998. Bulls were castrated after arrival.Steers were managed and fed as in Experiment 1. Dietarytreatments were the same as in Experiment 1 for this 41-daystudy. Steers were allocated randomly within eight weightblocks to dietary treatment, with six steers in each of sixpens and five steers in each of 10 pens, for a total of 43steers per treatment. Body weights were taken upon arrivaland on day 7, 14, 28, and 41. Feed intakes were recordeddaily.
Statistical Analysis. Data from both experiments wereanalyzed with analysis of variance as a randomized com-plete block design (SAS, 1988). Pen was used as the experi-mental unit for all analysis
Results
Experiment 1. Fewer (P < .05) of the heifers fed supple-mental Agrado became sick (Table 2); therefore, medicationcosts were lower (P < .04) for heifers fed supplementalAgrado. No significant (P > .10) effects of supplementationwere detected on the number of calves becoming sick a sec-ond time or on the day that first illness occurred. No differ-ences (P > .10) due to dietary treatment were observed forserum antibody response to infectious bovine rhinotracheitisvirus, bovine viral diarrhea, or parainfluenza-3 virus. Aver-age daily gain, daily feed intake, and feed:gain ratio for the42-day study were not affected by supplemental Agrado (P> .10).
Experiment 2. No significant (P > .10) effect of dietarytreatment on the number of morbid steers, medication costs,the number of calves becoming sick a second time, or on theday that first illness occurred were detected (Table 3).
There were no significant (P > .10) effects of supple-menting Agrado on average daily gain, feed intake, orfeed:gain ratio for the 41-day trial, although added Agradodecreased the feed:gain ratio from day 0 to 28 (P < .04).Numerically, steers supplemented with Agrado had a greater(P = .13) average daily gain during the first 28 days of thetrial. Steers supplemented with Agrado also had numeri-cally lower (P = .19) feed:gain ratios than controls duringthe 41-day study.
Discussion
Ethoxyquin is permitted by the FDA to be included as apreservative in feeds at 150 ppm. Whether Agrado acts di-rectly as an antioxidant in the digestive tract, or in feeds toenhance the availability of other antioxidants is not known.In poultry, ethoxyquin lowers the selenium requirement of
vitamin E deficient chicks (Combs, 1978), presumably act-ing as a metabolic antioxidant.
Supplementation of antioxidant nutrients in receivingrations for calves often has proven to be beneficial. In addi-tion to research conducted with vitamin E, supplementinghigher than levels recommended by the NRC (1996) of zinc(Hutcheson, 1985; Chirase et al., 1991) has improved growthperformance and immune function of receiving cattle. Defi-ciencies of selenium (Arthur and Boyne, 1985; Reffett et al.,1988) and copper (Boyne and Arthur, 1981; Nockels, 1993),known to participate in antioxidant enzymes, negativelyimpact immunocompetence.
Our results with supplemental Agrado differed betweenour two experiments, perhaps due to differences in exposureto stress. The heifers used in Experiment 1 were more “atrisk,” being lightweight and obtained from sale barns in thefall. Historically, disease incidence of receiving cattle ishigher in the fall and mean incidence of morbidity was greaterin Experiment 1 (78%) than Experiment 2 (58%). In Experi-ment 1, supplemental Agrado significantly reduced the inci-dence of morbidity by 12% suggesting a positive effect ofthe antioxidant on immune function. Ethoxyquin previouslyhas eliminated the suppressive effect of vitamin E deficiencyon lymphocyte function in dogs (Langweiler et al., 1983).In contrast, Bailey et al. (1996) detected no response toethoxyquin supplementation in antibody response toNewcastle disease virus by cockerels. In Experiment 2, nosignificant effect (P = .38) of Agrado on morbidity was de-tected.
No significant effect on calf performance was detectedin Experiment 1, but feed:gain ratio was improved duringthe first 28 days of Experiment 2. As expected, the steersused in Experiment 2 ate more feed and grew faster than theheifers used in Experiment 1. The steers supplemented withAgrado tended to gain more weight during the first 28 daysof the study, and have a lower feed:gain ratio for the 41-dayfeeding period. Research at Oklahoma State University hasshown that cattle supplemented with Agrado for the final 28days on feed had slightly greater average daily gain and im-proved feed:gain ratio (F.N. Owens, personal communica-tion).
Using prices available at the conclusion of both experi-ments the calves supplemented with Agrado had higher valuethan the unsupplemented calves ($4.19/calf in Experiment 1and $3.20/calf in Experiment 2).
Implications
Supplementation with Agrado improved the health ofreceiving cattle in one of two experiments. Dietary antioxi-dants are important components of receiving rations. Supple-menting Agrado, an antioxidant, is an economical way toincrease the supply of dietary antioxidants for calves.
Literature Cited
Arthur, J.R., and R. Boyne. 1985. Life Sci. 36:1569-1575.

AAES Research Series 470
86
Bailey, C.A., et al. 1996. Poul. Sci. 75:1109-1112.Boyne, R., and J.R. Arthur. 1981. J. Comp. Pathol. 91:271-
276.Chirase, N.K., et al. 1991. J. Anim. Sci. 69:4137-4145.Combs, G.F., Jr. 1978. Poul. Sci. 57(1):210-222.Hutcheson, D.P. 1985. Feedstuffs 61:16-17, 24.Langweiler, M., et al. 1983. J. Am. Vet. Med. Assoc. 44(1):5-7.
Nockels, C.F., et al. 1993. Beef Program Report, Depart-ment of Animal Sciences, Colorado State University,Fort Collins, pp. 85-92.
NRC. 1996. Nutrient Requirements of Beef Cattle. 7th ed.Natl. Acad. Sci., Washington, DC.
Reffett, J. K., et al. 1988. J. Nutr. 118:229-235.SAS. 1988. SAS Inst., Inc., Cary, North Carolina.
Table 1. Diet used in Experiments 1 and 2 (as fed basis).
Ingredient %
Corn, cracked 53.42Cottonseed hulls 30.0Soybean meal 11.0Molasses, blend of cane and beet 4.1Dicalcium phosphate 0.4Limestone 0.85Salt, white 0.15Vitamin premix1 0.075Trace mineral premix2 +Bovatec3 +Agrado4 - / +
1Vitamin premix provided 2,000 IU vitamin A, 400 IU vitamin D, and 5 IU vitamin E/lb of diet.2Trace mineral premix added 26 ppm zinc and 0.1 ppm selenium.3Added to provide 33.6 ppm lasalocid.4Powdered form assayed at 58% (Experiment 1) and 60% (Experiment 2) purity added to provide 0 or 150 ppmof diet DM.
Table 2. Effect of Agrado on growth performance and morbidity (Experiment 1).
Control Agrado1 SE P =
Initial weight, lb 454 454 0.208 0.47Final weight, lb 535 536 4.860 0.92Average daily gain, lb Day 1 to 14 0.22 0.32 0.174 0.69 Day 1 to 26 1.87 1.91 0.083 0.75 Day 1 to 42 1.93 1.96 0.113 0.89Daily feed intake, lb Day 1 to 14 8.07 8.16 0.053 0.25 Day 1 to 26 11.16 11.15 0.209 0.98 Day 1 to 42 13.65 13.62 0.302 0.93Feed:gain Day 1 to 14 -2.63 12.32 19.470 0.60 Day 1 to 26 6.44 6.20 0.214 0.46 Day 1 to 42 7.32 7.04 0.335 0.58Morbidity, % 83.30 72.90 3.100 0.02Medicine cost, $/calf 9.49 6.32 0.867 0.05
1Agrado supplemented at 150 ppm of diet DM.

Arkansas Animal Science Department Report 1999
87
Table 3. Effect of Agrado on growth performance and morbidity (Experiment 2).
Control Agrado1 SE P =
Initial weight, lb 525 525 0.210 0.64Final weight, lb 650 655 4.910 0.54Average daily gain, lb Day 1 to 7 2.60 2.84 0.496 0.75 Day 1 to 14 2.65 2.62 0.225 0.94 Day 1 to 28 3.31 3.63 0.133 0.13 Day 1 to 41 3.07 3.17 0.120 0.56Daily feed intake, lb Day 1 to 7 12.90 12.14 0.253 0.07 Day 1 to 14 14.57 13.81 0.368 0.18 Day 1 to 28 17.33 16.95 0.449 0.57 Day 1 to 41 19.35 18.88 0.380 0.41Feed:gain Day 1 to 7 12.66 4.83 5.650 0.36 Day 1 to14 5.57 5.66 0.369 0.87 Day 1 to 28 5.28 4.69 0.163 0.04 Day 1 to 41 6.34 6.01 0.166 0.19Morbidity, % 53.00 63.00 7.200 0.38Medication cost, $/calf 8.17 8.84 1.160 0.69
1Agrado supplemented at 150 ppm of diet DM.

AAES Research Series 470
88
Production of Stocker Cattle Supplemented with Defatted RiceBran while Grazing Bermudagrass Pasture
L.B. Daniels1, Ken P. Coffey1, Kenneth F. Harrison2, Don Hubbell, III2, and Zelpha B. Johnson1
Story in Brief
Forty-two commercial crossbred steers, averaging 540 lb of body weight were supplemented with eitherzero or three pounds per head per day of defatted rice bran while grazing bermudagrass pasture from July 21until September 16. Steers supplemented with rice bran grew significantly faster than those not supple-mented. It took approximately 8 lbs rice bran to produce a pound of gain at a cost of approximately 40 centsper pound of gain.
Introduction
Arkansas is the number one producer of rice in the UnitedStates and therefore a large supply of rice bran is availableas a by-product of the rice milling industry. Rice bran hasexcellent nutritive value for ruminant animals. The objec-tive of this study was to evaluate the value of defatted ricebran as a feed supplement for stocker cattle while grazingbermudagrass pastures.
Experimental Procedures
Forty-two commercial crossbred steers, averaging 540lb of body weight, were assigned to two treatment groupsand were supplemented daily with either zero or three poundsof rice bran per head while grazing bermudagrass pasture.Steers were rotated to a different bermudagrass pasture ev-ery 28 days. All steers were implanted with Ralgro®, anddewormed with ivermectin at the beginning of the study. Thetrial began on July 21 and continued until September 16. Allsteers were weighed every 14 days, using both a 12-hourshrunk weight and a full weight. Treatments were replicatedthree times with seven steers per replication. The data was
1Department of Animal Science, Fayetteville.2Livestock and Forestry Branch Experiment Station, Batesville.
analyzed by ANOVA procedures of SAS (1988).
Results and Discussion
The average daily gain and total gain for the steers aregiven in Table 1. No statistical differences (P>.05) were ob-served between treatments. Steers supplemented with threepounds of defatted rice bran per head per day grew faster(P<.05), averaging 1.66 lb gain per head per day as com-pared to 1.29 lb gain per head per day when not supplementedwith rice bran. It took approximately 8 lb of rice bran toproduce one pound of gain. If defatted rice bran had a valueof $100 per ton, it would cost 40 cents per pound of gain.Therefore, defatted rice bran appears to be an excellent andeconomical supplement for stocker cattle grazingbermudagrass pasture in Arkansas.
Reference
SAS, 1988. SAS Inst., Inc., Cary, North Carolina.
Table 1. Average daily gain and total gain of steers supplemented with rice bran while grazingbermudagrass pastures.
0 lb Rice bran 3 lb Rice bran/head/day
Initial weight, lb 541 540Days on study 56 56ADG, lb 1.29 1.66Total gain, lb 72 93Lbs defatted rice bran/lb gain - 8.11Cost of lb gain from defatted rice bran - $0.40

Arkansas Animal Science Department Report 1999
89
Developing Beef Heifers During the Winter Monthswith Stockpiled Burmudagrass Forage
L.B. Daniels1, A.H. Brown, Jr.1, K.F. Harrison2, D. Hubbell, III2 and Z.B. Johnson1
Story in Brief
Forty-eight heifers averaging 450 lb, grazed either bermudagrass, endophyte-free fescue or endophyte-infected fescue that had been allowed to accumulate during late summer and fall. Grazing began on December10, 1996 and continued through March 12, 1997. All heifers were then allowed to graze soft-red winter wheatforage until April 15, 1997. Heifers grazing endophyte-infected fescue grew slower when grazing wheat foragethan those grazing endophyte-free fescue or bermudagrass.
1Department of Animal Science, Fayetteville2Livestock and Forestry Branch Experiment Station, Batesville
Introduction
Bermudagrass is the predominant warm season foragegrass produced in Arkansas. If moisture is available, it makesrapid growth during the late summer and early fall and usu-ally considerable tonnage of forage remains after frost. Thisresidue of bermudagrass is approximately 8 to 10% crudeprotein and over 50% TDN. Most replacement heifers in Ar-kansas beef herds are developed by Arkansas beef produc-ers. These heifers are traditionally fed fescue or bermudagrasshay plus a small amount of grain while grazing fescue pas-tures. Fescue has traditionally been stockpiled for overwin-tering the cow herd, and there is some interest in stockpiledbermudagrass for overwintering cow herds. The objectiveof this study was to evaluate stockpiled bermudagrass as aforage for developing beef heifers during the winter months.
Experimental Procedures
Sixteen acres each of permanent bermudagrass, endo-phyte-free and endophyte-infected tall fescue pastures wereallowed to grow and the forage to accumulate during the latesummer and fall of 1996. The pastures were fertilized ac-cording to soil test recommendations. Endophyte-infectedfescue contained over 75% infection of the toxic endophyte.Thirty-two Angus heifers and 12 Charolais heifers, averag-ing 450 pounds of body weight, were randomly assigned toone of three treatment groups (1) stockpiled bermudagrass,(2) stockpiled endophyte-free fescue, or (3) stockpiled en-dophyte-infected fescue. All heifers were weighed after fast-ing for 12 hours and placed in their respective pasture onDecember 10, 1996 and were allowed to graze that pastureuntil March 12, 1997. They were removed from their respec-tive pastures and allowed to graze soft-red winter wheat for-age until April 15, 1997. Each treatment was replicated twicewith six Angus and two Charolais per replication. Each pas-ture was divided by electrical fence into eight-acre pastures.
Heifers had free access to water and a trace mineral mix. Noother supplement was provided. All heifers were bred in lateMay and early June, 1997 (Angus at 550 to 600 lb and Charo-lais at 750 to 800 lb) and calving percentage recorded. Bredheifers grazed bermudagrass pastures during the summer andfescue until calving in spring, 1998. Data were analyzed byANOVA procedures of SAS (1998).
Results and Discussion
The ADG and total gain (TG) of heifers grazing theirrespective stockpiled forage are given in Table 1. There wereno statistical differences (P > .05) in ADG or TG of heifersdue to forage grazed. However, heifers grazing stockpiledburmudagrass grew similarly (ADG = 1.2 lb) to those graz-ing non-infected fescue (ADG = 1.5 lb) or those grazing en-dophyte-infected fescue (ADG = 1.4 lb) or bermudagrass(ADG = 1.2 lb). These data suggest that satisfactory growthcan be obtained when replacement heifers grazed stockpiledbermudagrass.
Growth of heifers, which grazed wheat forage follow-ing grazing either stockpiled bermudagrass or fescue, is givenin Table 2. Heifers grazing stockpiled bermudagrass grewsimilarly to those grazing endophyte-free fescue and numeri-cally faster than those grazing endophyte-infected fescue.
Percentage of heifers calving is in Table 3. A higherpercentage of Angus calved than did the Charolais (87.5 vs.45.0).
These data suggest that bermudagrass can be stockpiledas forage for growing beef heifers during the winter months.
Literature Cited
SAS. 1998. SAS Inst., Inc., Cary, North Carolina.

AAES Research Series 470
90
Table 1. Average daily gain (ADG) and total gain (TG) of heifers which grazed stockpiledbermudagrass, endophyte free (-) fescue or endophyte infected (+) fescue.
Item Bermudagrass (-) fescue (+) fescue
Initial wt, lb 458 453 454Days grazed 92 92 92ADG, lb 1.2 1.5 1.4TG, lb 114 141 129
Table 2. Growth of heifers while grazing wheat forage following grazing ofstockpiled bermudagrass or fescue.
Item Bermudagrass wheat (-) fescue wheat (+) fescue wheat
Initial wt, lb 573 582 583Days grazed 34 34 34ADG, lb 2.5 2.6 2.1TG, lb 85 88 70Final wt, lb 658 670 653
Table 3. Percentage of heifers calving that had grazed stockpiled bermudagrass and fescue.
Breed BG (+) F (-) F Av.
Angus 100 73 90 87Charolais 0 75 60 45Avg 73 73 80 75

Arkansas Animal Science Department Report 1999
91
Use of Soft-Red Winter Wheat Forage forStocker Cattle Production During the Fall and Winter1
L.B. Daniels2, K.F. Harrison3, D. Hubbell, III3, A.H. Brown, Jr.2, E.B. Kegley2,K.P. Coffey2, W. Coblentz2, Z.B. Johnson2, and R. Bacon4
Story in Brief
Two cultivars of soft-red winter wheat (Triticum aestivum L.) were seeded at 120 lb/A (acre) on September10-11, 1996 and 1997. One-half of each cultivar received 50 lb nitrogen(N)/A above recommended soil analy-sis. Sixty Angus x Brangus and 60 commercial crossbred steers, averaging 500 lb body weight, were assigned totheir respective wheat forage at a stocking density of 500 and 750 lb beef/A on October 23 and 29 for 1996 and1997, and removed on February 17 and 4 in 1997 and 1998, respectively. ADG, total gain (TG) and gain per acre(G/A) were greater (P < .01) for steers that grazed Jaypee forage in 1997-98, but did not differ during 1996-97.Steers grazing pastures with added N produced more (P < .05) G/A than those grazing pastures without addi-tional N in 1996-97. No differences occurred in G/A due to added N during 1997-98 or for the combined years.Steers stocked at 500 lb beef/A had ADG and TG greater (P<.01) than those steers stocked at 750 lb beef/A.However, steers that were stocked at 750 lb beef/A produced more (P < .01) G/A than steers that were stocked at500 lb beef/A.
2 Department of Animal Science, Fayetteville.3 Livestock and Forestry Branch Experiment Station, Batesville.4 Department of Crop, Soil, and Environmental Sciences, Fayetteville.
Introduction
Arkansas leads the nation in the production of soft-redwinter wheat, producing over 45,000,000 bushels annuallyfrom approximately one million acres (Klugh and Abbe,1995). With the phase-out of the Federal Crop DeficiencyPayment Program, wheat farmers must have a secondarysource of income from their land. The production of stockercattle from grazing hard-red winter wheat forage in the south-ern plains is a unique and economical renewable resource.Income is derived from both grain and the increased valuethat is added as weight gain to growing cattle that grazedwinter wheat forage and has been a practice for many yearsin the southern plains (Horn et al., 1994).
Over 25% of the nation’s beef cows are located in thisregion (Taylor, 1994). Approximately one million beef cows,which produce nearly 875,000 calves annually, are locatedin Arkansas (Klugh and Abbe, 1995). Most of these calvesare sold at weaning during the fall to cattlemen in the south-ern plains and other western states. Considerable interest inretaining ownership of calves is developing by producers inthe southern region. Therefore, it is the objective of this studyto evaluate soft-red winter wheat forage as pasture for stockercattle during the fall and winter.
Experimental Procedures
Twenty-four two-acre pastures, having a Perridge siltloam soil, were sprayed three times with 1/3 gallon per spray-ing of Roundup® per acre during the summer of 1996 andthen tilled to prepare a seedbed. The pastures were seededon September 10-11 during 1996 and 1997 with either‘Hickory’ or ‘Jaypee’ cultivars of soft-red winter wheat (Triti-cum aestivum L.) at a seeding rate of 120 lb seed/A. Indi-vidual soil test analyses were done on each pasture each year,and the pastures were fertilized according to the soil testanalysis for wheat grain production. One half of the pasturesof each cultivar was top-dressed with urea at seedling emer-gence to supply 50 lb additional nitrogen (N)/A. Foragesamples were taken at 10 locations in each pasture by clip-ping every 28 days and frozen. They were analyzed for CP,neutral detergent fiber (NDF), acid detergent fiber (ADF),and in vitro dry matter digestibility (IVOMD).
Sixty crossbred Angus x Brangus and 60 crossbred com-mercial steers, averaging 500 lb BW, were preconditionedand used as experimental animals in 1996-97 and 1997-98,respectively. Steers were assigned to treatment groups in a2 x 2 x 2 factorial arrangement as follows:
1 Research was supported in part by the Arkansas Wheat Board.
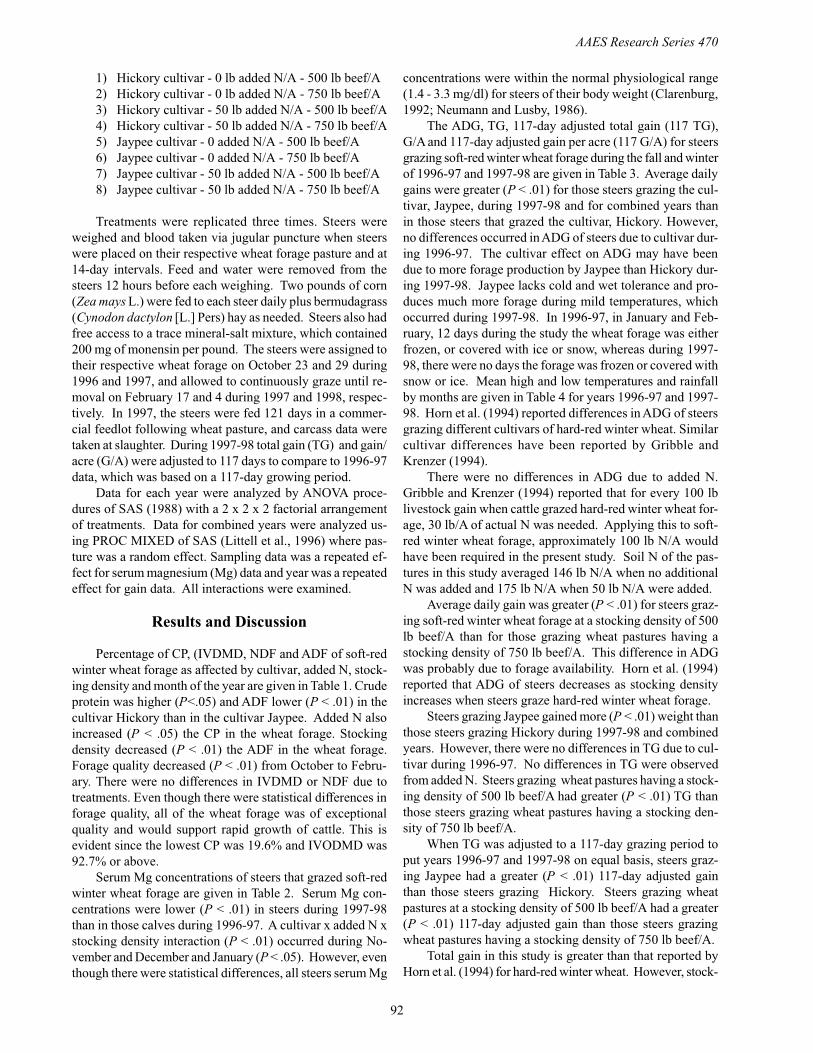
AAES Research Series 470
92
1) Hickory cultivar - 0 lb added N/A - 500 lb beef/A2) Hickory cultivar - 0 lb added N/A - 750 lb beef/A3) Hickory cultivar - 50 lb added N/A - 500 lb beef/A4) Hickory cultivar - 50 lb added N/A - 750 lb beef/A5) Jaypee cultivar - 0 added N/A - 500 lb beef/A6) Jaypee cultivar - 0 added N/A - 750 lb beef/A7) Jaypee cultivar - 50 lb added N/A - 500 lb beef/A8) Jaypee cultivar - 50 lb added N/A - 750 lb beef/A
Treatments were replicated three times. Steers wereweighed and blood taken via jugular puncture when steerswere placed on their respective wheat forage pasture and at14-day intervals. Feed and water were removed from thesteers 12 hours before each weighing. Two pounds of corn(Zea mays L.) were fed to each steer daily plus bermudagrass(Cynodon dactylon [L.] Pers) hay as needed. Steers also hadfree access to a trace mineral-salt mixture, which contained200 mg of monensin per pound. The steers were assigned totheir respective wheat forage on October 23 and 29 during1996 and 1997, and allowed to continuously graze until re-moval on February 17 and 4 during 1997 and 1998, respec-tively. In 1997, the steers were fed 121 days in a commer-cial feedlot following wheat pasture, and carcass data weretaken at slaughter. During 1997-98 total gain (TG) and gain/acre (G/A) were adjusted to 117 days to compare to 1996-97data, which was based on a 117-day growing period.
Data for each year were analyzed by ANOVA proce-dures of SAS (1988) with a 2 x 2 x 2 factorial arrangementof treatments. Data for combined years were analyzed us-ing PROC MIXED of SAS (Littell et al., 1996) where pas-ture was a random effect. Sampling data was a repeated ef-fect for serum magnesium (Mg) data and year was a repeatedeffect for gain data. All interactions were examined.
Results and Discussion
Percentage of CP, (IVDMD, NDF and ADF of soft-redwinter wheat forage as affected by cultivar, added N, stock-ing density and month of the year are given in Table 1. Crudeprotein was higher (P<.05) and ADF lower (P < .01) in thecultivar Hickory than in the cultivar Jaypee. Added N alsoincreased (P < .05) the CP in the wheat forage. Stockingdensity decreased (P < .01) the ADF in the wheat forage.Forage quality decreased (P < .01) from October to Febru-ary. There were no differences in IVDMD or NDF due totreatments. Even though there were statistical differences inforage quality, all of the wheat forage was of exceptionalquality and would support rapid growth of cattle. This isevident since the lowest CP was 19.6% and IVODMD was92.7% or above.
Serum Mg concentrations of steers that grazed soft-redwinter wheat forage are given in Table 2. Serum Mg con-centrations were lower (P < .01) in steers during 1997-98than in those calves during 1996-97. A cultivar x added N xstocking density interaction (P < .01) occurred during No-vember and December and January (P < .05). However, eventhough there were statistical differences, all steers serum Mg
concentrations were within the normal physiological range(1.4 - 3.3 mg/dl) for steers of their body weight (Clarenburg,1992; Neumann and Lusby, 1986).
The ADG, TG, 117-day adjusted total gain (117 TG),G/A and 117-day adjusted gain per acre (117 G/A) for steersgrazing soft-red winter wheat forage during the fall and winterof 1996-97 and 1997-98 are given in Table 3. Average dailygains were greater (P < .01) for those steers grazing the cul-tivar, Jaypee, during 1997-98 and for combined years thanin those steers that grazed the cultivar, Hickory. However,no differences occurred in ADG of steers due to cultivar dur-ing 1996-97. The cultivar effect on ADG may have beendue to more forage production by Jaypee than Hickory dur-ing 1997-98. Jaypee lacks cold and wet tolerance and pro-duces much more forage during mild temperatures, whichoccurred during 1997-98. In 1996-97, in January and Feb-ruary, 12 days during the study the wheat forage was eitherfrozen, or covered with ice or snow, whereas during 1997-98, there were no days the forage was frozen or covered withsnow or ice. Mean high and low temperatures and rainfallby months are given in Table 4 for years 1996-97 and 1997-98. Horn et al. (1994) reported differences in ADG of steersgrazing different cultivars of hard-red winter wheat. Similarcultivar differences have been reported by Gribble andKrenzer (1994).
There were no differences in ADG due to added N.Gribble and Krenzer (1994) reported that for every 100 lblivestock gain when cattle grazed hard-red winter wheat for-age, 30 lb/A of actual N was needed. Applying this to soft-red winter wheat forage, approximately 100 lb N/A wouldhave been required in the present study. Soil N of the pas-tures in this study averaged 146 lb N/A when no additionalN was added and 175 lb N/A when 50 lb N/A were added.
Average daily gain was greater (P < .01) for steers graz-ing soft-red winter wheat forage at a stocking density of 500lb beef/A than for those grazing wheat pastures having astocking density of 750 lb beef/A. This difference in ADGwas probably due to forage availability. Horn et al. (1994)reported that ADG of steers decreases as stocking densityincreases when steers graze hard-red winter wheat forage.
Steers grazing Jaypee gained more (P < .01) weight thanthose steers grazing Hickory during 1997-98 and combinedyears. However, there were no differences in TG due to cul-tivar during 1996-97. No differences in TG were observedfrom added N. Steers grazing wheat pastures having a stock-ing density of 500 lb beef/A had greater (P < .01) TG thanthose steers grazing wheat pastures having a stocking den-sity of 750 lb beef/A.
When TG was adjusted to a 117-day grazing period toput years 1996-97 and 1997-98 on equal basis, steers graz-ing Jaypee had a greater (P < .01) 117-day adjusted gainthan those steers grazing Hickory. Steers grazing wheatpastures at a stocking density of 500 lb beef/A had a greater(P < .01) 117-day adjusted gain than those steers grazingwheat pastures having a stocking density of 750 lb beef/A.
Total gain in this study is greater than that reported byHorn et al. (1994) for hard-red winter wheat. However, stock-

Arkansas Animal Science Department Report 1999
93
ing density in the present study was two to three times (500to 750 lb beef/A compared to 250 lb beef/A for hard-red win-ter wheat) that used by Horn et al. (1994).
Steers that grazed Jaypee produced more (P < .05) G/Aduring 1997-98 and for years combined than those whichgrazed Hickory. No differences occurred in G/A during 1996-97 because of cultivar. Steers grazing wheat pastures at astocking density of 750 lb beef/A produced more (P < .01)G/A than those steers grazing wheat pastures having a stock-ing density of 500 lb beef/A. Horn (1994) observed that G/A increased as stocking density increased when steers grazedhard-red winter wheat forage, but G/A in his study was muchless than that reported in the present study because stockingdensity was much lower (250 lb beef/A) than the 500 and750 lb beef/A used in the present study.
When G/A for 1997-98 was adjusted to a 117-day graz-ing period, steers that grazed Jaypee produced more (P <.01) 117 G/A than those steers that grazed Hickory. Steersgrazing wheat pastures having a stocking density of 750 lbbeef/A produced more (P<.01) 117 G/A than did those graz-ing pastures having a stocking density of 500 lb beef/A.
Feedlot performance and carcass data of steers thatgrazed soft-red winter wheat from October 23 to February17 are given in Table 5. Steers gained 3.65 lb/day over a121-day feeding period on 6.1 lb dry feed at a cost of $2.16/head/day. Seventy three percent of the steers graded Choicewhile 27% graded Select. Dressing percentage averaged62.4%.
In conclusion, soft-red winter wheat, when planted inearly September, produces an ample supply of exceptionalquality forage that will support rapid growth of stocker cattleduring the fall and winter with minimal supplementation.Differences exist in the quality of forage of different culti-vars.
Average daily gains of 2.4 lb for steers grazing soft-redwinter wheat forage are superior to the 2.0 to 2.3 lb ADG ofsteers grazing hard-red winter wheat (Horn, 1994; Horn etal., 1994). Total gain of steers differed as a result of cultivar.Jaypee, a cultivar that prefers mild weather, was superior toHickory during 1997-98, which was an extremely mild falland winter. Total gain also was influenced by stocking den-sity (the lower the stocking density, the greater the total gainper steer). However, G/A was greater at the highest stock-ing density. Both TG and G/A of steers grazing soft-red win-ter wheat were superior to those reported (Horn, 1994; Hornet al., 1994) for steers grazing hard-red winter wheat.
Stocking density may be doubled or tripled for steersgrazing soft-red winter wheat compared to hard-red winterwheat. Steers were stocked at a density of 500 and 750 lbbeef/A in this study compared to 250 lb beef/A used to grazehard-red winter wheat in the southern plains (Horn et al.,1994). Therefore, production of stocker cattle on soft-redwinter wheat forage in the Southern region has excellentpotential. Grazing of cattle can begin in October and beterminated by March 1, producing a steer large enough tobe fed without reducing wheat grain yield (Krenzer, et al.,1994).
Literature Cited
Clarenburg, R. 1992. Physiological chemistry of domesticanimals. Mosly Year Book, Inc., St. Louis, Missouri.
Gribble, R.V. and E. Krenzer. 1994. Proc. of WheatlandStocker Conf., Enid, Oklahoma, pp. B-1.
Horn, G.W. 1994. Proc. of Wheatland Stocker Conf., Enid,Oklahoma, pp. E-1.
Horn, G.W., et al. 1994. Proc. of Wheatland Stocker Conf.,Enid, Oklahoma, pp. D-1.
Klugh, B.F., Jr. and D.S. Abbe. 1995. Ark. Agri. Exp. Sta.Report Series 329.
Littell, R.C., et al. 1996. SAS Inst., Inc., Cary, North Caro-lina.
Neuman, A.L. and K.S. Lusby. 1986. Beef cattle, 8th Ed.John Wiley and Sons, Inc., New York.
SAS. 1988. SAS Inst., Inc., Cary, North Carolina.Taylor, R.E. 1994. Beef production and management deci-
sions, 2nd Ed. McMillian Publishing Co., New York.

AAES Research Series 470
94
Table 1. Percentage of crude protein (CP), in vitro dry matter digestibility (IVDMD), neutral detergentfiber (NDF) and acid detergent fiber (ADF) of soft-red winter wheat.
Month Treatment CP IVDMD NDF ADF
--------------------------------------%---------------------------------------October Hickory 29.8 92.8 43.4 18.4
Jaypee 30.3 92.8 42.8 18.8November Hickory 26.4 94.0 42.8 19.9
Jaypee 24.7 94.2 43.1 22.2
December Hickory 23.8 96.5 43.3 21.2
Jaypee 23.0 94.8 43.3 22.2January Hickory 21.7 93.9 43.2 25.7
Jaypee 20.2 94.0 44.2 27.7
February Hickory 21.3 94.8 52.1 30.2
Jaypee 19.7 95.0 52.6 31.9
October 0 added N 30.2 92.9 43.1 18.7
50 lb added N/A 29.9 92.8 43.1 18.7
November 0 added N 24.8 94.1 43.2 21.5
50 lb added N/A 26.3 93.9 42.7 20.6
December 0 added N 22.7 96.2 44.1 21.5
50 lb added N/A 24.1 96.3 43.4 21.7
January 0 added N 20.1 94.1 44.3 27.7
50 lb added N/A 21.2 93.8 43.0 25.7
February 0 added N 19.6 94.4 52.6 31.9
50 lb added N/A 21.4 94.7 52.0 30.1
October 500 lb beef/A 29.8 92.7 43.3 18.5
750 lb beef/A 30.4 92.8 42.8 18.6
November 500 lb beef/A 25.6 93.7 43.1 20.5
750 lb beef/A 25.5 94.3 42.8 18.6
December 500 lb beef/A 23.8 96.3 43.7 26.3
750 lb beef/A 23.1 96.2 43.7 22.7
January 500 lb beef/A 20.8 93.9 43.7 26.3
750 lb beef/A 20.5 94.1 43.6 25.7
February 500 lb beef/A 21.6 94.7 52.5 31.7
750 lb beef/A 19.5 95.1 52.3 30.1

Arkansas Animal Science Department Report 1999
95
Table 2. Blood serum magnesium (Mg) concentration of steers that grazed soft-red winter wheatforage during fall and winter (mg/dl).
Cultivar Nitrogen Stocking densityYear Month Hickory Jaypee 0-N 50 lb/A 500 lb/A 750 lb/A
1996-97 October 2.5 2.5 2.5 2.5 2.5 2.61997-98 2.1 2.2 2.1 2.2 2.2 2.1
Combined 2.3 2.4 2.3 2.3 2.3 2.41996-97 November 2.5 2.5 2.6 2.5 2.5 2.61997-98 2.4 2.4 2.4 2.5 2.5 2.4
Combined 2.5 2.5 2.5 2.5 2.5 2.51996-97 December 2.4 2.4 2.4 2.4 2.4 2.41997-98 2.1 2.1 2.1 2.2 2.1 2.1
Combined 2.3 2.3 2.3 2.3 2.3 2.31996-97 January 2.4 2.4 2.4 2.4 2.4 2.41997-98 2.0 2.0 2.0 2.0 2.0 2.0
Combined 2.2 2.2 2.2 2.2 2.2 2.2
Table 3. Average daily gain (ADG), total gain (TG), 117-day adjusted total gain (117 TG), gain per acre(G/A) and 117-day adjusted gain per acre (117 G/A) of steers that grazed soft-red winter wheat forage
during the fall and winter of 1996-97 and 1997-98.
Treatment Year ADG TG 117 TG G/A 117 G/A
--------------------------------------lb-----------------------------------Hickory 1 2.35 281.4 281.4 344.5 344.5
2 2.18 213.5 254.9 263.7 314.6C 2.26 247.4 268.1 304.1 329.6
Jaypee 1 2.40 281.0 281.0 345.1 345.12 2.56 251.1 299.9 285.6 370.8C 2.48 266.0 290.4 315.4 358.0
0-N 1 2.46 287.7 287.7 337.5 37.52 2.36 231.7 276.7 284.6 339.8C 2.41 259.7 282.2 311.0 338.6
50 lb N/A 1 2.31 268.8 268.8 351.9 351.92 2.38 232.9 273.1 290.4 345.8C 2.34 250.8 271.0 321.1 348.8
500 lb beef/A 1 2.57 300.9 300.9 300.9 300.92 2.50 245.7 293.2 245.7 293.1C 2.53 273.2 297.0 273.3 297.0
750 lb beef/A 1 2.18 255.6 255.6 384.8 384.82 2.24 219.1 261.6 328.7 329.4C 2.21 237.3 258.6 356.7 388.6

AAES Research Series 470
96
Table 4. Average high and low temperatures and rainfall during October throughFebruary, 1996-97 and 1997-98 (°F).
1996-97 1997-98Month High Low Rainfall (in) High Low Rainfall (in)
October 75 49 2.73 75 50 3.48November 54 37 12.61 57 49 1.99December 54 34 2.74 50 32 3.46January 51 28 1.72 53 35 4.61February 56 36 5.36 57 37 3.38
Table 5. Feedlot performance and carcass data of steers that had grazedsoft-red winter wheat forage.
Item Amount
Days of feed 121Entering weight, lb 746Final weight, lb 1,118ADG, lb 3.65Dry feed/lb gain 6.10Cost/head/day $2.16% Choice 73% Select 27Ribeye area, in2 12.32Yield grade 3.25Dressing percentage 62.4Hot carcass weight, lb 741.0Backfat thickness, in 0.55

Arkansas Animal Science Department Report 1999
97
Evaluation of Pattern of Gain Using Dry-Lot or Wheat-RyegrassPasture Programs in Developing Heifers for Breeding
Paul Beck1 , Stacey Gunter1, Mike Phillips1, and David Kreider2
Story in Brief
Seventy-five heifers were allocated to four treatments to determine the effect of winter diet (limit-fedconcentrate diets vs. grazing winter annuals) and pattern of gain (moderate growth vs slow growth followedby fast growth) on reproductive performance. Treatments included: (MODERATE) limit-fed heifers in dry-lotto gain moderately (1.5 lb/day) from November 24 until breeding; limit-fed heifers in dry-lot to gain slowly(.5 lb/day) from November 11 to February 4 then gain rapidly (approximately 2.0 lb/day) from February 4until breeding to weights similar at breeding to MODERATE (SLOW/FAST); limit-fed heifers to gain .50 lb/day to February 4, then placed on bermudagrass pastures interseeded with wheat and Marshall ryegrass (WRG)until breeding (SLOW/WRG); or full season grazing of interseeded WRG pasture (GRAZED). MODERATEheifers weighed more than other treatments on February 4, but weights were not different by breeding. GRAZEDand SLOW/WRG heifers weighed more at the end of breeding than MODERATE or SLOW/FAST possiblydue to effect of previous diet on grazing performance. MODERATE heifers calved earlier than other treat-ments, which can partly be explained by the higher proportion of heifers puberal than SLOW/FAST and lowerserum urea nitrogen levels than SLOW/WRG and GRAZED heifers early in the breeding season.
Introduction
To optimize production, heifers must be bred at 15months of age to calve as 2-year-olds. Heifers that calve earlyin the calving season tend to calve early in subsequent calv-ing seasons (Short and Bellows, 1971). Clanton et al. (1983)found that age of puberty was not affected by differing ratesof growth by heifers consuming the same diets, as long astheir body weights (BW) were similar at the start of the breed-ing season. In southern Arkansas, the fall and early winterare periods of limited forage availability and BW gains bygrazing heifers will be too low to reach puberty by breedingseason. Cool season annuals such as wheat and annualryegrass are high in quality and can support high performingcattle through the winter if adequate forage allowance ismaintained through low stocking rates. The two solutions tothese problems are 1) decrease stocking rates to increase for-age availability or 2) feed large amounts of supplementalfeed. In an effort to save feed and decrease land area re-quired for heifer-development enterprises, wheat-ryegrasspasture (WRG) and limit feeding in dry-lot were used tocompare the effects of diet and pattern of gain in the devel-opment of heifers for breeding.
Materials and Methods
On November 17, 1998, 75 spring-born Angus andBrangus sired heifers (507 ± 50 lb) were allotted by breedand BW to one of four treatments. Treatments were: 1) 19heifers were limit-fed in dry-lot to gain moderately (1.5 lb/day) from November 24 until breeding (MODERATE), 2)18 heifers were limit-fed in dry-lot to gain slowly (.5 lb/day)from November 11 to February 4 then gain rapidly (approxi-mately 2.0 lb/day) from February 4 until breeding to BWsimilar at breeding to MODERATE (SLOW/FAST), 3) 20heifers were limit-fed to gain .5 lb/day to February 4, thenplaced on bermudagrass pastures interseeded with WRG untilbreeding (SLOW/WRG), or 4) 18 heifers grazed interseededWRG pasture from November 24 until breeding adjustingforage allowance to allow BW gains of approximately 1.5lb/day (GRAZED). Pasture size was altered during the trialto change forage allowance in an attempt to keep BW gainswithin desired range. Supplemental hay (free-choice) andcorn gluten feed (2 lb/animal/day) was fed to GRAZED heif-ers, during a four-week period of limited forage availabilitybetween mid-December and mid-January, low consumptionof hay was observed.
1 Southwest Research & Extension Center, Hope.2 Department of Animal Science, Fayetteville.

AAES Research Series 470
98
Diets for limit-fed heifers are shown in Table 1. Heiferson limit-fed treatments were fed once a day at a level de-signed to meet energy requirements (Net Energy) for thedesired level of performance.
Heifers were weighed and bled at weekly intervals, fromMarch 3 through June 12. Blood was analyzed for progest-erone to determine the onset of puberty (> 1 ng progester-one/ml of serum for two consecutive weeks) and serum ureanitrogen (SUN). Estrus was synchronized following the twoprostaglandin injection procedure (American Breeder Ser-vice A.I. Management Manual, 1986). Two shots of Lutalyse(Pharmacia &Upjohn, Kalamazoo, Michigan) were admin-istered on March 31 and April 11 to synchronized estrus.On April 13, 13 heifers were artificially inseminated afterthey were observed to be in standing estrus. The remainderwere artificially inseminated by timed insemination (76 hoursafter second injection) on April 14. Semen from a Herefordbull was used in the A.I. program, and Angus and Brangusbulls were used as clean-up bulls. On April 21, limit-fed heif-ers were removed from dry-lot and placed on a bermudagrasspasture and heifers grazing WRG were placed on a WRGpasture. Two bulls per group were then turned in for a 56-day breeding season on April 21 (ending June 15); the bullswere rotated between groups at weekly intervals. On May10, when bermudagrass was the predominant grass speciesin both pastures, heifers were combined on a single pasturefor the remaining breeding season, and one bull was removed(leaving three bulls to service heifers).
At calving, date and sire breed of the calf was recordedfor 50 heifers calved out at the SWREC facilities for deter-mination of conception date. If the sire was determined to beHereford actual insemination date was used as the concep-tion date. If the sire was determined to be Angus or Brangusthen conception date was determined by subtracting 283 daysfrom calving date.
Data were analyzed as a completely randomized design.Heifer BW, ADG SUN, and reproductive performance wereanalyzed by analysis of variance, using replicate within treat-ment as the error term. In the presence of a significant treat-ment effect (P < .10), LS means were separated using pre-dicted differences.
Results and Discussion
Performance of the heifers is shown in Table 2. UntilFebruary 4, heifers in MODERATE had higher daily gainthan heifers in other treatments (1.51, .72, .77, and .85 lb/day for treatments 1 to 4, respectively, P < .05). From Feb-ruary 4 to April 8, MODERATE heifers had lower daily gainthan heifers in other treatments (.81, 1.66, 1.78, and 1.70 lb/day; P < .05). On April 8, BW did not differ (673, 661, 670,and 678 lb; P = .46). But by the end of breeding, GRAZEDheifers (723 lb) were heavier (P < .05) than MODERATE(682 lb) and SLOW/FAST (668 lb). At the end of breeding,BCS was higher (P < .05) for GRAZED (6.3) than MODER-ATE (5.8) and SLOW/FAST (5.8); and SLOW/WRG (6.1)tended (P = .16) to have higher BCS than MODERATE or
SLOW/FAST. The difference in BW and BCS indicates thatthe prior diet (wheat vs. dry-lot) of the heifers affected theability of the heifers to grow and gain condition while ongrass during breeding.
From November 24 to February 3, MODERATE heif-ers were fed an average of 13.9 lb of feed daily, compared to10.4 and 10.3 for SLOW/FAST and SLOW/WRG. FromFebruary 4 to April 8, MODERATE heifers were fed an av-erage of 15.4 lb of feed daily and SLOW/FAST heifers werefed 16.9. Overall, the MODERATE heifers were fed an av-erage of 14.6 lb per day and SLOW/FAST were fed 13.4.Over the 135-day feeding period SLOW/FAST heifers werefed 162 lb per head less than MODERATE and SLOW/WRGwere fed 1,217 lb per head less than MODERATE, to reachsimilar weights. The GRAZED heifers performed compara-bly with virtually no supplemental feed.
Reproductive performance of the heifers is shown inTable 3. Numbers of heifers reaching puberty by April 8 didnot differ (P = .79) among treatments. More GRAZED heif-ers (P < .05) were cycling by the end of breeding (June 12)compared to other treatments. Weight and age at puberty werenot significantly affected by treatment. The higher propor-tion of GRAZED heifers cycling at the end of breeding andtheir tendency to have higher BCS and BW after breeding,supports the theory that grazing performance during breed-ing was affected by treatment diet.
Pregnancy was determined by rectal palpation on Octo-ber 21, 1998. MODERATE tended (P = .16) to have higherconception than SLOW/WRG and GRAZED. MODERATEheifers had the earliest average calving date while GRAZEDheifers had the latest, indicating MODERATE heifers bredearlier in the breeding season. The MODERATE and SLOW/FAST treatments had numerically higher percentage of A.I.sired calves then either SLOW/WRG or GRAZED. Figure1 shows the SUN levels in the heifers in February, April be-fore A.I., May before bull turnout, and at the end of the breed-ing season in June. GRAZED heifers had higher (P < .05)SUN levels than MODERATE and SLOW/FAST in Febru-ary, April and May. The SLOW/WRG heifers had higher (P= .06) levels in May and tended (P = .15) to have higherSUN levels in April. Serum urea nitrogen levels increasedin all heifers in June, presumably due to the onset of highquality growth of bermudagrass and other warm seasongrasses. High levels of SUN have been shown to decreaseconception, due to an decreased pH in the uterus causingpoor fetal survivability in early pregnancy (Elrod et al, 1993),which explains the later breeding and fewer A.I. calves withthe SLOW/WRG and GRAZED heifers.
Implications
This trial shows some options available to producers ofreplacement heifers. Without a major effect on reproductiveperformance, heifers can be held back or limit fed to gainslowly for a period of time with considerable saving in feed.This can be done during periods of limited forage availabil-ity (early fall and winter, or periods of drought). During

Arkansas Animal Science Department Report 1999
99
periods of low grain/feed prices, limit feeding shows prom-ise as an inexpensive way to develop heifers either until thespring flush of rapid forage growth occurs or up to breedingas compared to more conventional ‘dry wintering’ type pro-grams. Problems were evident in this trial with breeding heif-ers while grazing high quality forages, causing delayed breed-ing and decreased reproductive efficiency.
Literature Cited
American Breeder Service A.I. Management Manual. 1986.American Breeders Service. DeForest, Wisconsin.Clanton, D.C., et al. 1983. J. Anim. Sci. 56:280.Short R.E. and R. A. Bellows. 1971. J. Anim. Sci. 32:127.Elrod, C.C., et al. 1993. J. Anim. Sci. 71:702.
Table 1. Diets fed to limit-fed treatments.
Item % of DM
IngredientCorn 35.2Corn gluten feed 35.2Bermudagrass hay 26.5Vigortone 46Sa 1.6Limestone 1.2Salt .39Copper sulfate .01
Calculated compositionCrude protein 13.7NEm (Mcal/lb) .76NEg (Mcal/lb) .49
a Mineral premix composition 21.5 to 25.8% calcium, 4% phosphorus, 5 to 6% salt, 1.3% magnesium, 7%potassium, 190 ppm copper 14.7 ppm selenium, and 650 ppm zinc.

AAES Research Series 470
100
Table 2. Performance of heifers as affected by treatment.
TreatmentsMODERATEa SLOW/FAST SLOW/WRG GRAZED P- value
Heifer BW, lb November 24 512 504 503 511 .91 February 4 622b 557c 559c 572c .01 April 8 673 661 670 678 .46 June 12 682c 668c 697bc 723b .06ADG, 11/24 to 2/4 1.51b .72c .77c .85c .09ADG, 2/4 to 4/8 .81c 1.67b 1.78b 1.70b <.01
Body condition score November 24 5.4 5.4 5.4 5.5 .39 February 4 6.3b 5.5c 5.6c 6.0b .01 June 12 5.8c 5.8c 6.1bc 6.3b .10
Feed Intake, lb/heifer/day11/24 to 2/3 13.9 10.4 10.3 -2/4 to 4/8 15.3 16.9 - -11/24 to 4/8 14.6 13.4 5.6 -
a MODERATE limit-fed heifers in dry-lot to gain moderately (1.5 lb/day) from November 24 until breeding. SLOW/FAST limit-fed heifers in dry-lot to gain slowly (.5 lb/day) from November 11 to February 4 then gain rapidly (approximately 2.0 lb/d) from February 4 until breeding to weights similar at breeding to MODERATE. SLOW/WRG limit-fed heifers to gain .50 lb/day to February 4, then placed on bermudagrass pastures
interseeded with wheat and Marshall ryegrass (WRG) till breeding. GRAZED full season grazing of interseeded WRG pasture.b,c LS means within rows with different superscripts differ (P < .05).

Arkansas Animal Science Department Report 1999
101
Table 3. Effect of heifer development treatments on reproductive performance
TreatmentsMODERATEa SLOW/FAST SLOW/WRG GRAZED P - value
Puberty March 3 11.1 11.1 0 5.0 .73 April 8 26.6 38.9 20.0 22.5 .79 June 12 83.9c 77.8c 75.0c 100.0b .04
Age at puberty, days 430 418 425 437 .70Body weight at puberty 690 680 703 707 .48
Pregnancy rate % 87.5 78.5 73.2 68.7 .16 % via A.I. 37.5 28.6 14.3 0.0 .25
Conception date April 23b May 1b May 5c May 8c .03
Calving date February 1 February 8 February 12 February 15 .13
a MODERATE limit-fed heifers in dry-lot to gain moderately (1.5 lb/day) from November 24 until breeding. SLOW/FAST limit-fed heifers in dry-lot to gain slowly (.5 lb/day) from November 11 to February 4 then gain
rapidly (approximately 2.0 lb/d) from February 4 until breeding to weights similar at breeding to MODERATE.SLOW/WRG limit-fed heifers to gain .50 lb/day to February 4, then placed on bermudagrass pasturesinterseeded with wheat and Marshall ryegrass (WRG) till breeding.
GRAZED full season grazing of interseeded WRG pasture.bc LS means in rows with differing superscripts differ (P < .05)
Fig. 1. Effect of heifer development treatments on serum urea nitrogen levels (mg/dL).MODERATE limit-fed heifers in dry-lot to gain moderately (1.5 lb/day) from November 24 until breeding.SLOW/FAST limit-fed heifers in dry-lot to gain slowly (.5 lb/day) from November 11 to February 4 then gainrapidly (approximately 2.0 lb/day) from February 4 until breeding to weights similar at breeding to MODERATE.SLOW/WRG limit-fed heifers to gain .50 lb/day to February 4, then placed on bermudagrass pastures interseededwith wheat and Marshall ryegrass (WRG) till breeding.GRAZED full season grazing of interseeded WRG pasture.

AAES Research Series 470
102
Diet and Pattern of Gain of Weaned Calves Affects SubsequentPerformance on Grass1
Paul Beck, Stacey Gunter, Kim Cassida, and Mike Phillips2
Story in Brief
During a 102-day period, 154 beef calves (initial weight 400 lb) were fed in dry-lot before wintergrazing of fescue or interseeded winter annuals. Treatments included: 1) bermudagrass hay (ad libitum)plus 20% CP supplement for ADG of 1.25 lb (HAY); 2) limit feeding in dry-lot for ADG of .5 lb (LOW);3) limit feeding in dry lot for ADG of 1.25 lb (MODERATE); 4) limit feeding in dry-lot for ADG of 2.0 lb(HIGH). On January 5, the calves were reallocated to either a fescue supplementation trial or placed onwinter annuals until the onset of a stocking rate/grazing system trial on February 16. Gains (lb/day)during the dry-lot period were 1.17, .59, 1.14, and 1.60 for HAY, LOW, MODERATE, and HIGH treat-ments respectively. The HIGH group had the lowest cost of gain/cwt while on dry-lot. Gains during thegrazing period were 1.53, 1.85, 1.61, and 1.43 lb/d. Pasture ADG was the highest for the LOW treatment,which compensated for 56% of the weight difference from HIGH treatment calves by the end of thegrazing period. Calves in the HAY group gained weight similarly to MODERATE calves on dry-lot, buthad reduced pasture performance early in the grazing season, indicating a possible dietary effect on pas-ture performance. The overall best calculated economic performance was with the HIGH treatment with agross margin ($/animal) of 114.91 compared to 69.46, 95.57, and 106.41 for HAY, LOW and MODER-ATE, respectively.
Introduction
In the southeastern United States, millions of calves eachyear are weaned in the fall; a period of limited availability ofquality forage and low demand for calves. If sold at weaningin the fall, calves from spring calving cowherds generallybring seasonally lower prices because of a large supply andlow demand. Options for these fall weaned calves includeselling in a down market, retaining ownership on dormantforages or hay, or feeding calves a growing diet until qualityforages become available or prices improve. If the calvesare sold at weaning, it has been estimated that an averageprofit of $23 per calf can be expected only 9 out of 17 years(Ritchie, 1998). Profitability can be improved by keepingthe calf crop through the winter in dry-lot and using highquality forages through the spring and early summer. Limitfeeding calves high concentrate diets is an economic alter-native to feeding hay. Questions arise as to the effect feedingthese diets may have on performance on grass because offactors such as fat deposition, or adverse ruminal effects.
McLean et al. (1990) determined that calves grown ondormant tallgrass prairie or limit-fed high concentrate dietsto gain from one to two pounds per day during the winterhad subsequently decreased pasture ADG of .33 to .49 lb foreach lb increase in ADG during the winter. The purpose of
the present experiment is to evaluate grazing performanceafter limit feeding calves at three rates of gain during thefall/winter growing period; as compared to feeding freechoice hay and a concentrate supplement.
Materials and Methods
Two weeks after weaning, 154 weaned beef calves fromthe University of Arkansas – Southwest Research and Ex-tension Center cow herd were divided into four treatmentswith two pens per treatment. Treatments included: 1)bermudagrass hay (ad libitum) plus 20% CP supplement forADG of 1.25 lb (HAY); 2) limit feeding in dry-lot for ADGof .5 lb (LOW); 3) limit feeding in dry-lot for ADG of 1.25lb (MODERATE); 4) limit feeding in dry lot for ADG of 2.0lb (HIGH). Post-weaning treatments started on September25, 1998; the calves were weighed full and separated intorespective treatments. The HAY calves were left on dry-lot.The limit-fed calves were placed on 2-acre mixed fescue/bermudagrass pastures and fed step-up rations until the de-sired feed level was attained. Pasture area was then decreasedto remove available forage. In this way pasture was used asroughage in the step-up rations. The original limit-fed dietwas intended to contain (DM basis): 39% corn gluten feed,39.3% corn, 10% rice hulls, 10% cottonseed hulls, 1.4%
2All authors are associated with Southwest Research and Extension Center, Hope.
1 We appreciate the support of this project through product donations from Farmland Industries, Inc. (Kansas City, Missouri).

Arkansas Animal Science Department Report 1999
103
Farmland R-1500 premix, and .3% urea. Intake problemswere encountered during the step-up phase, with calves sort-ing feed ingredients and leaving rice hulls. Rice hulls wereremoved from the final diet. Composition of the final limit-fed diet and supplement fed to HAY treatment is shown inTable 1. The hay used in this trial was analyzed to contain10% crude protein, .56 Mcal/lb NEm, and .30 Mcal NEg.The corn used in this trial contained 40 ppm aflatoxin, whichwas below the FDA safe feeding level (300 ppm) for grow-ing cattle.
The calves were weighed on November 3, after a 16-hour shrink. The calves were removed from the limit feed-ing trial on January 4, and weighed on January 5, 1999 fol-lowing a 16-hour shrink. Forty steers and 40 heifers wereplaced on stockpiled K-31 tall fescue, for a supplementationtrial. The calves were allocated by previous treatment andgender. The remaining cattle were placed on interseededwheat/ryegrass until February 15 and stocked at 2.5 calves/acre. On February 15, 72 of the cattle were placed onbermudagrass pastures interseeded with wheat and ryegrassand used on a stocking rate/grazing system study. Thesecalves were also allocated to new treatments balanced forprevious treatment and gender. Intermediate weights in thestocking rate/grazing system study were not shrunk weights.These weights were pencil shrunk four percent for use inthis analysis.
Statistical analysis of cattle performance during the fall/winter dry-lot period was conducted by ANOVA. Least-square means were separated by predicted differences usingpen(treatment) as the error term. Performance of the calvesduring the grazing period was analyzed by ANOVA. Effectsof fall/winter dry-lot treatment on grazing performance, graz-ing treatment, and the dry-lot by grazing treatment interac-tion were analyzed using animal (pen) as the error term.When the interaction was not significant, it was removedfrom the model. In the presence of a significant treatmenteffect (P < .10), LS means were separated using predicteddifferences. Regression equations among limit-fed dry-lotperformance and subsequent pasture performance were de-veloped for both ADG and total gain on pasture.
Results and Discussion
Cattle BW, feed intake, cost of gain, and performance dur-ing the dry-lot phase are shown in Table 2. The initial BWwere pencil shrunk 4% for comparison purposes. Cost ofgain shown in Table 2 includes feed used during the step-upperiod, because those are costs associated with the differingsystems used. Assumptions used in analysis of cost of gainsare $85/ton hay cost, and $1.76/bushel corn cost and a $.30/animal daily charge for labor, facilities and other overhead.We used reported market cost on all other ingredients at timeof the onset of the trial plus delivery and $10/ton millingcharge. Limit-fed diets cost $90/ton and the 20% CP supple-ment cost $146.50/ton. All other costs (calf processing, vac-cinations, etc.) were the same between treatments so werenot included in cost analysis.
On November 3, after the initial step-up period, HAYcalves weighed more than (P < .05) calves in LOW, MOD-ERATE, or HIGH treatments. At the end of the dry-lot feed-ing period, HIGH calves weighed more (P < .05) than MOD-ERATE, and HAY which were heavier (P < .05) than LOW.Average daily gain for the HIGH treatment was, as planned,higher than other treatments either over the entire dry-lotperiod or after the step-up period. Gains of the HIGH cattlewere lower than planned during the step-up period due tolower than expected intake of the diet containing rice hulls.After corrections were made to the diet, consumption of thediet was adequate to meet the programmed gain, but overallgains were lower than originally planned. The HAY andMODERATE treatment had similar (P = .78) ADG over theentire dry-lot period. Feed efficiency (feed:gain) for the en-tire feeding period was best for the HIGH treatment and waspoorest (P < .05) with LOW or HAY treatments. At the costof feed ingredients for this trial, dry-lot cost of gain was higher(P < .05) for the HAY group than for the limit-fed groups,and gain for the HIGH group cost less (P < .05) than for theLOW group. Total cost per animal for the dry-lot periodwas lowest (P < .05) for the LOW group followed by MOD-ERATE, HIGH, and HAY groups, respectively.
Performance during the subsequent grazing period isshown in Table 3. There were no pasture treatment x dry-lottreatment interactions (P > .30) so grazing performance isshown across pasture treatments. During the first grazingperiod, calves from the LOW treatment gained more (P <.05) than those from the MODERATE group which gainedmore (P < .05) than calves from the HIGH or HAY treat-ments. Weight gains during grazing periods two and threewere not statistically different. During period four, calves inthe HIGH treatment gained less (P < .05) than calves in theother treatments. Overall pasture ADG was lowest (P < .05)for calves in the HIGH group compared to HAY, MODER-ATE and LOW groups. Body weight after the first period onpasture tended (P = .14) to be affected by dry-lot treatment.Calves in the HIGH group tended to be heavier than those inthe LOW, HAY and MODERATE groups. Weights for theHAY, LOW, and MODERATE treatments were not statisti-cally different (P > .11), after the first grazing period. InMarch, BW of the HIGH treatment tended (P < .15) to behigher than HAY, LOW, or MODERATE. There was no dif-ference in BW during April or May.
The compensatory gain during the first grazing periodby calves in the LOW group was to be expected. With a56% compensation of BW difference, the LOW treatmentwas not able to fully compensate on pasture for the reduc-tion in BW gains during the dry-lot period. In a compilationof several Nebraska studies, Klopfenstein et al. (1999) re-ported a range of compensation in grazing calves from 18.7to 88% after calves were fed to differing rates of gain throughthe winter. Conclusions were that compensatory gain on grassis variable and hard to predict, but is usually around 50 to60% with full season grazing. Differences in pasture gainby the calves in MODERATE and HAY treatments may helpexplain the variability found in research. In the first grazing

AAES Research Series 470
104
period, MODERATE calves gained .55 lb/day more (P < .05)than HAY. The difference in pasture gain cannot be explainedby compensatory effect because the BW of the groups werenot different (P = .40) at the onset of grazing. NRC (1996)simulation estimated rumen pH to be 6.02 with the limit-feddiets, compared to 6.46 with the HAY diet. Feeding dietscontaining readily degradable carbohydrates may sustainsimilar ruminal microbial populations to what are requiredfor degrading high quality forages used in the grazing pro-gram. These microbe populations may have been reducedwhile feeding the HAY diet and maintained by the limit-feddiet. These differences may indicate possible diet effectsconfounding rate of pre-grazing gain.
Regression analysis based on individual animal perfor-mance of the limit-fed treatments indicate the relationshipbetween ADG before grazing (X) and subsequent pastureADG (Y). This relationship was described by Y = 1.92 -.22X (P < .01; r2 = .13), indicating that for every pound ADGis increased in the dry-lot period pasture ADG is reduced by.22 lb/day. A similar relationship was developed betweentotal dry-lot gain (X) and total pasture gain (Y). This rela-tionship was described by Y = 253 - .46X (P < .01; r2 = .19),indicating that for every pound of additional gain in winterdry-lot period pasture gain is depressed by .46 lb. The r2 forthe equations are quite low indicating a large degree of varia-tion and are similar to regression equations reported byMcLean (1990).
Pasture cost of gain (Table 3) was determined using a$.525/animal fixed daily charge for pasture cost and over-head, which was divided by the overall pasture ADG andmultiplied by 100 to get cost per cwt gain. Because of thehigher rate of pasture gain, pasture cost of gain for the LOWtreatment was lower (P < .05) than for HAY, MODERATE,or HIGH treatments. The overall cost of gain (total cost/ani-mal divided by total gain/animal multiplied by 100) washigher (P < .05) for the HAY treatment than for LOW, MOD-ERATE, or HIGH treatments. Gross return to each treatmentwas calculated by subtracting the overall cost of gain from a$79/cwt value of gain then multiplying by the total amountof gain. The value of gain was based on the 10-year averageprice at Oklahoma City National Stockyards of 400 lb steerin September ($85.86/cwt) and 665 lb feeder steer in April($83.12/cwt) (Peel, 1995). The highest gross return ($/head)was with the HIGH treatment at $114.91, even though pas-ture performance was the lowest. The overall BW gains andbetter feed efficiency during the dry-lot period with the HIGHtreatment was able to spread out costs compared to the othertreatments. The lowest gross return was with the HAY treat-ment at $69.46 is a reflection of the high hay cost before theonset of the trial and the slight reduction in overall pastureperformance, compared to MODERATE.
Implications
This research shows that calves limit-fed high-concen-trate diets in dry-lot during the fall and winter, may haveadvantages in gain and economic performance during sub-
sequent grazing periods over calves fed diets consisting ofhay and supplement. The best overall economic performancewas found with the dry-lot treatment with the highest rate ofgain, indicating the importance of spreading costs over morepounds of gain, and the importance of gain over the entireownership period, rather than only during grazing. For eachpound increase in dry-lot ADG pasture performance is re-duced by .22 lb/day but gross margin is increased.
Literature Cited
Klopfenstein, T., et al. 1999. Nebraska Beef Cattle Report.MP 71-A:26.
Ritchie, H. 1998. Feedstuffs. 70(42):1.Peel, D.S. 1995. OSU Current Report CR-544.McLean, G.S., et al. 1990. Oklahoma Agric. Exp. Sta. Res.
Rep. MP-129:240.NRC. 1996. Nutrient Requirements of Beef Cattle (7th Ed.).
National Academy Press, Washington, DC.

Arkansas Animal Science Department Report 1999
105
Table 1. Composition of limit-fed diet and supplement used during dry-lot period.
Ingredient %, DM basis
Limit fed dietCorn 44.3Corn gluten feed 44.3Cottonseed hulls 10.0Farmland R-1500 1.4Urea .3
Calculated composition% Crude protein 15.8NEm Mcal/lb .92NEg Mcal/lb .53
SupplementCorn gluten feed 89.1Farmland R-1500 9.8Salt 1.1
Calculated composition% Crude protein 21.6NEm Mcal/lb .83NEg Mcal/lb .48
Table 2. Effect of fall/winter growing diets on BW, ADG, cost of gain.
Limit-fedItem HAY LOW MODERATE HIGH P-value
Body weight (lb) 9/25/98 403 398 394 401 .51 1/5/99 518b 454c 507b 561a .01ADG 1.17b .59c 1.14b 1.60a .01Feed:gain 14.2ab 19.1a 8.91bc 7.45c .02Cost of gain, $/cwt $96.99b $145.11a $74.17bc $55.48c .01Cost, $/animal $103.45a $63.11d $71.84c $82.34b <.01
a-d LS means within a row with different superscripts differ (P < .05).

AAES Research Series 470
106
Table 3. Effect of winter growing treatment on subsequent performance on pasture.
Limit-fedHAY LOW MODERATE HIGH P-value
Body weight, lb January 518c 454d 507c 561b .01 February 533 516 540 581 .14 March 597 581 596 637 .15 April 664 643 661 695 .19 May 706 685 699 732 .24
Pasture ADG Period 1 - 1/5 to 2/16 .36d 1.49b .91c .60d .01 Period 2 - 2/16 to 3/10 2.70 2.66 2.35 2.35 .63 Period 3 - 3/10 to 4/12 2.10 1.98 2.05 1.83 .49 Period 4 - 4/12 to 5/10 1.50b 1.53b 1.43b 1.33c .07 Overall pasture ADG 1.53c 1.85b 1.61c 1.43d <.01Pasture cost of gain, $/cwt 37.88b 29.88c 35.76b 40.66b .07Overall cost of gain, $/cwt 58.74b 47.54c 46.42c 45.83c .07
Gross margin, $/heada 69.46c 95.57bc 106.41b 114.91b .08
a Calculated by subtracting cost of gain from a $79/cwt value of gain then multiplying amount of gain. Value ofgain was determined using the 10-year average price at Oklahoma City National Stockyards of 400 lb steer inSeptember ($85.86/cwt) and 665 lb feeder steer in April ($83.12/cwt).
b-d LS means in rows with differing superscripts differ (P < .05).

Arkansas Animal Science Department Report 1999
107
Limit-Fed, High-Concentrate Diets for Maintaining Beef Cows DuringDrought Periods in the Southeast United States1
Stacey Gunter, Paul Beck, Jeff Weyers, and Kim Cassida2
Story in Brief
One-hundred sixty spring-calving cows, after their calves were weaned, were stratified by age, bodycondition score, and BW, then sorted equally into 10 drought-stricken bermudagrass pastures (16 cows/pasture). Eight pastures of cows were fed four different high-concentrate diets formulated with corn or corngluten feed and 20% roughage (two sources) for approximately 100 days and compared with two pasturesof cows fed hay plus a supplement. Limit feeding of high concentrate diets decreased BW, but this decreasewas probably the result of decreased fill because they did maintain body condition score compared to hayfed cattle. No negative symptoms were observed regarding calving or digestive function. Limit feeding ofhigh concentrate diets to gestating cows during periods of drought seems to be a viable alternative to feed-ing hay when it is in short supply. Also, when grain prices are favorable, gestating cows can be maintainedon the high-concentrate diets more cheaply than with hay plus supplements.
2All authors are associated with the Southwest Research and Extension Center, Hope.
Introduction
Reducing the hay requirements for wintering beef cow-herds was a hot topic in the fall of 1998 because of a pro-longed, record setting drought in southern Arkansas. Manyfarmers were purchasing hay from the north and trucking itinto the area. Because hay has a low bulk density and di-gestible energy concentration, purchased hay can be an ex-pensive alternative relative to grains and by-product feeds.Research from Ohio (Loerch, 1996) has shown that beef cowscan be maintained on limit-fed diets containing 17% orchardgrass hay, 65% whole-shelled corn, and 17% of a high pro-tein/mineral supplement. The Ohio research showed that thelimit feeding of a high-concentrate diet resulted in a 49%reduction in feed cost compared to the feeding of $80.00 perton hay plus a $150.00 per ton supplement. The purpose ofthe present study was to evaluate limit-fed diets for bred beefcows formulated from corn or corn gluten feed with two dif-ferent roughage sources in order to replace the need for haywhen wintering beef cows.
Materials and Methods
After their calves were weaned, 160 sixty spring-calvingcows (approximate BW = 1,100 lb) were stratified by age,body condition score (BCS), and BW, then sorted equallyinto 10 drought-stricken bermudagrass pastures (16 cows/pasture). Forage height in the pasture average less than 2 in.Cows were fed (two pastures/diet) high-concentrate diets for-
mulated with corn or corn gluten feed and 20% roughage(two sources) for approximately 100 days (Table 1). Corngluten feed was selected because of its high energy (80 Mcalof NEm/cwt) and protein concentrations (24% CP), but rela-tively inexpensive cost ($74.00/ton). The two roughagesources examined were cottonseed hulls and reground ricehulls (16/80 screen). Diets were mixed daily in a mixer wagon(Knight Manufacturing; Brodhead, Wisconsin) and limit fedat the amount suggested in Table 2. Two pastures of cowswere fed long-stem bermudagrass hay plus a corn gluten feedsupplement as a control (Table 1). Diets were formulated tomeet or exceed NRC requirements (NRC, 1996).
Cows were weighed and BCS determined at 28-day in-tervals starting on Setember 11, 1998. Cows were adapted tothe diets by starting them on a 40% roughage diet then step-ping up the diet by 10 percentage units of concentrate on aweekly basis until only 20% roughage remained in the diets.On a daily basis cows were observed for signs of bloating,acidosis, or diarrhea that might have occurred with diets highin sulfur and(or) starch approximately 4 hours after feeding.
Beginning on December 7, 1998, at the end of thelimit-feeding period, cows were fed bermudagrass hay plussupplement until December 11,1998. Cows were thenweighed in the morning to minimize shrink to determine fillrecovered since limit feeding ended. Beginning on Decem-ber 11, 1998, cows were fed bermudagrass hay and limitgrazed on rye/wheat/ryegrass pasture until May 1. After May1, 1999, pairs were grazed on bermudagrass pasture. Cowsbegan calving on February 15, 1999; technicians recorded
1This project was partially supported by a gift from Farmland Industries, Inc. (Kansas City, Missouri).

AAES Research Series 470
108
calving dates, calving ease scores, calf BW, and calf gender.The experiment was analyzed as a completely randomizeddesign with the effects of treatment and the covariates (cowage and calving date) in the model. Least-square means wereseparated using contrasts.
Results and Discussion
At the beginning of the experiment (September 11), BWdid not differ (P > .10) among treatments; cows had an aver-age BW of 1,126 lb (Table 2). By October 13, the BW oflimit-fed cows was less (P < .08) than for cows fed hay plussupplement. This decrease in BW of the limit-fed cows prob-ably resulted from a reduction in gastrointestinal fill. Cowsfed diets containing cottonseed hulls weighed more (P < .05)than cows fed rice hulls. On December 7, hay fed cowsweighed more (P < .08) than limit-fed cows, furthermore,cows fed corn weighed less (P < .05) than cows fed corngluten feed and cows fed cottonseed hulls weighed more (P< .05) than cows fed rice hulls. Corn contains less fiber thancorn gluten feed, again, differences in BW probably resultfrom differences in fill. Between December 7 and Decem-ber 11, all cows were fed the long-stemmed grass hay plussupplement. Cows that had previously been limit fed ricehulls were still lighter (P < .05) than cows that were main-tained on cottonseed hulls. But, the BW of limit fed cowsdid not differ (P > .10) from cows fed hay plus supplement.During the last four days, limit-fed cows gained about 45 lbor 5% of their BW. The increase in BW noted with limit-fedcows would have been the result of increased fill. The 13 lbloss in BW by cows fed hay plus supplement did not differ(P > .15) from zero and is probably the result of randomerror.
Cow BCS was not affected by dietary treatment; it wasnoted that there was a general increase from September 11to December 7. We did feed the cows to meet their NEmrequirements, but they gained approximately .5 of a BCSduring the feeding period. Some of the increase noted inBCS is probably the result of the thinner cows putting onover a full BCS each and the extremely mild weather theyexperienced in the fall of 1998. We saw no bloating or signsof acidosis. Furthermore, there were no cows with diarrheathat might have occurred with diets high in starch like withcorn or high in sulfur like corn gluten feed.
Cows fed hay plus supplement consumed about 20 lbmore feed DM daily than cows limit fed. Furthermore, be-cause of the higher energy concentration in corn and ricehulls than corn gluten feed and cottonseed hulls, respectively,cows fed corn and rice hulls required (P < .05) less feed tomaintain BW and BCS. The cows fed hay and supplementcost approximately $.99 to feed daily ($70.00/ton of hay;$74.00/ton of corn gluten feed), but because only one thirdthe feed was required with the high concentrate diets, thesecows only cost approximately $.49 to feed daily averagedacross all treatments.
There were no differences detected among treatmentsin calving date (P = .57), BCS at calving (average = 6.1; P =
.80), calf BW at birth (average = 78 lb; P = .97), or calvingease (average = 1; 1 = unassisted birth, 5 = hard pull).
Implications
Limit feeding of high concentrate diets to gestating cowsduring periods of drought seems to be a feasible alternativeto feeding hay when it is unavailable. Also, when grain pricesare favorable, gestating cows can be maintained on thehigh-concentrate diets more cheaply than with hay plussupplements.
Literature Cited
Loerch, S. C. 1996. J. Anim. Sci. 74:1211-1216.NRC. 1996. Nutrient Requirement of Beef Cattle (7th Ed.).
National Academy Press. Washington, DC.

Arkansas Animal Science Department Report 1999
109
Table 1. Diets for mature beef cows offered limit-fed high-concentrate diets.
Treatmentsa
Item Supplement Corn/CSH Corn/RH CGF/CSH CGF/RH
Diet ingredients, % as fedCorn, cracked —- 71.4 71.5 —- —-Corn gluten feed 90.3 —- —- 79.3 79.4Cottonseed hulls —- 19.4 —- 19.3 —-Rice hulls, ground —- —- 19.3 —- 19.2Cottonseed meal —- 6.9 6.9 —- —-Urea —- .9 .9 —- —-Salt 1.0 —- —- —- —-Farmland R-1,500b 8.7 1.4 1.4 1.4 1.4
Diet compositionc, % of DMDry matter 88.7 96.3 96.6 96.1 94.5Crude protein 25.1 16.6 14.4 22.8 21.2Neutral detergent fiber 37.9 29.4 34.8 49.4 51.7Acid detergent fiber 9.4 15.3 22.2 21.7 26.0Calcium 2.84 .53 .54 .39 .46Phosphorus .91 .44 .39 .78 .75Ash 16.8 4.6 8.7 6.0 10.4NEm, Mcal/100 lbd 78 80 91 67 78
a Supplement = hay + supplement, Corn/CSH = corn + cottonseed hulls, Corn/RH = corn + rice hulls, CGF/CSH= corn gluten feed + cottonseed hulls, and CGF/RH = corn gluten feed + rice hulls.
b Composition: Ca, 26%; P, 1%; NaCl, 7.5%; K, 5%, Vitamin A, 80,000 IU/lb, and 1,500 mg of monensin/lb.c Analyzed.d Calculated.

AAES Research Series 470
110
Table 2. Effect of limit-fed high concentrate diets on BW and BCS fed to mature beef cows.
Treatmenta
Item Hay Corn/CSH Corn/RH CGF/CSH CGF/RH SE
BW, lb9/11/98 1,120 1,111 1,134 1,173 1,082 28.910/13/98ce 1,191 1,101 1,097 1,154 1,057 26.711/9/98c 1,181 1,102 1,097 1,186 1,085 36.412/7/98cde 1,213 1,101 1,074 1,208 1,098 34.512/11/98e 1,187 1,149 1,131 1,247 1,130 33.7
Fill gained last 4 dayPoundsc -13 41 51 40 41 16.2Percentage of BWc -1.2 4.3 5.7 4.1 4.6 1.9
BCS, 1 to 99/11/98 5.6 5.6 5.8 5.7 5.4 .1410/13/98 5.6 5.7 5.5 5.7 5.3 .2511/9/98 6.1 6.0 6.2 6.2 5.8 .1712/7/98 6.2 6.1 6.1 6.4 6.1 .12
Feed DM intakeb, lb/d as-fed
9/11 to 10/12cde 19.4 9.9 9.2 11.1 10.5 .0210/13 to 11/8cde 27.3 11.4 10.3 13.8 12.0 .5011/9 to 12/6cde 31.3 12.6 10.8 15.0 12.9 .41
aHay = hay + supplement, Corn/CSH = corn + cottonseed hulls, Corn/RH = corn + rice hulls, CGF/CSH = corngluten feed + cottonseed hulls, and CGF/RH = corn gluten feed + rice hulls.bHay treatment DM intake = hay DM + supplemental DM, Corn/CSH, Corn/RH, CGF/CSH, and CGF/RH treat-ments equals total DM of the mixed diets actually fed.cContrast = hay vs limit-fed diets (P < .08).dContrast = corn vs corn gluten feed (P < .05).eContrast = cottonseed hulls vs rice hulls (P < .05).

Arkansas Animal Science Department Report 1999
111
Performance of Growing Calves Supplementedwith Bioplex® Copper Pre- or Post-Shipping to a Feedlot1
Stacey Gunter2, Paul Beck2, Beth Kegley3, Kathryn Malcom-Callis4,and Glenn Duff4
Story in Brief
A growing, transporting, and feedlot receiving trial was conducted to determine the benefits of Bioplex®
copper supplementation on the performance and health of cattle grazing winter annual pasture before andafter shipping to a high-plains feedlot. Cattle were supplemented with 1.5 g of Bioplex copper (10% copper)30 days before shipping while grazing wheat/rye/ryegrass pasture in South Arkansas. Then after arriving atthe feedlot, one-half of the control (no copper) and and one-half the supplemented cattle received 1.5 g ofBioplex copper daily (2 x 2 factorial) for a 42-day receiving period. It seems that supplementation of copperdeficient diets with Bioplex copper before shipping to a feedlot increased BW gain, and the BW advantagewas maintained through the receiving period at the feedlot. No benefit relative to performance was recordedwhen Bioplex copper was fed at the feedlot. There were no signs of clinical disease at the feedlot; thus, noconclusions could be drawn considering the immune response or disease resistance of the cattle used in thistrial.
Introduction
Copper is an essential trace mineral for cattle grazingon Coastal Plains soils in the southern United States. Thesesoil include millions of acres, following the coastline fromVirginia to Texas (Brady, 1974). With stocker cattle under-going stress, copper requirements range from 10 to 15 ppmdepending on animal factors (NRC, 1996) and content ofinterfering substances such as molybdenum or iron(Gengelbach et al., 1997). Deficiency of copper results indecreased growth rate, anemia, and changes in hair color(McDonald et al., 1988). Copper also affects immune func-tion in cattle (Gengelbach and Spears, 1998).
Winter annual grasses grown on Coastal Plain soils areshallowly rooted because of frequent rainfalls. The topsoilsassociated with these soil types are noted for their low or-ganic matter, base saturation, and poor cation-exchange ca-pacity (CEC). Hydrogen ions are released from plant roothairs as they grow, these hydrogen ions force cations, likecopper, to be released into soil water and then assimilatedwith the absorptive surfaces of the roots. However, whensoils have a low CEC and base saturation, cations are not aseasily released from the soil’s exchange complex resultingin plant tissue low in the minerals in question (Brady, 1974).Thus, this study was designed to determine the effect ofsupplementation with Alltech Bioplex® copper, a source ofcopper in the proteinate form, on calves backgrounded on
winter annual pasture, either before shipment to a feedlot orafter arrival.
Materials and Methods
Eighty-four Angus- and Brangus-sired steers were usedto determine the effects of feeding Bioplex copper (Alltech,Inc.) before shipping or during the feedlot receiving period.Steers were weaned from the Southwest Research and Ex-tension Center cow herd in October of 1997. At weaning,the calves were processed, including treatment for internaland external parasites (Ivomec®, Merck & Co., Inc.,Whitehouse Station, New Jersey), vaccinated with a 7-wayClostridial antigen (Vision 7®, Bayer Corp., Shawnee, Kan-sas) and IBR-PI
3-BVD-BRSV (Bovishield 4®, SmithKline
Beecham Animal Health, Exton, Pennsylvania). Calves werethen fed hay and 2 lb/animal/day of a high-protein supple-ment (30% CP). On February 19, 1998, the calves wereweighed after a 16-hour shrink (cattle were held in a corralwith no feed or water), implanted with Component-S® (IvyLaboratories, Inc., Overland Park, Kansas) separated by treat-ment, and placed on 12 two-acre bermudagrass pasturesinterseeded with wheat, rye, and ryegrass. From February19 to April 16, the cattle were fed 2 lb/animal/day of corn,containing a commercial mineral premix (Vigortone 46S, PMAg Products, Inc., Cedar Rapid, Iowa), three times per week.On April 16, the cattle were weighed after a 16-hour shrink
1 This project was supported by a gift from Alltech, Inc. (Lexington, Kentucky). We also appreciate the additional support through productdonations provided by Ivy Laboratories, Inc. (Overland Park, Kansas) and Elanco Animal Health (Indianapolis, Indiana).
2 Southwest Research and Extension Center, Hope.3 Department of Animal Science, Fayetteville.4 Clayton Livestock Research Center, New Mexico State University, Clayton.

AAES Research Series 470
112
and copper supplementation began.Composition of supplements is shown in Table 1. Corn
supplements fed three times per week (pro-rated to equal 2lb/animal/day on a as-fed basis) contained a commercialmineral mix (Vigortone 46S), supplied 200 mg of monensin(Rumensin®; Elanco Animal Health) and either had no ad-ditional copper or .165% Bioplex copper (Alltech, Inc.; 10%copper). Nineteen ppm supplemental copper (copper sul-fate) was supplied by the mineral premix to the control calvesfor a total of 21 ppm copper, and 165 ppm additional wasfed to Bioplex copper calves for a total of 186 ppm copper.On May 15, the calves were weighed after a 16-hour shrink,shipped to a local receiving yard (F & F Cattle Company,Hope), co-mingled with calves purchased from a local auc-tion, and held on hay and water until May 17. The steerswere then shipped from southwest Arkansas to the ClaytonLivestock Research Center in Clayton, New Mexico (630miles, 14-hour transit). Steers arrived at 0730 and were pro-cessed, including: branding, treatment for internal and ex-ternal parasites (Ivomec Pour-On; Merial Animal Health,Iselin, New Jersey), vaccinated with a 7-way clostridial an-tigen (Fortress 7®; Ft Dodge Animal Health, Overland Park,Kansas), and IBR-PI3-BVD-BRSV (Bovishield 4), implantedwith Ralgro® (Schering-Plough Animal Health Corp., Union,New Jersey), rectal temperature was determined, and steerswere sorted into treatment pens. Treatment pen assignmentswere the same as pasture assignments with half of eachpre-shipping treatment groups receiving Bioplex copper. Allcattle were fed a 70% concentrate diet (Table 2) throughoutthe 42-day receiving period and observed daily for bovinerespiratory disease. After the initial weight at the feedlot,weights were taken unshrunk on d 14, 28, and 42 of thefeedlot-receiving period before the morning feeding.
Treatments were applied as a completely randomizeddesign using a 2 x 2 factorial arrangement of treatments.Factors included receiving the Bioplex copper during thegrazing period and receiving the Bioplex copper during thefeedlot-receiving period. Pen was considered the experi-mental unit for all calculations. Least-square means and pre-dicted differences were used to separate the effect of coppertreatments. Cattle weights were heavier for Bioplex coppercalves on April 16, so BW was used as a co-variate in allsubsequent statistical analysis.
Results and Discussion
The effects of pre-shipping supplementation withBioplex copper on pasture on BW variables, ADG, and feedDMI and efficiency did not interact (P > .10) with Bioplexcopper supplementation at the feedlot. Beginning BW ofthe grazing calves on April 12 was 630 lb (Table 3). Calvesreceiving Bioplex copper on pasture tended to be 1.2%heavier (688 vs. 680, respectively; P < .11) by the end of thegrazing period and had a 17.6% higher ADG (2.0 vs 1.7,respectively; P < .11) compared to control calves. At theend of the feedlot receiving period, calves fed Bioplex cop-per on pasture were 14 lb heavier than control calves (926
vs. 912, respectively, P < .05), but ADG was only numeri-cally higher (5.7 vs 5.6, respectively, P = .34). Feedlot feedefficiency and DMI was not affected by Bioplex coppersupplementation on pasture (Table 3).
Average daily gain of calves that were supplementedwith Bioplex copper while grazing was not affected byBioplex copper supplementation during the feedlot-receivingphase (Table 3), initial feedlot BW averaged 678 lb forBioplex copper calves and 686 lb for control calves (P =.22). Body weight and ADG at the end of the feedlot receiv-ing phase was not affected by feedlot Bioplex copper supple-mentation compared to control calves (914 vs 923 lb, P =.15; and 5.6 vs 5.7 lb, respectively, P = .76). Also, feed effi-ciency and DMI at feedlot did not differ as a result of feedlotBioplex copper supplementation.
Table 4 shows the effects of copper supplementationwhen fed on pasture and(or) during the feedlot receivingperiod. Body weight at the end of the pasture phase andpasture ADG tended to be higher (P < .11) for steers on theBioplex copper/control treatment than for steers on the con-trol/Bioplex copper and control/control treatments. Bodyweights of steers on the Bioplex copper/control treatment atthe end of the feedlot-receiving phase were higher (P < .05)than for steers on the control/Bioplex copper or control/con-trol treatments. Feedlot ADG was not affected by the supple-mentation of Bioplex copper either before or after shipmentto the feedlot. No differences were found in rectal tempera-ture, or morbidity during the 42-day feedlot receiving pe-riod. No cattle were diagnosed with bovine respiratory dis-ease complex during the receiving period.
It seems that supplementation of copper deficient dietswith Bioplex copper before shipping to a feedlot increasesBW gain, and the BW advantage is maintained through thereceiving period at the feedlot. There were no observed signsof disease at the feedlot, so no conclusions can be drawnconsidering the immune response or disease resistance ofthe cattle used in this trial. Table 2 shows the compositionof the feedlot diet. When the feedlot diet was analyzed withthe NRC computer simulator (NRC, 1996), it indicated adaily copper requirement of 99 mg/day was oversupplied by136 mg/day (total intake, 235 mg/day). This may explainthe differences in effect found when the cattle were on pas-ture compared to at the feedlot. The premix supplied to thegrazing cattle was considered a complete mineral premix andconsidered well fortified with copper; yet because of thecharacteristics of the soil, copper levels were still marginalin meeting the requirements of cattle winter annual pasturegrown on the Coastal Plain.
Implications
It seems that supplementation of copper deficient dietswith Bioplex copper before shipping to a feedlot increasesBW gain, and the BW advantage is maintained through thereceiving period at the feedlot when cattle are grazing win-ter annual grasses grown on Coastal Plain soils.

Arkansas Animal Science Department Report 1999
113
Literature Cited
Brady, N.C. 1974. The Nature and Properties of Soils (8th
Ed.). Macmillan Publ. Co., Inc. New York.Gengelbach, G.P. and J.W. Spears. 1998. J. Dairy Sci.
81:3286-3292.Gengelbach, G.P., et al. 1997. J. Anim. Sci. 75:1112-1118.McDonald, P., et al. 1988. Animal Nutrition (4th Ed.). John
Wiley & Sons, Inc., New York.NRC. 1996. Nutrient Requirements of Beef Cattle (7th Ed.).
National Academy Press, Washington, DC.
Table 1. Composition (as-fed basis) of supplement offered to grazing steers.
% As-fedItem Bioplex® copper Control
Supplement compositionGround corn 89.375 89.541Premix 10.334 10.334Rumensin 80 .125 .125Alltech Bioplex® copper .165 .000
Chemical compositionCrude protein, % 5.8 5.8Total digestible nutrients, % 76.0 76.1Monensin, mg/lb 100 100Copper, ppm 186 21

AAES Research Series 470
114
Table 2. Composition (DM basis) of the basal 70% concentrate feedlot receiving diet.
Item % of DM
Diet composition 9.9 Sudangrass hay 19.8 Alfalfa hay 9.5 Whole shelled corn 46.7 Steam-flaked corn 3.8 Soybean meal 4.9 Molasses 4.9 Fat (yellow grease) 1.9 Limestone .7 Dicalcium phosphate .5 Salt .3 Urea .8 Ammonium sulfate .2 Premix 1.0
Chemical composition Dry matter 84.9 Ash 6.6 Crude protein 12.1 Acid detergent fiber 14.7
Copper, ppm 24
Table 3. Main effects of Bioplex® copper fed to grazing steers during final 29 days pre-shipping to afeedlot and during the feedlot receiving-phase on BW, performance, DMI, and feed efficiencya.
Effects/item Bioplex® Copper Control SE P-value
Grazing effectsInitial pasture BW, lb 630 630 —- —-Final pasture BW, lb 688 680 2.9 .11Pasture ADG, lb 2.0 1.7 .1 .11Initial feedlot BWb, lb 686 678 4.2 .18Final feedlot BW, lb 926 912 6.9 .04Feedlot ADG, lb 5.7 5.6 .1 .34Feed DMI, lb/d 21.6 21.3 .1 .77Feed efficiency, feed/gain 3.8 3.8 .1 .22
Feedlot effectsInitial pasture BW, lb 630 630 —- —-Final pasture BW, lb 682 686 2.9 .46Pasture ADG, lb 1.8 1.9 .1 .46Initial feedlot BWb, lb 678 686 4.3 .22Final feedlot BW, lb 914 923 6.9 .15Feedlot ADG, lb 5.6 5.7 .1 .76Feed DMI, lb/d 21.3 21.6 .1 .76Feed efficiency, feed/gain 3.8 3.8 .1 .89
aLeast-square means using initial pasture BW as a co-variable.bOff truck weight.
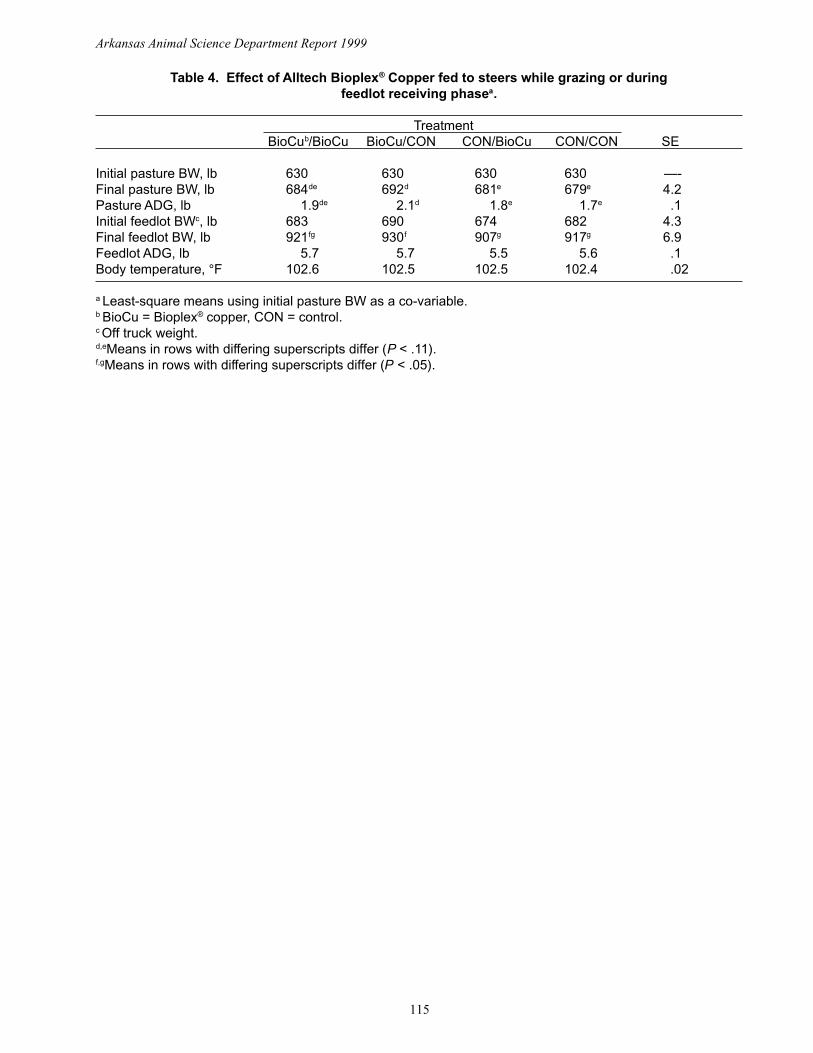
Arkansas Animal Science Department Report 1999
115
Table 4. Effect of Alltech Bioplex® Copper fed to steers while grazing or duringfeedlot receiving phasea.
TreatmentBioCub/BioCu BioCu/CON CON/BioCu CON/CON SE
Initial pasture BW, lb 630 630 630 630 —-Final pasture BW, lb 684de 692d 681e 679e 4.2Pasture ADG, lb 1.9de 2.1d 1.8e 1.7e .1Initial feedlot BWc, lb 683 690 674 682 4.3Final feedlot BW, lb 921fg 930f 907g 917g 6.9Feedlot ADG, lb 5.7 5.7 5.5 5.6 .1Body temperature, °F 102.6 102.5 102.5 102.4 .02
a Least-square means using initial pasture BW as a co-variable.b BioCu = Bioplex® copper, CON = control.c Off truck weight.d,eMeans in rows with differing superscripts differ (P < .11).f,gMeans in rows with differing superscripts differ (P < .05).

AAES Research Series 470
116
Escape Protein for Growing Cattle Grazing Stockpiled Tall Fescue1
Paul Beck, Stacey Gunter, Mike Phillips, and Kim Cassida2
Story in Brief
Forty steers and 40 heifers were allocated by gender and previous treatment to eight 12-acre Kentucky-31tall fescue pastures. Each pasture was assigned to one of four supplement treatments to test the ability of eithersupplemental energy or two levels of supplemental escape protein to correct a possible ruminal imbalance ofprotein and energy found in high quality forages. Supplementation treatments consisted of 1) no supplementalfeed offered (CONTROL), 2) supplemental corn (CORN), 3) a 22% CP supplement designed to supply 100 g/day escape protein, a low level of escape protein supplementation (LEP), or 4) a 42% CP supplement designedto supply 200 g/day of escape protein, a higher level of escape protein (HEP). Supplements were designed tosupply 200 mg/day of lasalocid, and free-choice mineral was offered to all calves in weather vane type feeders.Statistical analysis was conducted using steers only, heifers only and with both genders in the data set. Com-bined gender analysis indicated that performance of calves grazing fescue is increased by supplementation, butgains were not improved with the addition of escape protein to energy supplements. Performance of steers wasincreased by supplementation, while supplementation did not statistically increase gains in heifers. The differ-ent responses due to gender indicate energy supplementation is required in steers grazing stockpiled fescue inthe winter and spring, but is unnecessary in heifers.
Introduction
In high quality forages an imbalance of available totaldigestible nutrients (TDN) and crude protein (CP) in the ru-men may occur causing inefficient use of degradable nitro-gen (N). The ratio of TDN in relation to CP (TDN:CP) isbalanced at < 7:1. Above this ratio, cattle performance andforage intake will be increased with the supplementation ofrumen degradable protein such as soybean meal. Ruminalammonia concentrations begin to increase when the TDN:CPratio falls to 4:1, indicating rumen microbes are not incorpo-rating N into microbial protein as fast as it is released intothe rumen. At ratios < 3:1, large losses of N to the animaloccur, because excess N is excreted in the urine. Tall fescuein the fall and early spring has been reported to have CPconcentrations ranging from 15 to 25% and TDN levels of60 to 75% (Phillips et al., 1993). These characteristics cre-ate unbalanced TDN:CP ratios that are potentially less than4:1. Thus, even with high quality forages, growth of cattlemay be limited by protein flow to the small intestine. Thislimitation can be met with direct supplementation of proteinsupplements that escape fermentation in the rumen or withsupplementation energy to correct the imbalance and createmore microbial protein that is ultimately available to theanimal. This research was conducted to test the effects ofsupplementation with either energy or two levels of bypassprotein on performance of growing cattle grazing stockpiledfescue.
Materials and Methods
On January 4, 1999, 40 steers and 40 heifers were re-moved from a dry-lot study and randomly assigned to eightgroups by gender and previous treatment. A full descriptionof the previous treatments has been reported by Beck et al.(1999). The cattle were weighed after a 16-hour shrink andthen randomly assigned to eight pastures that were 12 acresin area (.83 animals/acre). All groups had free choice accessto a commercial mineral mix (Vigortone 46smg) fortifiedwith additional copper sulfate. The mineral mixture included11.0 to 13.2% calcium, 6% phosphorus, 15.5 to 18.5% salt,10% magnesium, .4% potassium, 1,528 ppm copper, 26.4ppm selenium, and 3,000 ppm zinc. Supplement treatmentsconsisted of 1) no supplemental feed offered (CONTROL),2) supplemental corn (CORN), 3) a 22% CP supplementdesigned to supply 100 g/day escape protein - Low EscapeProtein (LEP), or 4) a 42% CP supplement designed to sup-ply 200 g/day of escape protein - High Escape Protein (HEP).The supplement composition is shown in Table 1. Fish meal,feather meal, and poultry blood meal were blended on anequal protein basis and blended with corn to supply the dailysupplemental escape protein. Supplements were fed at a rateof 2.8 lb/animal five days a week (equal to 2 lb/animal/day)and were designed to supply 200 mg/day lasalocid (Bovatec;Roche Vitamins, Inc.; Parsippany, New Jersey). The escapeprotein level for each supplement was calculated by NRC
2 Southwest Research and Extension Center, Hope.
1 The authors wish to express gratitude to Pilgrim’s Pride (Mt. Pleasant, Texas), Omega Protein (Hammond, Louisiana), and Roche Vitamins,Inc. (Parsippany, New Jersey) for supporting this research through product donations.

Arkansas Animal Science Department Report 1999
117
(1996) computer simulation using book values for ingredi-ent CP and ruminal CP escape.
Supplements were fed to each group in the pasture be-tween 0700 and 0900 each morning when the cattle wereobserved to be finished with the morning grazing activity.For the first week of the trial molasses was added to all ofthe supplements to promote intake. Molasses was removedcompletely from the supplement at the start of the secondweek and no problems were observed in consumption ofsupplements. The cattle were weighed each at 28 to 35-dayinterval after a 16-hour shrink to equalize fill differences.None of the cattle in this study received implants, so theheifers could be used as replacements for the breeding herd.Supplement conversion was calculated from pasture meansof performance and supplement intake. Supplement con-sumption was not measured individually, so supplement con-version was not statistically analyzed.
The data were analyzed as a completely randomizeddesign using pasture as the experimental unit. Supplementtreatment, gender, previous treatment, and the gender xsupplement interaction, and previous treatment x supplementinteraction were tested. There were no significant interac-tions (P < .17) so they were removed from the final model.Weight at the onset of the trial was included as a covariate inthe analysis to remove variation among treatments. Least-square means for supplement treatment were separated bypredicted differences when a significant (P < .10) treatmenteffect was found. Analyses was conducted on all animals(steers and heifers combined) and each gender individuallyto identify possible differences in effects of supplementa-tion due to different stages of maturity associated with gen-der.
Results and Discussion
The escape protein supplements were designed to sup-ply a balanced mixture of amino acids that would bypass tothe small intestine. Feather meal and poultry blood meal arecommon byproducts from the poultry slaughter industry.These byproduct protein meals are complementary in aminoacid profile, yet lacking in the amino acid methionine.Feather meal contains large amounts of cysteine, a sulfuramino acid required by the body, but it is converted frommethionine so there is no nutritional requirement for it.Klemsrud and Klopfenstein (1999) showed that cysteine cansupply up to 51% of the total sulfur amino acids required, soan inexpensive escape protein source like feather meal canbe used to replace other more expensive ingredients. Fishmeal is an escape protein supplement with a balanced aminoacid profile and is rich in methionine, thus fish meal wasincluded in the supplement to supply methionine to thesupplement.
The effect of supplement treatments in the combineddata set and for each gender separately are shown in Table 2.In the combined analysis, final BW increased (P < .01) by29, 26, and 37 lb for CORN, LEP, and HEP supplementationstrategies, respectively. There was no statistical difference
in final weight as a result of supplement type, but CORNand LEP performed similarly while weights of HEP calveswere 8 lb higher than CORN. Average daily gains were im-proved (P < .07) by supplementation. Addition of escapeprotein yielded no statistical advantages over CORN, but anumerical advantage of .07 lb/d was observed for HEP treat-ment compared to the CORN treatment. Supplement con-version (pounds of supplement required per pound additionalgain) was the best for the HEP treatment at 6.7; while LEPand CORN treatments were less efficient (9.5 and 8.7, re-spectively).
When the statistical analysis was limited to steers, BWwere increased (P < .01) by 43 lb by CORN and HEP andtended (P = .06) to be 22 lb greater for LEP compared toCONTROL. The CORN and HEP supplementation strate-gies increased (P < .01) ADG by .36 lb/day and LEP tended(P = .06) to increase ADG by .19 lb/day compared to CON-TROL. Supplement conversion was 5.6 for CORN and HEP,and 10.5 for LEP.
Heifer BW was not improved (P = .32) with supple-mentation. Supplementation numerically increased BW andADG by 13, 28, and 32 lb and .12, .24, and .27 lb/day withCORN, LEP, and HEP supplementation compared to CON-TROL. Supplement conversion was the best for HEP (7.4)and LEP (8.4).
Differences in supplement effect due to gender wereexpected; the heifers had no increase in performance due tosupplementation. Steers had lower performance with LEPthan with HEP or CORN and added escape protein did notincrease gains compared to CORN. The steers may have beenmore efficient than heifers in utilizing the protein in the for-age when supplemental energy was provided or needed moreprotein to maximize performance than heifers. The lack ofincreased performance with added escape protein comparedto energy supplementation may be explained by the aminoacid sparing effect of ionophores like lasalocid, where iono-phores have been shown to decrease protein deamination inthe rumen (Russell, 1991). Horn et al. (1990) reported in-creased gains of .50 lb/day and supplement conversion ofaround 6.5 with steers grazing wheat pasture fed a self-lim-iting energy supplement containing rumensin. Supplementconversion was not statistically analyzed, so no statementscan be made concerning the differences between treatments.Economics of a supplementation program depends on rela-tive feed costs and profit potential of the calves. Supplementconversions of 5.6 to 6.7 are much lower than values of 8 to10 commonly associated with energy supplementation pro-grams which improves the economical potential of a supple-mentation program (Horn and McCollum, 1990). McCollumand Horn (1990) stated that when supplementation programsincrease ADG and have a low supplemental feed to addedgain ratio, forage intake was increased by the supplementa-tion. Antiquality factors (endophytes) in the fescue may haveled to lower increases in forage intake and lower ADG thanwould be expected with supplementation.
Figure 1 shows the effect of supplementation duringeach period on the performance of both steer and heifers. It

AAES Research Series 470
118
appears that the HEP supplementation promotes more gaincompared to CORN and LEP, particularly as it is fed laterinto the spring. As the season progresses, stem elongationoccurs as the cool season forages become reproductive. Theassociated decrease in forage quality may cause a limitationof protein at the small intestines of the animals.
Conclusions
Grazing performance was improved with the supple-mentation of CORN and HEP to steers grazing tall fescue.Additional escape protein had no effect on performance com-pared to CORN. Performance of heifers was not statisti-cally improved with supplementation. In the combined analy-sis supplement conversion (lbs of feed required per lb addi-tional gain) was best with 200 g of supplemental escape pro-tein/day. Escape protein appeared to improve animal per-formance later in the spring as forage quality of tall fescuedeclines.
Literature Cited
Beck, P.A., et al. 1999. Arkansas Animal Science. (submit-ted).
Klemsrud, M. and T. Klopfenstein. 1999. Nebraska BeefCattle Rep. MP 71-A:14-16.
Horn, G.W., et al. 1990. Oklahoma Agric. Exp. Sta. Res.Rep. MP-129:209-216.
McCollum, F.T. and G.W. Horn. 1990. Prof. Anim. Sci.6(2):1-16.
NRC. 1996. Nutrient Requirements of Beef Cattle (7th Ed.).National Academy Press, Washington, D C.
Phillips, J.M., et al. 1993. American Forage and GrasslandCouncil Proceedings. Vol. 2:150-154.
Russell, J.B. 1991. Proc. 2nd Grazing Livestock NutritionConf. MP-133:101-108.
Table 1. Composition of supplements fed to cattle grazing tall fescue.
Supplement, % of DMIngredient CORN LEPa HEPb
Corn 99.85 79.85 52.85 Fish meal - 8.10 19.04 Feather meal - 6.12 14.38 Blood meal - 5.78 13.58 Bovatec B-68 .15 .15 .15
Calculated composition % Crude protein 8.0 22.5 42.2 % TDN 89 84 79Lasalocid (mg/day) 200 200 200Escape Protein (g/day) 25 100 201
a LEP - Low Escape Protein supply 100 g/day of escape protein.bHEP - High Escape Protein supply 200 g/day of escape protein.

Arkansas Animal Science Department Report 1999
119
Table 2. Effect of supplemental energy or escape protein on performance of cattle grazing tall fescue.
TreatmentItem Control Corn LEP HEP P-Value
Combined Analysis Initial BW 563 563 563 563 - Final BW 699c 728b 725b 736b .07 ADG 1.14c 1.37b 1.35b 1.44b .07Supplement conversiona - 8.7 9.5 6.7
Steers Initial BW 594 594 594 594 - Final BW 734c 777b 756bc 777b .02 ADG 1.16c 1.52b 1.35bc 1.52b .02Supplement conversiona - 5.6 10.5 5.6
Heifers Initial BW 532 532 532 532 - Final BW 665 678 693 697 .32 ADG 1.11 1.23 1.35 1.38 .32Supplement conversiona - 16.7 8.3 7.4
aPounds supplemental feed per lb added gain.bcLeast-square means within rows with different superscripts differ (P <.05).
Fig. 1. Effect of supplementation on growth of steers and heifers during each period of fescuesupplementation trial.

AAES Research Series 470
120
Genotype x Environment Interactions in Angus, Brahman, andReciprocal Cross Cows and their Calves Grazing Common
Bermudagrass, Endophyte-Infected Tall Fescue Pastures,or Both Forages
A. Hayden Brown1 , Jr., Michael A. Brown2 , Wesley G. Jackson3 , and James R. Miesner3
Story in Brief
Reproductive and preweaning data on 190 Angus (A x A), Brahman (B x B), and reciprocal-crosscows (A x B, B x A)and 434 two- and three-breed cross calves managed on common bermudagrass (BG),endophyte-infected tall fescue (E+), or a combination of both forages (ROT) were used to evaluate theinteraction of forage type with individual and maternal heterosis and maternal and grandmaternal breedeffects. Cows were born from 1988 to 1991 and calves from 13 Polled Hereford sires were born from 1995to 1997. Individual heterosis for calving rate was larger on E+ compared to BG or ROT (P < .05), whilematernal effects were larger on BG than ROT (P < .10). Grandmaternal effects were evident on BG (P <.10) and E+ (P < .01) but not ROT. Forage effects were generally substantial for 205-day weight, weaninghip height, and weaning weight:height ratio with BG highest, ROT intermediate, and E+ lowest, andmaternal heterosis for these traits was generally greater on E+ than BG (P < .10). Grandmaternal breedeffects for 205-day weaning weight, weaning hip height, and weaning weight:height ratio were not impor-tant on any forage. Individual heterosis for weaning weight per cow exposed was significant (P < .01)within all forage groups and was significantly greater on E+ (P < .01) than BG or ROT, while maternalbreed effects were not significant for any forage. These data suggest more advantage to Brahman-crosscows over purebreds on E+ than a similar comparison on BG. These data also suggest that moving cowsand calves from E+ to BG in the summer will alleviate some but not all of the deleterious effects of E+ oncalf growth but may be more beneficial for reproductive traits in purebred cows.
Introduction
In the Mid-South United States, common bermudagrass(BG) and endophyte-infected tall fescue (E+) are the majoravailable warm-season and cool-season forages. The prob-lems with endophyte-infected tall fescue have been exten-sively documented. Losses in milk production, weaningweight, and reproduction have been reported. Brown et al.(1997) reported that F
1 cows from the Brahman and Angus
breeds and their three-breed cross calves were more tolerantof the E+ compared to their purebred contemporaries, whencows were managed on BG and E+ all year. Sleper and West(1996) suggested that removal of cows from E+ during thesummer months is appropriate management of E+ to helpalleviate problems associated with this forage. However, therehas been little evidence in the literature to document the ef-fects of removal during the summer. Moreover, there is someevidence that heterosis, and(or) breed effects are not consis-tent across production environments (Brown et al., 1997).There is little documentation of interactions of genetic ef-
fects with management systems involving year-round man-agement on BG, E+, or a system using both forages duringappropriate grazing seasons. Consequently, the objective ofthis research was to evaluate the reproductive performanceof Angus, Brahman, and reciprocal-cross cows and thepreweaning performance of their three-breed cross calves,when cows and calves were managed on BG, E+, or a com-bination of the two forages.
Experimental Procedures
Approximately 190 Angus (A x A), Brahman (B x B),and reciprocal-cross cows (A x B and B x A) born in 1988 to1991 and 434 two- and three-breed cross calves were usedto evaluate the effect of forage management system on re-productive and preweaning performance. For crossbred cowsin this study, sire breed of cow is listed first and dam breedof cow (breed of cow’s mother) is listed second (i.e. an A xB cow was produced from a mating of an Angus sire and a
1 Department of Animal Science, Fayetteville.2 USDA, ARS, Grazinglands Research Laboratory, El Reno, Oklahoma 730363 USDA, ARS, Dale Bumpers Small Farms Research Center, Booneville.

Arkansas Animal Science Department Report 1999
121
Brahman dam). Cows were managed on either BG or E+with all breed types represented in each pasture. After wean-ing in the fall of 1994, approximately 10 cows from eachbreed group in each forage were randomly assigned to a newforage management treatment, i.e., E+ in the fall and spring(approximately November-May) and BG in the summer(June-October). Consequently, there were three 40-acre pas-tures of BG, three 40-acre pastures of E+, and two pairs of40-acre BG and E+ pastures used in the rotational system(ROT). Pastures were paired to result in two BG/E+ combi-nations consisting of 80 acres per pair (40 for each foragetype). Stocking rates were approximately .5 head/acre forBG and E+ and an average of approximately .5 head/acre onROT (approximately 1.0 head/acre on BG in summer andapproximately 1.0 head/acre on E+ in fall and spring). Pas-tures were fertilized with a total of 138 lb/acre of N in twoapplications; early May and mid-July for BG and early Marchand early October for E+. Other soil amendments (P and K)were applied as suggested by soil tests. Eight Polled Here-ford bulls were used during each of the 1994 to 1996 breed-ing periods. Thirteen different bulls were used throughoutthe study. Bulls were semen checked each year prior to thebreeding period, and each breeding pasture was exposed toa minimum of two bulls. All bulls were used in all forageenvironments to preclude confounding sire effects with for-age effects. Heifers were pregnancy checked in the fall eachyear.
Calves were born from late February through May in1995, 1996, and 1997. Calves were weighed at birth andtagged. Bull calves were castrated at birth by banding. Calveswere weaned at an average age of 205 days when full weightsand hip heights were taken. Creep-feeding was not practiced.A description of production and management of the pure-bred and crossbred cows used in this study is given by Brownet al. (1993).
Individual heterosis was obtained as the difference be-tween the means of traits reported for crossbred and pure-bred cows. Individual heterosis can be interpreted as the ad-vantage in performance of crossbreds over purebreds. Ma-ternal heterosis was obtained as the difference between meansof traits reported for calves from crossbred dams and themeans of traits reported for calves from purebred dams.Maternal heterosis is the advantage in performance that cross-bred calves from crossbred dams have over crossbred calvesfrom purebred dams. Maternal breed effects were obtainedas the difference in trait means between reciprocal-crosscows. Generally, maternal breed effects can be interpretedas genetic effects in the dam expressed in her offspring.Grandmaternal breed effects were calculated as the differ-ence in means of traits reported between calves of recipro-cal-cross cows. Grandmaternal breed effects are genetic ef-fects in the granddam expressed in her daughter’s calves.
In the analysis of data, calving percentage and weaningweight per cow exposed for breeding were considered traitsof the cow. Weaning traits of 205-day weight, hip height,weight:hip height ratio were considered traits of the calf. Datawere analyzed by methods of mixed model least squares.
The linear model for traits of the cow included effects forsire breed of cow, sire of cow in sire breed, dam breed ofcow, forage, age of dam, and appropriate two- and three-factorinteractions among the fixed effects where sire in sire breedwas considered random and other effects fixed. The linearmodel for calf weaning traits included effects of sire of calf,sire breed of cow, dam breed of cow, forage, age of dam, sexof calf, and appropriate interactions among fixed effectswhere sire of calf was random and other effects fixed. Indi-vidual and maternal heterosis, maternal and grandmaternalbreed effects, and interactions of these effects with forageeffects were computed from linear contrasts of theleast-squares means and tested using “t” statistics.
Results and Discussion
Calving RateCalving percentage per cow exposed for breeding is pre-
sented in Table 1 for each breed group and forage. Anguscows grazing BG and ROT were 36.6 and 38.3% higher incalving percentage per cow exposed than Angus cows graz-ing E+ (P < .01), respectively. The only other forage effecton calving percentage per cow exposed within breed was inA x B where cows on BG were 15% higher than cows onROT (P < .10). Individual heterosis had a significant effecton calving percentage per cow exposed (29.6%, P < .01) forcows within the E+ forage base. Individual heterosis in calv-ing percentage per cow exposed was nonsignificant on BGand ROT (9.5 and 2.6%, respectively). Brown et al. (1997)reported a 13.3% advantage for Angus on BG compared toAngus on E+ with individual heterosis in B x A crosses nu-merically larger on E+ compared to BG. There was evidenceof interaction of maternal breed effects in favor of Brahmandams on BG and maternal breed effects in favor of Angusdams on ROT.
Weaning TraitsLeast square means for 205-day weaning weight, wean-
ing hip height, and weaning weight:hip height ratio are givenin Table 2. Breed group and forage effects explained a sig-nificant (P < .01) amount of the variance in 205-day wean-ing weight. Additionally, there was evidence of substantialmaternal heterosis for this trait (P < .01) with maternal het-erosis for 205-day weight larger on E+ compared to BG (P <.10). There was little evidence of grandmaternal effects, butestimates favored the Angus granddams for this trait forcalves on all forages. Brown et al. (1997) reported signifi-cantly greater maternal heterosis in 205-day weight in calvesfrom Brahman and Angus crosses on E+ compared to BG.These data imply that crossbred cows and their calves weremore tolerant of the negative effects of the tall fescue envi-ronment, whether managed all year or managed in a rota-tional scheme with BG.
Weaning hip height is a measure of long-bone growthin the calf, which is an indicator of potential slaughter weight/mature size and generally rate of maturing. Calves from A x

AAES Research Series 470
122
A cows on BG and ROT had greater mean hip height thanthose on E+ (P < .05); calves from A x B and B x A cows onROT exceeded those on BG and E+ for mean weaning hipheight (P < .05); and calves from B x B on ROT had highermean hip height than those on BG (P < .10). Maternal het-erosis for this trait was important (P < .01) for E+ and ROT;(P < .10) for BG, but greater on E+ and ROT than BG (P <.01). Grandmaternal effects were not evident on any forage.Brown et al. (1997) reported significantly greater maternalheterosis in hip height for calves from crosses of Brahmanand Angus on E+ compared to BG.
Weaning weight to hip height ratio is calculated as ameasure of body condition of the calf. For weaning weightto hip height ratio, calves from A x B, B x A, and B x B onBG exceeded contemporary calves from E+ and ROT (P <.05). Maternal heterosis for weight:height ratio was impor-tant (P < .01) and similar among forages. There was littleevidence of grandmaternal effects for any forage. Estimatesof maternal heterosis for this ratio for calves from Brahmanand Angus crosses reported by Brown et al. (1997) weregreater in calves managed on E+ than calves on BG.
Weaning Weight Per Cow ExposedThe combination of reproductive and maternal perfor-
mance of the cow and growth of the calf is reflected in wean-ing weight per cow exposed (Table 3). Individual heterosisfor this trait was important (P < .01) and was greater on E+compared to BG and ROT (P < .01). On BG and ROT, cross-bred cows weaned 98.6 and 112.2 lb (P < .01) more calf percow exposed, respectively, compared to purebred cows whilecrossbred cows on E+ weaned 277.3 lb (P < .01) more calfper cow exposed compared to purebreds. Heterosis for 205-d weight per cow exposed reported by Brown et al. (1997)was numerically higher in Brahman-Angus crosses on E+compared to contemporaries on BG.
General Discussion
These data show that crossbred cows and their cross-bred calves were less susceptible to the detrimental effectsof the E+ forage environment, regardless of whether theywere managed all year on it or whether they were managedin a rotational grazing scheme involving E+ and BG. Theresultant genetic effects from crossbreeding that made thispossible were created by the planned matings of individualsin the breeds indicated. The degree of genetic effects createdthrough gene combination value and perhaps some indepen-dent genes from a planned crossbreeding program are dif-ferent from the degree of genetic effects created by com-mingling breeds. Breed complementarity also may have beeninvolved in the tolerance of the crossbreds to E+. This wouldbe particularly true if heat tolerance played an important rolein producing these effects. However, if it were as simple asheat tolerance, then the B x B cattle should have performedmore like the crossbreds. These results are applicable to thebreeds, management, and specific and general environment
reported in this study; however, there is nothing to indicatethat other planned crosses of British and Brahman cattlewould not give similar results under similar management.
Implications
It appears that the use of Brahman x Angus or Angus xBrahman crossbred cows bred to a bull of a third breed couldbe a beneficial management tool for producers faced withthe management of E+. Rotating cows and calves from E+to BG in the summer moderated some of the effects of E+ oncalf growth but was not always comparable to BG. The ro-tation did appear to be more beneficial for purebred cowsthan crossbred cows, considering reproductive traits. Al-though this technology does not eliminate production lossesattributable to E+, it appears to reduce these losses substan-tially. In combination with other technologies available forthe management of endophyte-infected tall fescue, it may bepossible to reduce losses to more acceptable levels.
Literature Cited
Brown, M.A., et al. 1997. J. Anim. Sci. 75:920-925.Brown, M.A., et al. 1993. J. Anim. Sci. 71:326-333.Sleper, D.A. and C.P. West. 1996. Tall Fescue. In:Cool-
Season Forage Grasses. Agronomy Memograph No.34:471.

Arkansas Animal Science Department Report 1999
123
Table 1. Least-square means, individual heterosis, maternal breed effects and standard errors forcalving rate (percentage) for cows from bermudagrass, tall fescue, and rotational
forage environments.
Preweaning Breed groupa Individual Maternal breedenvironment A x A A x B B x A B x B heterosis effects
Bermudagrass 93.0 ± 6.5b 100.0 ± 6.0f 86.8 ± 6.0 75.2 ± 5.6hi 9.5 ± 5.9d 13.6 ± 8.5f
Tall fescue 56.4 ± 7.2c 93.2 ± 7.1fg 87.1 ± 6.5 64.7 ± 5.4h 29.6 ± 6.5**e 6.1 ± 9.6fg
Rotation 94.7 ± 5.5b 85.0 ± 5.2g 92.4 ± 5.7 77.6 ± 6.1i 2.6 ± 5.5d -7.4 ± 7.7g
a A=Angus grandparent, B=Brahman grandparent, breed of grandsire listed first.**P < .01 (H
0: individual heterosis or maternal breed effect = 0).
b,cMeans in the same column with differing superscripts differ (P < .01).d,eMeans in the same column with differing superscripts differ (P < .05).f,gMeans in the same column with differing superscripts differ (P < .10).h,iMeans in the same column with differing superscripts differ (P = .11).
Table 2. Least-square means, maternal heterosis, grandmaternal breed effects, and standard errorsfor 205-day weaning weight, weaning hip height, weaning weight:hip height ratio for calves from
bermudagrass, tall fescue, and rotational preweaning environments.
Preweaning Breed groupsa Maternal GrandmaternalEnvironment A x A A x B B x A B x B heterosis breed effects
Weaning weight (lb)Bermudagrass 489.2 ± 15.9b 551.4 ± 15.9e 577.2 ± 14.6h 549.6 ± 15.9b 45.0 ± 9.7**h -25.8 ± 18.5Tall fescue 371.1 ± 26.9c 500.0 ± 19.0f 510.1 ± 20.3i 491.9 ± 18.1c 70.5 ± 13.2**i -9.9 ± 20.9Rotation 436.3 ± 14.1d 542.1 ± 13.0e 547.8 ± 14.3j 528.6 ± 16.8bc 54.4 ± 9.5**hi -5.1 ± 17.2
Weaning hip height (in)Bermudagrass 43.5 ± .5e 45.2 ± .5e 45.7 ± .5e 46.2 ± .5h .6 ± .3b -.5 ± .6Tall fescue 41.3 ± .9f 45.8 ± .6e 45.6 ± .6e 46.4 ± .6hi 1.9 ± .4**c .2 ± .7Rotation 43.9 ± .4e 47.3 ± .4f 47.4 ± .5f 47.4 ± .6i 1.7 ± .3**c -.2 ± .6
Weaning weight:hip height ratio (lb:in)Bermudagrass 2.01 ± .05e 2.17 ± .05b 2.25 ± .05b 2.12 ± .05e .15 ± .03** -.07 ± .06Tall fescue 1.62 ± .09f 1.94 ± .06c 1.99 ± .06c 1.89 ± .06f .21 ± .04** -.04 ± .07Rotation 1.77 ± .04g 2.04 ± .04c 2.06 ± .05c 1.98 ± .05f .18 ± .03** -.02 ± .05
aSee Table 1.**P < .01 (H
0:maternal heterosis or grandmaternal breed effects = 0).
b,c,dTrait means in the same column with differing superscripts differ (P < .01).e,f,gTrait means in the same column with differing superscripts differ (P < .05).h,i,jTrait means in the same column with differing superscripts differ (P < .10).

AAES Research Series 470
124
Table 3. Least-square means, individual heterosis, maternal breed effects and standarderrors for weaning weight per cow exposed (lb)for cows from bermudagrass, tall fescue,
and rotational forage environments.
Preweaning Breed groupa Individual Maternal breedenvironment A x A A x B B x A B x B heterosis effects
Bermudagrass 488.1 ± 44.1b 581.6 ± 41.5f 515.7 ± 39.9 412.4 ± 37.9d 98.6 ± 37.1**b 65.9 ± 57.5Tall fescue 164.3 ± 51.6c 533.1 ± 48.3fg 486.9 ± 44.1 301.2 ± 43.2e 277.4 ± 43.2**c 46.3 ± 65.5Rotation 405.5 ± 38.6b 502.9 ± 36.4g 532.6 ± 38.6 405.6 ± 41.3d 112.2 ± 34.6**b -29.7 ± 53.2
a See Table 1.**P < .01 (H
0: maternal heterosis or grandmaternal breed effect = 0).
b,cMeans in the same column with differing superscripts differ (P < .01).d,eMeans in the same column with differing superscripts differ (P < .05).f,gMeans in the same column with differing superscripts differ (P < .11).

Arkansas Animal Science Department Report 1999
125
Postweaning Performance of Calves from Angus, Brahman, andReciprocal-Cross Cows Grazing Endophyte-Infected Tall
Fescue or Common Bermudagrass
Michael A. Brown1, William A. Phillips1, A. Hayden Brown, Jr.,2 Samuel W. Coleman1,Wesley G. Jackson3, and James R. Miesner3
Story in Brief
Data from 403 Polled Hereford-sired calves from Angus, Brahman, and reciprocal-cross cows wereused to evaluate the effects of preweaning forage environment on postweaning performance. Calves werespring-born in 1991 to 1994 and managed on either endophyte-infected tall fescue (E+) or commonbermudagrass (BG) before weaning. After weaning, calves were shipped to the Grazinglands Research Labo-ratory, El Reno, Oklahoma, and assigned to one of two winter stocker treatments (winter wheat pasture ornative range). Each stocker treatment was terminated in March, calves grazed cool-season grasses and werethen moved to feedlot in June. In the feedlot, calves were fed to approximate .4 in fat over the 12th rib andaveraged approximately 115 days on feed. When finished, calves were shipped to Amarillo, Texas, forslaughter. On average, calves from E+ gained faster as stockers (P < .10), had lighter starting and finishedweights on feed (P < .01), lighter carcass weights (P < .01), and smaller longissimus muscles (P < .05) thancalves from BG. Calves from E+ were similar to calves from BG in feedlot ADG, percentage kidney, heartand pelvic fat, fat thickness over 12th rib, yield grade, marbling score and dressing percentage. These datasuggest that few carry-over effects from tall fescue preweaning environments exist, other than lighter, butacceptable weights through slaughter. These data further suggest that the tolerance to E+ in calves fromreciprocal-cross cows, was also expressed postweaning.
Introduction
Millions of stocker calves are transported to the South-ern Great Plains in the fall to background on wheat pastureor native range. Subsequent to the stocker phase, these calvesare moved to feedlots in the High Plains, finished, and slaugh-tered to produce a significant portion of the nation’s beefsupply. Many of these calves are born and weaned on endo-phyte-infected tall fescue (E+). Preweaning performance ofcalves managed on E+ has been shown to be substantiallylower than calves managed on other forages. However, thereis little information on the existence or magnitude of anycarry-over effects of E+ on calves weaned on this forage andtransported to wheat pasture in the Southern Great Plains.Some evidence in the literature suggests the length of timerequired to recover from the effects of grazing E+ is difficultto predict. Consequently, the objective of this research wasto compare the effects of preweaning forage environment onpostweaning performance in calves weaned on commonbermudagrass or endophyte-infected tall fescue.
Experimental Procedures
Data from 403 Polled Hereford-sired calves from An-gus, Brahman, and reciprocal-cross cows were used to evalu-ate the effects of preweaning forage environment onpostweaning performance. Calves were spring-born in 1991to 1994 and managed on either endophyte-infected tall fes-cue or common bermudagrass (BG) before weaning. Calveswere not creep-fed and bull calves were castrated at birth.Weights were taken at birth and weaning (ca. 205 days ofage). Fifteen different sires were used over the four year study.Sires were replaced if injured or if they did not pass a breed-ing soundness exam and one or two sires were replaced eachyear.
Two weeks prior to weaning calves were vaccinatedfor IBR, PI3, BVD, and clostridia species. After weaningcalves were dry-lotted for 14 days and fed a weaning rationat 6 lb/hd/day and bermudagrass hay ad libitum. Calves werethen shipped to the Grazinglands Research Laboratory, ElReno, Oklahoma, re-vaccinated consistent with preweaning
1USDA-ARS, Grazinglands Research Laboratory, El Reno, Oklahoma.2Department of Animal Science, Fayetteville3USDA-ARS Dale Bumpers Small Farms Research Center, Booneville

AAES Research Series 470
126
vaccines, implanted with Synovex®,and placed on a 13% CPreceiving ration for a minimum of 14 days. After the receiv-ing phase, calves were stratified to one of two winter stockertreatments by breed and preweaning forage where stockertreatments were wheat pasture (WW) or native range plusCP supplementation (NR) (November to mid-March). Calveson NR were fed between .8 and 1.0 lb of CP per head perday based on body weight with the goal of realizing approxi-mately .45 lb/day gain in the calves. During the spring pe-riod (mid-March to early June) all calves grazed cool-sea-son grasses (Bromus spp.) on dormant warm season nativegrass pastures. Individual weights were taken at the begin-ning, middle, and end of the stocker phase and ADG calcu-lated. In early June, calves entered the feedlot.
In the feedlot, calves were blocked by sex and strati-fied within sex by breed, preweaning treatment, and stockermanagement. Within each stratum, calves were randomlyassigned to pens for finishing. Calves were treated for inter-nal parasites with Ivomec®, and implanted with Synovex® atthe beginning of the feedlot phase. Calves were transitionedto the finishing ration by decreasing the hay content of thediet approximately 9% (DM basis) weekly for 4 weeks.Calves had ad libitum access to the finishing diet and wereconsidered finished when fat thickness over the 12th rib was≥ .4 in as determined by ultrasonography. Ultrasounds weredone starting on 100 days on feed and on 14-day intervalsthereafter. When finished, calves were weighed and shippedto Amarillo, Texas, for slaughter. Hot carcass weight, long-issimus muscle, fat thickness over the 12th rib, marblingscore, percentage kidney, heart, and pelvic fat (KHP), yieldgrade, and dressing percentage were measured or calculated.All experimental procedures used were approved by theAnimal Care Committee of the Grazinglands Research Labo-ratory.
Data were analyzed by methods of weighted leastsquares. Analyses accounted for years, sire of calf, grandsirebreed, grandam breed, preweaning forage, postweaning for-age, age of dam, sex of calf, and all possible interactionsamong fixed effects, where sire of calf was a random effectand all other effects were fixed. Tests of hypotheses wereperformed using F and t statistics.
Results and Discussion
Stocker GainsLeast squares means and associated standard errors for
weaning weights and postweaning stocker ADG are givenin Table 1. Tall fescue reduced weaning weights by an aver-age of 82 lb (P < .01) but had more effect on calves frompurebred cows compared to calves from crossbred cows.Calves from the E+ preweaning environment gained fasterthan calves from the BG preweaning environment (P < .01)in the winter stocker period. However, during the springstocker period, there was little evidence of preweaning for-age differences. Combining both periods (winter and spring),calves from the E+ preweaning environment gained fasterthan calves from BG (P < .10). The 50% Brahman F
1 calves
from both preweaning environments performed similarly andbetter than other breed groups with no suggestion of coldintolerance to the postweaning environment of the westernOklahoma winter.
Feedlot TraitsLeast squares means and associated standard errors for
feedlot weights and gains are given in Table 2. Startingweights were lower in calves from the E+ preweaning envi-ronment compared to calves from BG (P < .01) consistentwith their differences in weaning weights (Brown et al.,1997). Similarly, finished weights in calves from the E+preweaning forage were lower (P < .01) than calves fromBG. There was not strong evidence that feedlot ADG dif-fered between preweaning forages. Overall, calves from E+gained .13 lb/day less than calves from BG (P > .25).
Preweaning environment had little impact on startingweight in calves from A x B and B x A cows whereas prewean-ing forage effects were large in calves from purebred cows(P < .01). These initial weight differences carried over tofinished weight so that differences between calves from cross-bred and purebred cows on E+ was larger than a similar com-parison on BG. There was a trend for feedlot ADG to beinversely proportional to percentage Brahman in these data.
Carcass TraitsLeast squares means and associated standard errors for
carcass traits are given in Table 3. Averaged over breedgroups, hot carcass weights averaged 37 lb lower (P < .01)in calves from E+ compared to calves from BG and meanlongissimus muscle was smaller in calves from E+ (P < .01).There was little evidence of preweaning forage effects onkidney, heart, and pelvic fat, fat thickness over the 12th rib,yield grade, marbling score, percentage grading choice, ordressing percentage when averaged over breed group. Simi-lar to live weights, there was a trend for carcass weight andlongissimus muscle area differences between calves fromcrossbred and purebred cows to be larger on E+ compared toBG. Calves from crossbred cows had 21% fewer (P < .01)that graded choice than calves from purebreds on E+ whereasthere was only a 1% (P > .80) difference in a similar com-parison in calves from BG. There were also trends for fatthickness, yield grade, and marbling score to decrease withincreasing percentages of Brahman breeding.
General DiscussionThese results demonstrated a small advantage in gain
in stocker cattle from an E+ preweaning environment com-pared to BG and similar gains for the preweaning environ-ments during the spring grazing and feedlot phase. Thus,averaged over breed groups, calves from the E+ preweaningenvironment started at a lighter weight, gained about the samethrough slaughter compared to calves from the BG prewean-ing forage environment, and finished at a lighter weight whenfat thickness was used as the endpoint. There was no sub-stantial indication that the E+ preweaning environment nega-tively affected carcass quality, and there were no discounts

Arkansas Animal Science Department Report 1999
127
received for light carcasses in these cattle with only one car-cass not exceeding 525 lb. Therefore, it is reasonable to con-clude from these data that there was no discernable negativeimpact of a preweaning endophyte-infected tall fescue envi-ronment on postweaning performance or carcass traits.Moreover, fewer differences in weights between calves fromthe two preweaning forages occurred in calves from cross-bred cows compared to similar comparisons in calves frompurebred cows. There were similar trends in hot carcassweight and longissimus muscle. Consequently, there wereeven fewer effects of E+ on calves from crossbred cows inthe postweaning period, and a level of preweaning E+ toler-ance reported in three-breed cross calves from Brahman-Angus dams (Brown et al., 1997) seems to continue duringthe postweaning phase. However, these conclusions maydiffer for fall-born calves from E+ where these calves areweaned in the spring and are placed into stocker or feederprograms in the summer directly from E+.
There were trends in these data consistent with otherhypotheses concerning Brahman cattle, namely, performanceas stockers was directly proportional to percentage Brahmanwhile feedlot performance and marbling score were inverselyproportional to percentage Brahman.
Implications
Preweaning management of calves on endophyte-in-fected tall fescue may decrease weaning weights and part ofthis reduction in weight may carry through to slaughter.However, there are few other indications of postweaningcarry-over effects for calves managed on endophyte-infectedtall fescue. Moreover, in cattle tolerant of endophyte-infectedtall fescue during the preweaning phase, such as calves fromBrahman-Angus cross cows, preweaning advantages inweight are reflected during the postweaning phase. There-fore, in spring-born calves, there do not appear to be sub-stantial reasons to place a price discount on cattle weaned onendophyte-infected tall fescue.
Literature Cited
Brown, M.A., et al. J. Anim. Sci. 71:326-333.Brown, M.A., et al. J. Anim. Sci. 75:920-925.
Table 1. Least-square means and standard errors for 205-day weight (lb) and stocker ADG (lb/day) forcalves from bermudagrass and tall fescue preweaning environments
.Preweaning Breed groupa
Trait environment A x A A x B B x A B x B Avg
205-day Bermudagrass 501.8 ± 6.8 561.9 ± 6.8 590.8 ± 7.1 577.6 ± 7.9 558.0 ± 4.2Weight Tall Fescue 391.5 ± 7.7 506.6 ± 7.7 516.8 ± 8.6 489.9 ± 9.5 476.2 ± 8.2
BG vs. E+ P < .01 P < .01 P < .01 P < .01 P < .01Winter Bermudagrass .82 ± .04 .71 ± .04 .71 ± .04 .97 ± .02 .79 ± .02ADG Tall fescue .93 ± .04 .73 ± .04 .97 ± .07 1.04 ± .04 .90 ± .02
BG vs. E+ P < .13 NSb P < .01 NS P < .01Spring Bermudagrass 1.74 ± .07 1.94 ± .07 1.94 ± .09 2.18 ± .09 1.96 ± .04ADG Tall Fescue 1.72 ± .09 1.90 ± .09 1.98 ± .09 2.27 ± .11 1.96 ± .04
BG vs. E+ NS NS NS NS NSTotal Bermudagrass 1.15 ± .04 1.12 ± .04 1.17 ± .04 1.43 ± .04 1.21 ± .02ADG Tall Fescue 1.21 ± .04 1.15 ± .04 1.32 ± .04 1.43 ± .07 1.28 ± .02
BG vs. E+ NS NS P < .05 NS P < .10
a A = Angus grandparent, B = Brahman grandparent, breed of grandsire listed first.b NS = not significant.

AAES Research Series 470
128
Table 2. Least-square means and standard errors for feedlot traits for calvesfrom bermudagrass and tall fescue preweaning environments.
Feeddlot Preweaning Breed groupa
traitb environment A x A A x B B x A B x B Avg
IWT Bermudagrass 758 ± 13 809 ± 15 829 ± 15 851 ± 15 811 ± 9Tall fescue 686 ± 13 796 ± 15 816 ± 15 756 ± 20 763 ± 9BG vs. E+ P < .01 NSc NS P < .01 P < .01
FWT Bermudagrass 1162± 18 1188 ± 20 1210 ± 20 1188 ± 20 1186 ± 11 Tall Fescue 1067± 18 1168 ± 20 1146 ± 22 1098 ± 29 1120 ± 11 BG vs. E+ P < .01 NS P < .05 P < .05 P < .01
ADG Bermudagrass 3.46± .11 3.28 ± .13 3.28 ± .13 3.00 ± .13 3.26 ± .07 Tall Fescue 3.30± .11 3.28 ± .13 3.00 ± .13 2.95 ± .18 3.13 ± .09 BG vs. E+ NS NS P < .13 NS NS
a A=Angus grandparent, B=Brahman grandparent, breed of grandsire listed first.bIWT=Initial weight, lb; FWT=Final weight, lb; ADG=Average daily gain, lb/day.c NS = not significant.
Table 3. Least-square means and standard errors for carcass traits for calves from bermudagrassand tall fescue preweaning environments.
Carcass Preweaning Breed groupa
traitb environment A x A A x B B x A B x B Avg
HCW Bermudagrass 714 ± 9 732 ± 9 765 ± 11 736 ± 13 736 ± 7Tall fescue 648 ± 11 708 ± 11 736 ± 13 701 ± 13 699 ± 7BG vs. E+ P < .01 P < .10 P < .10 P < .10 P < .01
REA Bermudagrass 12.9± .2 13.2 ± .2 13.3 ± .2 13.1 ± .2 13.1 ± .1Tall Fescue 12.1± .2 13.1 ± .2 12.9 ± .2 12.7 ± .3 12.7 ± .1BG vs. E+ P < .01 NSc NS NS P < .01
KHP Bermudagrass 2.34± .04 2.28 ± .04 2.24 ± .04 2.27 ± .05 2.28 ± .02 Tall Fescue 2.31± .05 2.26 ± .05 2.33 ± .05 2.28 ± .06 2.30 ± .02BG vs. E+ NS NS NS NS NS
FAT Bermudagrass .52± .02 .52 ± .02 .48 ± .02 .41 ± .03 .48 ± .02 Tall Fescue .46± .03 .46 ± .03 .48 ± .03 .43 ± .03 .46 ± .02 BG vs. E+ NS NS NS NS NS
YG Bermudagrass 2.87 ± .10 2.82 ± .10 2.77 ± .10 2.59 ± .12 2.76 ± .06Tall Fescue 2.72 ± .11 2.65 ± .11 2.83 ± .12 2.67 ± .14 2.72 ± .06BG vs. E+ NS NS NS NS NS
MARB Bermudagrass 3.98 ± .07 3.71 ± .07 3.74 ± .08 3.42 ± .09 3.71 ± .04Tall Fescue 4.00 ± .09 3.54 ± .08 3.65 ± .09 3.59 ± .10 3.69 ± .05BG vs. E+ NS NS NS NS NS
DP Bermudagrass 61.79 ± .27 62.41 ± .27 61.77 ± .29 61.61 ± .34 61.89 ± .16Tall Fescue 61.09 ± .32 62.08 ± .31 62.08 ± .35 61.47 ± .39 61.68 ± .18BG vs. E+ P < .10 NS NS NS NS
% CH Bermudagrass 46.80 ± .06 21.29 ± .06 30.92 ± .07 7.45 ± .07 26.62 ± .04 Tall Fescue 61.17 ± .07 14.05 ± .31 17.05 ± .08 12.10 ± .09 26.09 ± .04BG vs. E+ NS NS NS NS NS
a A=Angus grandparent, B=Brahman grandparent, breed of grandsire listed first.bHCW=hot carcass wt., lb; REA=longissimus muscle, in2; KHP=kidney, heart, pelvic fat, %; FAT=fat thicknessover, 12th rib, in; % CH= % Choice; YG=yield grade; MARB=marbling score (min. slight=3, min. small=4);DP=dressing percentage, %.
c NS=not significant.

Arkansas Animal Science Department Report 1999
129
Body Measurements as Tools for Prediction of aHeifer’s Probability of Calving
C.F. Rosenkrans, Jr.,1 A.H. Brown, Jr.,1 and Z.B. Johnson1
Story in Brief
Our objective was to determine if physical characteristics of heifers at weaning, and(or) as yearlingscould be used to select heifers that would calve as two-year olds. Data were collected on developing purebredAngus (n = 88), Charolais (n = 24), Hereford (n = 41), and Red Poll (n = 28) heifers. Each year (n = 3) heiferswere developed as contemporaries. At weaning and yearling the weight (WT), hip height (HH) and width(HW), and pelvic height (PH) and width (PW) were determined. Logistic regression analyses were used todetermine which traits were related to the probability of a heifer calving at two years of age. Heifers werecategorized based on calving status, No (heifer did not calve as a two-year-old) or Yes (heifer calved between22 and 27 months of age). Average values for the physical characteristics (WT, HH, HW, PH, and PW) of thetwo heifer groups did not differ at weaning or as yearlings. Based on the logistic regression, heifer age andPW at weaning and HW as yearlings were important (P < .05) sources of variation influencing her probabilityof calving as a two-year-old. For each day older at weaning, and each 1 inch increase in PW at weaning onewould expect a 1.03 and 3.08 increase in the odds of calving as a two-year-old, respectively. For each 1 inchincrease in yearling HW the odds of calving as a two-year-old increased with an odds ratio of 1.36 to one. Inconclusion, these data suggest that age and pelvic width at weaning, and hip width at yearling may be usefulin selecting replacement heifers.
Introduction
Selecting replacement heifers for cow-calf producers isvery critical for production efficiency. Unlike growth traits,reproductive traits have low coefficients of heritability re-sulting in slow and inefficient selection criteria. Therefore,if reliable indicators of reproductive success were available,herd reproduction might be improved by indirect selection.Producers have traditionally used a variety of methods forselecting replacement heifers. Those schemes have includedphysical measures such as weight and body condition score;physiological indicators such as blood constituents andprogesterone concentrations and (or) estrous detection; andmolecular/genetic markers such as have been developed forswine and sheep. Research has shown that heifers that attainpuberty early tend to breed earlier and are more reproduc-tively sound over their lifetime. Our objective was to deter-mine if physical characteristics at weaning and yearling couldbe used to determine the probability of heifers calving attwo years of age.
Materials and Methods
Data were collected from three consecutive years on de-veloping Angus (n = 88), Charolais (n = 24), Hereford (n =41), and Red Poll (n = 28) heifers at the Arkansas Agricul-
tural Experiment Station, Fayetteville. Heifers were born inthe spring and weaned in the fall of the year. After weaning,heifers were developed as contemporaries on commonbermudagrass (Cynodon dactylon) and tall fescue (Festucaarundinacea) which were over-seeded with winter annualsof wheat (Triticum acstiuum) and red clover (Trifoliumpratence). In addition to pasture, heifers received a dailysupplement consisting of cracked corn, soybean meal, vita-mins (A, B, and E), limestone, and molasses. Average dailysupplement on pasture from weaning (7 months of age) tobreeding (14 to 15 months of age) was .37% BW.75. Stock-ing rate on pasture was low (one heifer per acre) and dailyfeed was allocated when all heifers were present at the feedbunk and each heifer had 2 feet of linear bunk space.
Physical measurements of these heifers were determinedat weaning (approximately 7 months of age, range 195 to287 d) and yearling (approximately 11 mo of age, range 280to 399 d). Body weight (WT) was recorded. Pelvic height(PH) and width (PW) were measured per rectum using a RicePelvimeter. Body height (HH) and width (HW) at hips weremeasured using a sliding caliper developed specifically tomeasure external body dimensions in beef cattle.
Logistic regression analyses were used to determinewhich traits were related to a heifer’s probability of calvingas a two-year-old. Logistic regression is a form of statisticalmodeling that is often appropriate for categorical data (for
1 All authors are associated with the Department of Animal Science, Fayetteville.

AAES Research Series 470
130
instance: Did a heifer calve? (Yes or No). That type of analy-sis describes the relationship between a categorical responsevariable and a set of explanatory variables (in this case, age,WT, HH, HW, PH, and PW). The generated coefficients aresimilar to those obtained with multiple-regression analyses.Results are usually presented as an odds ratio which indi-cates the amount that a one unit increase (or decrease) in anexplanatory variable increases (or decreases) the odds of aresponse in the categorical variable. In addition to the oddsratio, logistic regression generates parameter estimates thatcan be used to predict an animal response (in this case calv-ing as a two-year-old).
Results and Discussion
Table 1 presents the means by calving group (Yes vs.No) for the explanatory variables evaluated in this experi-ment. While the heifers that did not calve had numericallylower weights and usually smaller body measurements thanthose heifers that calved, the values were not statisticallydifferent. Those findings indicate that individual measure-ments alone would not have been useful in predicting whichheifers should calve as a two-year-old.
Results of the logistic regression analysis are shown inTable 2. The explanatory variables retained in the model met
the entry level of P < .15 and entered the model in a forwardselection manner. Three variables were retained in this model;heifer age and pelvic width at weaning, and hip width as ayearling. Using the parameter estimates of Table 2, one canpredict the probability of an individual heifer calving (seeTable 3).
A general philosophy concerning replacement heifers isto select heifers on growth rates and weight; however, thatmanagement practice can result in sustainability problems.Previous work has shown that one can select for increasedpelvic area without increasing hip height or body weight,which should result in increased sustainability of the cow-calf operation. Our data suggest that pelvic width coupledwith heifer age and hip width may be used as an early pre-dictor of a heifer’s potential as a replacement cow. That in-formation used with more traditional selection criteria couldincrease overall profitability of the cow-calf operation.
Implications
These data suggest that age at weaning is an important traitin determining whether a heifer will calve as a two-year-old.Also that various body measurements at weaning or year-ling, particularly pelvic and hip width may be useful in se-lecting replacement heifers.
Table 1. Means for explanatory variables by calving status1.
Calved at two years of age No Yes
Explanatory variable Mean SE Mean SE
At weaningAge, days 237. 19.1 247.4 17.9Weight, lb 395.6 56.5 418.7 63.4Hip height, in 40.4 2.6 40.9 2.4Hip width, in 12.7 1.4 13.3 1.3Pelvic height, in 3.99 .75 3.94 .83Pelvic width, in 3.47 .38 3.73 .48At yearlingAge, days 334.2 26. 343.4 22.2Weight, lb 512.8 68.5 539.5 75.2Hip height, in 43.5 2.5 44.3 2.6Hip width, in 13.3 .9 13.7 1.Pelvic height, in 4.44 .65 4.36 .73Pelvic width, in 4.11 .31 4.3 .44
1 Data were collected on 181 purebred beef heifers, of which 66 did not calve as a two-year-old. Heifers (n =115) calving as two-year-olds averaged 24.7 months of age at calving with a range in age of 22 to 27 months.

Arkansas Animal Science Department Report 1999
131
Table 2. Results of logistic regression analysis1 using weaning and yearling data.
Explanatory variable DF Parameter estimate Odds ratio
Intercept 1 -15.5349Weaning
Age, d 1 .0329 1.033 Pelvic width, in 1 1.1239 3.077 Yearling
Hip width, in 1 .3094 1.363
1Reduced model using forward selection. Explanatory variables of Table 1 entered the model one at a timestarting with the variable with the largest chi-squared statistic. Variables continued to enter the model as longas the variable was significant for the specified level for entry. In this analysis that was 0.15. Once a variableentered the model it was not removed.
Table 3. Probability1 of a heifer calving at two years of age using combinations of age and pelvic widthat weaning and hip width at yearling.
Age, days 200 240 260Hip width, in 12 13 14 12 13 14 12 13 14
Pelvic width3.0 .13 .17 .22 .36 .44 .51 .53 .60 .673.2 .16 .21 .26 .42 .49 .57 .58 .65 .723.4 .19 .25 .31 14 .55 .63 .63 .70 .763.6 .23 .29 .36 .53 .61 .68 .69 .75 .803.8 .27 .34 .41 .59 .66 .72 .73 .79 .844.0 .32 .39 .47 .64 .71 .77 .77 .82 .864.2 .37 .45 .52 .68 .75 .80 .81 .85 .894.4 .43 .50 .58 .73 .79 .84 .84 .88 .914.6 .48 .56 .63 .78 .83 .87 .87 .90 .934.8 .53 .61 .68 .81 .86 .89 .89 .92 .945.0 .59 .67 .73 .84 .88 .91 .91 .93 .95
1Probabilities were calculated using the parameter estimates of Table 2 and the following formula.
Pr (calving) =e-15.5349 + .0329*(weaning age) + 1.1239*(pelvic width at weaning) + .3094*(hip width at yearling)
1 + e-15.5349 + .0329*(weaning age) + 1.1239*(pelvic width at weaning) + .3094*(hip width at yearling)

AAES Research Series 470
132
Evaluation of Hospital Treatment Regimens for theUniversity of Arkansas Beef Research Facility at Savoy
Sharon Copeland, Dianne H. Hellwig, Elizabeth B. Kegley, Zelpha B. Johnson, and Suzanne Krumpleman1
Story in Brief
Bovine respiratory disease (BRD) is a complex, economically important disease of stocker and feedlotcattle. Stress from shipping and co-mingling of cattle at livestock auctions predispose cattle to BRD (“ship-ping fever”). There are several respiratory viruses involved, which predispose the animal to secondary bacte-rial infections. The prevention of BRD involves vaccinations and minimizing animal stress. In the past fewyears, the use of antibiotics to mass medicate cattle that are at high risk for shipping fever has becomecommonplace. Concern has arisen that the bacteria involved will develop resistance to these antibiotics. TheUniversity of Arkansas Beef Research Unit has begun to notice a lack of clinical response with tilmicosin(Micotil®, Elanco Animal Health, Indianapolis, Indiana). This study was conducted to compare the efficacyof using tilmicosin vs. florfenicol (Nuflor® Schering-Plough Animal Health, Union, New Jersey) for theinitial treatment of BRD. Bacterial nasal cultures were obtained from the cattle each time they were treatedfor BRD. These cultures were examined for pathogens of respiratory significance and the possible develop-ment of antimicrobial resistance. Nineteen percent of both species of Pasteurella isolated were resistant totilmicosin. All of the respiratory isolates were susceptible to florfenicol.
1All authors are associated with the Department of Animal Science, Fayetteville
Introduction
Bovine respiratory disease (BRD) complex is the mosteconomically important infectious disease of weaned calvesand feedlot cattle (Morck et al., 1993). Pathogenic microor-ganisms and various stressors, such as shipping over longdistances and co-mingling with multi-source cattle, predis-pose cattle to BRD. Producers commonly refer to BRD as“shipping fever.”
Several viruses “set the stage” for BRD; however, threebacteria appear to be of major importance in the pathogen-esis of this disease complex; Pasteurella haemolytica, Pas-teurella multocida, and Haemophilus somnus (Andrews andKennedy, 1997). Consistent isolation of P. haemolytica haslead to the consensus that it is the most important bacterialcomponent of BRD(Confer et al., 1988). Conversely, P.multocida could be important in some outbreaks of stockerand feedlot respiratory disease (Allen et al., 1991). Its im-portance as a major respiratory pathogen is underemphasized.Many producers use a mass medication arrival program forcattle that are considered to be at high risk for BRD. Thereis concern that frequent and widespread usage of antimicro-bials will result in the development of resistant strains ofbacteria.
The Beef Research Unit at Savoy has increasingly noteda lack of clinical response with tilmicosin (D.H. Hellwig,
personal communication). To determine the extent of thisresistance, a study was conducted to compare tilmicosin withflorfenicol as the initial antimicrobial used for treating res-piratory disease.
Experimental Procedures
The study consisted of 96 bull stocker calves (approxi-mately 500 lb) that were shipped to the Savoy facility from asalebarn in central Arkansas. Upon arrival calves wereweighed, identified with ear tags, and randomized into oneof two treatment groups. Forty-eight hours after arrival, calveswere vaccinated with a modified-live vaccine which includedInfectious bovine rhinotracheitis (IBR), Parainfluenza virus
3
(PI3), Bovine viral diarrhea virus (BVDV), and Bovine res-
piratory syncycial virus (BRSV). Calves were also given vac-cinations for Pasteurella sp., Haemophilus somnus andClostridium sp. (“Blackleg”). The calves were de-wormedand horns were tipped. Two weeks after initial vaccinationviral and bacterial boosters were given, calves were branded,and bulls were castrated by banding. Six calves were placedin one of 16 randomized pens designated as either treatment1 or treatment 2. Calves were housed in dry lots and fed atotal mixed ration (Table 1). Calves in treatment 1 weretreated with tilmicosin (according to label directions) whensigns of BRD were first noted. Calves in treatment 2 were

Arkansas Animal Science Department Report 1999
133
treated with florfenicol. Subsequent treatments due to re-lapse consisted of ceftiofur (Naxcel®, Pharmacia & UpjohnAnimal Health, Kalamazoo, Michigan) on the first relapseand spectinomycin (Pharmacia & Uphohn Animal Health,Kalamazoo, Michigan) for the second relapse. No furthertreatments after the second relapse were administered. Thecriteria for BRD treatment included nasal/ocular discharge,depression, lack of appetite, and coughing. Calves with rec-tal temperatures of equal to or above 104°F. were treated withthe designated antimicrobial. Animals were treated andplaced in hospital pens, re-evaluated in 48 hours, and re-turned to their home pen if the rectal body temperature hadfallen below 104°F accompanied by improvement of clinicalsigns. Bacterial nasal cultures were collected by cleaningthe excess mucus discharge from one nostril and inserting aculture swab into the nasal cavity. Swabs were taken at thefirst treatment and at first and second relapses. Bacterialcultures were not obtained beyond the third treatment forBRD. The samples were taken to the Arkansas Poultry andLivestock Commission Diagnostic Laboratory in Springdale,Arkansas. Specific bacteria of interest were P. haemolytica,P. multocida and Haemophilus somnus. Antibiotic sensitivi-ties to tilmicosin and florfenicol were determined using theKirby-Bauer disc diffusion method (Bauer et al., 1966).
Results and Discussion
There were no statistical differences between treatment1 and treatment 2 for any of the parameters examined (Table2). Nearly 56% (55.8%) of the tilmicosin-treated calves and40.3% of the florfenicol-treated calves relapsed once (P =.18). The percentage of calves relapsing a second time was7.5% and 11% for tilmicosin and florfenicol, respectively (P= .67). The average medication costs per head for tilmicosinvs. florfenicol was $14.79 and $17.84, respectively. Aver-age daily gain (lb/head/day) and the cost of gain for thetilmicosin vs. florfenicol groups was 2.21 vs. 2.36 pounds(P = .29) and $ .69 vs $ .68 (P = .82) respectively. Finally,the average feed to gain ratio for the tilmicosin vs. florfenicolgroup was 6.21 vs. 6.05 (P = .55), respectively.
There were 31 P. multocida, 25 P. haemolytica, and 5Haemophilus somnus isolates cultured. Forty-seven of thePasteurella sp. isolates were tested for antimicrobial sensi-tivity to tilmicosin and florfenicol (Table 3). Nineteen per-cent (9/47) of the Pasteurella sp. isolated were resistant totilmicosin and 21% (10/47) were resistant to oxytetracycline.All of the isolates were sensitive to florfenicol. Isolates re-sistant to tilmicosin were sent to Elanco Animal Health, In-dianapolis, IN for further evaluation of the resistance pat-terns. Minimum inhibitory concentrations (MIC) were de-termined by Elanco. These isolates were determined to besensitive using this procedure.
For this group of calves, there was no difference be-tween tilmicosin and florfenicol with regard to the numberof relapses or performance parameters. Calves in both treat-ments experienced high morbidity and spent time in the hos-pital for further treatments.
There have been reports that florfenicol can depress feedintake. This was not found to be the case in this study, as theflorfenicol calves had a higher average daily gain. The highermedication costs for florfenicol in this study is a reflectionof the higher cost of the drug and not the frequency of itsuse.
Concerns have arisen that the pathogens associated withrespiratory illness are developing resistance to tilmicosin.This study indicated that there are a small percentage oftilmicosin-resistant Pasteurella isolates, determined with theKirby-Bauer procedure. The laboratory at Elanco AnimalHealth reported that the isolates that were sent to their labo-ratory were considered to be sensitive to tilmicosin usingthe MIC method. Laboratory (in vitro) sensitivities do notnecessarily reflect what is happening in the animal (in vivo).The sensitivity test is used as a guideline to choose the ap-propriate antimicrobial, but should be used in conjunctionwith sound clinical judgement. In this study, there was a lackof clinical response in the cattle from which tilmicosin-re-sistant Pasteurella were isolated. In addition, presence ofresistant isolates within a group of animals can cause prob-lems. These isolates may circulate through the group, mak-ing antimicrobial therapy more difficult and decreasing theproduction efficiency of the group.
There are additional reasons why antimicrobial treat-ment would appear to be ineffective. It should be pointedout that conditions at the beginning of the study were harsh.The weather was both cold and wet when the calves wereshipped and processed. The vaccinations administered at thebeginning of the study may not have worked as effectivelydue to the stressful conditions under which the calves wereprocessed. The lack of clinical response to either of the anti-microbials used may be due to the overwhelming pathogenload, preventing the antimicrobial from working at its maxi-mum potential.
Implications
The lack of response to tilmicosin seen in this study maybe due to antimicrobial resistance or exposure to a large num-ber of respiratory pathogens under highly stressful condi-tions. Careful consideration should be given when decidingwhich antimicrobial to use and whether or not a mass treat-ment program is warranted, in order to avoid the develop-ment of resistant respiratory pathogens.
References
Allen, J.W., et al., 1991. Can. J. Vet. Sci. 55:341-346Andrews, G.A. and G.A. Kennedy. 1997. Vet. Clin. North
Am. 13(3):515-548Confer, A.W., et al. 1988. Comp. Cont. Ed. Pract.Vet. 3(10):
S374 – 382Morck, D.W., et al. 1993. JAVMA 202(12):273-277Purdy, C.W., et al. 1989. AJVR 50(2): 221-225Schumann, F.J., et al. 1990. Can. Vet J. 31:285-288

AAES Research Series 470
134
Table 1. Ration.
Ingredient %
Corn, cracked 53.42Cottonseed hulls 30Soybean meal 11Molasses, blend of cane and beet 4.1Dicalcium phosphate 0.4Limestone 0.85Salt, white 0.15Vitamin premixa 0.075Trace mineral premixb +Bovatecc +
a Vitamin premix provided 4,400 IU vitamin A, 880 IU vitamin D, and 11.6 IU vitamin E/kg of rationb Trace mineral premix added 26 mg zinc and 0.1mg selenium/kg of rationc Added to provide 33.6 mg lasalocid/kg ration
Table 2. Comparison of mean values (± SE) for calves treated with tilmicosina or florfenicolb.
1st 2nd Medication Cost of Feed:Gain ADGRelapse Relapse Cost Gain (lb feed/ (lb/head/d)
Treatment (%) (%) ($/head) ($/head) lb gain)
Tilmicosin 55.8 ± 3.0 7.5 ± 6.0 14.79 ± 1.08 .69 ± .11 6.2 ± 0.2 2.2 ± 0.2Florfenicol 40.3 ± 3.5 11.0 ± 4.9 17.84 ± 9.02 .68 ± .11 6.1 ± 0.1 2.4 ± 0.2
a Micotil®, Elanco Animal Health, Indianapolis, Indianab Nuflor®, Schering-Plough Animal Health, Union, New Jersey
Table 3. Resistant and susceptible strains of bacterial isolates to tilmicosin and florfenicola.
Bacteriab (no. isolates) Tilmicosin FlorfenicolRb Sb R S
P. haemolytica (20) 6 14 0 20P. multocida (27)c 3 24 0 27H. somnus (5) 0 5 0 5
a Sensitivity determined using the Kirby-Bauer method. Only bacterial isolates of respiratory significance wereexamined for antimicrobial sensitivity.
b R = resistant, S = susceptible.c Two isolates had intermediate sensitivity to tilmicosin.

Arkansas Animal Science Department Report 1999
135
Reduction of E. coli and Salmonella typhimurium inGround Beef Utilizing Antimicrobial Treatments
Prior to Grinding1
Fred W. Pohlman2, Matt R. Stivarius2, Kathy S. McElyea2, Jason K. Apple2,Michael G. Johnson3, and Amy L. Waldroup4
Story in Brief
The objective of this study was to determine the impact of different antimicrobial treatments and vacuumtechnology on the reduction of microflora in ground beef. Beef trimmings from mature cows were frozen at–20°C, thawed to 4°C and inoculated with E. coli (11775 ATCC) and Salmonella typhimurium (Nalidixic acidresistant). The trimmings were mixed with antimicrobial treatments by vacuum tumbling or aerobic tum-bling for 3 minutes. Specific antimicrobial treatments evaluated were a control, 5% lactic acid, hot water(82.2 oC), 10% trisodium phosphate (TSP) and .5% cetylperidinium chloride (CPC). Beef trimmings werethen twice ground through a 1/8-inch plate, aerobically packaged and displayed in simulated retail storagefor seven days. Samples were evaluated on days 0, 1, 2, 3, and 7 for aerobic, E. coli, Salmonella andcoliform counts. Lactic acid, CPC, and TSP were effective at reducing E. coli, coliform and aerobic platecounts through seven days of storage. Likewise, CPC and TSP reduced Salmonella counts through storage.There was no difference in the vacuum vs. aerobic treatments for microbial data. Therefore, use of cetylpy-ridinium chloride or trisodium phosphate prior to grinding may provide an inhibition for the outgrowth of E.coli and Salmonella in ground beef during refrigerated storage.
Introduction
Food safety is an issue important to consumers as wellas the animal/meat industry. Outbreaks of food borne illnessesassociated with meat and corresponding product recalls havecaused lost revenue for processors and have negatively af-fected consumer perception of beef. Two microorganismsassociated with food borne illness in fresh meat, particularlyground beef, have been pathogenic E. coli and Salmonella.While a number of technologies have been investigated fordecontaminating beef carcasses (Gorman et al., 1995; Prasaiet al., 1991; and Phebus et al., 1997), concern still existswith regard to microbial populations on finished products.Although the beef industry has embraced technologies suchas steam pasteurization and organic acid rinses for decon-taminating beef carcasses, there is a need for microbial in-terventions near the end of the ground beef production sys-tem. Most technologies investigated thus far have targetedmicroorganisms attached to the surface of the carcass. Un-fortunately, microorganisms that have penetrated to subsur-face levels may be afforded greater protection against anti-microbial treatments. Therefore, the objective of this research
was to evaluate the impact of microbial interventions andvacuum technology to decontaminate surface and subsur-face microorganisms prior to grinding and packaging onground beef preservation and shelf life.
Experimental Procedures
Boneless, frozen cow beef trim (–20 °C) was thawed to4°C and inoculated with a nalidixic acid resistant Salmonellatyphimurium and E. coli (ATCC #11775). Innoculums wereprepared from frozen (-80°C) stock cultures that were main-tained by brain heart infusion (BHI) broth with glycerol(20%). Frozen cultures of Salmonella typhimurium and E.coli (ATCC #11775) were thawed and .1 ml of each culturewere inoculated into separate 40 ml aliquots of BHI brothfor 24 hours. Bacteria were harvested by centrifugation(4000g x 20 minutes @ 37°C), re-suspended in the samevolume of .1% peptone water and pooled together to make abacterial cocktail. The cocktail was cooled to a temperatureof 4 °C and combined with the meat and allowed to attach for1 hour. Meat samples were then drained and separated into
1 Appreciation is expressed to the Arkansas Beef Council for funding of this study. Additionally, the authors would like to express appreciationto L. K. Rakes, R. P. Story, Jr., A. Ivey, J. Davis, J. Stephenson, L. McBeth, S. Krumpelman and J. Morris for their assistance in conductingthe study. Special appreciation is extended to Z. Johnson for statistical consultation and analysis.
2 Department of Animal Science, Fayetteville.3 Department of Food Science, Fayetteville.4 Department of Poultry Science, Fayetteville.

AAES Research Series 470
136
10-lb batches and placed in a 4 °C cooler overnight to allowfurther microbial attachment.
Ten-pound meat batches were next placed individuallyinto a tumbler, and combined with 400 ml of deionized wa-ter (control), 5% lactic acid (vol:vol), 10% trisodium phos-phate (vol:vol), 0.5% cetylpyridinium chloride (vol:vol), orhot water (82.2°C). A vacuum (20 in Hg) was pulled on eachbatch and allowed to tumble at 16 rpm for 3 minutes. Fornon-vacuum treatments, each antimicrobial batch was placedinto the tumbler container and tumbled without a vacuum asdescribed above. After tumbling, meat was removed fromthe tumbler container then ground twice through a 1/8”grinder plate. Samples were then packaged (l lb per pack-age) in oxygen permeable tray overwrap packages and storedunder warm white fluorescent lights in a cooler at 4°C tosimulate retail storage. On days 0, 1, 2, 3, and 7 of simulatedretail storage, 25 g ground beef samples were placed intowhirlpack bags with 225 g of .1% buffered peptone waterand buffered to a pH of 7 with sodium hydroxide. Serialdilutions and subsequent platings were made on SalmonellaShigella agar containing nalidixic acid, Petrifilm (3M Co.)aerobic plate count plates and Petrifilm (3M Co.) E. coli/Coliform plate count plates. Plates were incubated at 37 oC.Aerobic plate count plates and Salmonella Shigella agarplates were read at 48 hours, while E. coli plates were readat 24 hours. Counts were recorded as colony forming unitsper gram (CFU/g), then transformed to log counts prior todata analysis. This experiment was replicated three times.The randomized complete block 2 (vacuum vs. no vacuum)x 5 (control, cetylpyridinium chloride, hot water, lactic acidor trisodium phosphate) factorial experimental design wasanalyzed using the GLM procedure of SAS (1988). Leastsquare means were generated and separated using the PDIFFoption of PROC GLM.
Results and Discussion
Since no treatment interactions were found (P > .05),treatment least-square means were generated and separatedas previously described. Figures 1 and 2 show the effects ofaerobically applied or anaerobically applied antimicrobialagents on E. coli populations through simulated retail stor-age. For both aerobic and anaerobic treatments, cetylpyri-dinium chloride, lactic acid and trisodium phosphate wereeach effective at reducing (P < .05) E. coli populationsthrough 7 d of simulated retail storage. The control and hotwater treatments were not as effective at inhibiting E. coliand allowed for E. coli growth through the first day of stor-age. However, although cetylpyridinium chloride, lactic acidand trisodium phosphate were each effective at reducing (P< .05) E. coli populations through seven days of storage, themagnitude of difference between treatments were small. Thisis in agreement with Brackett et al. (1994), and Conner etal.(1996) who found little differences with chemical treat-ments in ground beef systems.
For both aerobically applied or anaerobically appliedtreatments, cetylpyridinium chloride and trisodium phosphate
each had lower (P < .05) Salmonella counts than either thecontrol, hot water or lactic acid treatments through 7 days ofstorage (Figs. 3 and 4). Also, for each antimicrobial treat-ment as well as the control, Salmonella counts declined by 1log through storage. This downward trend in Salmonellanumbers through storage for all treatments may be due tocompetitive inhibition of Salmonella by other microorgan-isms.
As with E. coli, cetylpyridinium chloride, lactic acidand trisodium phosphate were each effective at reducing (P< .05) aerobic bacteria through refrigerated storage comparedwith the control or hot water treatments (Figs. 5 and 6). Asone might expect, the aerobically applied treatments tendedto have slightly greater aerobic plate counts than the anaero-bically applied treatment.
Cetylpyridinium chloride, lactic acid and trisodiumphosphate were also more effective (P < .05) at inhibitingcoliform bacteria than either the control or hot water treat-ments (Figs. 7 and 8). Since coliform contamination prima-rily comes from fecal contamination during carcass dress-ing, this data would suggest that antimicrobial interventionsmight be more effective than hot water application for re-ducing coliform numbers. Likewise, coliform counts tendedto be inhibited more by vacuum application in the controland hot water treatments through refrigerated storage, al-though not statistically significant (P > .05). Therefore, useof cetylpyridinium chloride or trisodium phosphate prior togrinding may provide an inhibition for the outgrowth of E.coli and Salmonella in ground beef during refrigerated stor-age.
The effect of vacuum treatment with antimicrobialagents on microbial log count of ground beef through simu-lated retail storage is presented in Table 1. Vacuum applica-tion had no effect on E. coli, Salmonella, aerobic plate countor coliform counts through seven days of simulated retailstorage.
Implications
Data from this study suggest that the use of cetylpyri-dinium chloride or trisodium phosphate prior to grinding mayprovide an inhibition for the outgrowth of E. coli and Sal-monella in ground beef during refrigerated storage. There-fore, use of these antimicrobials, perhaps in addition to car-cass decontamination technologies, may provide an addi-tional measure of meat safety.
References
Gorman, B.M., et al. 1995. J. Food Prot. 58:984Prasai, R.K., et al. 1991. J. Food Prot. 54:868Phebus, R.K., et al. 1997. J. Food Prot. 60:476Brackett, R.E., et al. 1994. J. Food Prot. 54:198Conner, D.E., et al. 1996. J. Food Prot. 60:1560Dorsa, W. J., et al. 1996. J. Food Prot. 60:619Breen, P.J., et al. 1995. J. Food Sci. 60:1191SAS. 1988. SAS Inst. Inc., Cary, North Carolina

Arkansas Animal Science Department Report 1999
137
Table 1. Effect of vacuum treatment with antimicrobial agents on microbial log count of ground beefthrough simulated retail storagea.
Antimicrobial applicationAerobic Vacuum
E. coli, log CFU/g 6.3 6.3Salmonella, log CFU/g 5.5 5.5Aerobic plate count, log CFU/ g 6.8 6.8Coliform count, log CFU/g 6.0 5.9
aMeans within the same row do not differ (P > .05)
Fig. 1. Effect of aerobically applied antimicrobial agents on E. Coli populations throughsimulated retail storage.

AAES Research Series 470
138
Fig. 2. Effect of vacuum applied antimicrobial agents on E. Coli populations throughsimulated retail storage.
Fig. 3. Effect of aerobically applied antimicrobial agents on Salmonella populationsthrough simulated retail storage.
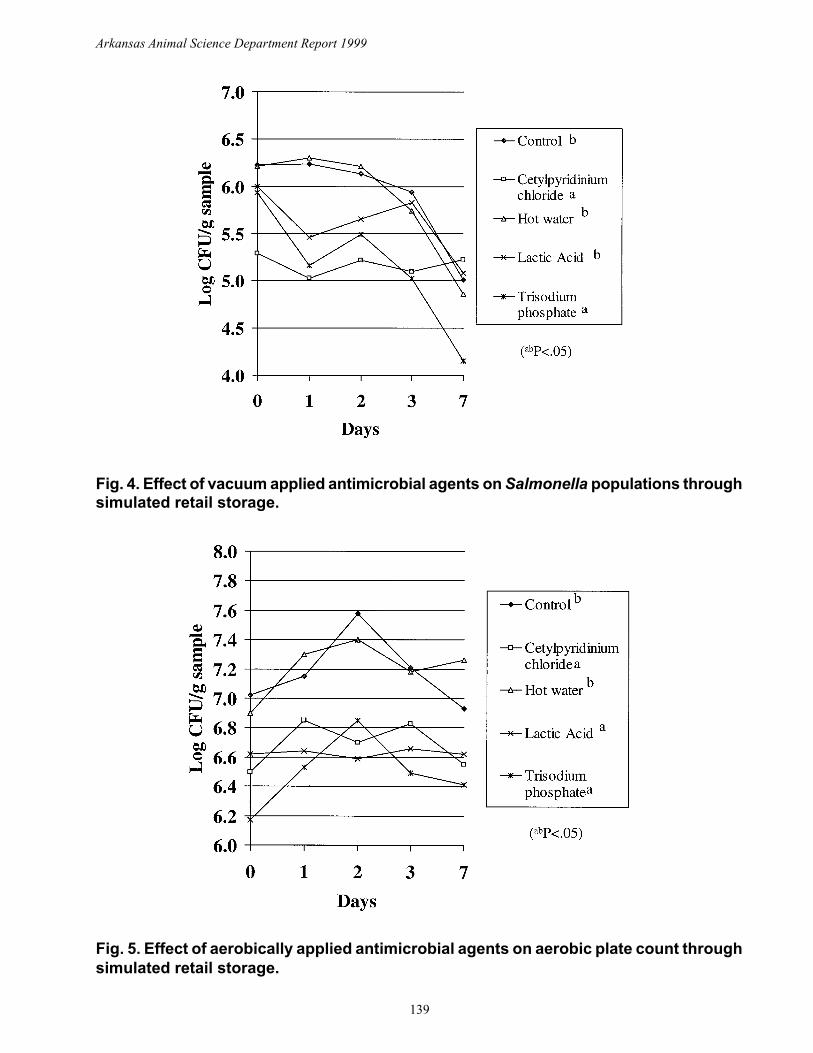
Arkansas Animal Science Department Report 1999
139
Fig. 4. Effect of vacuum applied antimicrobial agents on Salmonella populations throughsimulated retail storage.
Fig. 5. Effect of aerobically applied antimicrobial agents on aerobic plate count throughsimulated retail storage.

AAES Research Series 470
140
Fig. 6. Effect of vacuum applied antimicrobial agents on aerobic plate count throughsimulated retail storage.
Fig. 7. Effect of aerobically applied antimicrobial agents on coliform count throughsimulated retail storage.

Arkansas Animal Science Department Report 1999
141
Fig. 8. Effect of vacuum applied antimicrobial agents on coliform count throughsimulated retail storage.

AAES Research Series 470
142
Performance and Ensiling Characteristics of Tall GrowingSoybean Lines Used for Silage
Venerand Nayigihugu1, Wayne Kellogg1, David Longer2, Zelpha Johnson1,and Karen Anschutz1
Story in Brief
Seven tall growing soybean (Glycine max [L.] Merr.) lines, including the cultivars ‘Derry’, ‘Donegal’,and ‘Tyrone’ plus the experimental lines ‘OR 5-12-1T’, ‘OR 13-12-3’, ‘OR 19-12-2’ and ‘PA 5-2-1’, wereensiled and tested for nutritive quality to evaluate the potential of these lines as silage crops. The trialincluded a grain type soybean (‘Hutcheson’) and sorghum (Sorghum bicolor [L.] Moench) (‘Pioneer 838 F’)varieties as checks. Lines were replicated four times at sites near Fayetteville and Rohwer, Arkansas in 1995and 1996. Forages were harvested at full seed (soybean growth stage R-6) and ensiled for 33 days. Therewas no clear advantage to selecting a specific line of tall soybean because interactions between lines andyears occurred, so data is presented separately. The three cultivars Derry, Donegal, and Tyrone producedaverage DM yields of 4,678, 6,356, and 6,162 lb/acre at Fayetteville and 6,018, 5,713, and 6,018 lb/acre atRohwer, respectively. The tallest entries grown in Fayetteville were Tyrone and ‘OR 13-12-3’, while Derrywas tallest at Rohwer in 1995. Mean concentrations of ADF in silage from Derry, Donegal, and Tyrone were33.0, 33.6, and 33.2% at Fayetteville and were 33.9, 37.0, and 31.3% at Rohwer. Mean concentrations of CPin silage from Derry, Donegal, and Tyrone were 12.6, 14.2, and 14.0% at Fayetteville and were 13.8, 16.0,and 13.7% at Rohwer. Average IVDMD of silage from Derry, Donegal, and Tyrone were 70.4, 72.1, and70.6% at Fayetteville and were 63.0, 66.8, and 62.5% at Rohwer. Silage for all lines was well preserved asindicated by the low final pH and a high lactic acid concentration. Silage type soybeans should compete forlight better than the grain type soybeans when grown with crops like corn or sorghum. This should improveconcentration of CP of the companion crop and the silage mixture and produce high DM yields.
Introduction
New lines of soybean (Glycine max [L.] Merr.) havebeen selected specifically for use as forage rather than graincrops. Three cultivars, ‘Derry’, ‘Donegal’ and ‘Tyrone’, havebeen released for forage production. In contrast to corn (Zeamays) and sorghum (Sorghum bicolor [L.] Moench), soy-bean is a legume crop that fixes atmospheric nitrogen. Le-gumes reduce the need for extensive field application of ni-trogen and produce forage with higher protein concentrationthan corn or sorghum.
Most of the research on soybeans as a forage crop hasfocused on its value as hay (Hubbell et al., 1988). However,soybeans have been inter-cropped with sorghum (Coats,1966) or with corn (Christosov, 1972; Wiggans, 1935) toimprove the protein concentration of silage. Total digestiblenutrients (TDN) increased in silage when corn and soybeanwere inter-cropped compared to growing either crop alone(Wiggans, 1935). There has been limited research on soy-bean for silage, however grain type soybean cultivars were
grown in monoculture and evaluated for nutrient content(Coffey et al., 1995a) and for in vitro digestibility and for-age preference by sheep (Coffey et al., 1995b).
The soybeans used for silage in this study were devel-oped by Thomas Devine (USDA/ARS) in Beltsville, Mary-land. These recently developed tall soybean lines have at-tained heights up to 82 in and should compete favorably forlight when inter-planted with corn or sorghum. A mixed cropcontaining a legume should require less nitrogen fertiliza-tion, and protein levels of the harvested silage should beimproved relative to corn or sorghum. Therefore, the objec-tives of this study were to evaluate the performance and theensiling characteristics of seven tall growing soybean linesand compare these values to a grain type soybean and to aforage type sorghum.
Materials and Methods
Seven tall growing soybean lines were grown at twolocations in Arkansas (the Arkansas Agricultural Experiment
1 Department of Animal Science, Fayetteville.2 Crop, Soil, and Environmental Sciences Department, Fayetteville.

Arkansas Animal Science Department Report 1999
143
Station in Fayetteville and the Southeast Research and Ex-tension Center, Rohwer Division) in 1995, and five lines weregrown in 1996. The seven lines consisted of three cultivars(Derry, Donegal and Tyrone) and four experimental lines (‘PA5-2-1’, ‘OR 5-12-1T’, ‘OR 13-12-3’, and ‘OR 19-12-2’) andwere ensiled and tested for nutritive quality and comparedto a typical grain type soybean (‘Hutcheson’) and a foragesorghum (‘Pioneer 838 F’) in 1995. Seed was not availableto plant ‘OR 13-12-3’ and ‘OR 19-12-2’ the second year.Each line was replicated four times at each site. Other agro-nomic techniques and plot management can be found in Table1.
Whole-plant soybeans were harvested at full seed (R-6;Fehr and Caviness, 1977), chopped, and packed in 3-mil stan-dard barrier bag silos. Approximately 1.03 X 10⁻⁵ Pa ofvacuum was applied to each bag using vacuum pump de-signed for a portable milking machine. Forages were allowedto ferment at room temperature. Silos were sampled on day33, silage pH was determined, and approximately 450 g ofsample were frozen in 2-mil sealable plastic bags maintainedat -10°C. An aqueous extract was obtained by blending 50 gof frozen sample with 225 ml of distilled water for 2 min-utes in a blender and straining the mixture through four lay-ers of cheesecloth (Parker, 1981). Acetic and lactic acid con-centrations were determined by gas chromatography (Parker,1981; Supelco, 1975; 1990) on 1995 silage samples. Later,remaining frozen silage samples were weighed, freeze-dried,and weighed again for moisture determination. Dry sampleswere ground for chemical analyses, and CP (AOAC, 1984),ADF, and NDF (Goering and Van Soest, 1970) were deter-mined. The IVDMD was determined by procedures outlinedby Marten and Barnes (1979).
Data were subjected to analysis of variance (ANOVA)using the GLM procedure of SAS (1985). All reported ef-fects were significant at (P < .05).
Results and Discussion
Because significant interactions occurred between linesand years, means for each year are presented separately inTables 2 to 5. Interactions may be due to varying responseto climatic conditions. Tall soybean types tested in this studyperformed well, as indicated by their DM yields. Among thesesoybeans, DM yield was highest for Tyrone and ‘OR 5-12-1T’ and was lowest for Derry when grown at Fayetteville in1995 (Table 2). In 1996, Donegal produced the highest DMyields at Fayetteville (Table 3). However, in 1995, Derry wasthe highest yielding silage type at Rohwer, and ‘OR 13-12-3’ was the lowest (Table 4). In 1996 ‘OR 5-12-1T’ and ‘PA5-2-1’ produced more DM than Donegal or Tyrone whengrown in Rohwer (Table 5). This is a typical genotype xenvironment interaction. In 1995, the grain type soybean,Hutcheson, produced the highest DM yield of all soybeanlines at Rohwer (Table 4) but was the lowest in DM yield atFayetteville (Table 2). Hutcheson was the shortest at bothlocations in 1995 (the only year that heights were measured),averaging 30 and 28 in tall at Fayetteville (Table 2) and
Rohwer (Table 4), respectively. Tyrone and ‘OR 13-12-3’were the tallest (56 and 53 in, respectively) when grown atFayetteville in 1995, while Derry produced the tallest plants(78 in) at Rohwer.
The ADF percentages for Donegal were higher than for‘OR 13-12-3’ and ‘OR 19-12-3’ among silage type soybeansgrown at Fayetteville in 1995 (Table 2). However, in 1996ADF concentrations of Donegal and ‘PA 5-2-1’ were lowerthan Derry and ‘OR 5-12-1T’ (Table 3). Of the silage typesoybeans grown at Rohwer, Donegal and ‘PA 5-2-1’ con-tained the lowest concentrations of ADF in 1995 (Table 4),and 'Donegal was lowest in ADF concentration in 1996 (Table5).
In 1995, percentages of NDF were similar for all silagetypes grown at Fayetteville (Table 2). In 1996 Donegal and‘PA 5-2-1’ contained the lowest concentration of NDF whileDerry and ‘OR 5-12-1T’ had the highest percentages of NDFof silage type soybeans grown at Fayetteville (Table 3). BothDonegal and ‘PA-5-2-1’ contained lower NDF percentagesthan Derry and Tyrone when grown at Rohwer during eitheryear (Table 4 and 5).
There were no differences among CP concentrations ofDonegal, Tyrone, ‘OR 19-12-3’, and ‘PA 5-2-1’ at Fayettevillein 1995, and CP concentrations of Derry, ‘OR 5-12-1T’, and“OR 13-12-3’ were lowest among silage type lines (Table2). Values ranged from 14.0 to 15.9% CP for the silage typescompared to 17.5 for Hutcheson. In 1996 percentages of CPranged from 11.9 for Derry to 13.7 for Donegal when grownat Fayetteville compared to 13.2 for Hutcheson (Table 3). In1995 Donegal and ‘PA 5-2-1’ had higher CP concentrationswhen grown at Rohwer than other silage type lines (Table4). The range in CP values of silage type soybeans was from11.6 for Tyrone to 16.2 for ‘PA 5-2-1’, while Hutcheson con-tained 15.8% CP. In 1996 CP concentration of ‘OR 5-12-1T’ was lower than other silage type soybeans (Table 5). Therange in CP values of silage type soybeans was from 13.8for ‘OR 5-12-1T’ to 16.0 for Donegal, while Hutcheson con-tained 16.6% CP.
In 1995, percentages of IVDMD were similar for allsilage type lines grown at Fayetteville (Table 2). In 1996 atFayetteville, Donegal had the highest percentage of IVDMDwhile Tyrone was lowest in IVDMD among silage type soy-beans (Table 3). Of the silage type soybean lines grown atRohwer in 1995, Derry, Tyrone, and ‘OR 5-12-1T’ had lowerpercentages of IVDMD than ‘OR 19-12-2’ (Table 4). In 1996at Rohwer, Derry, Donegal, and Tyrone had higher IVDMDpercentages than ‘PA 5-2-1’ and ‘OR 5-12-1’ (Table 5).
None of the three released cultivars had a clear advan-tage at both locations. Either Donegal or Tyrone performedbetter and had at least equal nutritive value compared to Derrywhen grown at Fayetteville, while Donegal had lower fiberconcentration and higher protein concentration which pro-vided a higher IVDMD percentage at Rohwer compared tothe higher producing cultivar, Derry, or to the cultivar Tyrone.
All lines produced silage that was adequately preserved,as indicated by pH. After 33 d of ensiling, means of pH andlactic acid in soybean silage ranged from 4.3 to 4.7 and from

AAES Research Series 470
144
.9 to 1.3%, respectively (Table 6). Apparently, there wasenough fermentable carbohydrate for proper fermentationby lactic acid bacteria (Lactobacillus ssp.), so these mea-sures of acid production were not repeated the second year.
This study confirms that the grain type soybean pro-duced higher CP than tall soybean lines. The seeds are veryhigh in protein, so this is not surprising. Hutcheson wasshorter and had bigger pods and more grain than tall soy-beans. While Hutcheson is bred to produce grain, the silagetypes are bred to produce stems and leaves. As the soybeanplant matures NDF and ADF concentration increases, whileCP concentration decreases for leaf and stem components.The greatest changes occur as soybean plants mature fromstage R5 to stage R7 (Munoz et al., 1983). The pod compo-nent shows an opposite trend, with NDF and ADF concen-trations decreasing and an increase of CP concentration.
Implications
Lower ADF and higher CP concentrations are associ-ated with improved nutritive quality and are usually inverselyrelated in forage crops. Most of the tall soybean lines testedexhibited good performance in this area. This is based onplant heights and acceptable nutritive quality. Silages werepreserved adequately, as indicated by the silage pH, and vola-tile fatty acid and lactic acid concentrations were indicativeof silage that had fermented well. Of the tall soybeans tested,‘PA-5-2-1’and Donegal had consistently higher nutritivevalues at both locations for two consecutive years than othersilage type soybeans. However, each of the soybean typestested in this experiment would dramatically improve theprotein content of corn or sorghum when grown together.Plant height and yield of tall growing soybeans are impor-tant traits to consider when inter-cropping with either cornor sorghum with soybeans. Tall growing soybeans reportedin this study produced DM yields up to 8234 lb/acre at heightsup to 78 in. These two traits, together with CP and digest-ibility are important factors that need to be considered wheninter-cropping soybean and corn or sorghum for silage.
Literature Cited
Coats, R.E. 1966. Sorghum-soybean combination. Missis-sippi Agric. Exp. Sta., Ann. Rep., p.6.
Christosov, A. 1972. Influence of plant density in post-harvest maize-soybean mixed crops upon the yield andfeed value of silage. Plant Sci. 9:136.
Coffey, K.P., G.V. Granade, and J.L. Moyer. 1995a. Nutri-ent content of silages made from whole-plant soybeans.Prof. Anim. Sci. 11:74.
Coffey, K.P., G.V. Granade, and J.L. Moyer. 1995b. In vitrodigestibility and preference by sheep for silages madefrom whole-plant soybeans. Prof. Anim. Sci. 11:81.
Hubell, D., J.M. Rakes, O.T. Stallcup, L.B. Daniels, and K.E.Harrison. 1988. Soybean hay made from plants inbloom and pod stage in diets of lactating cows. Nutr.
Rep. Internat. 37:537.Goering, H.K., and P.J. Van Soest. 1970. Forage fiber analy-
sis (apparatus, reagent, procedures, and some applica-tion). Agric. Handbook 379. ARS/USDA, Washing-ton, D.C.
Martens, G.C., and R.F. Barnes. 1979. Prediction of energydigestibility of forages with in vitro rumen fermenta-tion and fungal enzymatic systems. pp. 61-71. In:Pigden, W. J., et al. ed., Standardization of Anal.Methodol. of Feeds. Ottawa, Canada.
Munoz, A.E., E.C. Holt, and R.W. Weaver. 1983. Yield andquality of soybean hay as influenced by stage of growthand plant density. Agron. J. 75:147.
Parker, R.B. 1981. Methodology for determining quality ofsilage. Nat. Feed Ingredients Assoc., West Des Moines,Iowa.
SAS. 1985. SAS User’s Guide: Statistics. SAS Inst., Inc.Cary, North Carolina.
Supelco. 1975. GC separation on VFA C2-C5. GC Bull. 749F.Supelco. 1990. Analyzing fatty acids by packed column gas
chromatography. GC Bull. 856 A.Walter, R.F., and C.E. Caviness. 1977. Stages of Soybean
Development. Coop. Ext. Rep., Iowa State Univ., Spe-cial Rep. 80:1-12.
Wiggans, R.G. 1935. Combinations of corn and soybeansfor silage. Cornell Univ., Agric. Exp. Sta., pp. 1-34.

Arkansas Animal Science Department Report 1999
145
Table 1. Plot management and agronomic practices used for Rohwer andFayetteville in 1995 and 1996.
Location Rohwer Fayetteville 1995 1996 1995 1996
Soil name and type Desha silt loam Desha silt loam Johnsburg Silt Loam Captina Silt LoamReplications 4 4 4 4Section of row harvested 39 in 39 in 39 in 39 inHerbicide Treflan, 4.57 qt/A Dual, 6.11 qt/A Roundup, 6.11 qt/A Roundup, 6.11 qt/A
and rate Scepter, 1.02 qt/A Roundup, 15.2 lb/A Treflan, 3.81 qt/A Treflan,3.81qt/AReflex, 4.57 qt/A Scepter, .914 lb/A Scepter, .914 lb/A Basagran, 4.57 qt/A
Seeding rate Soybean- Soybean- Soybean- Soybean-3 seeds/ft row 3 seeds/ft row 3 seeds/ft row 3 seeds/ft rowSorghum- Sorghum- Sorghum- Sorghum--6 seeds/ft row -6 seeds/ft row -6 seeds/ft row -6 seeds/ft row
Fertilizer usedand rate None None 0 – 40 – 0 0 – 40 – 60
Plot size 4 rows, 78 in long 4 rows, 78 in long 4 rows, 78 in long 4 rows, 78 in longPlanting dates May 12 May 13 May 14 May 24Harvesting
dates (R-6) August 24 orSeptember 13 September 6 September 22 September 14
Row spacing 38 in 38 in 38 in 38 in
Table 2. Nutrient composition, heights, and DM yields of silage from soybean lines grown atFayetteville in 1995.
DMDM ADF NDF CP IVDMD Height yields
Soybean lines (%) (%) (%) (%) (%) (in) (lb/acre)
PA 5-2-1 35.2a 32.7bcd 39.7b 14.8bcd 70.2abc 39b 4482c
Donegal 34.9a 34.4abc 42.1b 14.7bcd 72.9ab 37c 4478c
OR 5-12-1T 34.6a 30.8cd 41.5b 14.3cd 65.4bc 49ab 5231b
Tyrone 31.6b 33.1bcd 40.2b 15.7bc 73.2ab 56a 5490b
Derry 31.8b 32.1bcd 40.1b 14.0d 71.7ab 44b 3138d
OR 13-12-3 32.8b 29.9d 39.8b 14.4cd 72.5ab 53a 4637c
OR 19-12-2 30.4bc 29.7d 38.4b 15.9b 68.9bc 46b 4612c
Hutcheson 30.3c 35.8ab 34.2c 17.5a 75.7a 30c 2744c
Pioneer 838 F 21.3d 38.6a 64.1a 7.0c 54.2d - 6678a
abcde Means within the same column with different superscripts are different (P < .05).

AAES Research Series 470
146
Table 3. Nutrient composition and DM yields of silage from soybean linesgrown at Fayetteville in 1996.
DMDM ADF NDF CP IVDMD yields
Soybean lines (%) (%) (%) (%) (%) (lb/acre)
PA 5-2-1 34.4a 30.5c 41.7c 13.4a 69.4b 6800c
Donegal 32.2b 30.8c 45.6a 13.7a 71.4a 8234a
OR 5-12-1T 31.2bc 33.4a 43.9b 12.6b 68.8b 6682c
Tyrone 32.4ab 33.2b 46.0a 12.3b 68.1c 6802c
Derry 29.3c 33.9a 43.5b 11.9c 69.2ab 6177d
Hutcheson 31.5bc 28.8c 37.7d 13.2a 72.6a 6399cd
Pioneer 838 F 28.8c 24.3d 48.0a 6.2d 70.7ab 7499b
abcde Means within the same column with different superscripts are different (P < .05).
Table 5. Nutrient composition, heights, and DM yields of silage from soybean linesgrown at Rohwer in 1995.
DMDM ADF NDF CP IVDMD Height yields
Soybean lines (%) (%) (%) (%) (%) (in) (lb/acre)
PA 5-2-1 28.5bc 34.3d 43.5d 16.2a 62.3abc 54c 6689cd
Donegal 29.7abc 34.1d 46.5cd 16.0a 57.4bcd 61d 6497d
OR 5-12-1T 30.1abc 38.8b 48.1bc 13.2ab 54.5d 74b 6054e
Tyrone 30.3abc 40.1a 50.1ab 11.6d 54.7cd 69c 6518d
Derry 32.8a 38.1b 50.2ab 12.1cd 55.5cd 78a 6977c
OR 13-12-3 32.3ab 40.1a 48.1bc 11.9d 59.0bcd 70c 5684f
OR 19-12-2 27.4c 37.7c 48.9bc 13.8b 64.0ab 26ab 6364d
Hutcheson 28.0c 32.5b 45.1cd 15.8a 68.0a 28f 8313b
Pioneer 838 F 30.3abc 31.7c 53.7a 6.1c 58.5bcd - 19307a
abcdef Means within the same column with different superscripts are different (P < .05).

Arkansas Animal Science Department Report 1999
147
Table 5. Nutrient composition and DM yields of silage from soybean lines grown at Rohwer in 1996.
DMDM ADF NDF CP IVDMD yields
Soybean lines (%) (%) (%) (%) (%) (lb/acre)
PA 5-2-1 30.8a 31.1c 40.2d 15.9a 54.6b 5382a
Donegal 32.6a 28.5d 42.6c 16.0a 74.1a 4929b
OR 5-12-1T 33.4a 35.0a 45.7a 13.8b 67.3b 5599a
Tyrone 30.9b 34.0b 46.1a 15.8a 70.6a 4753b
Derry 33.2a 29.6c 44.6b 15.6a 70.6a 5059ab
Hutcheson 32.0a 29.8c 38.5d 16.6a 74.4a 5532a
Pioneer 838 F 32.3a 31.1c 41.5c 6.0c 70.7a 5195a
abcde Means within the same column with different superscripts are different (P < .05).
Table 6. Means of pH, acetic acid, and lactic acid after 33 days of ensiling soybean linesgrown at Rohwer in 1995.
Acetic acid Lactic acidSoybean lines pH (% of DM) (% of DM)
PA 5-2-1 4.6ab 5.3d 1.0b
Donegal 4.7a 6.2a 1.3b
OR 5-12-1T 4.5ab 4.9ab 1.3b
Tyrone 4.3c 4.2b 1.1b
Derry 4.5ab 3.4b 1.2b
OR 13-12-3 4.3c 3.9b 0.9c
OR 19-12-2 4.4c 5.2a 1.3b
Hutcheson 4.5ab 5.6a 1.8a
Pioneer 838 F 3.7d - -
abcde Means within the same column with different superscripts are different (P < .05).

AAES Research Series 470
148
Nutrient Composition of Hays Produced in Arkansas
George Davis, Tom Troxel, and Shane Gadberry1
Story in Brief
The University of Arkansas Cooperative Extension Service hay database consists of nutrient analyses of7,647 hay samples collected from farms in 74 of 75 counties in the state. Twenty-three species of hay wererepresented in the database. Bermudagrass (2,568), mixed grass (2,010) and fescue (911) were the specieswith the highest numbers of samples. The objective of compiling the database was to determine the averagecomposition of hays produced in Arkansas.
Database values show that hay is highly variable in nutrient content. For beef cows and calves, totaldigestible nutrient (TDN) levels were deficient in a higher percentage of hays than crude protein (CP) levels.Bermudagrass hays contained greater (P < .05) levels of CP, TDN and sulfur (S) but lower (P < .05) levelsof magnesium (Mg) than fescue or mixed grass hays. Fescue contained greater (P < .05) levels of CP andTDN than mixed grass. Mixed grass hays, however, contained greater (P < .05) levels of calcium (Ca) andphosphorus (P) than bermudagrass. For beef cows and calves, a high percentage of the hays were deficient insodium (Na), selenium (Se), copper (Cu), and zinc (Zn). A lower percentage of the hays were deficient in P,Ca, Mg and S. Iron (Fe), manganese (Mn) and potassium (K) were deficient in a very small percentage of thehays analyzed.
1All authors are associated with the Animal Science Section, Cooperative Extension Service, Little Rock
Introduction
Arkansas beef cattle producers provide hay to cattleherds for two to five months during the winter and earlyspring. Because most beef cow herds calve in the late win-ter and early spring, feed supplementation is often necessaryto maintain or bring cows to a moderate body condition (bodycondition score of 5 on a scale of 1 to 9) by the start of thebreeding season. Also, hay is often provided to stockers orreplacement animals when pasture forage is unavailable.
The quality of hay produced throughout the state ishighly variable in nutrient content. Therefore, to improvethe use of hay and prevent costly over- and under-feedingmistakes, hay should be analyzed for nutrient composition.When forage composition values aren’t available, the use oftabular values is usually better than visual appraisal alone.The objective of compiling this hay database was to providecounty extension agents, cattle producers, and cattle-relatedindustries with a source of nutrient analysis data that couldbe used in estimating nutrient content of hay whenever aforage test is unavailable.
Experimental Procedures
The hay composition database was compiled by theUniversity of Arkansas Cooperative Extension Service fromforage analysis reports provided by the University of Arkan-sas Diagnostic Laboratory in Fayetteville. Hay compositionvalues in this report were compiled from 7,647 hay samplescollected throughout the state from 1985 to 1996.
Hay samples were submitted for analysis from 74 of 75counties in the state. The 10 counties that submitted the mostsamples for analysis and the number of samples submittedper county were as follows: Washington, 1044; Benton, 623;Independence, 489; Logan, 431; Crawford, 323; Sebastian,270; Hempstead, 263; Carroll, 255; Van Buren, 230; andMadison, 225.
The number of hay samples analyzed by the DiagnosticLaboratory increased from 1985 to 1996 due to promotionof hay testing by county extension agents. The respectivenumber of hay samples analyzed per year from 1985 to 1996were 134, 186, 284, 606, 597, 526, 672, 867, 774, 986, 868,and 1,147.
A complete nutrient analysis was not conducted on everyhay sample submitted. Samples were analyzed for one (usu-ally nitrate N) to fifteen nutrients. These included moisture,N, acid detergent fiber (ADF), neutral detergent fiber (NDF),nitrate-N, phosphorus (P), potassium (K), calcium (Ca), mag-nesium (Mg), sodium (Na), sulfur (S), iron (Fe), manganese(Mn), zinc (Zn) and copper (Cu). Selenium analysis was con-ducted on a limited number of hay samples at Michigan StateUniversity. Crude protein content was calculated as nitrogentimes 6.25 and TDN was estimated with prediction equationsusing CP, ADF and for some species NDF.
Individual quality characteristics were analyzed for spe-cies main effect. The species included bermudagrass, fescue,and mixed grass. The number of samples submitted between1985 and 1996 were 2568, 911, and 2010, respectively. Sincesamples submitted to the lab represented different farms fromyear to year, the main effect of year and the year x species

Arkansas Animal Science Department Report 1999
149
interaction effect on quality characteristics were not includedin the analysis. Due to unequal sample sizes and missingobservations, statistical differences were determined usingthe PROC GLM procedure of SAS (1990). Least-squaremeans were computed (SAS, 1990) and were presentedthroughout.
Results and Discussion
The composition of hays from Arkansas farms is shownin Table 1. Twenty-three species of hays were analyzed.Bermudagrass, fescue, and mixed grass hays were the primaryspecies produced on beef farms. The average nutrient valuesof all 23 species are also shown in Table 1.
Crude protein and TDN usually make up over 95% of thenutrients required by cattle. Bermudagrass hays containedgreater (P < .05) levels of CP and TDN than fescue or mixedgrass hays. Fescue hays contained greater (P < .05) amountsof CP and TDN than mixed grass hays.
Hays were produced under various management condi-tions, with differences in plant maturity, soil fertility, rainfall,and other environmental influences. Typically, bermudagrassis managed for hay production more than either fescue or mixedgrass. Some hybrid bermudagrasses are known for their highyield of high-quality forage. Summer weather is usually amore favorable time to harvest hay. Fescue, however, is acool season grass that reaches a good compromise betweenyield and quality during the spring when rainfall often inter-feres with harvest. Therefore, harvest is sometimes delayed;this allows fescue to mature past the desired growth stage forharvest. Stage of maturity at harvest, as well as other factors,are likely to be involved in the nutrient differences shown here.
The range (lowest to highest value) in CP and TDN con-centrations of the hays shows variability in the quality of thehays. The greatest range in quality was observed for mixedgrass hays. The highest CP value for mixed grass (24.3 per-cent) was over 11 times greater than the lowest value (2.1 per-cent). The highest CP values for bermudagrass and fescuewere six and five times the lowest values, respectively. Con-siderable variability in TDN content also occurred among thehays. The high variability in CP and TDN emphasizes theimportance of obtaining a CP and TDN analysis on hay beforeit is fed. A hay analysis can be used to determine the defi-ciency of nutrients in the animal’s diet. An analysis can alsobe used to balance diets more efficiently and reduce costlyover- and under-feeding errors.
Many of these hays contained excessive amounts of ni-trate-N. Bermudagrass hays were lower (P < .05) in nitrate-Nthan fescue or mixed grass hays. The variability in nitrate-nitrogen content was high as indicated by the wide ranges invalues and high associated standard deviation values. Foragewith over 2,100 ppm of nitrate-N is potentially lethal. Preg-nant cattle should not be fed a diet containing more than 700ppm nitrate-N.
Calcium, P, and Mg concentrations in mixed grass hayswere greater (P < .05) than in bermudagrass hays. Concentra-tions of these minerals in fescue hays were similar to those
in mixed grass hays. Fescue hays had greater (P < .05) con-centrations of Mg and less S (P <.05) than did bermudagrass.No differences among hays were found in the other mineralsanalyzed.
The nutrient values in Table 1 should not be used to re-place a hay analysis. However, in situations where an analy-sis is unavailable, these values could be used with visual ap-praisal of hay quality to make a more reasonable estimation ofnutrient content.
Nutrient requirements of diets for beef cows and growingcalves (Table 2) were compared with the nutrient compositionvalues of all hays in the hay database (Table 1) to determinethe percentage of all hays that were deficient in various nutri-ents for these cattle, as shown in Table 3. Ranked from low-est to highest nutrient requirements were dry gestating cow,lactating cow, and growing calf. Therefore, a higher percent-age of the hays were deficient in various nutrients for the grow-ing calf, followed by the lactating cow and then the dry, ges-tating cow.
Compared to CP, TDN was deficient in a higher percent-age of hays for all cattle. To maintain adequate performanceof these animals, TDN supplementation would be required witha high percentage of the hays, especially for growing calvesand lactating cows.
For dry and lactating cows, P was deficient in a higherpercentage of hays than Ca. However, for growing calves, Cawas deficient in a higher percentage of hays than P (Table 3).Only a small percentage of hays were deficient in Fe, Mn, andK.
Sodium was the most deficient mineral in the hays tested.Less than 12 percent of all hays in the database contained ad-equate Na. Trace minerals Se, Cu, and Zn were deficient in ahigh percentage of the hay samples. These three trace miner-als have been shown to be related to the immune function incattle.
Data in Table 3 show that mineral supplementation shouldbe recommended with most hay diets to maintain optimumanimal performance. The most common mineral deficienciesin hays for beef cows and calves were Na, Se, Cu, and Zn. Asmaller percentage of the hays were deficient in P, Ca, Mg andS. Only a small percentage of hay samples were deficient inFe, Mn, and K.
Implications
Hays produced in Arkansas are highly variable in nutri-ent content. For beef cows and calves, TDN deficiency ismore prevalent in hays than CP deficiency. The most com-mon mineral deficiencies in hays for beef cows and calveswere Na, Se, Cu, and Zn. A lower percentage of hays weredeficient in P, Ca, Mg and S. Very few hays were deficient inFe, Mn, and K.
Literature Cited
SAS. 1990. SAS Inst., Inc., Cary, North Carolina.

AAES Research Series 470
150
Table 1. Composition of hays from Arkansas farms, 1985-1996.
Item Item Bermudagrass Fescue Mixed grass Pooled SE All hays1
Dry matter, % avg2 87.4 (2238)3 87.3 (652) 87.4 (1638) 0.2 87.3 (5905)range4 61.2-96.8 64.4-94.9 60.0-99.0 60.-99.0SD5 4.6 4.8 4.8 4.9
Crude protein, % avg 12.3a(2269) 11.2b (649) 11.0c (1665) 0.1 11.9 (5996)range 3.7-23.7 4.3-21.5 2.1-24.3 2.1-28.6SD 3.6 2.8 3.2 2.8
TDN, % avg 59.2a (2261) 53.6b (645) 52.4c (1653) 0.2 56.4 (5949)range 39.6-79.0 42.2-69.9 37.2-69.9 28.1-79.0SD 6.3 4.6 4.7 6.6
Nitrate-nitrogen, ppm avg 804a (1080) 1127b (533) 905b (921) 41 1062 (3774)range 40-8,000 34-15,000 60-8,200 34-15,000SD 819 1580 1067 1332
Calcium, % avg 0.51a (185) 0.50ab (52) 0.58b (251) 0.02 0.59 (585)range 0.10-1.21 0.24-0.85 0.12-3.06 0.10-3.06SD 0.17 0.16 0.27 0.28
Phosphorus, % avg 0.27a (192) 0.31ab (50) 0.30b (249) 0.01 0.29 (586)range 0.08-0.61 0.11-0.50 0.04-0.66 0.04-0.66SD 0.08 0.08 0.11 0.10
Potassium, % avg 1.85 (179) 2.11 (47) 1.88 (230) 0.07 1.92 (540)range 0.68-3.60 0.61-3.71 0.29-5.03 0.29-5.03SD 0.59 0.68 0.74 0.67
Magnesium, % avg 0.22a (180) 0.26b (49) 0.26b (238) 0.01 0.24 (552)range 0.08-0.46 0.17-0.51 0.10-0.75 0.04-0.75SD 0.07 0.07 0.11 0.09
Sulfur, % avg 0.26a (192) 0.21b (40) 0.22b (208) 0.01 0.23 (518)range 0.02-0.63 0.12-0.36 0.10-0.49 0.02-0.63SD 0.09 0.06 0.06 0.08
Sodium, % avg 0.03 (24) 0.01 (3) 0.04 (47) 0.02 0.03 (84)range 0.01-0.17 .01-.02 0.01-0.15 0.00-0.17SD 0.03 .01 0.04 0.03
Iron, ppm avg 205 (111) 169 (22) 224 (164) 27 212 (347)range 27-1037 70-653 18-1219 18-1219SD 144 122 200 173
Manganese, ppm avg 179 (109) 145 (22) 175 (166) 17 171 (347)range 11-559 47-584 17-600 11-640SD 111 126 109 111
Copper, ppm avg 10.9 (123) 8.8 (31) 11.4 (180) 0.8 10.9 (395)range 2.4-36.9 4.8-17.5 1.1-36.9 1.1-36.9SD 4.7 3.5 5.6 4.9
Zinc, ppm avg 32.7 (111) 32.0 (22) 37.5 (166) 3.0 35.1 (350)range 9.0-91.1 13.5-65.9 5.5-184.5 5.50-184.5SD 14.2 14.3 20.5 17.4
Selenium, ppm avg 0.06 (8) 0.04 (4) 0.09 (13) 0.08 (29)range 0.03-0.12 0.01-0.11 0.04-0.25 0.01-0.36SD 0.03 0.05 0.06 0.07
1 All hays include the following species: alfalfa, alfalfa-grass mixtures, bahiagrass, bermudagrass, bluestem,bromegrass, clover, dallisgrass, fescue, johnsongrass, legume-grass mixtures, mixed grass, native grass, oat,orchardgrass, rye, ryegrass, sorghum-sudangrass, sorghum, soybean, straw of small grain, triticale, and wheat.
2 Average value. All nutrient values except dry matter are shown on a dry-matter basis.3 Number of hay samples included in the average.4 Lowest value to highest value.5 Standard deviation.a,b,c Means within rows without a common superscript differ (P<.05).

Arkansas Animal Science Department Report 1999
151
Table 2. Nutrient requirements of diets for beef cows and calves1.
Nutrient Dry, gestating cow2 Lactating cow3 Weaned calf4
Dry matter, lb/day 22.5 26.4 12.6Crude protein, % 7.7 10.9 11.2TDN,% 52.1 60.4 63.0Calcium, % .25 .31 .43Phosphorus, % .16 .21 .22Potassium, % .60 .70 .60Magnesium, % .12 .20 .10Sulfur, % .15 .15 .15Sodium, % .08 .10 .08Iron, ppm 50 50 50Manganese, ppm 40 40 40Zinc, ppm 30 30 30Copper, ppm 10 10 10Selenium, ppm .10 .10 .10
1 All values except dry matter are shown on a dry-matter basis.2 1100 lb dry, gestating cow, 11 months since calving.3 1100 lb lactating cow, 2 months since calving, 20 lb peak milk4 500 lb weaned calf, 1.5 lb ADG
Table 3. Percentage of hay samples deficient in crude protein, total digestible nutrientsand mineral content for cows and calves.1
Item (No. samples) Dry, gestating cow2 Lactating cow3 Growing calf4
Crude protein (5996) 12 42 46Total digestible nutrients (5949) 28 72 83Calcium (585) 5 10 26Phosphorus (586) 10 18 20Potassium (540) <1 1 <1Magnesium (552) 3 29 <1Sulfur (518) 8 8 8Sodium (84) 88 93 88Iron (347) 4 4 4Manganese (347) 3 3 3Zinc (350) 44 44 44Copper (395) 50 50 50Selenium (29) 73 73 73
1 Includes all hay samples.2 1100 lb dry, gestating cow, 11 months since calving.3 1100 lb lactating cow, 2 months since calving, 20 lb peak milk.4 500 lb weaned calf, 1.5 lb ADG.

AAES Research Series 470
152
A Summary of 1998 Hay Production Costs forThree Farms Enrolled in the Arkansas BeefImprovement Program Hay Quality Project
Shane Gadberry, John Jennings, Gerald Van Brunt, Jennifer Hawkins,Tommy Thompson, and Tom Troxel1
Story in Brief
The Hay Quality Project of the Arkansas Beef Improvement Program (ABIP) was developed in 1998 toassist producers with improving hay quality, thereby reducing the need for additional supplements. Threeproducers completed the first year of a two-year commitment in 1998. The project required each producer tocomplete a hay production enterprise budget. In 1998, the average cost of producing a 1,000-lb bale at 88%dry matter was $37.49. Fixed costs and fertilizer accounted for 34.7 and 44.7% of the total cost per bale.From April through August, total rainfall was six and one-half inches below average, and from May toAugust, monthly temperatures were three degrees above average. In addition, two of the three farms werealso infested with armyworms. Drought and armyworms elevated the cost of hay production during 1998by suppressing yields.
1 All authors are associated with the Animal Science Section, Cooperative Extension Service, Little Rock
Introduction
The majority of beef cattle producers in Arkansas relyon stored forage to feed the herd during winter months. To-day, stored forage is typically harvested as hay packaged inlarge round bales. Many producers desire to own harvestingequipment and harvest the forage themselves, rather thanrelying on custom harvesting operations or purchasing thehay elsewhere. Unfortunately, there is limited informationavailable to producers in Arkansas on harvesting costs. Insome cases, lesser quality hay is produced because of delaysby custom harvesters; however, supplementing these forageswith other feedstuffs may still be less expensive than own-ing the forage harvesting equipment.
As part of the ABIP hay quality project, producers wererequired to complete a hay production budget. A summaryof the budgets from these farms provides Arkansas cattleproducers with a source of information about the costs ofharvesting forage as hay.
Experimental Procedures
In the fall of 1997, ABIP project application forms weremailed to all county extension offices. In February 1998,three producers were selected to participate in the two-yearproject. Data collected on each field enrolled in the projectincluded a soil analysis, field acreage, field inventories, pre-cipitation records, fertilization records, harvest dates, baleweights, and forage quality analyses.
At the end of the haying season, a hay production bud-get was completed on each farm. All three producers ownedtheir own equipment. Equipment age varied across farms
and ranged from 2 to 15 years. One producer was a customharvester and charged his custom haying rate to his own hayenterprise budget. A 12-year straight-line depreciation wasused for calculating equipment costs on the other two farms.
To compare costs across farms, the costs of productionfor each farm were based on average bale weight and mois-ture content for hay produced on each farm and adjusted to a1,000 lb bale at 88% dry matter. Fixed cost items in the bud-get included depreciation for haying equipment (rake, mower,tedder), 50% of tractor depreciation, insurance, personalproperty taxes, and interest on equipment. Land purchase,rental costs or real property taxes were not included in thebudget. Direct costs included any custom haying hired; fuel,oil, and lubrication; repairs and maintenance; twine or wrap,fertilizer, lime, chemicals, hired labor, and establishment costsfor any newly established hay fields.
A break-even value for hiring a custom harvester wasdetermined by the summation of the fixed costs; fuel, oil,and lube; repairs and maintenance; and twine and wrap ex-penses. Neither the producer’s labor for harvesting and haul-ing nor the cost of equipment and hay storage were includedin the budget.
Results and Discussion
The total acreage harvested across the three hay qualityproject farms averaged 204 acres (SE = 108). One of thethree producers harvested forage for hay one time during theyear. The producer’s hay meadow was predominatelyorchardgrass and fescue. The other two producers relied pre-dominately on multiple cuttings of bermudagrass to ac-

Arkansas Animal Science Department Report 1999
153
quire enough hay to carry the herd throughout the wintermonths.
In 1998, the average rainfall accumulation from Aprilto August was 6.5 in below the National Oceanic and Atmo-spheric Administration (NOAA) National Climatic DataCenter historical 57-yr rainfall average. The NOAA rainfalldata was reported from within the counties where partici-pants resided. From May to August, monthly temperaturesaveraged 3.1° higher than a 15-year NOAA historical tem-perature average for Arkansas. Along with drought in 1998,armyworm infestation reduced total hay yield on one projectfarm. Compared to the number of bales produced in 1997,the producer suffered an 18.6% loss in hay production dueto drought and armyworms. The average dry matter yieldacross farms was 0.79 tons per acre. The average number ofbales produced was 442; these bales averaged 791 lb perbale. The number of round bales produced, adjusted to a1,000 lb standard weight at 88% dry matter, averaged 397bales across the three farms.
The hay produced on the three farms averaged 12.7%(SE = 2.7) crude protein and 58.8% (SE = 5.4) TDN on a drymatter basis. The average quality was high enough to meetthe nutritional demands of a 1,100-lb cow producing 10 lbof milk during peak lactation at 2 months post calving.
The cost of producing a 1,000 lb round bale at 88% drymatter averaged $37.49 (SE = 9.01). Fixed costs averaged$14.69 per bale (SE = 3.00) for two farms that reported equip-ment costs using a 12-year straight-line depreciation. Fixedcosts accounted for an average of 34.7% of the total cost perbale. Fertilizer cost averaged $16.88/bale (SE = 4.67) andcontributed 44.7% to the total cost per bale among the threefarms. Twine and wrap cost averaged $1.08/bale (SE = 0.55).Chemical (herbicide and insecticide) cost averaged $3.20/bale (SE = 3.41).
Break-even cost on custom baling was calculated on thetwo farms that reported equipment depreciation. The aver-age break-even value was $14.15 and $20.86/bale. If cus-tom baling charges per bale, adjusted to a 1,000 lb bale at88% dry matter, were acquired for less than the break-evenvalue, then it would be cheaper to pay someone to harvestthe hay than to invest in the equipment and operating costs,not including labor.
In 1998, low hay yields were common in Arkansas dueto drought and armyworms. These conditions affected thecost of producing a bale of hay. As yields increase, directcosts such as twine and fuel will increase, but on a cost perbale basis, they should remain about the same. Fixed costs,however, do not change with production; therefore, produc-ing more bales should reduce the fixed cost per bale. Sinceyields were less than anticipated in 1998, cost per bale washigher because the fixed costs were distributed over fewerbales. Fertilizer cost per bale was also higher than expected.Each producer fertilized according to soil test recommenda-tions for high yields, which were not achieved due to insuf-ficient precipitation.
In spite of the drought, these producers cut hay for qual-ity instead of just quantity. The average cost per hundred
pounds of TDN baled (dry matter basis) was $7.20 (SE =1.45). The cost of 100 lb of TDN from sacked cracked cornwas $10.50 in February 1999.
Overall, 1998 was not an ideal year to illustrate the typi-cal cost of producing a bale of hay in Arkansas. Over time,as more farms participate in the project and year-to-year varia-tions in environment are removed, more typical cost figurescan be obtained.Implications
Beef cattle producers prefer the convenience of owninghaying equipment. Ownership gives a producer more con-trol over the quality of hay produced; however, in some situ-ations, the cost of owning and operating haying equipmentis more expensive than supplementing lesser quality hay.Producers must consider equipment and operating costs in-volved in producing hay and evaluate sources of farm in-come from sales of livestock and excess hay to justify own-ing haying equipment.

AAES Research Series 470
154
Storage Characteristics of Bermudagrass Hay as Affectedby Moisture Content and Density of Square Bales
W.K. Coblentz, J.E. Turner, D.A. Scarbrough, K.E. Lesmeister, D.W. Kellogg,K.P. Coffey, L.J. McBeth, and J.S. Weyers1
Story in Brief
Bermudagrass was packaged in small square hay bales at five moisture concentrations (32.5, 28.7, 24.8,20.8, and 17.8%) and two bale densities (high and low). Bale moisture dramatically affected storage charac-teristics, but bale density did not. This may not have been true if larger differentials between high and lowbale densities were used. Most evidence of heating occurred within the first 20 days of storage. Generally,this study suggests that maximum temperatures > 140°F are readily attainable in conventional small squarebales of bermudagrass hay made at high concentrations of moisture. Minimal dry matter loss and molddevelopment will occur in bermudagrass hay if the moisture concentration at baling is < 20%. Furtherevaluation of these characteristics in large round bales is needed; it should not be assumed that the relation-ships illustrated by this study can be extrapolated to larger bale types.
1All authors are associated with the Department of Animal Science, Fayetteville.
Introduction
The harvest, storage, and cash sale of improved variet-ies of bermudagrass hay is a large component of the cattleand horse industries in northwest Arkansas. The productionof these intensely managed bermudagrass hays is largelydriven by readily available poultry litter that serves as aninexpensive source of fertilizer. Producers who package theirhay in conventional, small square bales routinely receive$140/ton for this product. Prevailing weather conditionsthroughout Arkansas include high relative humidity and arelatively high probability of rainfall during portions of thetime bermudagrass is actively growing and being harvested.Producers are often faced with the choice of baling beforeadequate dessication has occurred or subjecting their crop torain damage. The negative storage characteristics and qual-ity changes that occur when alfalfa hay is baled at moistureconcentrations >20% are well documented. Considerably lessinformation is available concerning storage characteristicsand quality changes that occur in grass hays generally, andwarm-season grass hays specifically. The objectives of thisresearch were to examine the effects of initial bale moistureand density on spontaneous heating and storage characteris-tics of bermudagrass hay. A secondary objective was to re-late dry matter loss and mold development that occurredduring bale storage to maximum internal bale temperatureand the heating degree days >95°F (HDD) accumulated dur-ing the same time period by linear regression techniques.
Experimental Procedures
Field Procedures. A well-established stand of‘Greenfield’ bermudagrass was harvested with a John Deere
Model 1219 mower-conditioner (John Deere Corp., MolineIllinois) on 15 June 1998 at the Forage Research Area inFayetteville. The forage was mowed at 1000 hours in threeblocks of 10 swaths each and allowed to dry, undisturbed,until 0930 hours on 16 June. At this time, two swaths wereraked together with a New Holland Model 258 side-deliveryrake (Ford New Holland, Inc., New Holland, Pennsylvania);therefore, a final total of five double rows per block remainedafter raking. Double-rows in each block were allocated ran-domly to one of five whole plots, based solely on moistureconcentration at the time of baling. Double-rows were in-verted an additional time at 1300 hours with the side deliv-ery rake to enhance drying and to allow the inclusion of balespackaged at less than 20% moisture within the treatmentstructure. The subplot treatment factor for this study was baledensity. Bale density has been shown to have significant ef-fects on spontaneous heating characteristics in alfalfa haybales (Buckmaster and Rotz, 1986; Coblentz et al., 1996).Two density treatments (high and low) were establishedwithin each moisture concentration. A New Holland Model320 baler with hydraulic density control was used to pack-age the bales. The ultimate goal in establishing the highmoisture treatments was simply to make a very solid (dense)bale. The low density treatments were created by rotatingthe hydraulic valve that controls tension on the bale cham-ber by 1/2 revolution in a counter-clockwise direction.
Four bales (average size = 18.9 in x 15.0 in x 38.6 in)were made per field block for each combination of moistureconcentration and bale density. The protocol for stacking haybales was similar to that reported previously (Coblentz etal., 1996). Wooden pallets were placed on the dirt floor of anopen-air pole shed; two bales from each group of four werepositioned side by side (strings up) on top of the wooden

Arkansas Animal Science Department Report 1999
155
pallets. The remaining two bales from each set of four werepositioned with the same orientation on top of the first twobales, thereby creating 2 x 2-bale stacks for each field repli-cation of each treatment combination. Individual stacks con-taining four bales were surrounded by dry (nonheating) balesof weathered bermudagrass hay. The top of each individualstack was covered with a single, weighted sheet of 1.0-inthick Styrofoam® insulation board (Celotex Corporation,Tampa, Florida). This stacking protocol was designed to limitthe effects of fluctuating ambient temperature within the in-dividual experimental hay stacks. Stacks were created withintwo h of removal of bales from the field. Prior to creatingtreatment stacks, two of each set of four bales were coresampled (Star Quality Samplers, Edmonton, AB, Canada) toprovide forage samples that were subsequently used to de-termine the initial bale moisture concentration of all treat-ment combinations. At least two 14-in cores were taken fromthe butt-ends of each bale. One cored bale was placed onthe top and bottom layer of each bale stack. Core sampleswere dried to constant weight under forced air at 122°F.
All bales entering storage were weighed and, due to timeconstraints, measured for length only. Prior to conductingthis research it was determined that very little variabilityexisted with respect to height and width of the bales pro-duced by our baler. Respective averages for these measure-ments were 15.0 and 18.9 in and these values were assumedto be consistent throughout the trial. Bale volume (and sub-sequently, bale density) was calculated from the measuredlength of each bale and the predetermined values for heightand width. For each stack, bale temperatures were monitoredby inserting single thermocouples into the center of the twobales in each stack that were not core sampled prior to stack-ing (one in the top layer and the other in the bottom layer).Bale temperatures were recorded at 0700 and 1600 hoursfor the first 10 days after baling and once daily (at 1600 h)thereafter, until the end of the 60-day storage period. Alltemperature data were compiled with an Omega 450 AKTType K thermocouple thermometer (Omega Engineering,Stamford, Connecticut). For purposes of computation, themean internal bale temperature for a given day was consid-ered to be the same as the observed temperature, except dur-ing the first 10 days, when the mean of the two observationswas used. Degree days >95°F (HDD) were computed as thesummations of the daily increment by which the mean inter-nal bale temperature was >95°F. Treatment means were com-pared for maximum temperature, minimum temperature, 30-day average temperature, 60-day average temperature, andHDD. Several previous studies have used 86°F as the thresh-old temperature level for calculating HDD; however, the 60-day storage period lasted from mid-June until mid-Augustand coincided with prolonged, excessively hot weather.Ambient temperatures approached 110°F on numerous oc-casions during this time period; therefore, a higher arbitrarythreshold was used to calculate HDD, thereby limiting theeffects of elevated ambient temperatures on the HDD accu-mulated during storage.
After 60 days of bale storage, all bales that were moni-
tored daily for internal bale temperature were core sampled(two from each stack) in a manner identical to that describedpreviously and then visually appraised for mold growth (fivepoint scale: 1 = no visible mold, 2 = presence of spores be-tween flakes, 3 = presence of spores throughout bale, 4 =mycelial mat between flakes, and 5 = mycelial mat through-out the bale) by the method of Roberts et al. (1987). Whenappropriate, increments of 0.25 were used to evaluate eachbale. Dry matter recoveries for all stacked bales were deter-mined from calculated DM weights of each bale before andafter storage.
Statistical Analysis. All response variables were ana-lyzed as a split-plot design with five moisture concentra-tions as whole plots and two bale densities as the subplottreatment factor. Three replications (blocks) were establishedin the field and maintained throughout the storage period.Actual treatment means were compared using Fisher’s pro-tected least significant difference test. Significance was de-clared at P = .05; all references to statistical significance implythis level of confidence unless otherwise indicated. The re-lationship between visual mold score and dry matter recov-ery in treatment bales and associated measures of heating(maximum temperature and HDD) was determined by lin-ear regression techniques.
Results and Discussion
Bale Characteristics. Bale characteristics for ten com-binations of bale moisture and density are shown in Table 1.For these treatment combinations, moisture concentrationsranged between 16.9 and 33.6% and (wet) bale densitiesranged from 9.2 to 15.1 lb/ft3, which created a wide range ofresponses with respect to spontaneous heating, mold devel-opment, and dry matter loss (Table 2). On both a dry andwet basis, moisture and density main effects significantly (P< .002) affected the actual weight and density of our treat-ment bales; however, the interaction of factors was not sig-nificant (P > .196). Conversely, the length and volume ofour treatment bales was not affected by the moisture (P >.37) or density (P > .73) treatment factors, but their interac-tion term was significant (P = .020). Generally, the proce-dures used in this study were adequate to generate statisti-cally significant (P < .05) differences in bale weight and baledensity on both a dry and wet basis for bales made within agiven moisture level, but at different (high or low) bale den-sities.
Temperature Responses. Examples of temperature vs.time curves for three baling treatments (Fig. 1) indicate thatspontaneous heating began immediately after packaging andcontinued for about 15 to 20 days. Little evidence of spon-taneous heating was observed after 20 days in storage. Ini-tial bale moisture had a highly significant (P < .02) effect onindices of spontaneous heating in bermudagrass hay bales.Although bale density (high or low) significantly affectedinitial bale weight and density on both a wet and dry basis,this treatment factor did not affect (P > .21) indices of heat-ing. The interaction of main effects was also nonsignificant

AAES Research Series 470
156
(P > .196); therefore, data were combined over high and lowbale densities and only moisture means are presented in Table2. (This was also true for visual mold and dry matter recov-ery and these data were presented in a similar manner.) Therewere no differences (P > .05) in any index of heating be-tween bales made at the two highest moisture concentrations(32.5 and 28.7%). As expected, all measures of heating de-clined (P < .05) in bales made at the three lowest moistureconcentrations (24.8, 20.8, and 17.8%). Generally, this studysuggests that maximum temperatures > 140°F are readily at-tainable in conventional small square bales of bermudagrasshay made at high concentrations of moisture. Even in thedriest treatment (17.8%), measurable increases in internalbale temperatures were observed. However, these indicationsof respiration and spontaneous heating were relatively smalland have not normally caused substantial changes in foragequality when observed in other types of hay (Coblentz et al.,1996). The HDD accumulated during storage can be viewedas a single numerical value that represents and combines boththe intensity and duration of spontaneous heating in hay. Assuggested by the maximum temperature, as well as the 30-day average, the wettest hays (32.5 and 28.7% moisture) ex-hibited a more intense and prolonged period of heating thandid the drier treatments. These characteristics have beenshown to be even more pronounced in large round hay pack-ages (Montgomery et al., 1986).
Visible Mold. The method used to evaluate mold devel-opment is based on a five-point scale. In this scale, a scoreof 1.00 would represent a bale that had no visible signs ofmold and had no musty or other heat-related odors. A scoreof 5.00 would represent a bale that had visible white moldthroughout all bale flakes. The maximum mold score ob-served in this study was 3.73, which indicated substantialevidence of mold devlopment; this included discoloration,dustiness, obvious musty odor, and the presence of whitemold between some bale flakes. In contrast, the mold scoreof the driest hay (1.13), reflects hay with virtually no evi-dence of undesirable microbial activity. In this study, the vis-ible mold scores declined (P < .05) as moisture content de-creased. This observation has been commonly observed inother studies and reflects the less-favorable environment formicrobial growth that exists within hay bales made at lowmoisture concentrations (< 20%).
Dry Matter Recovery. When hay bales are packaged atelevated moisture concentrations, plant sugars and otherhighly digestible components are respired by microorgan-isms, thereby generating heat. The respiration of these plantcomponents results in a loss of dry matter. Dry hay creates aless favorable environment for microbial growth, resultingin less loss of plant dry matter via respiration. In this study,dry matter loss ranged from about 6% to near total recoveryin the driest hay.
Regression of Visible Mold and Dry Matter Recoveryon Heating Degree Days and Maximum Temperature. Bothmold development and dry matter recovery are closely re-lated to indices that reflect the relative amount of spontane-ous heating that occurs within hay bales. In this study, esti-
mates of visible mold development and dry matter recoverywere regressed on HDD and maximum temperature (Figs. 2through 5); in all cases, these relationships demonstrated high(> .86) r2 statistics, thereby verifying close relationships be-tween these storage characteristics. These findings suggestthat visual mold may increase by 0.6 units for every 10°Fincrease in maximum temperature; conversely, dry matterrecovery will decrease by 1.3% for every increase of 10°F inmaximum temperature.
Implications
This study shows that moisture content at baling has adramatic effect on characteristics of spontaneous heating.Most evidence of heating occurred within the first 20 daysof storage. Generally, this study suggests that maximum tem-peratures > 140°F are easily attainable in conventional smallsquare bales of bermudagrass hay. Minimal dry matter lossand mold development will occur in bermudagrass hay ifmoisture content at baling is < 20%. Further evaluation ofthese characteristics in large round bales is needed; it shouldnot be assumed that the relationships illustrated by this studycan be extrapolated to larger bale types.
Literature Cited
Buckmaster, D.R., and C.A. Rotz. 1986. ASAE Paper 86-1036 in Proc. Mtg. Am. Soc. Agric. Eng., San LuisObispo, California, June 29-July 2, 1986. Am. Soc.Agric. Eng., St. Joseph, Michigan.
Coblentz, W.K., et al. 1996. J. Dairy Sci. 79:873-885.Montgomery, M.J., et al.1986. J. Dairy Sci. 69:1847-1853.Roberts, C.A., et al. 1987. Crop Sci. 27:783.
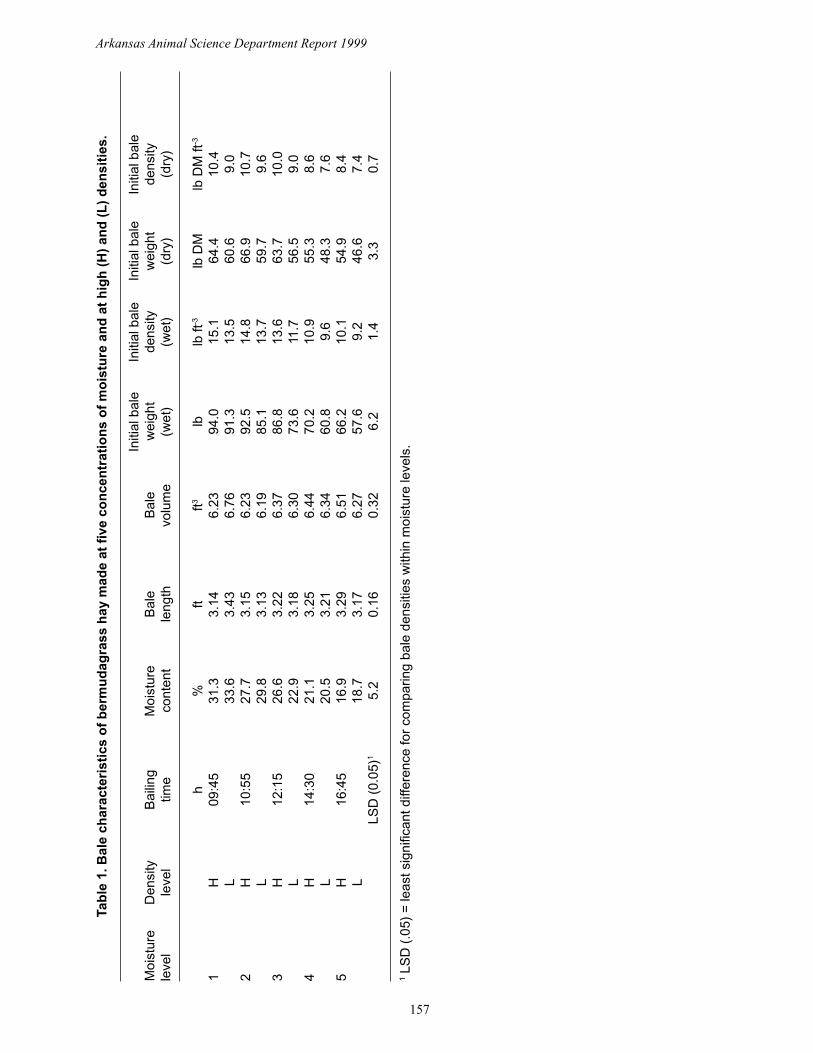
Arkansas Animal Science Department Report 1999
157
Tab
le 1
. Bal
e ch
arac
teri
stic
s o
f b
erm
ud
agra
ss h
ay m
ade
at f
ive
con
cen
trat
ion
s o
f m
ois
ture
an
d a
t h
igh
(H
) an
d (
L)
den
siti
es.
Initi
al b
ale
Initi
al b
ale
Initi
al b
ale
Initi
al b
ale
Moi
stur
eD
ensi
tyB
ailin
gM
oist
ure
Bal
eB
ale
wei
ght
dens
ityw
eigh
tde
nsity
leve
lle
vel
time
cont
ent
leng
thvo
lum
e(w
et)
(wet
)(d
ry)
(dry
)
h%
ftft3
lblb
ft-3
lb D
Mlb
DM
ft-3
1H
09:4
531
.33.
146.
2394
.015
.164
.410
.4L
33.6
3.43
6.76
91.3
13.5
60.6
9.0
2H
10:5
527
.73.
156.
2392
.514
.866
.910
.7L
29.8
3.13
6.19
85.1
13.7
59.7
9.6
3H
12:1
526
.63.
226.
3786
.813
.663
.710
.0L
22.9
3.18
6.30
73.6
11.7
56.5
9.0
4H
14:3
021
.13.
256.
4470
.210
.955
.38.
6L
20.5
3.21
6.34
60.8
9.6
48.3
7.6
5H
16:4
516
.93.
296.
5166
.210
.154
.98.
4L
18.7
3.17
6.27
57.6
9.2
46.6
7.4
LSD
(0.
05)1
5.2
0.16
0.32
6.2
1.4
3.3
0.7
1 LS
D (
.05)
= le
ast s
igni
fican
t diff
eren
ce fo
r co
mpa
ring
bale
den
sitie
s w
ithin
moi
stur
e le
vels
.

AAES Research Series 470
158
Tab
le 2
. Hea
tin
g a
nd
sto
rag
e ch
arac
teri
stic
s o
f b
erm
ud
agra
ss h
ay m
ade
at f
ive
con
cen
trat
ion
s o
f m
ois
ture
.
Initi
alM
oist
ure
moi
stur
e30
-day
60-d
ayH
DD
>V
isib
leD
ry m
atte
rle
vel
cont
ent
MA
X1
MIN
1A
VG
1AV
G1
95°F
1m
old2
reco
very
%°F
°F°F
°Fno
.%
132
.514
3.2a
88.5
a11
3.9a
103.
6a58
9a3.
73a
94.1
c
228
.713
9.1a
88.0
ab11
3.5a
103.
5a58
3a2.
69b
94.0
c
324
.812
9.6b
86.5
bc10
8.1a
100.
2b41
9b2.
19b
95.1
bc
420
.811
0.3c
86.2
c99
.9b
95.7
c18
4c1.
54c
97.3
ab
517
.810
4.4d
86.0
c96
.6b
93.7
c99
c1.
13c
99.4
a
SE
34.
00.
72.
51.
463
0.23
1.2
a, b
, c, d
Mea
ns w
ithin
a c
olum
n th
at h
ave
no c
omm
on s
uper
scrip
ts d
iffer
(P
<0.
05).
1 Abb
revi
atio
ns: M
AX
= m
axim
um te
mpe
ratu
re, M
IN =
min
imum
tem
pera
ture
, 30-
day
AV
G =
ave
rage
tem
pera
ture
ove
r the
firs
t 30
days
of s
tora
ge, a
nd 6
0-da
yA
VG
= a
vera
ge te
mpe
ratu
re o
ver
the
entir
e (6
0-da
y) s
tora
ge p
erio
d, H
DD
> 9
5° F
= h
eatin
g de
gree
day
s >
95° F
.2
Vis
ible
mol
d as
sess
men
t sco
re (
1 =
goo
d, 5
= p
oor)
.3
Sta
ndar
d er
ror
of th
e di
ffer
ence
bet
wee
n m
oist
ure
mea
ns.

Arkansas Animal Science Department Report 1999
159
Fig. 1. Examples of temperature vs. time curves for three high-density baling treatments. Heavy solid,light dashed, and light solid lines correspond to bales made at 31.3, 26.6, and 16.9% moisture, respec-tively.
Fig. 2. Relationship between visual mold and HDD for conventional bermudagrass hay bales made atfive moisture concentrations.
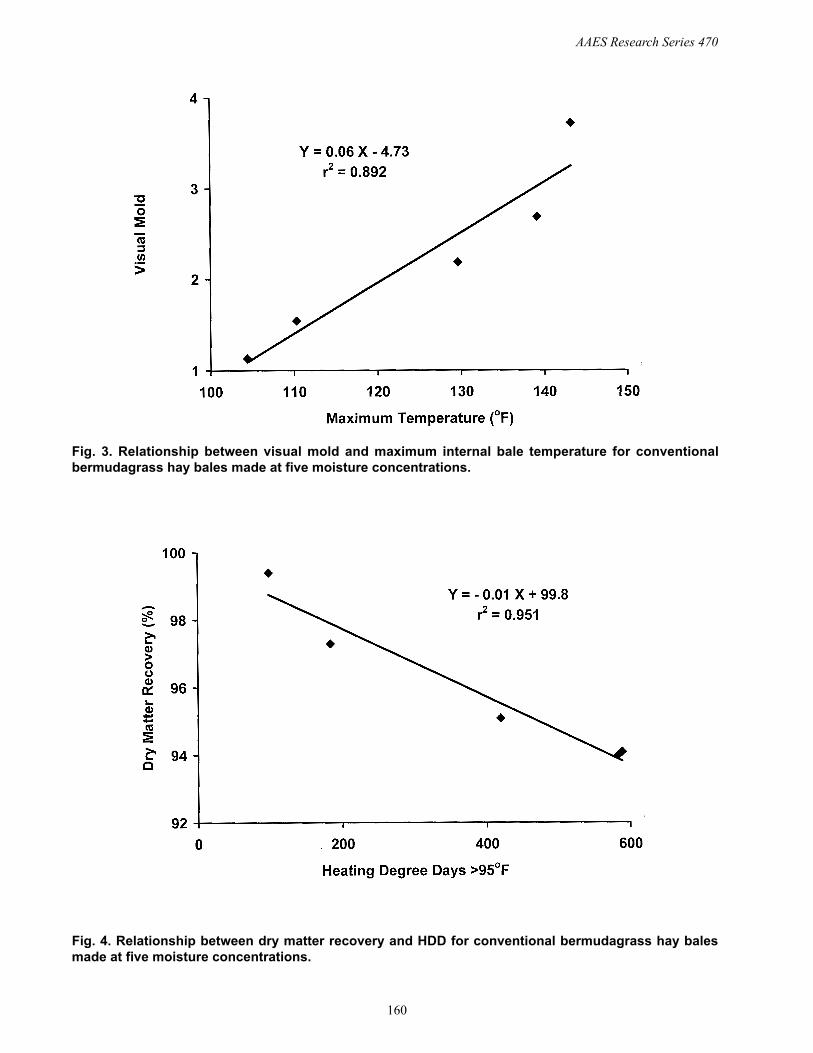
AAES Research Series 470
160
Fig. 3. Relationship between visual mold and maximum internal bale temperature for conventionalbermudagrass hay bales made at five moisture concentrations.
Fig. 4. Relationship between dry matter recovery and HDD for conventional bermudagrass hay balesmade at five moisture concentrations.

Arkansas Animal Science Department Report 1999
161
Fig. 5. Relationship between dry matter recovery and maximum internal bale temperature for conven-tional bermudagrass hay bales made at five moisture concentrations.

AAES Research Series 470
162
Evaluation of Seeding Rate and Herbicide Treatmenton Growth and Development of Sod-Seeded
Oat, Wheat, and Rye
W.K. Coblentz1, K.P. Coffey1, J.E. Turner1, K.F Harrison2, L.B. Daniels1, C.F. Rosenkrans, Jr.1, and D.S. Hubbell, III2
Story in Brief
Wheat, rye, and oat were overseeded into a bermudagrass sod in the fall of 1997. Herbicide (glyphosate3)treatment to suppress the existing bermudagrass sod and/or increased seeding rates failed to improveforage production in the fall, winter, and early spring. However, these results suggest that total forage drymatter yields of 4000 lbs/acre are realistic for overseeded cereal grains in northern Arkansas. The limitedfall and winter growth severely restricts the cost-competitiveness of overseeded cereal grains for cow-calfproduction, relative to reliance on perennial cool season grasses. This practice may be more appropriate innorthern Arkansas for producers interested in a single mechanical harvest as silage or hay.
1 Department of Animal Science, Fayetteville.2 Livestock and Forestry Branch Experiment Station, Batesville.3 Roundup Ultra® (Monsanto Company, St. Louis, Missouri, 63167).
Introduction
The overseeding of bermudagrass pastures with winterannual cereal grains has been a common practice through-out Arkansas. The system works well in southern Arkansasbecause the climate is favorable for some continued growththroughout the late fall and winter and other options for cool-season perennial forages are limited. Some overseeding ofbermudagrass is regularly attempted in northern Arkansas,but adequate growth to support intense cattle enterprises can’tbe guaranteed until at least mid-March. By then, tall fescue,which is the dominant forage type in northern Arkansas, orother cool-season perennials are readily available. In addi-tion, the costs associated with overseeding most winter an-nuals are likely to result in higher production costs than thoseincurred with continued use of tall fescue in cow-calf sys-tems. The most fertile and tillable land throughout northernArkansas is frequently used for production of hybrid or im-proved bermudagrass, often for cash sale. Despite the limi-tations described, many producers would actively considerincreased usage of overseeded cereal grains on these sitesfor stocker, dairy heifer, and/or cow-calf enterprises if sodsuppression techniques could be developed that would al-low fall growth of cereal grains comparable to that describedin clean-tilled seedbeds. Recent studies in Louisiana (Cuomoand Blouin, 1997) have suggested that fall production of sod-seeded annual ryegrass can be improved by application ofglyphosate in conjunction with sod seeding. Aggressive fallgrowth of sod-seeded winter cereal grains would improvecost-competitiveness with tall fescue and other cool-seasonperennials. The objectives of this study were to evaluate the
effects of seeding rate and sod suppression with glyphosateon the growth and development of sod-seeded wheat, oat,and rye.
Experimental Procedures
Establishment. This study was conducted at theBatesville Livestock and Forestry Branch Station located nearBatesville, AR. A 200 by 92-ft plot area was established ona Peridge silt loam. The base sod at this site was a well-established stand of ‘Tifton 44’ bermudagrass that was har-vested as hay in mid-August. Regrowth following hayingwas limited because of droughty weather conditions. No fur-ther removal of existing vegetation was attempted prior toestablishing the study. Existing vegetation at the experimen-tal site was estimated by clipping all vegetation (alive anddead) within four 1/4-m2 frames selected from random loca-tions throughout the site. The mean residual plant dry matterwas calculated to be 213 lb/acre. Prior to establishing theplots, the site was fertilized to soil test recommendations forfall-seeded cereal grains. The study was established in a split-plot design with herbicide treatment (1 quart glyphosate peracre or no herbicide treatment) as the whole-plot treatments.The subplot treatment structure was a 3 x 2 factorial combi-nation of cereal grain species (oat, wheat, and rye) and seed-ing rate (low and high). The low seeding rates were set at 90,90, and 96 lb of pure live seed per acre for wheat, rye, andoat, respectively. High seeding rates were increased by 50%relative to the low rate; therefore, respective rates for thesespecies were 135, 135, and 144 lb of pure live seed per acre.Cereal grain varieties selected for this study included ‘Jay
Arkansas Animal Science Department Report 1999
163
Pee’ wheat, ‘Elbon’ rye, and ‘Ozark’ oats. Plots were sprayed,and then drilled in 10-inch rows with a 80-inch wide TyePasture Pleaser Drill (The Tye Company, Lockney, Texas)on September 24, 1997. Individual subplots were drilled witha single drill pass. Subplot length was 30 ft. All plots werefertilized with an additional 50 lb of nitrogen per acre on 14February 1998. Four replications (blocks) were establishedfor all treatment combinations.
Fall Evaluation. In conducting this study, our goal wasto reduce the competitiveness of the bermudagrass sod withapplication of glyphosate herbicide, thereby potentially im-proving establishment and fall growth characteristics of thecereal grains. A 56-day withholding period for grazing live-stock is required following application of glyphosate to es-tablished pastures; therefore, the initial fall evaluation wasconducted 56 days after herbicide treatment (20 November1997). Row coverage was determined for each plot by plac-ing a tape measure (divided in tenths of feet) between tworandomly selected drill rows and tabulating blank spaces forboth adjacent rows over a 20-ft distance. Percentage of rowcoverage was calculated as: coverage (%) = 100 - ([blankspaces {ft} / 20 ft] x 100). Percent row coverage for the tworows adjacent to the tape measure were averaged prior tostatistical analysis. It was our initial intention to determinefall forage production for these cereal grains at this time;but, visual inspection of the plots indicated that fall forageproduction was not improved by any of the treatments inthis study. For this reason, the evaluation of forage dry mat-ter yield was delayed until spring.
Spring Evaluation. During the spring of 1998, foragedry matter yield was determined for each plot on five datesat three-week intervals (4 March, 24 March, 15 April, 4 May,and 26 May). Forage yield of cereal grains was determinedby clipping two 1/4-m2 frames within each plot. Undesir-able species were removed in the field. Cereal grains wereharvested with hand shears at an approximate one-inch cut-ting height. Clipped forage was dried to constant weight at50oC and dry matter yield was determined by applying ap-propriate conversion factors. On each clipping date, threerepresentative plants within each plot were measured forheight and evaluated for growth stage using a linear scale(Stauss, 1994; see Table 1). Forage dry matter yield, growthstage, and plant height were evaluated as a split-plot designwith repeated measures. However, sources of variation thatincluded seeding rate and/or herbicide treatment were con-sistently nonsignificant (P > .05). Therefore, these terms weredropped from the analysis. An independent randomized com-plete block analysis was conducted subsequently for eachcereal grain with harvest date as the treatment factor. Linearregression techniques were used to evaluate the relationshipbetween plant height and yield for each cereal grain.
Results and Discussion
Fall Row Coverage. Fall row coverage was generallygood (overall mean = 79.4%) for all treatment combinations.Increasing seeding rate did not improve row coverage in the
fall (P > .05). Herbicide treatment improved fall row cover-age (P < .05); however, the interaction of herbicide treat-ment and forage species (Table 2) was significant (P = .018).When herbicide was applied to the bermudagrass sod at es-tablishment, fall row coverage of oat, wheat, and rye did notdiffer (overall mean = 83.5%). Without herbicide treatment,oat displayed the best row coverage (86.7%), which was sig-nificantly greater than that of wheat (64.8%). Row coveragefor rye was intermediate between the other forage species,but did not differ significantly from either.
Growth Stage. For all three forage species, there wereonly minor changes in plant maturity between the 4 Marchand 24 March harvest dates (Table 3). During this time pe-riod, below-freezing temperatures may have limited plantdevelopment. Beginning on 24 March, plant maturity for eachcereal grain increased (P < .05) during each three-week sam-pling interval; although, rye matured faster than the otherforages, particularly oat. This was especially evident on April15, when the inflorescence of rye was fully emerged. On thesame date, the tip of inflorescence was just beginning toemerge in wheat plants, while oat plants were just enteringboot stage. By 4 May, growth stages of rye and wheat wereidentical; in both species, grains were beginning to fill fol-lowing anthesis. The inflorescence of oat was fully emergedon this date, thereby representing a 19-day delay reachingthis stage of development, relative to rye. On 26 May, bothrye and wheat had reached the early dough stages of graindevelopment, but oat grains were still exhibiting a milkycharacter.
Plant Height. Cereal rye has a substantially tallergrowth habit than either wheat or oat (Table 3). Rye reacheda maximum height (57.4 inches) that was more than twicethat of wheat (26.7 inches). Both rye and wheat reached theirmaximum height on the May 4 harvest date, but oat plantsgrew about 7.5 inches (P < .05) between 4 May and 26 May,thereby illustrating the slower development characteristicsof oat.
Forage Yield. Forage dry matter yields for rye, wheat,and oat are shown in Table 3. The freezing weather condi-tions (< 10oF) that occurred between the 4 March and 24March harvest dates had a dramatic effect on wheat yields.Final dry matter yields for wheat on 26 May were only 48.5and 59.6% of those for rye and oat, respectively. There wasalso a noticeable thinning of wheat stands in association withthis severe cold period. Rye (which is known to be cold tol-erant) and oat plots did not appear to be thinned by Marchweather conditions. The rapid development of cereal rye wasevident in the distribution of dry matter production. Rye ac-cumulated 50.7% of its total dry matter production by April15. This contrasted sharply with oat, which accumulated only41.2% of its total dry matter production by this date. Basedon this work, it appears that total yields of 4000 lb/acre arerealistic for sod-seeded cereal grains in northern Arkansas.However, these yields are weather dependent. Most impor-tantly, none of the treatments included in this study facili-tated accumulation of dry matter in the fall. By 24 March,no cereal grain had produced more than 750 lb/acre of for-

AAES Research Series 470
164
age dry matter. The severe cold during mid-March may havecontributed to this apparent slow development, but it is clearthat the establishment techniques evaluated in this study didnot allow sufficient dry matter production in the fall, winter,and early spring to support intense livestock enterprises.
Relationship Between Forage Height and ForageYield. Forage availability can be managed more easily byproducers if it can be estimated from other measurementsthat are quickly obtained. The simplest method to estimateforage availability is to measure plant height with a rulerand then convert height to lbs/acre. Therefore, forages thatexhibit close relationships between plant height and forageavailability are often easier to manage in a pasture settingthan forage crops that exhibit poor relationships betweenthese characteristics. For each cereal grain, forage yield dataat each harvest date was regressed on the corresponding plantheight on that same date (Table 4). A total of 80 observa-tions were included in each regression (16 observations/spe-cies/harvest date). Slopes ranged from a low of 88 lb/in forrye up to 119 lb/in for oat; however, these parameter esti-mates were not different (P > .05). Intercepts for each spe-cies differed (P < .05), and all intercepts were negative (range= -229 to -640 lb/acre). The r2 statistics ranged from .54 to.67, indicating that about 54 to 67% of the variability in yieldacross the five harvest dates could be explained on the basisof plant height alone. Much of the variability not explainedby plant height is probably associated with grain develop-ment. This process added considerably to forage dry matteryield after the plants had reached their maximum height. Thistrend was particularly evident for rye and wheat harvestedbetween 4 May and 26 May. This research suggests that thereis an increase of about 100 lb of forage dry matter per acrefor every inch of plant height.
Implications
These findings suggest that total forage dry matter yieldsof 4000 lb/acre are realistic for overseeded cereal grains innorthern Arkansas. Unfortunately, this growth is primarilyrestricted to the period between mid-March and early June.Application of glyphosate at seeding and/or increased seed-ing rates did not improve the accumulation of forage drymatter during the fall, winter, or early spring. This severelyrestricts the cost-competitiveness of overseeded cereal grainsfor cow-calf production, relative to perennial cool seasongrasses. This practice may be more appropriate in northernArkansas for producers interested in a single mechanicalharvest as silage or hay. These results represent the growthcharacteristics during the 1998 growing season in northernArkansas. Caution should be used when using these resultsto estimate growth/yield potential for other varieties, grow-ing seasons, or locations.
Literature Cited
Cuomo, G.J., and D.C. Blouin. 1997. J. Prod. Agric. 10:256-260.
Stauss, R. 1994. Compendium of growth stage identifica-tion keys for mono- and dicotyledonous plants. Ex-tended BBCH scale. Compiled by Reinhold Stauss.Ciba-Geigy AG, Basel, Switzerland.

Arkansas Animal Science Department Report 1999
165
Table 1. BBCH (European) uniform decimal code for describing morphological developmentof cereal crops (Stauss, 1994).
Code Morphological descriptor
Principal growth stage 1: leaf development10 first leaf through coleoptile11 to 18 leaves 1 to 8 unfolded19 9 or more leaves unfolded
Principal growth stage 2: tillering20 no tillers21 beginning of tillering, first tiller detectable22 to 28 2 to 8 tillers detectable29 9 or more tillers detectable
Principal growth stage 3: stem elongation30 beginning of stem elongation31 first node at least 1 cm above tillering node32 to 38 nodes 2 to 8 detectable
Principal growth stage 4: booting41 early boot stage, flag leaf sheath extended43 midboot stage, flag leaf sheath just visibly swollen45 late boot stage, flag leaf sheath swollen47 flag leaf sheath opening49 first awns visible
Principal growth stage 5: heading51 tip of inflorescence emerged from sheath, first spikelet just visible53 30% of inflorescence emerged55 50% of inflorescence emerged57 70% of inflorescence emerged59 inflorescence fully emerged
Principal growth stage 6: flowering, anthesis61 beginning of flowering, first anthers visible65 full flowering, 50% of anthers mature69 end of flowering, all spikelets have completed flowering but some
dehydrated anthers may remainPrincipal growth stage 7: development of fruit
71 watery ripe, first grains have reached half their final size73 early milk75 medium milk, grain content milky, grains final size, but still green77 late milk
Principal growth stage 8: ripening83 early dough85 soft dough, grain content soft but dry, fingernail impression not held87 hard dough, grain content solid, fingernail impression hard89 fully ripe, grain hard, difficult to divide with a thumbnail
Principal growth stage 992 over-ripe, grain very hard, cannot be dented by thumbnail93 grains loosening in day time97 plant dead and collapsing99 harvested product

AAES Research Series 470
166
Table 2. Fall row coverage for forage species by herbicide treatment interaction meansof fall sod-seeded winter annuals at Batesville in 19971. Herbicide treatment was applied
as glyphosate at a rate of one quart per acre.
Herbicide treatmentForage species No herbicide Herbicide
----------------------------%--------------------------Oat 86.7a 80.9a
Rye 74.7ab 83.8a
Wheat 64.8b 85.7a
LSD (.05) -------------------------12.7-------------------------
a,b Means without common superscripts within a column differ (P < .05).1 Rows evaluated for coverage 56 days after seeding (November 20, 1997) by tabulating blank spaces (in tenths
of a foot). Coverage calculated as: coverage (%) = 100 - ([blank spaces / 20 ft] x 100).
Table 3. Growth stage (Stauss, 1994; see Table 1), plant height, and forage yield for three fall-seededcereal grains harvested on five dates in spring 1998 at Batesville.
Harvest date Growth stage Plant height Yield
in lb acre-1
Oat March 4 27d 5.3d 666c
March 24 26d 6.6d 720c
April 15 43c 16.5c 1670b
May 4 59b 26.4b 2258b
May 26 78a 33.8a 4053a
LSD (.05) 1.1 1.9 677Rye March 4 31e 8.0d 461d
March 24 32d 12.3c 748d
April 15 59c 40.4b 2527c
May 4 70b 57.4a 3627b
May 26 83a 56.2a 4981a
LSD (.05) 0.4 2.4 1146Wheat March 4 30d 8.1d 433d
March 24 31d 9.5c 410d
April 15 51c 20.8b 1153c
May 4 70b 26.7a 1709b
May 26 84a 26.7a 2415a
LSD (.05) 1.1 1.3 553
a,b,c,d,e Means without common superscripts within both a column and a single forage species differ (P < .05).

Arkansas Animal Science Department Report 1999
167
Table 4. Linear regressions of forage dry matter yield on forage height for three fall sod-seeded cerealgrains harvested on five dates in Batesville during the spring of 1998.
Regression statisticsForage n Slope1 SE
slopeIntercept2 SE
interceptr2
Oat 80 119 10 -229 201 0.666Wheat 80 101 11 -640 215 0.538Rye 80 88 9 -586 366 0.553
1 Units for slope are lb/acre/in; slopes did not differ (P > .05) across species.2 Units for intercept are lb/acre; intercepts differed across species (P < .05).

AAES Research Series 470
168
Forage Quality Characteristics and Dry Matter DigestionKinetics of Sod-Seeded Cereal Grains in Northern Arkansas
W.K. Coblentz1, K.P. Coffey1, J.E. Turner1, D.A. Scarbrough1, J.S. Weyers1,K.F Harrison2, L.B. Daniels1, C.F. Rosenkrans, Jr.1,
D.W. Kellogg1, and D.S. Hubbell, III2
Story in Brief
Wheat, oat, and rye were overseeded into a dormant bermudagrass sod and harvested at 3-week inter-vals throughout the spring. Plant growth stage was documented for each forage on each harvest date, andharvested forages were evaluated for forage quality characteristics. Digestion kinetics of dry matter (DM)were also evaluated by the in situ method for these forages. Forage quality was exceptionally high for theseforages through the early stages of stem elongation; the associated degradation kinetics indicated that po-tential extents of degradation were high and rates of degradation were rapid. Forage quality declined andparameters associated with degradation kinetics were less desirable as plants entered the reproductive stagesof growth. This process was more rapid for rye than the other cereal grains. A single harvest for hay orsilage at boot stage or soon thereafter may represent the best compromise between forage yield and quality.
1Department of Animal Science, Fayetteville.2Livestock and Forestry Branch Experiment Station, Batesville.
Introduction
Cereal grains have been drilled routinely into dormantwarm-season grass sods in an attempt to provide fall, winter,and spring grazing for a variety of livestock enterprises. Thispractice works well in southern Arkansas because the cli-mate is favorable for some continued growth of cereal grainsthroughout the late fall and winter and other options for cool-season perennial forages are limited. In northern Arkansas,growth is delayed further into the spring, and adequate for-age availability to support grazing ruminants can not becounted on until early or mid-March. While grazing is stillthe most common method of delivering these forages to live-stock, specific “niche” uses can be observed throughout theregion; these include harvesting the crop on a whole-plantbasis as hay, balage, or chopped silage. This approach alsohas the added advantage of removing the entire canopy atone time, thereby limiting the suppression of the subsequentcrop of bermudagrass. The objectives of this study were toevaluate oat, wheat, and rye harvested on six dates betweenearly March and early June for quality and DM digestioncharacteristics. An additional objective was to evaluate theseforages for growth stage on each harvest date, and relate DMdigestion characteristics to growth stage by various nonlin-ear regression models.
Experimental Procedures
Establishment. This study was conducted at the BatesvilleLivestock and Forestry Branch Station located near
Batesville. The base sod at this site was a well-establishedstand of ‘Tifton 44’ bermudagrass that was harvested as hayin mid-August. Regrowth following haying was limited be-cause of droughty weather conditions; no further removal ofexisting vegetation was attempted prior to establishing thestudy. Existing vegetation at the experimental site was esti-mated by clipping all vegetation (alive and dead) within four1/4-m2 frames selected from random locations throughoutthe site. The mean residual plant DM was calculated to be213 lb/acre. Prior to establishing the plots, the site was fer-tilized to soil test recommendations for fall-seeded cerealgrains. Cereal grain varieties selected for this study included‘Jay Pee’ wheat, ‘Elbon’ rye, and ‘Ozark’ oats. Plots weredrilled in 10-in rows with a 80-in wide Tye Pasture PleaserDrill (The Tye Company, Lockney, Texas) on 24 September1997 at seeding rates of 90, 90, and 96 lb of pure live seedper acre for wheat, rye, and oat, respectively. Individual plots(10 by 30 ft) were drilled with a single drill pass and ar-ranged in a randomized complete block design with four rep-lications. All plots were fertilized with an additional 50 lb ofnitrogen per acre on 14 February 1998.
Sampling and Quality Analysis. Each forage was har-vested at a 1-in stubble height with hand shears on six dates(4 March, 24 March, 15 April, 4 May, 26 May, and 5 June).In association with each harvest, three plants in each plotwere evaluated for growth stage by the method of Stauss(1994; Table 1). Forages were dried under forced air at 122°Fand subsequently ground through a 1-mm screen in a WileyMill (Arthur H. Thomas, Philadelphia, Pennsylvania).Samples were analyzed for neutral detergent fiber (NDF),

Arkansas Animal Science Department Report 1999
169
acid detergent fiber (ADF), and crude protein (CP). Totaldigestible nutrients (TDN) were calculated from predictionequations for cereal grain forages used by the CooperativeExtension Service (TDN = 73.5 + [0.62 x CP] - [0.71 x ADF]).Crude protein, NDF, and ADF were evaluated by standardanalytical procedures. Forage quality indices were analyzedas a randomized complete block design with repeated mea-sures. Because of the unique effects that grain fill has onforage quality indices, heads were removed from each plantand weighed on the 26 May and 5 June harvest dates to de-termine the percentage of total plant DM partitioned withinthe filling grain head.
In Situ Analysis of DM Disappearance. Four 999-lbruminally cannulated crossbred steers were used to deter-mine in situ degradation characteristics. Surgical proceduresand anesthesia for cannulations and care of the steers wereapproved by the University of Arkansas Institutional Ani-mal Care and Use Committee. Steers were housed in indi-vidual 11 by 16-ft pens and offered a total mixed ration at1.75% of BW throughout the trial. The ration contained (as-is basis) 49.3% shredded alfalfa hay (21.0% CP, 54.4% NDF,and 33.0% ADF), 45.9% cracked corn, 3.0% soybean meal,1.0% molasses, 0.36% dicalcium phosphate, 0.46% salt, plusa vitamin premix. Water was provided for each steer for adlibitum intake. Steers were fed twice daily in equal portions(0700 and 1600 h) and were adapted to the basal diet for 10d prior to initiating the trial.
Standard in situ procedures were used in the trial. Dacronbags (10 x 20 cm; 53 ± 10-ìm pore size; Ankom Co., Fairport,New York) were filled with 5-g samples of dried ground for-age that had previously been ground through a 2-mm screenin a Wiley mill. All bags for each time period were placed ina 36- x 50-cm mesh bag and soaked in tepid (102°F) waterfor 20 minutes to remove water-soluble components and re-duce lag time associated with wetting. All bags, except at 0hours, were inserted into the ventral rumen simultaneouslyjust prior to feeding (0800 hours) and incubated for 3, 6, 9,12, 24, 36, 48, 72, or 96 hours.
After the appropriate interval, mesh bags were removedfrom the steers and the contents were emptied into a top-loading washing machine and rinsed; dacron bags from allfive steers were rinsed simultaneously (90 per period). Bagswere subjected to six cold-water rinse cycles with 1 minuteof agitation and a 2-min spin per rinse. Zero-hour bags wererinsed immediately after soaking in tepid water. After rins-ing, dacron bags containing forage residues were dried to aconstant weight at 122°C. After bags were dried, they wereallowed to equilibrate with the atmosphere before subsequentanalysis for residual DM.
Dry matter was partitioned into three fractions based onrelative susceptibility to ruminal degradation. The A frac-tion was defined as the immediately soluble portion; the Bfraction was comprised of DM degraded at a measurable rate;and the C fraction was considered undegradable in the ru-men. Fraction A was determined directly by measuring theDM washed from zero-hour bags in the washing machine.Fraction C was calculated as the portion of DM remaining in
dacron bags that had been incubated for 72 hours; conversely,the maximum extent of degradation was calculated as theportion of DM that disappeared from dacron bags in a 72-hour ruminal incubation. Fraction B was determined by dif-ference (B = 100 - A - C). Data were fitted to the nonlinearregression model described by Mertens and Loften (1980).Lag times and degradation rate constants were determineddirectly from the model. Data for each forage species wereanalyzed as a randomized complete block design with har-vest dates as treatments and steers as the blocking term. Anindependent analysis of variance was conducted for each ce-real forage. Forages harvested on March 4 were not evalu-ated in situ because of limited sample availability. In situdigestion parameters were related to plant growth stage byvarious nonlinear regression techniques.
Results and Discussion
Forage Quality. As expected, forage quality (Table 2)for all cereal grains declined generally with calendar date atharvest and with growth stage. Forage quality indicesthroughout March were excellent for all species; CP for thethree species ranged from 19.4 to 25.4% over the March 4and 24 March harvest dates. During this time period, NDFranged from 40.7 to 42.9%, ADF ranged from 19.6 to 20.4%,and TDN was greater than 72%. The quality characteristicsfor rye declined more rapidly than the other cereal grains.By 15 April, when the inflorescence was approaching fullemergence, the CP concentration had fallen to 8.6%, repre-senting a decline of 11.9 percentage units in a 3-week timeinterval. Concentrations of NDF and ADF increased dramati-cally during this same harvest interval (by 25.8 and 14.9 per-centage units, respectively). Estimates of TDN also declinedfrom 75.3 to 54.1% in response to the elevated levels of fi-ber components, thereby indicating a significant reductionin the energy content of the forage. Forage quality for wheatand oat declined similarly, but the extent of decline was lesspronounced. This was probably related to the slower plantgrowth and development characteristics of these species. By15 April, the inflorescence of wheat plants was just begin-ning to emerge; however, oat plants were even less mature,and just beginning to exhibit swelling in the flag leaf sheath.Generally, forage quality continued to decline for all speciesthrough the harvest date on 4 May. Following this harvestdate, the ADF concentration in wheat declined noticeably,but not significantly (P > .05), probably in association withgrain development (Table 3). In association with this change,the TDN concentration increased by 3.4 percentage units,butthis estimate was not different (P > .05) from estimates madeon 4 May or 5 June. A similar, nonsignificant (P > .05) re-duction in ADF and associated increase in TDN was observedbetween the harvest dates on 26 May and 5 June for rye.Whole-plant estimates of CP for all species were < 8.0% bythe 4 May harvest date.
In Situ DM Disappearance. The extent of DM disap-pearance (Table 4) was extremely high (> 92%) for all ce-real grains on March 24. For all cereal grains, the extent of

AAES Research Series 470
170
disappearance declined (P < 0.05) with harvest date and plantgrowth stage. For both oat and wheat, the extent remained >70%, even on the June 5 harvest date. In contrast, the extentof DM disappearance for rye fell below 70% by May 4. Ratesof DM disappearance were rapid (range = .086 to .111/hour)for all forages on March 24. These rates declined (P < 0.05)with harvest date; however, rates for rye slowed dramati-cally (.043/hour) by April 15 and did not change (P > .05)thereafter. The decline in degradation rates with advancingharvest dates was slowest for oat, reflecting the slower growthand development characteristics of this species. However,rates of disappearance for all forages were generally slow(< .05/hour) for the May 4, May 26, and June 5 harvest dates.The partitioning of DM into fractions A, B, and C wasstrongly affected by both the negative effects of increasingcalendar date and plant maturity, as well as grain develop-ment and fill. Fraction A, which represents the portion ofplant DM that is immediately soluble in the rumen, decreasedfor all cereal grains between March 24 and May 4. BetweenMay 4 and June 5, fraction A changed little in wheat, butincreased sharply in both oat and rye. These observationsare likely related to grain fill. Dry matter that is unavailablein the rumen (fraction C) increased (P < 0.05) with harvestdate in likely association with increased lignification of thestraw. Fraction B declined (P < 0.05) with harvest date aslignification of the straw increased fraction C in all foragesand grain fill increased fraction A in oat and rye.
Relating Digestion Kinetics and Growth Stage. Therelationsihps between kinetic parameters of DM disappear-ance and plant growth stage are illustrated in Figs. 1 and 2.The relationship between the extent of DM degradation andgrowth stage was best defined by a third-order polynomialmodel (Fig. 1), and exhibited good r2 statistics (r2 > 0.989)for all cereal grains. The potential extent of degradation forcereal rye declined rapidly with increased growth stage; thecorresponding patterns of decline for wheat and oat weremuch slower. The relationship between degradation rate andgrowth stage was best explained with a second-order poly-nomial model, which exhibited good r2 statistics (r2 > 0.959)for all three cereal grains.
Implications
Cereal grain forages grown in northern Arkansas clearlypossess outstanding forage quality characteristics throughthe vegetative and early stem elongation stages of growth.As the reproductive process begins, substantial increases inconcentrations of forage fiber components are accompaniedby decreases in CP and TDN; these characteristics occur morerapidly in rye. Dry matter degradation rates for all cerealgrains were rapid (approximately 10%/hour) for immatureplants, but slowed substantially by the time grain develop-ment and fill began. In grazing situations, every effort shouldbe made to maximize use of vegetative growth. These re-sults suggest that single harvests for hay or silage should bemade at boot stage or soon thereafter; this appears to offerthe best compromise between yield and quality.
Literature Cited
Mertens, D. R., and J. R. Loften. 1980. J. Dairy Sci. 63:1437-1446.
Stauss, R. 1994. Extended BBCH scale. Compiled byReinhold Stauss. Ciba-Geigy AG, Basel, Switzerland.

Arkansas Animal Science Department Report 1999
171
Table 1. BBCH (European) uniform decimal code for describing morphologicaldevelopment of cereal crops (Stauss, 1994).
Code Morphological descriptor
Principal growth stage 1: leaf development10 first leaf through coleoptile11 to 18 leaves 1 to 8 unfolded19 9 or more leaves unfolded
Principal growth stage 2: tillering20 no tillers21 beginning of tillering, first tiller detectable22 to 28 2 to 8 tillers detectable29 9 or more tillers detectable
Principal growth stage 3: stem elongation30 beginning of stem elongation31 first node at least 1 cm above tillering node32 to 38 nodes 2 to 8 detectable
Principal growth stage 4: booting41 early boot stage, flag leaf sheath extended43 midboot stage, flag leaf sheath just visibly swollen45 late boot stage, flag leaf sheath swollen47 flag leaf sheath opening49 first awns visible
Principal growth stage 5: heading51 tip of inflorescence emerged from sheath, first spikelet just visible53 30% of inflorescence emerged55 50% of inflorescence emerged57 70% of inflorescence emerged59 inflorescence fully emerged
Principal growth stage 6: flowering, anthesis61 beginning of flowering, first anthers visible65 full flowering, 50% of anthers mature69 end of flowering, all spikelets have completed flowering but some
dehydrated anthers may remainPrincipal growth stage 7: development of fruit
71 watery ripe, first grains have reached half their final size73 early milk75 medium milk, grain content milky, grains final size, but still green77 late milk
Principal growth stage 8: ripening83 early dough85 soft dough, grain content soft but dry, fingernail impression not held87 hard dough, grain content solid, fingernail impression hard89 fully ripe, grain hard, difficult to divide with a thumbnail
Principal growth stage 992 over-ripe, grain very hard, cannot be dented by thumbnail93 grains loosening in day time97 plant dead and collapsing99 harvested product
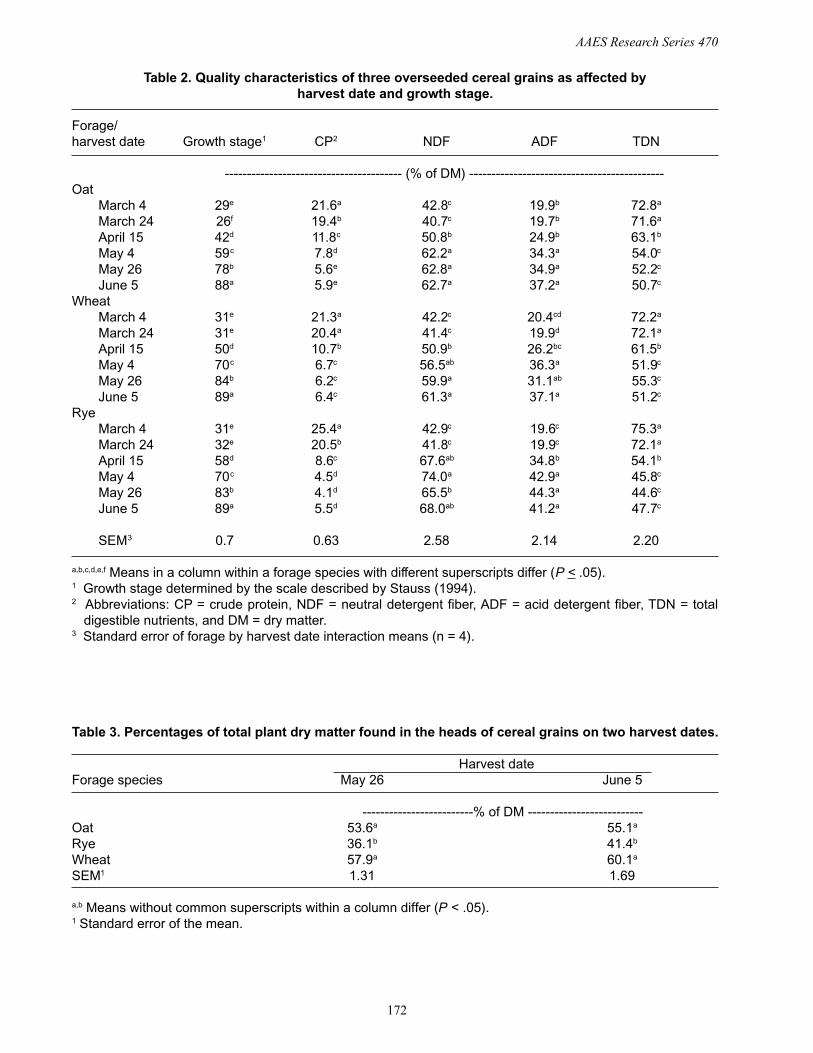
AAES Research Series 470
172
Table 2. Quality characteristics of three overseeded cereal grains as affected byharvest date and growth stage.
Forage/harvest date Growth stage1 CP2 NDF ADF TDN
---------------------------------------- (% of DM) --------------------------------------------Oat
March 4 29e 21.6a 42.8c 19.9b 72.8a
March 24 26f 19.4b 40.7c 19.7b 71.6a
April 15 42d 11.8c 50.8b 24.9b 63.1b
May 4 59c 7.8d 62.2a 34.3a 54.0c
May 26 78b 5.6e 62.8a 34.9a 52.2c
June 5 88a 5.9e 62.7a 37.2a 50.7c
WheatMarch 4 31e 21.3a 42.2c 20.4cd 72.2a
March 24 31e 20.4a 41.4c 19.9d 72.1a
April 15 50d 10.7b 50.9b 26.2bc 61.5b
May 4 70c 6.7c 56.5ab 36.3a 51.9c
May 26 84b 6.2c 59.9a 31.1ab 55.3c
June 5 89a 6.4c 61.3a 37.1a 51.2c
RyeMarch 4 31e 25.4a 42.9c 19.6c 75.3a
March 24 32e 20.5b 41.8c 19.9c 72.1a
April 15 58d 8.6c 67.6ab 34.8b 54.1b
May 4 70c 4.5d 74.0a 42.9a 45.8c
May 26 83b 4.1d 65.5b 44.3a 44.6c
June 5 89a 5.5d 68.0ab 41.2a 47.7c
SEM3 0.7 0.63 2.58 2.14 2.20
a,b,c,d,e,f Means in a column within a forage species with different superscripts differ (P < .05).1 Growth stage determined by the scale described by Stauss (1994).2 Abbreviations: CP = crude protein, NDF = neutral detergent fiber, ADF = acid detergent fiber, TDN = total
digestible nutrients, and DM = dry matter.3 Standard error of forage by harvest date interaction means (n = 4).
Table 3. Percentages of total plant dry matter found in the heads of cereal grains on two harvest dates.
Harvest dateForage species May 26 June 5
-------------------------% of DM --------------------------Oat 53.6a 55.1a
Rye 36.1b 41.4b
Wheat 57.9a 60.1a
SEM1 1.31 1.69
a,b Means without common superscripts within a column differ (P < .05).1 Standard error of the mean.

Arkansas Animal Science Department Report 1999
173
Table 4. In situ DM degradation characteristics for three cereal grains. Characteristics for the harvest date on March 4 were not evaluated.
Forage/ 72-hour Effectiveharvest date A1,2 B C extent23 Lag time k degradability4
------------------- (% of DM) ----------------------- (h) (h-1) % of DM
OatMarch 24 48.3 43.9c 7.8c 92.2a 2.3b .086a 77.8April 15 42.8 48.8b 8.4c 91.6a 1.9b .063b 71.9b
May 4 31.0 51.5a 17.4b 82.6b 2.3b .046c 57.8c
May 26 42.3 33.1c 24.6a 85.4c 5.0a .036c 57.6c
June 5 39.4 34.4c 26.2a 73.8c 4.6a .035c 55.0d
SEM5 --- 0.54 0.54 0.54 0.61 .0038 0.60Wheat
March 246 45.2 47.3a 7.5d 92.5a 1.8b .111a 78.5a
April 15 41.4 46.6a 12.0c 88.0b 1.6b .056b 67.8b
May 4 37.7 37.4b 24.9b 75.1c 4.4a .048b 57.5c
May 26 36.3 35.3c 28.4a 71.6d 0.0b .038b 53.1d
June 5 37.7 32.6d 29.7a 70.3d 0.0b .040b 53.6d
SEM --- 0.57 0.57 0.57 0.54 .0091 0.99Rye
March 246 45.2 49.7a 5.1d 94.9a 0.9ab .099a 80.0a
April 15 28.9 49.9a 21.2c 78.8b 2.5a .043b 54.2b
May 4 22.6 41.2b 36.2b 63.8c 1.9a .034b 41.1d
May 26 25.1 36.9c 38.0ab 62.0cd 0.0b .045b 44.1c
June 5 29.0 32.1d 38.9a 61.1d 0.0b .034b 43.4c
SEM3 --- 0.74 0.74 0.74 0.55 .0040 0.54
a,b,c,d Means in a column within a forage species with different superscripts differ (P < .05).1 Abbreviations: A = Immediately soluble fraction, B = fraction degradable at a measureable rate, C = undegraded
fraction, and k = degradation rate.2 Fraction A determined directly as the portion of total dry matter removed from dacron bags by rinsing.3 Extent of degradation after 72-hour incubation in the rumen.4 Calculated as A + B (k/k + passage rate), where mean passage rate for four animals was .042 h-1.5 Standard error of harvest date means (n=4). Each cereal grain forage was analyzed by separate analysis of
variance.6 Evaluated in three animals.

AAES Research Series 470
174
Fig. 1. Third-order polynomial regressions of the extent of ruminal disappearance of DM on growthstage for wheat, oat, and rye harvested on five dates during the spring of 1998 at Batesville, AR.
Fig. 2. Second-order polynomial regressions of degradation rate for ruminal disappearance of DM ongrowth stage for wheat, oat, and rye harvested on five dates during the spring of 1998 at Batesville, AR.

Arkansas Animal Science Department Report 1999
175
A Field Trial on the Effectiveness of PopularAnthelmintics in Arkansas Horses
Shelly Ryan1, Ron McNew2, T. A. Yazwinski1, Chris Tucker1,Sharon Copeland1, and Paul Turchi3
Story in Brief
In a field trial conducted from June, 1997 to June, 1998, a total of 218 horses from six different farmsin northwest Arkansas were used in the performance of an egg count reduction test to evaluate the effec-tiveness of four commonly used anthelmintics (dewormers). At each farm, horses were randomly allo-cated to one of four treatment groups (ivermectin, oxibendazole, fenbendazole, and pyrantel), and treatedaccording to manufacturers’ instructions. Feces, obtained from each animal on the day of treatment (day0) and again 14 days later (day 14), were used for the determination of nematode egg per gram (EPG)counts. Anthelmintic effectiveness was in turn determined by calculating day 14 reductions from day 0levels. Several parasite egg types were quantified, but the one of most practical importance was theStrongyle; an egg which indicates the abundance and activity of the vast majority of parasites in thehorse’s intestinal tract. Average per farm percentage reductions of Strongyle EPG counts were 63.5(fenbendazole), 89.2 (oxibendazole), 95.6 (pyrantel) and 99.4 (ivermectin). Overall characterization ofthe egg count reductions as exhibited by the anthelmintics are; poor (fenbendazole), borderline(oxibendazole), good (pyrantel) and excellent (ivermectin).
1 Department of Animal Science, University of Arkansas2 Agricultural Statistics Lab, University of Arkansas3 Northwest Equine Services, Fayetteville, Arkansas
Introduction
The horse serves as host to a vast array of metazoanparasites which, for the most part, inhabit its intestinal tract.In a recent paper (Fredrickson, 1999), these parasites are listedalong with their distinguishing characteristics. Parasite in-duced detriment to the horse varies with a number of fac-tors, but the three most important factors are the state of horseresistance, parasite species and parasite abundance. Sincehorses will always harbor parasites (no anthelmintics are100% effective coupled with the fact that every trip to thepasture translates into more parasites in the horse), the ob-jectives of an anthelmintic program should not be to “cure”the horse but rather to reduce the parasite population in thehorse to non-detrimental levels plus limit the extent of para-site challenge in the horse’s environment. In order to attainthese objectives, it is important that anthelmintic effective-ness be assessed on both a farm and regional basis(Reinemeyer et al., 1990). The study reported herein standsas the first and only investigation undertaken in Arkansasthat was designed to evaluate commonly used anthelminticsin horses. Data from this investigation should prove highlyuseful to Arkansas horse owners as they decide whichanthelmintics to use in order to provide effective parasitecontrol on their farms.
Experimental Procedures
Animals - A total of 218 horses from six cooperatingfarms located in northwest Arkansas were used. Procedureswere conducted at one farm at a time and the entire studylasted for one year (June 1997 to June 1998). Both male andfemale horses were used. Body weights (measured by a com-mercial horse and pony height-weight tape) ranged from 200(miniature horse) to 1300 lb on the day of treatment. Ani-mal age ranged from 6 months to 25 years and Quarterhorsewas the predominate breed. Animal numbers per farm rangedfrom 15 to 61 (average of 36). Numbers of horses as female,male, < 1 year of age and > 1 year of age were 141, 77, 60,and 158, respectively.
Treatments - At each site, horses were randomly allo-cated to one of four treatment groups and treated accord-ingly. The treatments (molecule and formulation names),manufacturers and dosage rates were; ivermectin (Eqvalan®,Merial, 0.2 mg/kg BW), fenbendazole (Safe-Guard®,Hoechst Roussel Vet, 5.0 mg/kg BW), pyrantel pamoate(Strongid Paste®, Pfizer, 6.6 mg/kg BW) and oxibendazole(Anthelcide EQ®, Pfizer, 10.0 mg/kg BW). All anthelminticswere administered in paste formulation and at manufactur-ers’ recommended dosages. Care was taken during treatmentto ensure that all administered product was indeed consumedby the horses.

AAES Research Series 470
176
Parasitology - Pretreatment (day 0) and post-treatment(day 14) fecal samples were obtained from each study ani-mal. For each fecal sample, the number of nematode eggsper gram of feces (EPG) was determined according to stan-dard procedure (Parfitt, 1955). For fecal samples with anEPG of > 20, coproculture and infective larvae differentia-tions were performed according to established techniquesand specifications (Ministry of Agriculture, Fisheries andFood [UK], Technical Bulletin No. 18).
Statistics - Initially, EPG counts were transformed tothe log10 (x + 1) to reduce variance inherent to these data.Day 0 and day 14 geometric means were then assessed forsignificant differences using a t-test. In order to determinesignificant differences in EPG reductions (site to site differ-ences per treatment and treatment to treatment differencesper site), day 0 versus day 14 EPG percentage reductionswere calculated for each animal (non-transformed data), andthe treatment group means calculated and analyzed for sig-nificant differences using a multiple t-test. All data wereanalyzed using a current statistical analysis program (SAS,1988).
Results
Day 0 fecal samples from all study animals containedStrongyle eggs, indicating a 100% prevalence for patent in-fections. Incidence of cestode, Parascaris equorum andStrongyloides westeri eggs in day 0 fecal samples was 24, 7and 6%, respectively. Pre-treatment (day 0) Strongyle EPGgeometric means as a property of site, horse sex and horseage are presented in Table 1. Differences were significantbetween sites, but horse gender and age did not significantlyinfluence the egg counts.
Day 0 and day 14 Strongyle EPG geometric means aregiven in Table 2 for all treatment groups by site. Day 0 EPGcounts did not vary significantly between treatment groupson any of the farms, indicating the adequacy of the random-ization procedure. For all sites, ivermectin and pyrantel treat-ment resulted in post-treatment egg counts significantly re-duced from those determined for day of treatment (P < .05).Treatment of horses with oxibendazole yielded significantegg count reductions on five of the six farms, whereas treat-ment with fenbendazole provided significant egg countchanges on only three of the six farms. On one site (farm S),EPG geometric means for horses of the fenbendazole treat-ment group actually increased by 48% from day 0 to day 14.
Mean percentage reductions in Strongyle egg counts bytreatment group specific to farm are presented in Table 3.Mean percent reductions by farm for ivermectin, pyrantel,oxibendazole and fenbendazole treatment groups ranged from98.8 to 99.8, 88.7 to 99.0, 68.6, to 99.5 and 10.8 to 92.5,respectively. Significant differences in anthelmintic effec-tiveness were noted among sites for each product used, aswell as among anthelmintics at each study site (P < .05).
Coproculture and infective larvae differentiations wereconducted on 169 day 0 and 74 day 14 fecal samples. AllStrongyle larvae were of the cyathostome (small Strongyle)
classification. A small number of T. axei larvae were foundin approximately 25% of the samples.
Discussion
As previously stated, the objectives of anthelmintic treat-ment are (1) to reduce the parasite burden in the treated ani-mal to a non-detrimental level and (2) to limit the extent ofparasite contamination and challenge in the animal’s envi-ronment. In regard to the first objective, data accumulatedin the current study (i.e., EPG counts) are at best indirectassessments of worm removal since egg laying activity ismonitored as opposed to worm numbers. Limitations notwithstanding, a threshold of 80% EPG reduction has beenforwarded as the minimal activity which can be consideredindicative of effective parasite removal (Ehlinger andKristula, 1992). Using the above criteria, only ivermectinand pyrantel provided effective therapy on every farm. Ofthe six study farms, oxibendazole proved inadequate (< 80%mean EPG reduction) on one farm and fenbendazole wasless than effective on five of the six farms. A more criticalinterpretation of EPG reductions and coincident anthelminticeffectiveness establishes a 90% EPG reduction as the thresh-old between efficacious and “undesirable” (Coles et al.,1988). According to this latter guideline, only ivermectinprovided effective worm control at all study sites.
In regard to lessening parasite challenge in the horse’senvironment (objective 2 above), EPG count is directly re-lated since fecal eggs, provided optimal conditions of mois-ture and temperature, result in infective pasture larvae in oneweek. Significant reductions in eventual parasite challengewas the consistent result of treatment with ivermectin andpyrantel, with post-treatment EPG counts significantly re-duced from day 0 levels for both products on all farms.Oxibendazole can be seen as significantly reducing contami-nation/challenge on five of the six farms, whereasfenbendazole provided significant reductions on only threeof the six farms.
Oxibendazole and fenbendazole are classified as benz-imidazoles. Results from the current study clearly indicatethat benzimidazole resistance is well established in theStrongyle populations in Arkansas horses. This phenom-enon was first detected soon after drugs of this compoundclass were cleared for use in horses (Drudge et al., 1979).Benzimidazole resistance is now common to all horse pro-duction areas. The abundance of these Strongyles is of suchproportion that current guidelines for anthelmintic evalua-tion in horses establish criteria for their documentation andeffective therapy (Coles et al., 1992).
The current report is on an investigation into the activ-ity of four anthelmintics commonly used in Arkansas as of1997. Since that time, another parasiticide has become avail-able for use in horses which is of unique classification albeitclosely related to ivermectin. This new chemical ismoxidectin, and it is marketed under the trademark of Quest®(Fort Dodge Animal Health). Data from initial studies indi-cate that moxidectin is similar to ivermectin in most mea-

Arkansas Animal Science Department Report 1999
177
surements of efficacy, but that it is superior to ivermectin inactivity against encysted (reservoir) Strongyles (Xiao et al.,1994). This greater spectrum of activity translates into greaterperiods of post-treatment egg count suppression than havebeen seen here-to-fore with any other product. Research isnow in progress at the University of Arkansas to further docu-ment the effectiveness of milbemycin, as well as provideadditional data on the activity of other equine parasiticides.
Literature Cited
Coles, G.C., et al. 1988. Vet. Parasit. 30:57-72.Coles, G.C., et al. 1992. Vet. Parasit. 44:35-44.Drudge, J.H., et al. 1979. AJVR 40:590-594.Ehlinger, C. and M. Kristula. 1992. JAVMA 201:51-55.Fredrickson, S. 1999. Horse Illust. 23:70-74.Ministry of Agriculture, Fisheries and Food (UK), Techni-
cal Bulletin No. 18; Manual of Veterinary Parasitologi-cal Laboratory Techniques. Her Majesty’s StationeryOffice, London, United Kingdom. 1977.
Parfitt, J.W. 1955. Lab. Pract. 4:15-16.Reinemeyer, C.R., et al. 1990. JAVMA 196:712-716.SAS. 1988. SAS Inst., Inc. Cary, North Carolina.Xiao, L., et al. 1994. Vet. Parasit. 53:83-90.
Table 1. Levels of pretreatment, Strongyle EPG counts
EPGSource N Geometric Mean Minimum Maximum
Site C 30 129.7c 6 1014Site H 61 164.4c 2 2538Site J 17 124.5bc 9 666Site P 46 438.5a 2 6502Site S 15 427.6a 78 3948Site T 49 479.7ab 1 6226Female horses 141 275.4 - -Male horses 77 235.0 - -Horses < 1 yr of age 60 290.4 - -Horses > 1 yr of age 158 249.5 - -
a,b,c Means in the same category with unlike superscripts are significantly different (P < .05).
Acknowledgments
The authors wish to thank the owners of the horses: theHocotts, the Pearsons, Jo Cooksey, Toni Hansen, RichardSonn and Julie Johanson. These people were highly sup-portive and essential in the successful conduct of the study,contributing animals, time, facilities and labor on many oc-casions.
The authors also express their gratitude to the followingpharmaceutical companies (and representatives) who pro-vided the drugs used in the study; Pfizer Animal Health (DougWalstrom), Merial (James Hawkins) and Hoechst Roussel(Robert Grant). Regrettably, a posthumous expression ofgratitude is made to Lyman Shoemake of Pfizer AnimalHealth. Lyman served the animal producers of Arkansas well,and is sorely missed by everyone who worked with him.

AAES Research Series 470
178
Tab
le 2
. P
retr
eatm
ent
and
po
st-t
reat
men
t S
tro
ng
yle
EP
G g
eom
etri
c m
ean
s b
y tr
eatm
ent
gro
up
an
d s
ite.
S
tron
gyle
EP
G g
eom
etric
mea
n:
Pre
trea
tmen
t (da
y 0)
P
ost-
trea
tmen
t (da
y 14
)S
iteO
xibe
ndaz
ole
Iver
mec
tinF
enbe
ndaz
ole
Pyr
ante
lO
xibe
ndaz
ole
Iver
mec
tinF
enbe
ndaz
ole
Pyr
ante
l
C12
8.8a
102.
3a18
1.9
85.1
a15
.1b
1.4
b81
.313
.8b
H14
1.3a
166.
0a19
9.5a
138.
0a 6
.5b
1.2
b56
.2b
7.2
b
J16
2.2a
120.
2a89
.114
1.3a
36.3
b3.
7b
24.5
12.0
b
P48
9.8a
631.
0a37
1.5a
407.
4a56
.2b
1.3
b15
1.4b
11.7
b
S57
5.4
466.
7a56
2.3
251.
2a38
9.0
6.2
b83
1.8
22.9
b
T64
5.7a
257.
0a44
6.7a
660.
7a3.
2b
1.3
b33
.1b
6.9
b
a,b
Day
0 a
nd d
ay 1
4 E
PG
mea
ns o
f the
sam
e si
te a
nd tr
eatm
ent g
roup
des
igna
tion
with
unl
ike
supe
rscr
ipts
are
sig
nific
antly
diff
ere
nt (
P <
.05)
.

Arkansas Animal Science Department Report 1999
179
Table 3. Mean percent reductions of Strongyle EPG counts (day 0 vs. day 14)by treatment group for each site.
Treatment (dose rate)Oxibendazole Ivermectin Fenbendazole Pyrantel
Site (10.0 mg/kg) (0.2 mg/kg) (5.0 mg/kg) (6.6 mg/kg)
C 89.52 bc 98.81 b 58.42 b 88.72 c
H 96.62 b 99.31 b 78.93 a b 95.42 bc
J 89.52,3 bc 99.21 ab 75.83 ab 97.21,2 abc
P 91.43 bc 99.81 a 64.64 b 97.32 ab
S 68.62,3 c 99.71 ab 10.83 b 95.82 abc
T 99.51 a 99.61 ab 92.52 a 99.01 a
1, 2, 3, 4 Means in the same row (within site) with unlike superscripts are significantly different (P < .05).a, b, c Means in the same column (treatment group) with unlike superscripts are significantly different (P < .05).

AAES Research Series 470
180
1998 Dairy Herd Improvement Herds in Arkansas
Jodie A. Pennington1
Story in Brief
During 1998, 115 of the 488 dairy cattle herds in Arkansas were enrolled in the Dairy Herd Improve-ment (DHI) program. Sixty-six herds completed at least nine DHI tests with102 cows/herd averaging15,176 lb milk, 539 lb fat, and 493 lb protein and 176 days in milk. Raw somatic cell count averaged498,790. The value of milk sold per cow was $2,624; income over feed costs was $1,734.
Feed cost per CWT of milk was $6.37, or 37% of the average blend price for milk of $17.12. The 52herds that were on official, supervised records averaged 99 cows/herd, 15,319 lb of milk/cow, and in-come over feed costs of $1,840. For the 14 herds using private, unsupervised DHI records, milk/cowaveraged 14,665 lb with 110 cows in the herd and $1,278 income over feed costs. The Arkansas averagefor milk/cow is 13,041 lb/year. Herds not on DHI records average about 12,000 lb/year compared to the15,176 lb for herds on DHI. This difference, approximately 3,000 lb/cow/year, affects income per cow byover $500/cow or approximately $50,000/year. The quartile data of milk production for the Holsteinswith DHI records also reinforce that income over feed costs increases as milk production increases. Otherrecords for health, reproduction, genetics, and inventory as well as production contribute to this differ-ence in income/cow. Since less than 25% of the state’s herds are enrolled in the DHI record-keepingprogram, opportunities exist for raising the level of milk production in the state by encouraging moreproducers to use DHI records.
1Animal Science Section, Cooperative Extension Service, Little Rock.
Introduction
Successful dairy producers must have accurate and reli-able records to make sound management decisions. The DairyHerd Improvement (DHI) program provides a comprehen-sive herd analysis and management report that includes in-formation concerning production, reproduction, genetics,herd health, animal and feed inventory, and finances. Thedata can be used to improve efficiency of milk productionby (1) identifying least profitable cows for culling, (2) feed-ing for more efficient production, (3) selecting animals withthe greatest genetic potential for production as replacements,and (4) utilizing summaries of the data to make precise man-agement decisions that improve net income.
Typically, herds on DHI produce 3,500 to 4,500 lb moremilk per year than herds not on DHI. This difference inproduction has a significant effect on net income for the dair-ies. Income over feed costs is associated with greater milkproduction per cow. The dairy herd summaries also allow adairy producer to compare production, health, reproduction,and financial aspects of his/her dairy to other dairies, so thatareas of management that need improvement can be detected.
Experimental Procedures
Dairy cattle herds on supervised test (n = 52) and unsu-pervised (n = 14) tests were used to report production and
management data for DHI herds. Supervised herds used acertified field technician to collect data for the test milkings(or day) while unsupervised herds collected their own data.The test milking (or day) for each cow included weighingmilk, taking a sample of milk to be analyzed for percentageof fat, protein and somatic cell count (SCC), plus recordingof other management parameters as indicated in Table 1.Milksamples were analyzed at the Heart of America DHILab in Manhattan, Kansas. Records were processed at DairyRecords Management Services (DRMS), Raleigh, NorthCarolina.
Results and Discussion
Rolling herd averages for all supervised and unsuper-vised DHI herds are in Table 1. The weighted average milk/cow for the 66 herds was 15,176 lb/year. Supervised herdshad a greater income over feed costs than unsupervised herds,primarily because of increased production per cow. Thisdifference also resulted from greater milk price/cwt ($17.43vs. $16.00).
Tables 2 and 3 show the DHI averages for the differentbreeds of cattle and quartile data of milk production for theHolstein breed. The breed data show the typical differencesfor the Holstein and Jersey breeds. Because of the high fatdifferential this year, Jersey milk averaged $2.12/cwt morethan Holstein milk. Throughout the United States, Brown

Arkansas Animal Science Department Report 1999
181
Swiss cows typically produce more than Guernseys. Muchof the discrepancy here is probably due to the differences inpercent in milk (79% for Brown Swiss vs. 92% forGuernseys).The quartile data for Holsteins illustrate the re-lationship of higher milk production to higher income overfeed costs. However, the higher producing herds did tend tohave decreased reproduction efficiency.
The 66 dairy cattle herds reported here is less than the115 cattle herds that have been reported on DHI through othersummaries. The primary reason for the difference in num-bers is that herds reported here have at least nine test peri-ods. There also were goat herds on the list that included anyherd on DHI in 1999, including herds no longer on the DHIprogram. Still, less than 25% of the 488 herds in 1999 wereinvolved in the DHI program. Herds on DHI averaged 15,176lb milk/year compared to the Arkansas average of 13,041lbmilk/year. Omitting DHI herds from the state average in-dicates that the non-DHI herds averaged about 12,000 lb milk/year. The difference of 3,000 lb milk/cow/year affects in-come by over $500/cow/year if the mailbox price of milk is$17.12. This difference in milk income is $50,000 per yearin a 100-cow herd.
Implications
Participation in the DHI program affords dairy produc-ers an opportunity to maintain milk production records onindividual cows as well as records of other managementpractices. Herds using DHI records averaged 15,176 lb milk/cow/year compared to approximately 12,000 lb/cow for herdsnot on DHI test. The University of Arkansas CooperativeExtension Service needs to continue encouraging producersto enroll on the DHI Testing program.

AAES Research Series 470
182
Table 1. 1998 DHI Comparisons for Dairy Cow Herds in Arkansas by Type of Test.
Supervised UnsupervisedAll herds herds herds
Rolling herd averages (N = 66) (N = 52) (N = 14)
Milk (lb) 15,176 15,319 14,665% Fat 3.8 3.8 3.7Fat (lb) 539 549 498% Protein 3.4 3.4 3.4Protein (lb) 493 502 460Days in milk 176 175 181% in milk 83 84 78Number cows/herd 102 99 111Days dry 76 77 80Standardized 150-day milk 54 55 49Summit test day milk 60 60 591st Lactation (lb) 51 51 502nd Lactation (lb) index slightly 60 61 55> 3rd Lactation (lb) 67 67 63Projected calving interval (mo) 14.1 14.2 13.6Raw SCC (x 1,000) 499 472 597Average age (mo) 53 51 59% Heats observed 39 39 34% Successful breedings 40 42 32Services/conception - pregnant cows 1.7 1.9 0.9Days to 1st service 87 97 50Age 1st calving (mo) 27.9 27.9 28.1Cow PTA $ - 1st Lactation +117 +118 +109Cow PTA $ - 2nd Lactation +100 +96 +132Cow PTA $ - 3rd Lactation +68 +67 +80Service proven sire PTA $ +187 +181 +221% Cows leaving herd 34 35 28% Cows 1st lactation 32 32 29Feed cost/CWT milk $6.37 $6.56 $5.56Milk price/CWT $17.12 $17.42 $16.00Feed costs/year $843 $880 $680Income over feed ($ per cow) $1,743 $1,840 $1,278

Arkansas Animal Science Department Report 1999
183
Table 2. 1998 DHI Comparisons for Dairy Cow Herds in Arkansas by Breed
BreedsBrown
Holstein Jersey Swiss GuernseyRolling herd averages (N = 52) (N = 4) (N = 2) (N = 1)
Milk (lb) 16,012 12,094 13,555 14,288Fat % 3.7 4.7 4.0 4.3Fat (lb) 556 546 496 572Protein % 3.3 3.9 3.7 3.9Protein (lb) 512 453 484 427Days in milk 170 160 190 270% in milk 83 83 79 92Number cows/herd 111 104 50 77Days dry 75 73 88 85Standardized 150-day milk 55 40 45 43Summit test day milk 63 48 54 601st Lactation (lb) 54 40 47 522nd Lactation (lb) index slightly 63 47 58 61> 3rd Lactation (lb) 70 53 61 67Projected calving interval (mo) 14.1 14.0 14.8 16.7Raw SCC (x 1,000) 511 322 369 427Average age (mo) 53 51 49 52% Heats observed 36 65 50 56% Successful breedings 40 43 19 22Services/conception - pregnant cows 1.7 2.2 1.1 2.5Days to 1st service 86 85 46 104Age 1st calving (mo) 28 26 30 27Cow PTA $ - 1st Lactation +124 +99 +136 +61Cow PTA $ - 2nd Lactation +108 +58 +120 +25Cow PTA $ - 3rd Lactation +180 +34 +52 +42Service proven sire PTA $ +195 +183 +192 +127% Cows leaving herd 35 16 26 24% Cows 1st Lactation 31 30 41 42Feed cost/CWT milk $5.45 $5.59 $7.31 $9.18Milk price/CWT $16.85 $18.97 $18.41 $16.74Feed costs/year $865 $701 $1,051 $1,102Income over feed ($ per cow) $1,835 $1,712 $1,225 $1,215

AAES Research Series 470
184
Table 3. 1998 Arkansas DHI Comparisons - Holstein Herds
Rolling Herd Averages - Arkansas Holstein HerdsQuartile 1 Quartile 2 Quartile 3 Quartile 4
Milk (lb) 19,929 17,356 14,826 12,498% Fat 3.4 3.5 3.5 3.5Fat (lb) 674 598 520 433% Protein 3.2 3.2 3.2 3.2% Protein (lb) 639 557 481 402Days in milk 191 183 198 183% in milk 88.3 85.5 85.5 79.3Days dry 69.8 68.2 80.6 86.8Standardized 150-day milk 68.3 60.1 53.1 46.5Peak milk - All 81.7 74.2 65.0 59.41st Lactation - lb 71.6 61.8 54.1 51.62nd Lactation - lb 83.2 74.3 65.4 60.9> 3rd Lactation - lb 91.2 81.1 69.1 61.6Raw SCC x 1000 390 423 437 597Days open 162 169 205 215Freshening interval (mo) 14.5 14.8 15.9 16.3Services/conception - all cows 3.2 2.3 2.7 2.4Services/conception - pregnant cows 2.2 1.8 1.8 1.7% Heat observed 36.5 33.3 27.9 31.0AIPL PTA $ - cows $61 $38 $19 $38AIPL PTA $ - sires $109 $81 $80 $69Income over feed $ per cow $1,918 $1,700 $1,588 $1,278

Arkansas Animal Science Department Report 1999
185
Comparison of Magnesium Sources on MuscleColor and Tenderness of Finishing Sheep1
Jason Apple, Butch Watson, Ken Coffey, and Beth Kegley2
Story in Brief
Twenty Rambouillet wether lambs were used to compare the effects of supplemental magnesiumsource on muscle color and tenderness of finishing sheep. Lambs were housed in individual pens and fed1 of 4 high-concentrate finishing diets: 1) unsupplemented controls (C); 2) supplemented with 0.16%magnesium-oxide and 0.18% iron-sulfate (MgO+FeS); 3) supplemented with 0.9% unweathered Mag-nesium-Mica (UMM); or 4) supplemented with 1.0% weathered Magnesium-Mica (WMM). Sheep werefed for 95 days before slaughter. Following a 24-hour chill period, carcasses were fabricated into primalcuts, and CIE L*, a*, and b* values and reflectance spectral analysis were determined on the longissi-mus muscle (LM), triceps brachii (TB), semimembranosus (SM) and semitendinosus (ST) after a 45-min bloom period. Additionally, four 1-in thick LM chops were fabricated from the rack. One chop wasanalyzed for ether extractable lipid content, and three chops were cooked to an internal temperature of160°F for Warner-Bratzler shear (WBS) force determinations. Magnesium source had no effect (P > .10)on objective color measurements of the LM, TB, SM, or ST. Longissimus muscle chops from lambs fedUMM had less (P < .05) intramuscular lipid and higher (P < .05) WBS force values than chops from C-lambs or lambs supplemented with MgO+FeS or WMM. Although magnesium-supplementation had noappreciable effects on muscle color, supplementing lamb finishing-diets with unweathered Magnesium-Mica may result in producing less palatable cooked lamb.
1 Appreciation is expressed to Micro-Lite, Inc. for providing Magnesium-Mica and partial financial assistance. Additionally, the authors wouldlike to express their sincere appreciation to Dianna Watson, Eric Oxford, Jesse Davis, Jerry Stephenson, and Lilly Rakes for assistance inanimal slaughter, carcass fabrication, and data collection, and to Dr. Zelpha Johnson for statistical consultation.
2 All authors are associated with the Department of Animal Science, Fayetteville.
Introduction
Magnesium (Mg) is required in several biological reac-tions, including the protein synthesis and Mg-ATP complexin muscle. More recently, supplementing feedlot diets offinishing cattle with magnesium has been shown to increasemarbling scores and the percentage of carcasses grading U.S. Choice, or higher (Coffey and Brazle, 1995; Coffey et al.,1995). In swine, supplementing finishing diets has been re-ported to reduce the incidence of pale, soft and exudative(PSE) carcasses and improve muscle color (Otten et al.,1992), and improve water-holding capacity in pork (Schaeferet al., 1993; D’Souza et al., 1998).
Magnesium oxide (MgO) is often the Mg supplementof choice because of its high Mg content (53.5%) and buff-ering capacity. Another Mg source is Magnesium-Mica, asilica-based product used primarily in the feed industry as apellet binder. Magnesium-Mica contains approximately 8.9%Mg, has similar Mg bioavailability as MgO, and is less ex-pensive; however, it also has a relatively high iron concen-tration (4%), which can have growth depressing effects inruminants (Standish and Ammerman, 1971; Standish et al.,1971). Because of previous studies indicating a positive ef-
fect of supplemental Mg on meat quality and the scarcity ofinformation comparing Mg sources on meat quality, the ob-jective of this study was to compare the effects of supple-mental Mg sources on muscle color and cooked meat ten-derness.
Experimental Procedures
Twenty Rambouillet wether lambs (79.6 lbs.) wereplaced in individual pens and randomized to one of fourground corn-based diets for a 95-day feeding study. Treat-ment groups consisted of 1) a control (no supplemental sourceof magnesium or iron); 2) MgO at 0.16% and iron sulfate at0.18% (MgO+FeS) of the diet; 3) unweathered Magnesium-Mica (UMM) at 0.9% of the diet; or 4) weathered Magne-sium-Mica (WMM) at 1.0% of the diet. In the geographicalformations from which Magnesium-Mica is mined, WMMlies close to the surface and has undergone weathering,whereas, UMM is located beneath WMM and has been pro-tected from environmental exposure.
Lambs were slaughtered at the University of ArkansasRed-Meat Abattoir according to industry-accepted proce-dures. Carcasses were chilled at 34°F for 24 hours, then

AAES Research Series 470
186
ribbed between the 12th and 13th ribs, and quality and yieldgrade data (USDA, 1987) were collected by university per-sonnel. Carcasses were then fabricated into primal cuts ac-cording to the National Association of Meat Purveyors(NAMP, 1988) specifications. Commission Internationalede l’Eclairage L*, a*, and b* values (CIE, 1976) were mea-sured with a Hunter MiniScan XE (Hunter Associates Labo-ratory, Inc., Reston, VA ) on the longissimus muscle (LM)from the primal loin (NAMP #232), triceps brachii (TB) fromthe primal shoulder (NAMP #207), and the semimembrano-sus (SM) and semitendinosus (ST) from the primal leg(NAMP #233A) after a 45-min bloom period. A full reflec-tance spectral analysis was also take on each muscle andwavelength ratios were used to calculate relativedeoxymyoglobin (474 nm:525 nm), oxymyoglobin (610nm:525 nm), and metmyoglobin (572 nm:525 nm) concen-trations.
The primal rack (NAMP #204) was fabricated into four1-in thick LM chops. All bones and fat were removed fromone chop, and the muscle portion was pulverized and usedto measure the lipid content (USDA, 1987). Each of the re-maining three chops were weighed, then cooked to an inter-nal temperature of 160°F in a commercial convection oven(Blodgett Oven Co., Burlington, Vermont). Temperature wasmonitored with thermocouples, inserted into the geometriccenter of each chop, attached to a multichannel data recorder(VAS Engineering Inc., San Diego, California). Chops werereweighed after cooking, and the difference between the pre-cooked and cooked chop weight was divided by the pre-cooked weight to calculate cooking loss percentages. Chopswere allowed to cool to room temperature, and two 0.5-incores were removed from each chop parallel with the musclefiber orientation. Each core was sheared once through thecenter with a Warner-Bratzler shear (WBS) force device at-tached to an Instron 4466 (Instron Corp., Canton, Maryland)with a 110-lb load cell and a crosshead speed of 250 mm/min.
All data were analyzed with the GLM procedure of SAS(1988) with magnesium-source as the main effect includedin the model. Least-squares means for the main effect werecalculated and separated using the least significant differ-ence procedure of SAS (1988).
Results and Discussion
Magnesium supplementation, regardless of source, hadno effect (P > .10) on CIE L*, a*, and b* values of the LM,TB, SM, and ST (Table 1), or calculated deoxymyoglobin,oxymyoglobin, and metmyoglobin content (Table 2) withinany muscle measured. These findings conflict with the porkmuscle color information from our laboratory (Maxwell etal., 1998; Apple et al., 1999). Maxwell et al. (1998) reportedthat inclusion of Magnesium-Mica in the diet of finishingswine resulted in improvements in subjective color evalua-tions. On the other hand, Apple et al. (1999) found that in-clusion of Magnesium-Mica in the diet of finishing pigs re-duced CIE a* and b* values (less red and less yellow, re-
spectively) for pork LM. Also, there was some expectationthat the high iron content of the MgO+FeS may increasemyoglobin concentration or alter the oxymyoglobin contentin muscle and improve muscle color; however, data fromthis study does not support this hypothesis.
The LM from lambs supplemented with UMM andWMM had less (P < .05) extractable lipid than the LM fromlambs fed the control diet. Our finding conflicts with thoseof Coffey and Brazle (1995) and Coffey et al. (1995), whoreported that intramuscular fat content, or marbling, wasactually increased in the LM of cattle supplemented withmagnesium. Although Mg source did not affect (P > .10)cooking loss percentages, the LM from lambs receivingUMM had higher (P < .05) shear force values compared tothe LM from lambs receiving MgO+FeS, WMM, or C diets.There is no information available supporting or contradict-ing this result, and there does not appear to be a plausibleexplanation for this finding.
Implications
Neither magnesium supplementation or magnesiumsource had any appreciable effects on muscle color or musclepigment state. On the other hand, carcasses from lambssupplemented with unweathered Magnesium-Mica had lowermuscle lipid content, which could result in lower carcassquality grades and the associated economic discounts. Themost disturbing finding was that feeding unweathered Mag-nesium-Mica resulted in less tender/tougher rib chops whencompared to other magnesium sources. This may simply bea result of limited sample size, but further study is warranted.
Literature Cited
Apple, J.K. et al. 1999. Ark. Anim. Sci. Dept. Rep. 2: (Inpress).
CIE. 1976. Commission Internationale de l’Eclairage, Paris.Coffey, K.P., and F.K. Brazle. 1995. Southeast Agric. Res.
Center, Agric. Exp. St., Kansas State Univ., Manhat-tan. Prog. Rep. 733:15.
Coffey, K.P., et al. 1995. Southeast Agric. Res. Center, Agric.Exp. St., Kansas State Univ., Manhattan. Prog. Rep.733:20.
D’Souza, D.N., et al. 1998. J. Anim. Sci. 76:104.Maxwell, C.V., et al. 1998. Ark. Anim. Sci. Dept. Rep. 1:115.NAMP. 1988. National Association of Meat Purveyors,
McLean, Virginia.Otten, W. et al. 1992. Proc. 38th Int. Congress Meat Sci. &
Technol., p. 117.SAS. 1988. SAS Inst. Inc., Cary, North Carolina.Schaefer, A.L., et al. 1993. Can. J. Anim. Sci. 73:231.Standish, J.F., and C. B. Ammerman. 1971. J. Anim. Sci.
33:481.Standish, J.F., et al. 1971. J. Anim. Sci. 33:171.USDA. 1987. USDA Standard Method, pp 3-13.
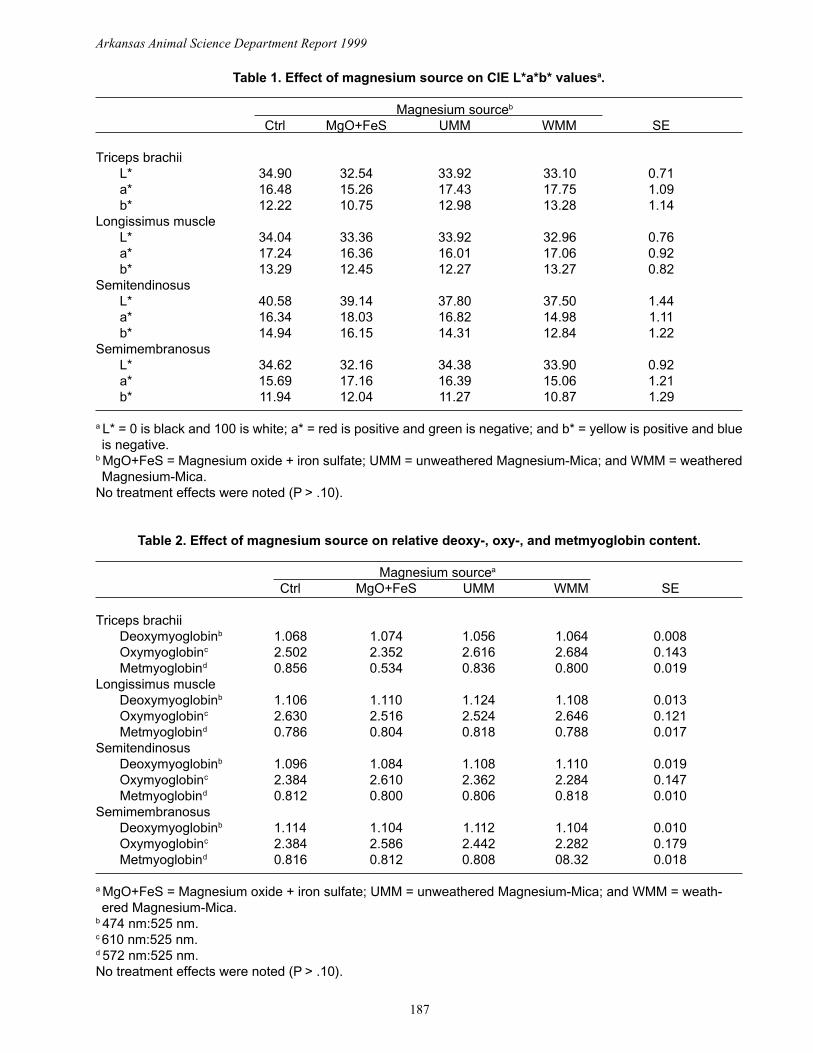
Arkansas Animal Science Department Report 1999
187
Table 1. Effect of magnesium source on CIE L*a*b* valuesa.
Magnesium sourceb
Ctrl MgO+FeS UMM WMM SE
Triceps brachiiL* 34.90 32.54 33.92 33.10 0.71a* 16.48 15.26 17.43 17.75 1.09b* 12.22 10.75 12.98 13.28 1.14
Longissimus muscleL* 34.04 33.36 33.92 32.96 0.76a* 17.24 16.36 16.01 17.06 0.92b* 13.29 12.45 12.27 13.27 0.82
SemitendinosusL* 40.58 39.14 37.80 37.50 1.44a* 16.34 18.03 16.82 14.98 1.11b* 14.94 16.15 14.31 12.84 1.22
SemimembranosusL* 34.62 32.16 34.38 33.90 0.92a* 15.69 17.16 16.39 15.06 1.21b* 11.94 12.04 11.27 10.87 1.29
a L* = 0 is black and 100 is white; a* = red is positive and green is negative; and b* = yellow is positive and blueis negative.
b MgO+FeS = Magnesium oxide + iron sulfate; UMM = unweathered Magnesium-Mica; and WMM = weatheredMagnesium-Mica.
No treatment effects were noted (P > .10).
Table 2. Effect of magnesium source on relative deoxy-, oxy-, and metmyoglobin content.
Magnesium sourcea
Ctrl MgO+FeS UMM WMM SE
Triceps brachiiDeoxymyoglobinb 1.068 1.074 1.056 1.064 0.008Oxymyoglobinc 2.502 2.352 2.616 2.684 0.143Metmyoglobind 0.856 0.534 0.836 0.800 0.019
Longissimus muscleDeoxymyoglobinb 1.106 1.110 1.124 1.108 0.013Oxymyoglobinc 2.630 2.516 2.524 2.646 0.121Metmyoglobind 0.786 0.804 0.818 0.788 0.017
SemitendinosusDeoxymyoglobinb 1.096 1.084 1.108 1.110 0.019Oxymyoglobinc 2.384 2.610 2.362 2.284 0.147Metmyoglobind 0.812 0.800 0.806 0.818 0.010
SemimembranosusDeoxymyoglobinb 1.114 1.104 1.112 1.104 0.010Oxymyoglobinc 2.384 2.586 2.442 2.282 0.179Metmyoglobind 0.816 0.812 0.808 08.32 0.018
a MgO+FeS = Magnesium oxide + iron sulfate; UMM = unweathered Magnesium-Mica; and WMM = weath-ered Magnesium-Mica.
b 474 nm:525 nm.c 610 nm:525 nm.d 572 nm:525 nm.No treatment effects were noted (P > .10).

AAES Research Series 470
188
Table 3. Effect of magnesium source on longissimus muscle lipid content,cooking losses, and lamb tenderness.
Magnesium sourcea
Ctrl MgO+FeS UMM WMM SE
Ether extractable lipid, % 3.39b 2.91bc 2.60c 2.40c 0.23Cooking loss, % 12.77 12.74 12.07 12.44 0.59Shear force, kg 4.13b 4.28b 5.99c 4.34b 0.38
a MgO+FeS = Magnesium oxide + iron sulfate; UMM = unweathered Magnesium-Mica; and WMM = weatheredMagnesium-Mica.
b,c Within a row, least squares means lacking a common superscript letter differ (P < .05).

Arkansas Animal Science Department Report 1999
189
