arlington housing needs assessment
TRANSCRIPT

Arlington Housing Needs Assessment 0
City of Arlington Office of Strategic Initiatives
City Hall, 101 W. Abram Street Final Report Prepared by:
Arlington, Texas 76010 JQUAD Planning Group
March 31, 2020 Final Report
ARLINGTON HOUSING NEEDS ASSESSMENT

Arlington Housing Needs Assessment 1
Executive Summary……………………..………….……………….……….……….….…..….3
Section 1: Introduction………………..…………………………….……….……….……...….6 Section 2: Community Engagement..……………………………………………………… 23
Section 3: Market Demand and Housing Trends Analysis…….….................................38 Section 4: Demographic - Socio Economic Characteristics………..............................72
Section 5: Housing Needs and Market Projections………….…..................................110 Section 6: Recommendations and Strategies……………………………………………133 Section 7: Housing, Planning, and Regulatory……………………….…………………..185 Section 8: Commercial Corridor and Economic Development………………………..204 Section 9: Housing Policies………………………………………………………………….213 Section 10: Implementation............................................................................................214 Section 11: Short-Term, Mid-Term, and Long-Term Implementation………..………………………………………………….…………………..218
Appendices……………..………………………………………………….………………….228
TABLE OF CONTENTS
Arlington Housing Needs Assessment 2
The City of Arlington would like to send a very special thanks to all who participated in the
City’s Housing Needs Assessment (HNA) by recognizing the following individuals and
organizations who contributed to the community engagement, data collection, and
analytical processes:
Residents of Arlington
City of Arlington Mayor’s Office and City Council
Arlington Board of Realtors
Arlington City Departments and Agencies
Arlington Housing Authority
Arlington / Mansfield Independent School Districts
Arlington / Tarrant County Business Owners
The University of Texas at Arlington
Banking and Construction Industries, Apartment Owners, and Developers
Cities of Grand Prairie and Mansfield
Development Corporation of Tarrant County
Health Education Learning Project (HELP)
Housing Channel
NextDoor of Arlington and
Tarrant County Government
ACKNOWLEDGEMENTS
Arlington Housing Needs Assessment 3
What Are Arlington's Housing Needs?
The purpose of this section is to discover what impact Arlington’s rapid growth is having
on its housing market, its current supply of housing units, and to project the number of
units needed. The approach used to project future housing needs starts by examining the
demographic characteristics of existing residents.
Arlington, also known as “The American Dream City”, has been featured in several national
and local “Best City” publications highlighting Arlington’s rapid economic expansion, sports
entertainment attractions and cultural diversity. For these reasons, new residents are
relocating to Arlington making it one of DFW Metroplex’s most popular places to live.
To evaluate current and future housing market demand, the Housing Needs Assessment
(HNA) utilized Envision Tomorrow software, as well as data obtained from the U. S. Census
Bureau, American Community Survey, and the Comprehensive Housing Affordability
Strategy (CHAS). Housing projections between homeowners and renters were compared
from the period of 2018 to 2025.
According to the Texas Demographic Center. Arlington’s population increased over 9%
from 359,410 in 2010 to 392,692 in 2018 with an annual growth rate of 1.21 percent. There
was a slight population increase of 4.6 percent from 2014 to 2018 compared to 4.4 percent
between 2010 and 2014. This rapid population increase correlates directly with the overall
economic growth that began in 2014. We can expect continued population growth at a rate
of 1.55 percent, which calculates to 48,567 new residents, for an estimated population of
441,259 by 2025. On average, 6,938 new residents are projected to relocate to Arlington
annually between 2018 and 2025.
The Balanced Housing Model (BHM) was used to analyze Arlington’s existing housing
supply, and to provide projections for housing needed by 2025 including the matches and
mismatches by age, household income and tenure (rental or owner-occupied). The model
was also used to conduct a capacity analysis of development potential and to forecast age
and income cohorts. Using this information, the model projections were then used as a
EXECUTIVE SUMMARY

Arlington Housing Needs Assessment 4
basis to create a series of policy and strategic recommendations for a balanced,
sustainable future housing supply along with targeted goals that can be used to determine
Arlington’s future progress in addressing future housing needs. Current and future housing
needs of Arlington depends on the underlying economic conditions.
The Housing Needs Assessment (HNA) examines population, occupations, income, and
employment data provided by the Texas Labor Market and the U.S. Bureau of Labor
Statistics. Future housing needs were partially determined utilizing year 2040 population
projections completed by the Texas Demographic Center which factors demographic
change, mortality, fertility, and migration under the Cohort Component Population
Projection Method.
The 2025 total housing demand is based on the actual income distribution of Arlington’s
residents. With this in mind, we add the total Projected Units at 30% Income Level for 2025
at all 7 income levels (160,974) and the total units needed to Replace Obsolete Units
(2,908) and subtracted the 2018 Total Occupied Housing Units Affordable at 30% of
Income (134,984) resulting in a total housing need of 28,898. It is expected that some of
these units will likely be absorbed by the households with income ranges between $15,000
to $50,000 and $100,000 to $150,000 which are showing 7,494 more existing housing
units than projected housing units, otherwise known as a surplus. By subtracting the
housing unit surplus amount of 7,494 from the total housing unit’s need of 28,898, the
adjusted total of housing units needed is 21,404 by 2025.
The Balanced Housing Model (BHM) methodology factors in surplus and assumes that
existing supply is partially utilized or consumed entirely by existing and new households
before the 2025 population demands more new units based on a ratio of one new unit for
each new household. The model also assumes that future housing needs will be heavily
influenced by population growth and consumption by income ranges, which may fluctuate
based on preferences regardless of income range. It is important to note that the model
predicts housing units needed based on analytical data. Projections may increase or
decrease depending on actual population, households, and economic change. More
importantly, the model identifies factors that should be addressed by the City and private
market in response to urgent housing needs and provides a basis for strategies to assist
Arlington Housing Needs Assessment 5
in meeting the projected needs.
In projecting future population growth for Arlington, JQUAD utilized a model that relied on
a specific group of publicly available datasets to determine a 2025 population of 441,259.
However, it should be noted that using historic population data along with local knowledge
of development patterns, the City of Arlington’s internal projection shows an expected
maximum population of around 423,000 at buildout.

Arlington Housing Needs Assessment 6
Overview of the Housing Needs Assessment
The Housing Needs Assessment (HNA) combines an evaluation of housing supply and
demand, economic trends, market, socio-economic and demographic data, with an analysis
of neighborhood conditions, used to forecast future housing needs. Community engagement
and identification of key Issues and opportunities to address those needs were also
incorporated into the analysis. The Home Mortgage Disclosure Act analysis used to evaluate
financial resources available for supporting housing and the Fair Housing Impediment
Analysis provided insight into solving issues and opportunities to improve social equity and
quality of life.
The Housing Needs Assessment identifies future housing needs, and policy options to
encourage implementation of strategies and solutions that support future housing and
economic development goals. The Needs Assessment aligns future housing demand for
current and future residents with economic trends, household and population growth and
yields data intended to guide investment and development decisions in housing and
infrastructure needed to support future housing development.
The data in this document supports development and reinvestment decisions; provides
guidance to the development process, product design, and financing options; informs
government policy and regulatory changes to be evaluated as needed to implement goals;
provides guidance in the interpretation and compliance with existing city, county, state and
federal regulations; and recommends strategies to encourage future housing development
and economic development needed to support housing growth, neighborhood stability and
sustainability for current and future residents. Arlington’s housing market has remained
constant in spite of ongoing changes in the United States financial markets. New, single-
family home sales have increased and/or steadied in the midst of financial tightening in both
developmental and individual mortgage financing. Home sales and building permits issued
reveal steady growth, with increases in number of units being built, and population increases
that will be needed to support increases in housing units being constructed.
SECTION 1: INTRODUCTION

Arlington Housing Needs Assessment 7
The Housing Needs Assessment is guided by the following goals and principles: 1. To determine current and future housing needs for the City of Arlington;
2. To maintain existing housing, neighborhood, and commercial corridor stability and
reverse trends toward neighborhood decline with a focus on sustainability;
3. To understand existing housing characteristics, population trends, prioritized needs,
development opportunities and the constraints on meeting housing demands;
4. To encourage diverse housing types, quality retail and commercial uses, priced to meet
diverse community needs;
5. To define where and how housing development and neighborhood reinvestment
should take place to foster economic opportunity and job growth;
6. To guide public policy and community discussion about planning and revitalization;
7. To encourage the sustained involvement and interest of stakeholders in the future
development of housing in downtown, commercial corridors, entertainment districts and
surrounding neighborhoods;
8. To predict future housing needs and determine where and how housing development
goals can best be implemented;
9. To identify necessary resources to achieve implementation;
10. To increase interest in development by private developers, investors, and financial
institutions.
11. To assist Arlington government officials in targeting reinvestment and formulating public
policy.
12. To ensure that projected housing needs are realized and continue to support future
population and economic growth.

Arlington Housing Needs Assessment 8
Arlington Needs Assessment Study Area
The HNA includes study area boundaries and analysis of all census tracts and zip codes in
Arlington, reflecting where affordability can be achieved based on household earnings in all
income ranges.
Primary Area – All Zip Codes in Arlington Census Tracts
Secondary Area – Tarrant County and Surrounding Cities

Arlington Housing Needs Assessment 9
Population - Population - Arlington has experienced positive trends in population adding
nearly 12,746 new residents from 2015 to 2018. The total population of Arlington in 2018 was
392,462. A comparison of surrounding cities near Arlington reported populations of 191,104
for Grand Prairie, and 67,492 for Mansfield. Additionally, Tarrant County’s population was
2,019,997 for 2018.
Households - Households - Arlington had 134,984 total households in 2018. Of the total
households, 68.8 percent were family households and 31.2 percent were non-family
households. By comparison, Grand Prairie had 60,503 total households of which 76.3
percent were family households and 23.7 percent were non-family households. Mansfield
had 21,856 households of which, 81.1 percent are family households and 18.9 percent are
non-family households. For Tarrant County, total households were 698,995 of which 69.9
percent were family households and 30.1 percent were non-family households.
Race/Ethnicity - Race/Ethnicity - The largest racial/ethnic group in Arlington were Whites,
who accounted for 61.5 percent of the population. The second largest group was Hispanic,
which accounted for about 29.2 percent of the population, followed by African Americans at
23.8 percent.
Income - Income - The median household income for Arlington in 2018 was $58,502.
Approximately 20% of residents in Arlington earn incomes between $50,000 and $74,999
and 22.5% earn incomes below $35,000. Median home value increased substantially for
Arlington from $132,500 in 2010 to $157,600 in 2018. As of 2019, the average home value
in Arlington according to the Tarrant County Appraisal district was $215,347. This means that
home ownership is affordable to large segments of the populations but only 18% to 20% of
the population can afford higher cost housing offered in the city, without being cost burdened.
Housing Units - Housing Units - The ACS estimated 146,962 total housing units in
Arlington, rental and homeownership combined, with 60.3 percent identified as single-
family, 38.2 percent multifamily, and 1.5 percent mobile home and other types. According
KEY FINDINGS – DEMOGRAPHIC AND HOUSING

Arlington Housing Needs Assessment 10
to ALN Apartment Data, multi-family housing developments of 5 units or more reflect an
increase in 2018 and 2019 including 5 new and upcoming developments comprising 1,778
units permitted or under construction. According to data supplied by City of Arlington
Planning and Development Services, multifamily housing developments of 5 units or more
reflect a steady increase in 2018 and 2019 including 21 new and upcoming developments
comprising a total of 3,791 units.

Arlington Housing Needs Assessment 11
Market Analysis
The Market Demand Analysis focuses on Arlington’s housing needs as the primary market
and compares housing availability, cost, and future demand for persons of all incomes in
Arlington and in sub-market areas. The need for market rate housing, housing supported with
public subsidies, public and private incentives were considered. A variety of housing needs
for all income levels will be addressed including rental and homeownership, workforce,
seniors, families, younger demographics, temporary housing for workers, daily in and out
commuters, reinvestment, renovation, and repurpose development of existing housing and
neighborhoods.
The Market Demand Analysis examines several factors that influence and measure the
propensity to obtain housing in Arlington and secondary markets. This includes a range of
housing options affordable to diverse incomes and providing a supply of housing to meet the
needs of a growing economy and population. Meeting the housing demands of the workforce,
market rate consumers, seniors, low- and moderate-income households, and others is
critical. Recent economic trends, job growth, industry’s projection of housing needs for its
workforce, product value, housing renovation, development of new housing, and financing are
all significant factors that impact housing demand.
Housing Trends Analysis Housing Units: According to 2014 – 2018 ACS 5-Year estimates, owner housing occupancy
was 55.2 percent and renter occupancy was 44.8 percent. In 2018, rental housing was
estimated at 60,407 units which was approximately 44.8 percent of the total occupied
housing units in Arlington compared to 55.2 percent among owners. In 2018, it is estimated
that 49,491 of all single-family units were owner occupied with mortgages and 25,086
estimated to be without mortgages. Seniors were the highest percentage among owners with
approximately 48 percent of seniors 55+ reported as owner households. Comparatively,
persons age 44 and below are the highest percentage of renters at approximately 63 percent
of renter households. There is also an increasing demand for rental housing of all types.
KEY FINDINGS – MARKET ANALYSIS AND HOUSING TRENDS
Arlington Housing Needs Assessment 12
Neighborhood and Housing Conditions: Neighborhood and housing conditions are less
desirable in older areas of the city where there are concentrations of poorly maintained
housing. Some obsolete multifamily federally subsidized housing built in the 1960s to 1980
cannot be economically or aesthetically improved without increasing rents. Costs to renovate
would make housing unattainable for low-income populations who need affordable housing
the most.
Owner Housing Price Range and Affordability: Owner units are needed for all income
groups, especially persons with incomes of $35,000 to $50,000 needing housing priced
between $100,000 and $200,000. The average income required to qualify for a mortgage
based on home values of $100,000 to $200,000 is $35,000 to $62,000 annually in total
household income. Additional subsidies to reduce the purchase price and provide down-
payment and closing cost assistance to increase affordability will be needed for low- to
moderate-income populations.
Single Family Unit Size: According to the qualitative data analysis, housing units intended
to address future needs are most desired between 1,250 and 1,500 square feet, 3 bedrooms
- 2 bathrooms. Based on the market preferences and affordability, smaller units are likely
desired by seniors as well as younger demographics including single family, cluster housing,
townhomes, duplexes, and units in mixed use developments. Larger units may be necessary
to support families and extended family. Cost may be a factor for low- to moderate-income
persons. Based on quantitative data from Arlington Board of Realtors, homes priced at
$200,000 and above are trending upward.
Rental Housing Units, Price Range and Affordability: A portion of single-family housing
units serve as rental housing in addition to traditional multi-family rental units, particularly
older units, and units without a mortgage. Apartment developments with 5 or more units were
estimated to be approximately 46,328 according to ALN Apartment Data.
Housing Preferences: Underrepresented housing products in the market include rental
units, more notably in and around downtown, along commercial corridors, in or near
entertainment districts, and other special points of interest. Younger populations, empty
nesters and persons considering entering the market expressed interest in living in these

Arlington Housing Needs Assessment 13
settings. Potential homebuyers identified a need for quality single family ownership housing
in the $100,000 to 150,000 price range. The major obstacle in meeting this need appears to
be the cost-effective ability to produce multifamily rental and single-family ownership housing
in desired locations at a price affordable to those desiring the housing. Solutions include
consideration of development and infrastructure incentives to supplement cost of land and
development associated with development of multifamily, which enhances the feasible for
developments to be financed. Federal and state development and rental subsidies are
needed to create a component of affordable units in market rate developments.
Repurposed Development and Redevelopment in Existing Areas - The Market Demand
Analysis and community engagement process revealed two important considerations.
Existing areas in the City of Arlington are experiencing decline and will require changes in
development patterns and reinvestment in order to transition into areas where future housing
needs can be realized. In some older neighborhoods and along commercial corridors, areas
have lost much of their basic fabric, with quality development being replaced with a
proliferation of vacant lots, obsolete housing, and commercial development. Redevelopment
concepts could include an emphasis on increasing vertical height to make multifamily
development more feasible along with infrastructure improvements that support increased
housing densities. New housing products, financial incentives, development subsidies, and
increased rental and home purchase assistance will be needed.
Economic Indicators and Population Growth – Economic indicators and population
growth are not the only indicators of an increased need for housing. Industry leaders reported
challenges in finding suitable and affordable housing for their workforce, including housing
for temporary and specialized workforce. Over 60% of Arlington residents commute out of
Arlington to surrounding cities for work which generally means Arlington housing is currently
meeting their housing needs based on housing available and affordability.
Household Incomes and Consumer Preferences - In determining Arlington’s future
housing demand, the projection model assumes income dispersal among residents will not
change significantly between 2018 through 2025. Additionally, the projected demand for
housing, based on household income, may overstate the number of low and moderate-
income units needed, for three key reasons. Seniors with assets but low annual incomes may
own their homes; be unable to afford their home if they had to purchase today; and many

Arlington Housing Needs Assessment 14
senior households are cost burden. Households may also double up so they can afford the
housing unit. There are multiple factors within any given housing market that affect the
demand for housing; some predictable and others unpredictable and not used by the model.
Arlington is now the third largest jurisdiction in the Dallas-Fort Worth-Arlington
Metropolitan Statistical Area (MSA) and is no longer considered one of the smaller
suburban towns in the middle of the MSA. The current population of Arlington is over
392,462 and is projected to grow to 441,259 by 2025. The City’s economic base is diverse
and receives national attention because of its professional sports teams and tourist
attractions. The City, home to institutions of higher education including the University of
Texas at Arlington, is experiencing record growth with 43,939 students enrolled in the spring
semester of 2019 according to the Texas Higher Education Coordinating Board. Arlington’s
job growth is increasing, but at a slower rate in comparison to other communities in the
area. Arlington’s job growth was 2.7% for 2018 compared to a DFW MSA average of
3.2%. These growth trends are noteworthy since job growth and population are two of
the most significant factors influencing housing needs. Arlington faces similar concerns
that other metropolitan area face, including transportation, growth management,
environmental issues, sustainability, as well as providing a range of housing alternatives for
its residents. In determining future housing needs, several factors driving current and
projected housing needs in Arlington were considered. Some trends differ from national
trends.
Balanced Housing Model Methodology - To determine the projected future housing needs
of Arlington’s growing population, housing projections were influenced in part by
incorporating data on current supply of rent and owner-occupied housing stock and
demographic information including but not limited to household income, age, birth, and
mortality rates. The Balanced Housing Model, developed by Fregonese Associates was used
to project housing units needed to meet Arlington’s demand by income range, structure, and
size in the 5-year increment between 2018 and 2025. The model assumes there should be
at least one housing unit for every household. Using the Balanced Housing Model, tenure
HOUSING NEEDS – BALANCED HOUSING MODEL FUTURE GROWTH PROJECTIONS
Arlington Housing Needs Assessment 15
choices and incomes determine housing “need.". That means in this model, “affordable” is
not referring to low-income housing, but rather to the relationship between incomes and
housing costs. The “30% rule” assumes that housing is only affordable for a household if it
spends no more than 30% of their gross income on housing expenses.
The model’s approach was designed based on research which shows two variables — age
of head of household (Age=A) and household income (Income=I) — demonstrated
significantly stronger correlation with housing tenure than other variables, including
household size. Fregonese Associates selected these two variables as the primary
demographic variables for the model. In addition, household income is another key variable
used to help determine the affordability component of housing needs. As expected, data
gathered during research on model development showed that different Age/Income (AI)
cohorts make significantly different housing tenure choices. For example, a household
headed by a 53-year-old and earning $126,000 is likely to make a different housing choice
than one headed by a 29-year-old and earning $43,000.
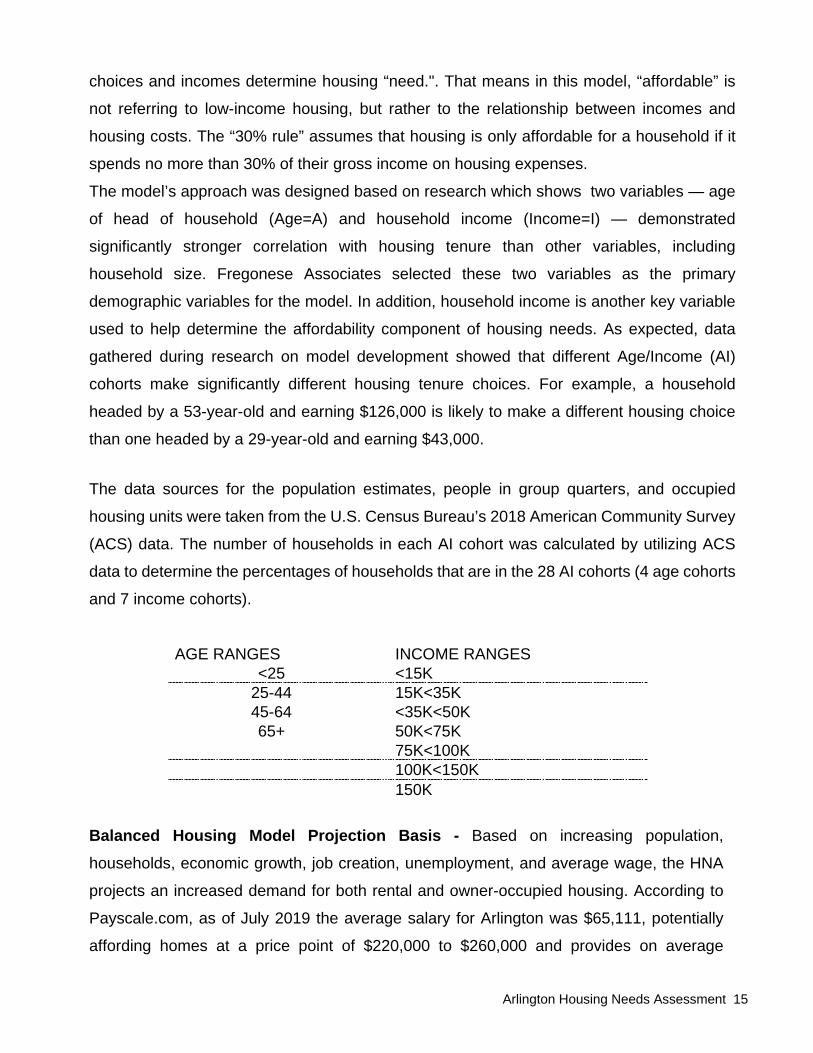
The data sources for the population estimates, people in group quarters, and occupied
housing units were taken from the U.S. Census Bureau’s 2018 American Community Survey
(ACS) data. The number of households in each AI cohort was calculated by utilizing ACS
data to determine the percentages of households that are in the 28 AI cohorts (4 age cohorts
and 7 income cohorts).
AGE RANGES INCOME RANGES <25 <15K
25-44 15K<35K 45-64 <35K<50K 65+ 50K<75K
75K<100K 100K<150K 150K
Balanced Housing Model Projection Basis - Based on increasing population,
households, economic growth, job creation, unemployment, and average wage, the HNA
projects an increased demand for both rental and owner-occupied housing. According to
Payscale.com, as of July 2019 the average salary for Arlington was $65,111, potentially
affording homes at a price point of $220,000 to $260,000 and provides on average
Arlington Housing Needs Assessment 16
approximately $1,625 in income for monthly rent. Average hourly rate of pay is estimated
at $15.67 per hour, or $32,593. The average income of $35,593 will potentially afford
homes at a price range of $120,000 to $140,000 and provides on average approximately
$890 in income for monthly rent. Approximately 20% of residents in Arlington earn incomes
between $50,000 and $74,000 and 26% earn incomes below $35,000. The Balanced
Housing Model projects the following increases in housing units needed in Arlington.
Arlington Housing Projections - The housing supply and demand analysis for owner units
in Arlington shows significantly less owner units compared to the number of households
that can afford housing within the price ranges for all household income categories above
$35,000. This gap in supply of owner units within “upper” household income ranges reveals
limitations in the availability of owner units needed to accommodate the price points of
households earning 100 to 120 percent of median family income. For example, based on
the Balanced Housing Model, in 2018 there was a deficit of approximately 3,531 units of
owner-occupied housing for the $35,000 to $50,000 household income category, and by
2025 that deficit is projected to increase to 7,546 in that age range.
However, Arlington households needing housing (demand) by households in the $0 to
$15,000 (12,600), $50,000 - $75,000 (27,365), and $150,000+ (13,836) ranges far exceed
the number of units within those affordability ranges (supply). Affordability gaps are
significant within the household income categories below $35,000. Persons in these income
ranges have “extremely” and “very low” household incomes and the disparities of more units
available than households who can afford such units are normal. Ownership opportunities
within lower income ranges are likely cost prohibitive without some type of subsidy.
The housing supply and demand for renter units shows a significant gap in the supply of
affordable renter units for “extremely” low and low-income households, those earning $0 to
$15,000 and $15,000 to $35,000 in annual household income. This equates to 15,287
(supply) units affordable to those income ranges and 26,638 (demand) units needed to
accommodate their affordability. Therefore, Arlington has a sizeable gap in the number of
units affordable to household in these income categories needed to accommodate demand
and affordability. Households are likely cost burdened paying more than 30 percent of
household income for housing or experiencing other housing limitations. Based on the
Arlington Housing Needs Assessment 17
Balanced Housing Model, approximately 11,387 units of renter occupied housing will be
needed to meet the demands of household in the $ 0 to $35,000 income ranges by 2025.
Approximately 28,898 total renter and owner housing units combined will be needed for all
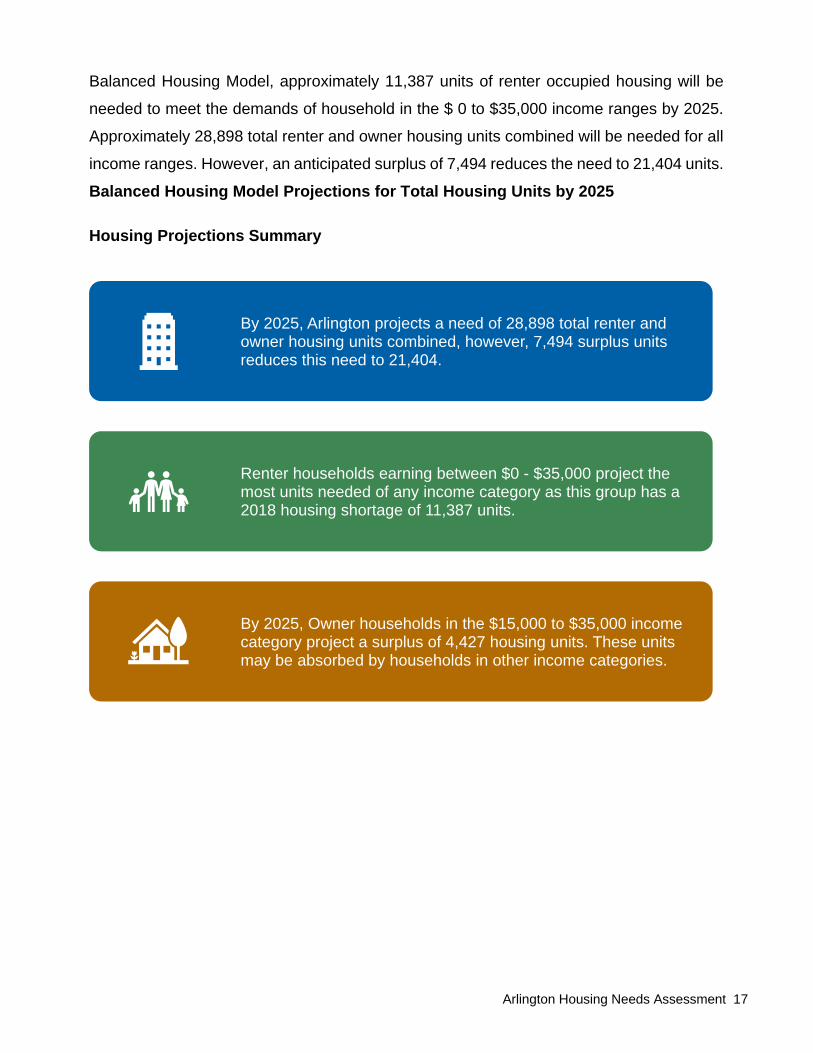
income ranges. However, an anticipated surplus of 7,494 reduces the need to 21,404 units. Balanced Housing Model Projections for Total Housing Units by 2025 Housing Projections Summary
By 2025, Arlington projects a need of 28,898 total renter and owner housing units combined, however, 7,494 surplus units reduces this need to 21,404.
Renter households earning between $0 - $35,000 project the most units needed of any income category as this group has a 2018 housing shortage of 11,387 units.
By 2025, Owner households in the $15,000 to $35,000 income category project a surplus of 4,427 housing units. These units may be absorbed by households in other income categories.

Arlington Housing Needs Assessment 18
Balanced Housing Model Projections for Housing Units Needed by Income 2025
By 2025, seniors will grow from 17 percent of all households in 2018 to 23 percent of all households, the largest growth of any age group.
The renter income category needing the most housing units is the $15,000 to $35,000 category which currently has a deficit of 1,198 housing units.
By 2025, Seniors project a need for 11,917 units, representing 56 percent of Arlington's total housing need fo 21,404 units.

Arlington Housing Needs Assessment 19
Recommendations The recommendations and strategies presented in Sections 6 - 8 are intended to address
housing needs emerging from the housing market, demographic, economic and trends
analyses. Recommendations were refined based on interviews, focus group sessions
and surveys. The strategies and recommendations are based on four fundamental
principles.
First, the recommendations are based on broad strategies that collectively address a wide
range of physical, financial, development, economic, quality of life, policy and regulatory
issues that potentially impact future housing needs.
Quantitative data collected from national, federal, state, and local sources and qualitative
data gathered from community input of residents, industry, businesses, and other
stakeholders, provided the basis for the recommendations reported in Sections 6 - 8. The
recommendations focus on diverse types of housing development strategies needed to
achieve future housing projections ranging from creating new development consistent with
emerging development patterns in areas experiencing various levels of growth, increasing
reinvestment, reversing decline and disinvestment, and strategies creating a greater
infusion of resources to support sustainability.
Secondly, the HNA addresses needed improvements to the community’s basic attributes of
a clean and safe community, adequate delivery of government services, convenient access
to quality retail and commercial services, development of affordable housing, recreation for
all age groups, effective regulatory enforcement, and programmatic enhancements that
ensure a reasonable quality of life for residents.
Third, the HNA identifies strategies aimed at ensuring future housing needs are met and
recommends increased resources that can be dedicated to maintaining existing housing
through innovative programming and increased federal, state, and local subsidies and
RECOMMENDATIONS AND STRATEGIES FOR ADDRESSING HOUSING ISSUES AND OPPORTUNITIES

Arlington Housing Needs Assessment 20
private investment. This includes partnerships between government, business, industry,
and community with emphasis on cultivating and expanding community support.
Fourth, the HNA emphasizes that implementers and policy makers directing the
implementation process and enacting housing policies make tough decisions relative to
resource targeting, leveraging of resources, and the priorities and timelines associated with
each recommendation outlined in the overall HNA.
Finally, the disparity between resource availability and existing needs, dictate that careful
planning and consensus building be at the forefront of implementation to ensure that priority
is given to the most critical issues facing the City of Arlington. These fundamental principles
serve as a starting point for launching the implementation of the HNA. Implementation of
strategies in response to key issues may require additional customization to address the
specific needs in Arlington. Some actions and recommendations are a conceptual
framework for addressing future housing needs and include prototypical best practice
examples demonstrating how other communities have dealt with similar issues. Therefore,
some recommendations will require further research, analysis, securing additional
resources, and final program design by the City of Arlington for implementation.
Strategies The strategies present alternative way of addressing key issues, opportunities, and
recommendations. Strategies include policy, regulatory, housing products and programs
that have proven to remove development constraints in other communities. Some
strategies demonstrate alternative approaches for Arlington due to the unique
characteristics and concerns relative to future housing needs in the city. It is important to
note that the strategies are presented as options in the creation of an overall
implementation plan that will serve as the basis for meeting future housing needs and
sustaining existing housing and neighborhoods. Some strategies will need to be evaluated
for incorporated in the City’s 5 Year Consolidated Plan for 2020.
Arlington Housing Needs Assessment 21
Implementation - The Housing Needs Assessment recommendations are intended to
guide implementation of actions and solutions identified in the report, in response to needs
identified. The recommendations should be divided into categories of short-term, mid-term
and long-term for purposes of estimating timeframes to carry out the implementation
program. The categories and timeframes identified to guide implementation may vary
depending upon resources required for implementation or public policy and regulatory
changes that must be enacted before implementation can occur. Short-term implementation actions should include evaluation of the recommendations
contained in the report to determine fiscal impact, policy implications, and to what extent
recommendations and timeframes for implementation should be adjusted to meet the
needs of individual jurisdictions. Formal adoption of the Needs Assessment by the City of
Arlington is recommended and will underscore the importance of this effort to those who
must carry out the implementation. The City of Arlington will be responsible for post-planning activities and determining the level
of community involvement necessary for implementation. The strategies and
recommendations of the report are intended to guide the implementation of the Plan. The
stakeholders, including neighborhood residents, home buyers, businesses, industries,
local school districts, institutions of higher education, and religious institutions should be
encouraged to continue to provide leadership in refining the recommendations and
transforming the planning area through implementation of the needs assessment and plan
recommendations.
The initiatives and programs described in the HNA may require further study for
implementation and in some instance, pilot programs can be used to further evaluate their
potential application in individual jurisdictions. An evaluation and revision process should
be considered providing for annual auditing of accomplishments and adjustments as
needed to be successful.
IMPLEMENTATION

Arlington Housing Needs Assessment 22
Process – The Community Engagement process was designed to gather input on housing
needs from a broad sector of the community. JQUAD initiated community engagement on
July 25, 2019. The aim was a collaborative effort involving stakeholders in a series of
strategic planning sessions involving city staff, interviews with stakeholders, and planning
and visioning exercises with focus groups to determine their perspective of Arlington’s future
housing needs. This included analyzing, problem solving, and identifying solutions relative
to identifying strengths, weaknesses, opportunities, and threats perceived as impacting
current and future housing needs. Throughout the process the planning team solicited and received guidance for resolving
issues and creating opportunities. City department representatives, housing and industry
professionals, and other stakeholders including representatives from education, social
and human services, industries, businesses, homeowners, and renters were asked to
help identify housing needs. As part of the HNA process, JQUAD analyzed and refined
issues and identified opportunities and preliminary strategies and policies for
implementation. The community engagement process and strategic planning input provided
a basis for the planning team to perform a Strengths/Weaknesses/Opportunities/ Threats
(SWOT) Assessment on October 9, 2019. Focus group sessions were held during the
process to receive input from specific segments of the community. Focus Groups included
the Arlington Homeownership Fair held August 10, 2019; Arlington Area Industry
Representatives held October 24, 2019; Arlington Housing Authority Clients held October
28, 2019; Arlington Board of Realtors held November 1, 2019; Health Education Learning
Project and LGBTQ+ Representative on November 16, 2019. A city-wide voluntary survey
was conducted utilizing an on-line Survey Monkey tool with 1,078 responses.
SECTION 2: COMMUNITY ENGAGEMENT
Arlington Housing Needs Assessment 23
Overview of Community Engagement Sessions – In July 2019, JQUAD Planning Group
began an assessment of Arlington’s housing needs. This included an analysis of current
market conditions, collecting data on existing housing, current and future needs and the
identification of key issues. To enhance the secondary data collected, signficant outreach
was conducted to gather primary information from stakeholders throughout the City.
Sessions were held with representatives from various sectors of the community citywide to
gather feedback about the existing housing needs and the status of meeting those needs
in Arlington.
Outreach sessions helped establish the priorities and preferences of current residents,
elected and appointed government leaders and industry professionals. Organizations
participating in the community engagement effort to date include:
• City of Arlington Office of Strategic Initiatives
• Arlington Board of Realtors
• Arlington industry stakeholders
• Developers, contractors and finance representatives
• County and City School officials for Arlington and Mansfield
• Community Housing Development Organizations (CHDO) and Affordable Housing
Agencies
• Health Education Learning Project The purpose of the outreach exercise were to: 1) involve a diverse group of residents and
stakeholders in the housing needs analysis; 2) acquire knowledge of current housing in
the Arlington; 3) learn more about what residents and stakeholders would like to see for the
future. Each group was led through a series of questions using the Turning Leaf response
card technology to collect answers in real time, followed by discussions of needs based on
the responses. Those responses were collected and analyzed to provide an overview of
the community’s needs and priorities to address current housing issues and potential for
the future housing.
Housing Needs Assessment Community Outreach and Planning

Arlington Housing Needs Assessment 24
Surveys – Surveys were disseminated to focus group participants, residents and industry
professionals combined with and market analysis data and public feedback from the forum
and surveys provided a foundation for the formulation of recommendations.
Note: The completed survey results are provided in Appendix B of the report.
Survey Results – The following are key conclusions based on the survey responses:
Current Conditions. The first series of questions focused on the state of housing in the City
of Arlington. It is abundantly clear that housing is a chief concern among stakeholders – not
only the availability of new housing, as well as the condition of existing housing.
• Participants supported future housing needs including the building of additional
housing units as well as rehabilitation of existing units.
• Fewer people agreed that the market is currently meeting the need of residents. Most
either disagreed or strongly disagreed that the market is meeting demand.
• Most participants felt that housing availability a significant challenge.
• When considering which populations need housing the most, the collective response
belonged to young workers and families needing “workforce housing” both current
workers in Arlington and future residents who will settle in Arlington. Housing for
seniors and households seeking affordable housing were also needed.
• Additional public input and survey information that is targeted toward these population
segments will augment the perspective in this case. However, younger demographics
appear to have a difficult time finding housing, according to community opinion.
• Respondents agree that Arlington has a substantial competitive advantage nestled
between the growing metro areas of Dallas and Fort Worth.
• Respondents believe economic development efforts by Arlington have recruited
numerous industries in the automotive and specialty manufacturing sectors. A sports
and entertainment industry location and recruitment strategy has led to success
Arlington Housing Needs Assessment 25
transforming the City of Arlington into a hub for sporting events, retail, and commercial
services.
• Strong school systems have made Arlington and surrounding areas desirable
community for families.
• The demand for new single-family housing is high throughout Arlington.
• Multifamily housing demand revealed diverse views. The majority of respondents
(57%) felt downtown and the more urbanized areas of Arlington needed an increase
in housing and could utilize multifamily options more so than existing neighborhoods.
Desired Future. Questions about the future needs delved into the types and qualities
desired in Arlington. Once again, patterns have emerged from the participants’ responses,
as highlighted below.
• A large majority of respondents believed that single-family homes which can be
purchased are needed in Arlington.
• Entry level to mid-range cost housing is the preferred option according to survey and
forum participants. Respondents felt that homes under $200,000 would best fit the
current demand.
• Affordability is the key factor when looking for housing, according to participants.
Though other priorities were chosen, finding a house that is affordable ranked at the
top of the list.
• When looking at other housing characteristics, respondents felt that access to
shopping and the downtown area, walkable neighborhoods, and access to public
transportation were all important. However, access to shopping or a downtown district
came in a close second on its own. This speaks to the importance of having a vibrant
downtown, commercial corridors, and neighborhoods with diverse housing options.
• Younger demographic groups are an important consideration, especially as Arlington
continues to diversify its’ workforce for all sectors of industry in the area. Most think
that the economic opportunities will be the main factor in attracting younger
generations.

Arlington Housing Needs Assessment 26
• When thinking about the challenges facing new homebuyers, the participants from the
community believe that better technical assistance and services would be beneficial.
This includes help with establishing and repairing credit, down-payment assistance,
and goal setting and budgeting services. Financial empowerment tools are powerful
incentives to attract and keep new residents.
Strengths, Weaknesses, Opportunities, and Threats (SWOT) Analysis
SWOT Analysis Exercises were hosted by the City of Arlington’s Office of Strategic
Initiatives (OSI) on October 9, 2019, conducted by JQUAD, as part of a Housing Needs
Assessment Strategic Planning meeting. City staff from various departments and other
stakeholders were asked to participate in a work session to solicit their input on how the
community’s needs are currently being met relative to housing and neighborhoods and their
vision for housing and neighborhoods in the future. We devoted a segment of the work
session to the SWOT Analysis. During this process, participants were asked to summarize
the strengths, weaknesses, opportunities, and threats in Arlington area relative to
housing and neighborhoods as they view them.
The SWOT Analysis is a strategic planning method originally designed to evaluate the
Strengths, Weaknesses, Opportunities, and Threats involved in a project or in a business
venture. It involved specifying the objective of business venture or project and identifying
the internal and external factors favorable and unfavorable to achieving that objective. The
technique was credited by Albert Humphrey, who led a research project at Stanford
University in the 1960s and 1970s using data from Fortune 500 companies.
In conducting the Housing Needs Assessment, we challenged stakeholders with the major
objective of creating a strategic plan for meeting future housing needs and improving and
maintaining housing and neighborhood stability. The SWOT technique was modified to
meet our objectives of identifying the internal and external factors that are influencing the
future housing needs and sustainability of current housing and neighborhoods. The SWOT
components are defined as follows.
Arlington Housing Needs Assessment 27
• STRENGTHS – Attributes of our current community that will be helpful to our
achieving the objective. Strengths are internal attributes that are currently visible in
communities. Generally, strengths can be defined by:
• What characteristics of the community’s housing and neighborhoods give it a
competitive advantage and account for its position as a preferred place to live given
Arlington’s place in the regional economy?
• WEAKNESSES - Attributes of our current community that are harmful to our
achieving the objective. Weaknesses are internal attributes that are currently visible in
communities. Generally, weaknesses can be defined by:
• What features and factors limit the ability of the community to reach its potential?
What attributes of the community adversely impacts the retention of current residents in
their neighborhood or housing where they reside and new residents and businesses to the
city and its existing neighborhoods?
• OPPORTUNITIES - Attributes that are entering our current community, or we
desire that they exist in our community that will be helpful to our achieving the objective.
Opportunities are external attributes that may be at work but not yet be visibly influencing
our community, or non-existent. Generally, opportunities can be defined by:
• What are the opportunities and actions that, if pursued, will enhance the long-term
viability, competitiveness and sustainability of Arlington and the City’s and Town’s housing
and neighborhoods?
• THREATS - Attributes that are evident, and concerns that are beginning to
influence our current community. We perceive these attributes as harmful to achieving the
objective. Threats generally began as external attributes that have a beginning origin
outside the community or those somehow transferred to the community and may or may
not currently be at work and visibly influencing the community. Generally, threats are
defined by:
• What are the activities, public policies or events and issues that might adversely
impact housing and neighborhoods? This could be in the form of a type of housing that the
market is or is not yet creating or maintaining in the City.
Arlington Housing Needs Assessment 28
SWOT Assignment instructions were provided to participants in advance of the session,
requesting that each participant do the following.
1. Utilizing a digital camera, cell phone camera, or internet to provide three
photographs that best represent their thoughts as to the Strengths, Weaknesses,
Opportunities, and Threats relative to housing needs in Arlington. (A total of 12
photographs were requested, three for each of the four SWOT subject areas.)
2. Write a brief description of each photograph including what is depicted, the location,
and thoughts as to why the photo(s) represents a strength, weakness, opportunity,
or threat.
3. In selecting photo sites and writing descriptions, participants were asked to consider
the following.
• How can we use and capitalize on each Strength?
• How can we improve each Weakness?
• How can we exploit and benefit from each Opportunity?
• How can we mitigate each Threat?
While there were variations in what participants listed as Strengths, Weaknesses,
Opportunities, and Threats, there were by far more similarities than differences. Different
participants listed the same attributes, but in different categories. For example, some listed
transportation as a Strength and another transportation as a Weakness.
The SWOT Analysis is intended to gain insight into community concerns and consistent themes relative to meeting housing needs:
What’s most important and relevant in meeting housing needs and why?
What concerns consumers relative to current housing needs and choices?
What do people want to see change relative to housing?
Why do existing residents stay in Arlington?
Why are new residents attracted to Arlington?
What’s Arlington’s competitive advantage?
How can the Housing Needs Assessment support population and economic growth in
Arlington?

Arlington Housing Needs Assessment 29
Important Considerations:
Strengths and Opportunities focused much on the strategic location of Arlington between
the Dallas/Fort Worth metropolitan areas, and the view that Arlington is a growing healthy
economy comprised of a diverse workforce, quality of life, and quality education from
elementary to college and trades.
Weaknesses and Threats primarily focused on Arlington’s ability to meet future housing
needs, to create and sustain housing that meets the growing demand of housing by 2025
and beyond and keeps pace with population, economic and job growth. Housing affordability
and housing choice for all populations and demographics is a priority.
Goal - Creating a “Market Niche” that retains businesses and allows residents to live and
invest in their community and attracts new persons to make Arlington their choice as a place
to live, work and conduct business. The City of Arlington, in conjunction with its City Partners,
is providing leadership in identifying future housing needs in support of creating a “Market
Niche” that serves to retain businesses and residents to continue to live and invest in their
community and attracts new persons to make the City their choice as a place to live, work
and conduct business. One troubling statistic is that over sixty percent of Arlington residents
live in Arlington but commute to work in surrounding jurisdictions. This suggest a high degree
of current satisfaction with housing choices and supply. However, troublesome if we are
unable to maintain Arlington’s marketability as the place to live.

Arlington Housing Needs Assessment 30
The SWOT Analysis and Strategic Planning Input Session drew the attendance and
participation of several department designees, including the Police Department, Code
Enforcement, Arlington Housing Authority, Planning and Development, Housing Channel,
Development Corporation of Tarrant County, as well several employees of the City of
Arlington. Attendees received an invitation several weeks prior to the session with
instructions on how to complete a SWOT Analysis of which, 6 were completed and returned
to JQUAD. The session was conducted at the City Hall Council Briefing Room located on
the 3rd floor.
The following summarizes the responses of the SWOT Analysis.
Strengths:
• George W. Hawkes, Downtown Library
• Entertainment district
• New housing such as Viridian
• Community partners with innovative ideas
• Centrally located between Dallas and Fort Worth
Weaknesses:
• Age of single and multifamily housing stock
• Sidewalks do not connect especially downtown where more walking occurs
• Lack of affordable housing
• Unsightly yards and homes
• Lack of homeless shelters
Opportunities:
• Opportunity Zones
• UTA provides access to emerging skilled professionals
• Affordable senior housing
• New apartment developments near hospitals and entertainment districts
• Small business centers
Summary of SWOT and Strategic Planning Responses

Arlington Housing Needs Assessment 31
Threats: • Constructing middle housing options on infill lots
• Outdated or dilapidated properties may discourage new residential growth
• Rising cost of homes
• Rising land cost
• Robust workforce and competitive wages offered by surrounding cities
The following was presented, and participants were invited to engage in discussion as to
whether they would consider each a Strength, Weakness, Opportunity, or Threat:
Strength - Feedback was mixed. Most believed rising
home cost are a result of a healthy housing market
while some participants feared low income
households will be unable to afford a new home in the
current market.
Participants largely considered the “B” grade an
opportunity because Arlington ISD is considered a top
tier school, even with a “B” grade. AISD may attract
new residents to Arlington for education if improved
to an “A” grade? There were few participants that
believed the “B” grade is discouraging new growth.
Using Turning Point Software, attendees provided answers to the following questions using
handheld clickers:
Strength - 6%
Weakness - 50%
Opportunity - 28%
Threat - 17%
According to Arlington Board of Realtors, average home sales price for quarter ending September 2019 was $244,097. In your opinion this would be considered?
“Local and Regional Transportation”
In your opinion this would be considered?
AISD’s latest overall grade was a “B”. In your opinion this would be considered?
Arlington Housing Needs Assessment 32
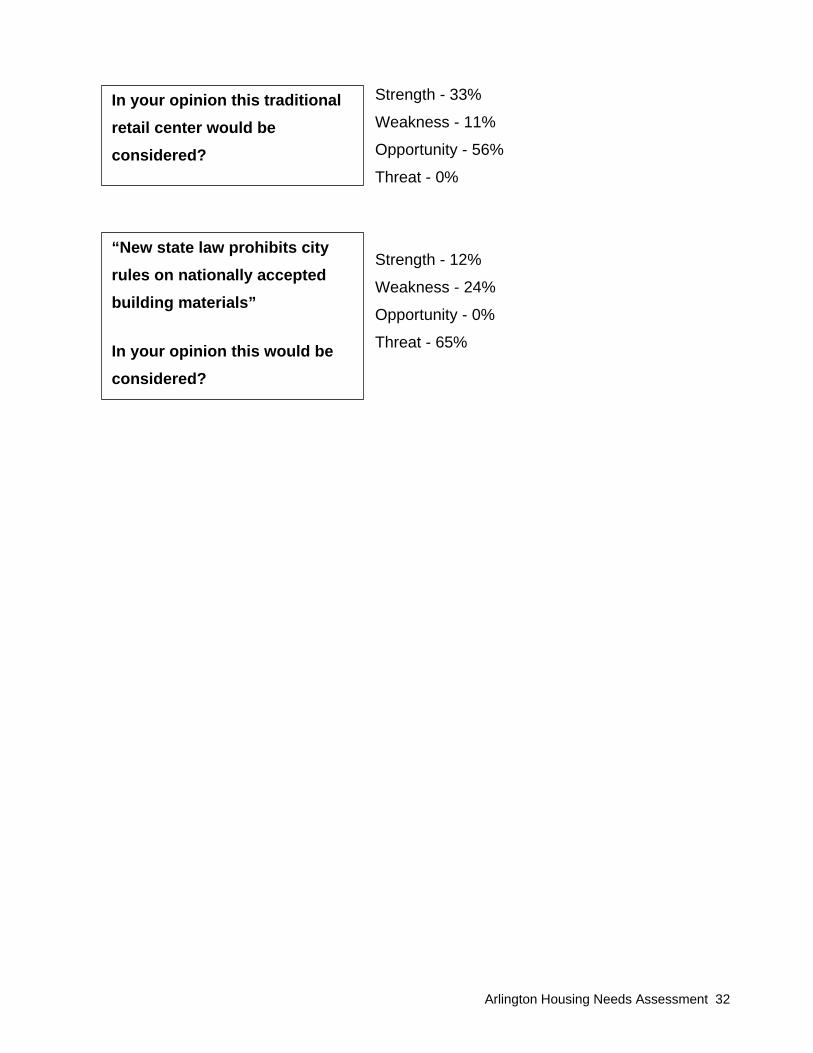
Strength - 33%
Weakness - 11%
Opportunity - 56%
Threat - 0%
Strength - 12%
Weakness - 24%
Opportunity - 0%
Threat - 65%
In your opinion this traditional retail center would be considered?
“New state law prohibits city rules on nationally accepted building materials” In your opinion this would be considered?

Arlington Housing Needs Assessment 33
The City-wide On-Line Housing Needs Assessment Survey, available in English and
Spanish, was posted on Arlington’s website from July to December 2019, and distributed
using "Nextdoor" a private social network for neighborhoods. Surveys were also distributed
to focus groups for on-site completion at the August 10, 2019 Homeownership Fair. There
were 1078 respondents to the survey, and included: 69 percent female, 75.3 percent white,
27.88 percent older than 65, and 34.75 percent earned between $25,000 and $75,000.
Complete survey results are listed in Appendix B.
What does your community need most? Better Roads/Sidewalks 49%
More Affordable Housing 36%
Better Public Safety 29% What changes are needed to make your street/neighborhood a better place to live? Increased neighborhood safety features 42%
Increased transportation options 38%
More walkable community 34%
Which of the following Residential Districts would you prefer to live in? Residential Estate 52%
Neighborhood Mixed Use 25%
How satisfied are you with the quality of the housing you currently live in? Very Satisfied 31%
Satisfied 34%
Somewhat Satisfied 18%
Summary of Survey Responses

Arlington Housing Needs Assessment 34
Arlington Housing Authority Online Survey to Clients Which of the following best describes the type of housing you currently live in? Apartment building with 1-4 floors 58%
Have you experienced problems finding a home large enough for your family? Yes 50%
Have you experienced problems finding a home large enough for your designated housing choice voucher size? Choose from the following sizes 1 - 29%
2 - 29%
3 - 15% Do you believe housing discrimination occurs in your neighborhood? Yes 37%
Likely 23%
Unlikely 13%
No 28% Have you experienced housing discrimination living in Arlington? Yes 29%
No 70% During the past three (3) years, how have the overall housing costs for your current home changed? Increased a lot 44%
Increased some 34%
During the past five (5) years, have you looked for a new place to live? Yes, looked for a home/place to Rent 55%
If you answered Yes to the previous question did you have trouble finding safe, quality housing that you could afford in a neighborhood you would like to live in? Yes, 62%
Arlington Housing Needs Assessment 35
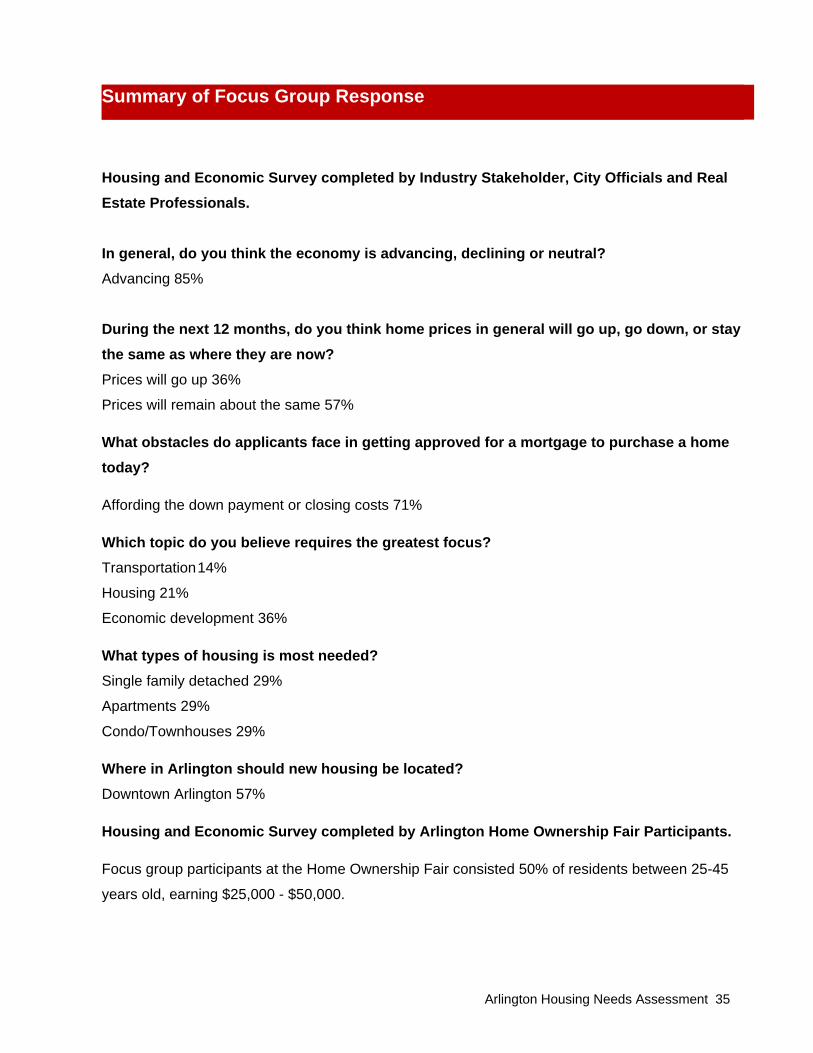
Housing and Economic Survey completed by Industry Stakeholder, City Officials and Real Estate Professionals.
In general, do you think the economy is advancing, declining or neutral? Advancing 85%
During the next 12 months, do you think home prices in general will go up, go down, or stay the same as where they are now? Prices will go up 36%
Prices will remain about the same 57% What obstacles do applicants face in getting approved for a mortgage to purchase a home today? Affording the down payment or closing costs 71% Which topic do you believe requires the greatest focus? Transportation 14%
Housing 21%
Economic development 36% What types of housing is most needed? Single family detached 29%
Apartments 29%
Condo/Townhouses 29% Where in Arlington should new housing be located? Downtown Arlington 57% Housing and Economic Survey completed by Arlington Home Ownership Fair Participants. Focus group participants at the Home Ownership Fair consisted 50% of residents between 25-45
years old, earning $25,000 - $50,000.
Summary of Focus Group Response

Arlington Housing Needs Assessment 36
Which represents the most important reasons you decided to live in your neighborhood? Affordability of Housing 30%
Nearby schools for children/grandchildren 15% What does your community need most? Better Housing/Affordable Housing/Housing Rehab 42%
During the past three years, how has housing cost for your current home changed? Increased 81%
Arlington Housing Needs Assessment 37
The Housing Needs Assessment (HNA) evaluated current demand for various types of
housing and price-points in the Arlington housing market and provided a basis for
developing projections for future housing needs. Utilizing Census and Home Mortgage
Disclosure Act data, population projections, economic trends, data on home sales and
rental housing, the Housing Needs Assessment compared housing supply with the
demands of current householders. The analysis also includes current and future demand
for different types of housing in Arlington. The Housing Market Analysis evaluated optimal
rental cost and purchase price levels and expected absorption rates for categories of
housing.
The Market Demand and Housing Trends Analyses focused on the primary market of
Arlington with some comparisons to data for secondary markets comprised of surrounding
cities and Tarrant County. This was important in determining the extent to which the local
market is influenced by surrounding markets near Arlington, and where recommendations
of the HNA should be applied to occurrences in the secondary markets. To make those
determinations, the analysis evaluated data for Arlington, and performed comparisons with
data for Tarrant County and individual jurisdictions near Arlington.
The Market Demand Analysis is derived from the relational evaluation of four components:
market demand, population projections, housing trends, and economic trends. The market
analysis also focused on the primary market in relationship to secondary markets in Grand
Prairie, Mansfield, Hurst, Euless, and Bedford (HEB), while considering the implications of
current trends of the economy, the tightening of credit markets, and incomes of populations
including the demand for rental and home buyer assistance to low- to moderate-income
populations.
SECTION 3: MARKET DEMAND AND HOUSING TRENDS ANALYSIS

Arlington Housing Needs Assessment 38
MARKET DEMAND ANALYSIS
The Market Demand Analysis concentrated on housing needs of the City of Arlington as
the primary market, with a comparison of housing availability, cost, and future demand for
persons of all incomes in sub-market areas. The correlation between housing trends and
economic trends is an important factor in determining if the supply of housing will support
economic and population growth. Market rate housing, housing supported with public
subsidies, and public and private incentives are considered. A variety of housing needs for
every income category will need to be addressed including rental and homeownership,
workforce, seniors, families, younger demographics, temporary housing for workers, daily
in and out commuters, reinvestment, renovation, and repurposed development of existing
housing and neighborhoods.
The Market Demand Analysis takes into consideration several factors that influence and
measure the propensity to obtain housing in Arlington and secondary markets including
Tarrant County. This includes a range of housing options affordable to diverse incomes, a
supply of housing to meet the needs of a growing economy, meeting the housing demands
of the workforce, market rate consumers, the special needs of seniors, low- and moderate-
income households, and others. Recent economic trends in the study area, job growth,
industry projection of housing needs for its workforce, product value, housing renovation,
development of new housing, and financing are all significant factors that impact housing
demand.
Arlington’s housing market has remained constant in spite of ongoing changes in the United
States financial markets. New, single-family home sales have increased and/or steadied in
the midst of financial tightening in both developmental and individual mortgage financing In
Arlington and in most of the secondary markets home sales and building permits issued
reveal steady growth, increases in number of units being built, and population increases.

Arlington Housing Needs Assessment 39
Input from the community engagement process also suggests that consumer preferences for
certain types and price-points of housing are important factors in forecasting housing demand,
and the demand for quality, affordable rental units. Market, economic, workforce data, and trends
collected as part of the analysis supports the need for increased emphasis on rental housing.
The results of the analysis are presented in two segments: The first is the demand for housing based on “normal” development patterns in the market areas.
This analysis focuses on the following issues:
• The amount of housing being absorbed in the market area
• The type of housing product that is best to offer
• Estimates of the target size of units, bedroom, and bathroom count
• Target price ranges for purchasing new single family and rental cost for rental housing
Second, the Housing Needs Analysis addresses obstacles faced by the housing market and the
study areas and how these factors will likely affect the housing market in the future are as follows:
• Financial considerations
• Impact of mortgage financing;
• Affordability:
• Development regulations;
• Funding for development; and
• Rental assistance
A. Market Area
1. Study Area
The study area boundaries for the needs assessment and market analysis are census tracts
within Arlington, reflecting areas where affordability can be achieved based on an individual’s
income in all ranges. This included persons and households earning median income or higher,
and persons with incomes designated as low- to moderate-income, defined by HUD as persons
and households earning eighty percent or below the median income, and paying no more than
thirty percent of their household income for housing expenses.

Arlington Housing Needs Assessment 40
2. Market Area The needs assessment is based on the primary market area of Arlington within which the
rental, purchase or sale of housing affects the price or volume demanded of housing as a
commodity. The market analysis examines the housing needs of persons likely to obtain
housing within the Arlington market as well as secondary markets in Tarrant County, and
individual incorporated and unincorporated jurisdictions in and around Arlington. The
Arlington Market Area has a regional appeal and factors driving demand for housing is not
limited to economic trends, cost, and availability influencing demand solely from within the
boundaries of the study area. Some influences and considerations include in and out
commuters, housing availability in adjacent markets, housing in specialty districts, housing
demands of college students, seasonal and temporary workforce, and persons living outside
of the primary market who consider Arlington appealing relative to their housing needs. The
Market Area is divided into two segments, a Primary Market Area of Arlington, and a
Secondary Market Area that comprises a larger geography that includes demand from
potential home buyers and renters living outside the boundaries of Arlington. The boundaries
are defined by a Primary Market Areas from 0 to 2 miles and Secondary Market Areas from
0 to 5 and 0 to 10 miles.
B. Market Demand The demand for housing in the study area is based on the likelihood that new residents will
choose to move to the community, existing residents will continue to live in this market, will
rent or purchase new and existing housing, or will drive demand for new housing for rental
and purchase, or rehabilitation of existing homes already in homeownership. Several
variables were considered including population projections, economic trends, home values
and rental housing sales, foreclosures, vacancy status, cost and affordability, and occupancy
characteristics and overcrowding. Growth is also based on the construction of new housing
units to meet purchase and rental demand. These trends provide a glimpse of consumer
perceptions of the area’s attraction to home buyers and renters, and their preferences for
different housing products and locations. The analysis of demand is also based on
development and redevelopment prospects in existing areas.
Arlington Housing Needs Assessment 41
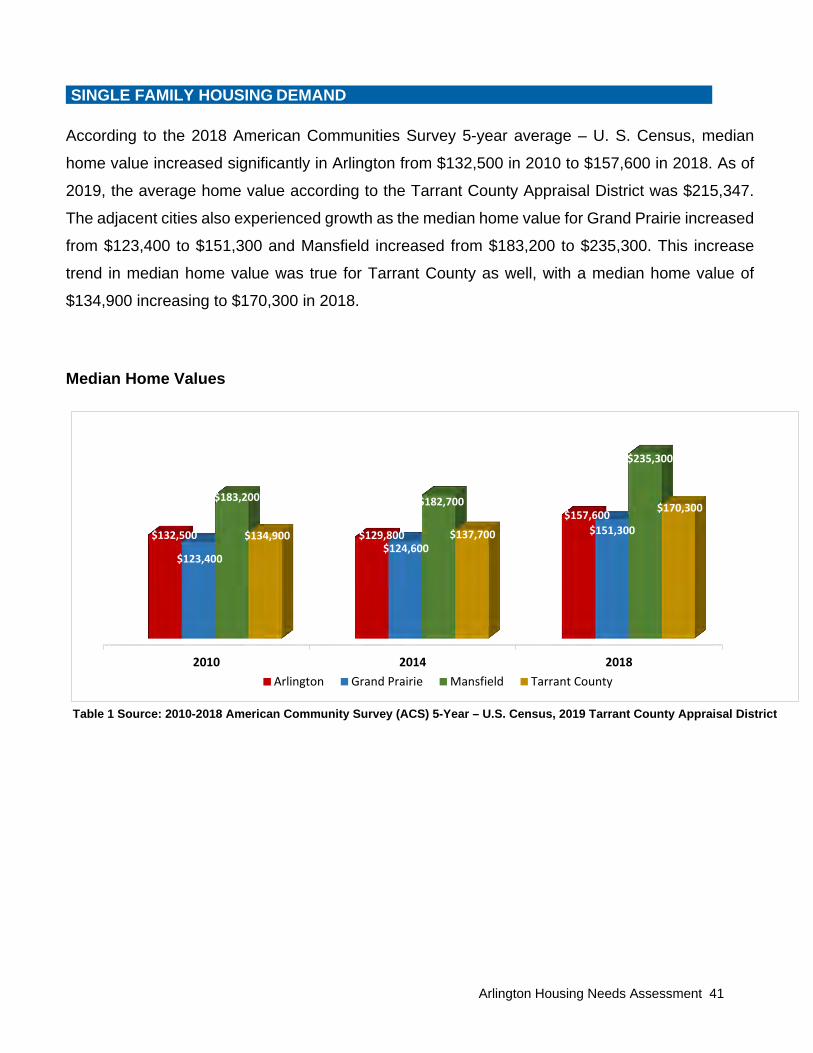
SINGLE FAMILY HOUSING DEMAND According to the 2018 American Communities Survey 5-year average – U. S. Census, median
home value increased significantly in Arlington from $132,500 in 2010 to $157,600 in 2018. As of
2019, the average home value according to the Tarrant County Appraisal District was $215,347.
The adjacent cities also experienced growth as the median home value for Grand Prairie increased
from $123,400 to $151,300 and Mansfield increased from $183,200 to $235,300. This increase
trend in median home value was true for Tarrant County as well, with a median home value of
$134,900 increasing to $170,300 in 2018.
Median Home Values
Table 1 Source: 2010-2018 American Community Survey (ACS) 5-Year – U.S. Census, 2019 Tarrant County Appraisal District
2010 2014 2018
$132,500 $129,800
$157,600
$123,400 $124,600
$151,300
$183,200 $182,700
$235,300
$134,900 $137,700
$170,300
Arlington Grand Prairie Mansfield Tarrant County

Arlington Housing Needs Assessment 42
Home Sales by Quarter The Arlington Board of Realtors provided
comparison data for home sales by price range
from September 2018 to September 2019. The
sales price range of $200,000 to $299,999
accounted for 54 percent of the total sales. Homes
sales $100,000 to $199,999, accounted for 30
percent of total sales in Arlington. Additional data
reports home sales in 2019, reflect a strong sales
market based on total sales and sale prices.
Arlington recorded 8,763 homes sold in 2017 and
2018 with 3,365 through September 2019. During
this period, June, July, and August were the strongest months.
Monthly Home Sales from January 2017 – September 2019
Table 3 Source: Arlington Board of Realtors & Texas A&M Real Estate Center
Table 2 Source: Arlington Board of Realtors & Texas A&M Real Estate Center
0.09%
3%
12%
54%
30%
0.09%
$1,000,000 +
$750,000-$999,999
$500,000-$749,999
$400,000-$499,999
$300,000-$399,999
$200,000-$299,999
$100,000-$199,999
$0-$99,999
% of Total Sales September 2018-2019
% of Total Sales
Arlington Housing Needs Assessment 43
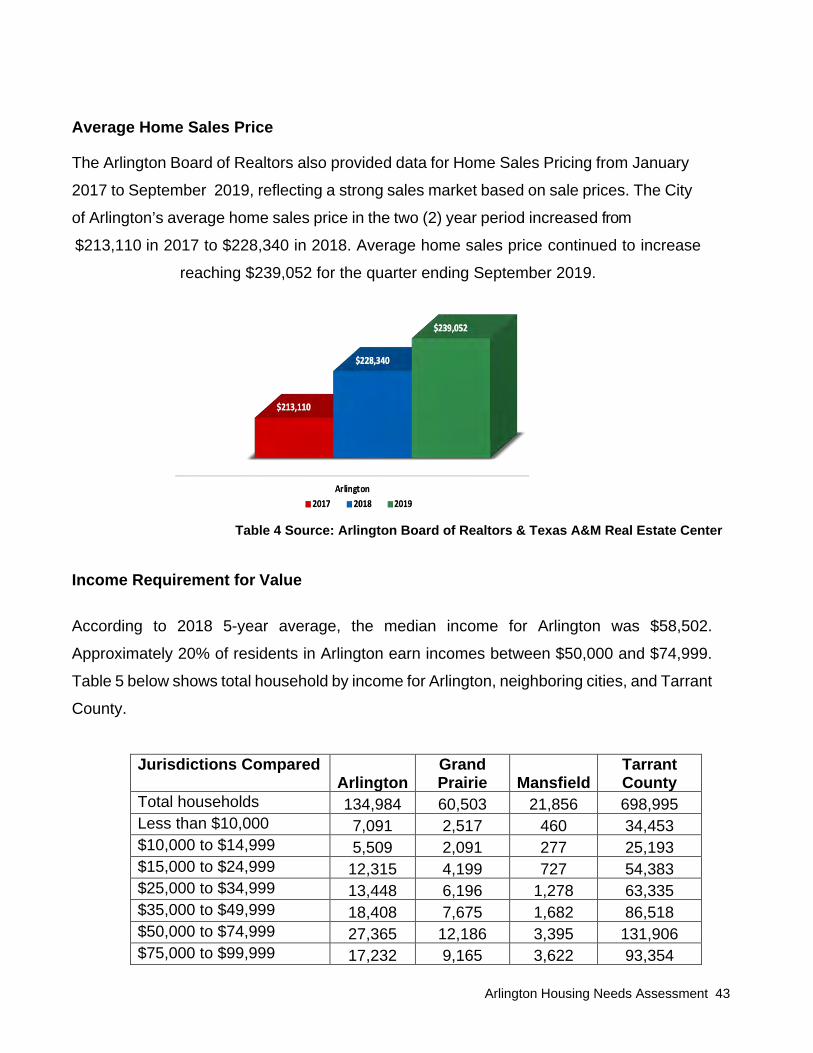
Average Home Sales Price The Arlington Board of Realtors also provided data for Home Sales Pricing from January
2017 to September 2019, reflecting a strong sales market based on sale prices. The City
of Arlington’s average home sales price in the two (2) year period increased from
$213,110 in 2017 to $228,340 in 2018. Average home sales price continued to increase
reaching $239,052 for the quarter ending September 2019.
Table 4 Source: Arlington Board of Realtors & Texas A&M Real Estate Center
Income Requirement for Value According to 2018 5-year average, the median income for Arlington was $58,502.
Approximately 20% of residents in Arlington earn incomes between $50,000 and $74,999.
Table 5 below shows total household by income for Arlington, neighboring cities, and Tarrant
County.
Jurisdictions Compared Arlington
Grand Prairie Mansfield
Tarrant County
Total households 134,984 60,503 21,856 698,995 Less than $10,000 7,091 2,517 460 34,453 $10,000 to $14,999 5,509 2,091 277 25,193 $15,000 to $24,999 12,315 4,199 727 54,383 $25,000 to $34,999 13,448 6,196 1,278 63,335 $35,000 to $49,999 18,408 7,675 1,682 86,518 $50,000 to $74,999 27,365 12,186 3,395 131,906 $75,000 to $99,999 17,232 9,165 3,622 93,354

Arlington Housing Needs Assessment 44
$100,000 to $149,999 19,780 10,197 5,302 110,961 $150,000 to $199,999 7,831 4,082 2,523 47,914 $200,000 or more 6,005 2,195 2,590 50,978
Table 5A Source: 2018 American Community Survey (ACS) 5-Year – U.S. Census
Table 5B Source: 2018 American Community Survey (ACS) 5-Year – U.S. Census
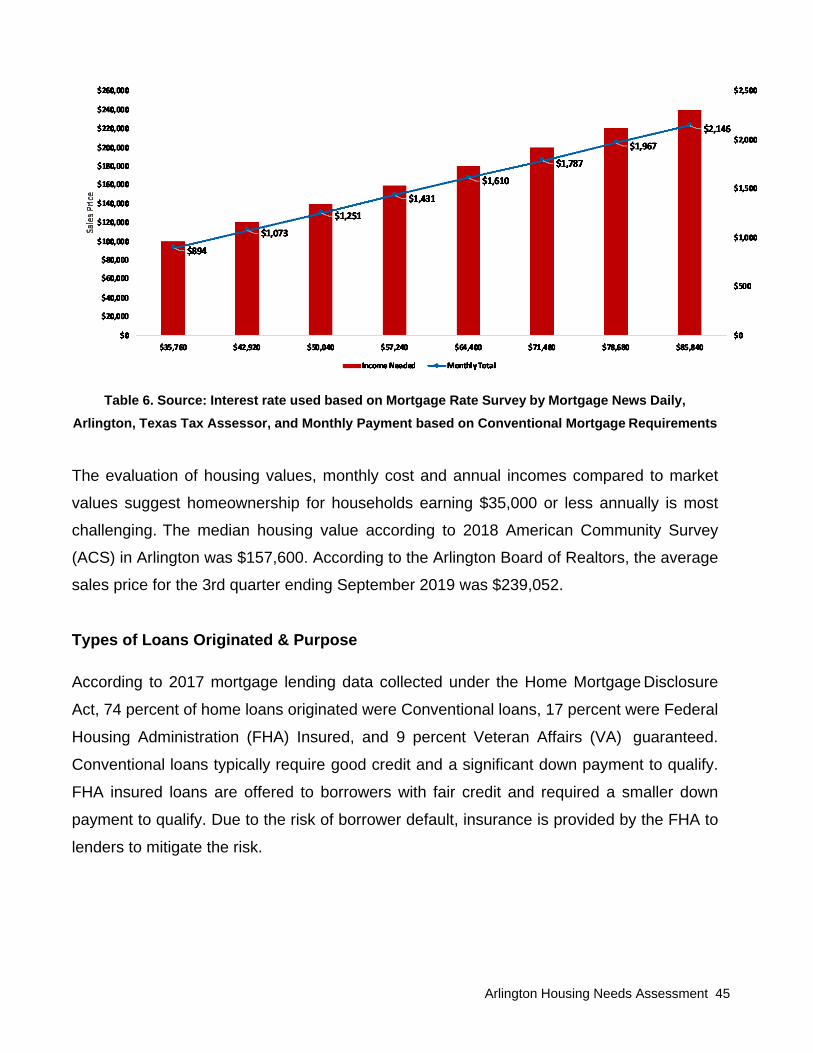
Housing Values, Monthly Cost, and Yearly Income Requirements
The comparison below shows how much income would be needed to afford a home with a
20% down payment and the corresponding monthly housing cost.
Example: $35,760 is needed to afford $100,000 with a payment of $894.
$58,502 $65,249
$96,253
$64,874
Median Household Income
Arlington Grand Prairie Mansfield Tarrant County
Arlington Housing Needs Assessment 45
Table 6. Source: Interest rate used based on Mortgage Rate Survey by Mortgage News Daily,
Arlington, Texas Tax Assessor, and Monthly Payment based on Conventional Mortgage Requirements The evaluation of housing values, monthly cost and annual incomes compared to market
values suggest homeownership for households earning $35,000 or less annually is most
challenging. The median housing value according to 2018 American Community Survey
(ACS) in Arlington was $157,600. According to the Arlington Board of Realtors, the average
sales price for the 3rd quarter ending September 2019 was $239,052.
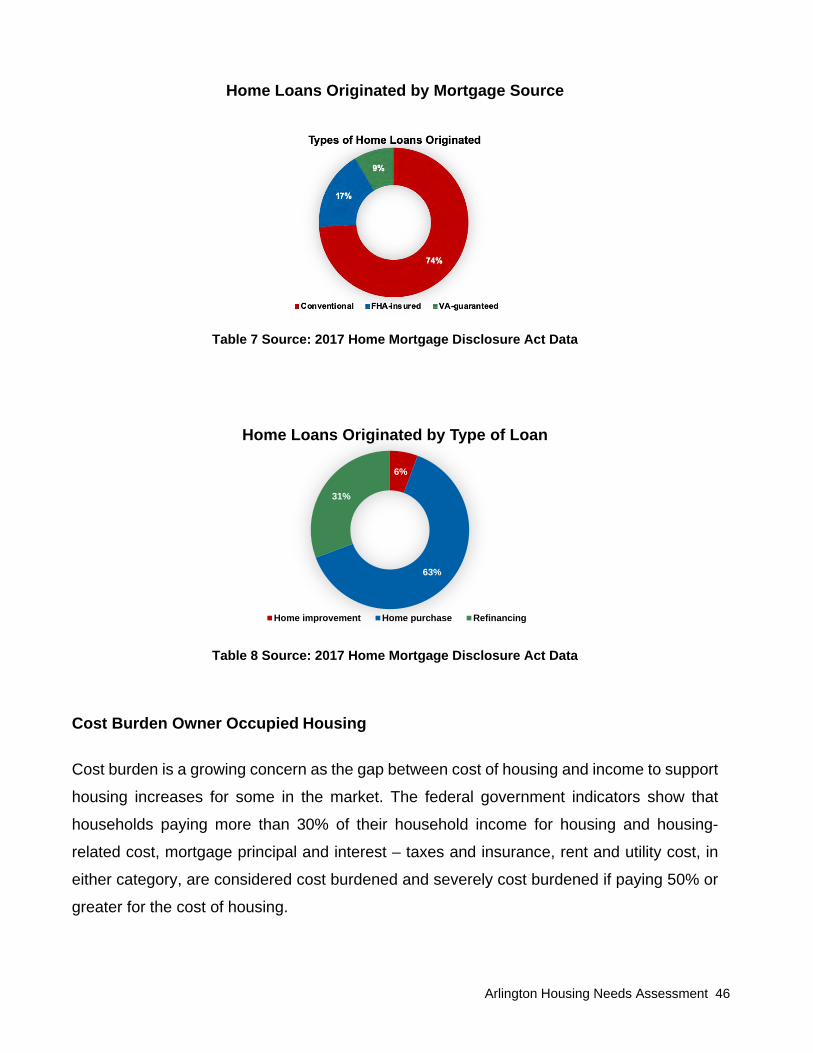
Types of Loans Originated & Purpose According to 2017 mortgage lending data collected under the Home Mortgage Disclosure
Act, 74 percent of home loans originated were Conventional loans, 17 percent were Federal
Housing Administration (FHA) Insured, and 9 percent Veteran Affairs (VA) guaranteed.
Conventional loans typically require good credit and a significant down payment to qualify.
FHA insured loans are offered to borrowers with fair credit and required a smaller down
payment to qualify. Due to the risk of borrower default, insurance is provided by the FHA to
lenders to mitigate the risk.
Arlington Housing Needs Assessment 46
Home Loans Originated by Mortgage Source
Table 7 Source: 2017 Home Mortgage Disclosure Act Data
Table 8 Source: 2017 Home Mortgage Disclosure Act Data
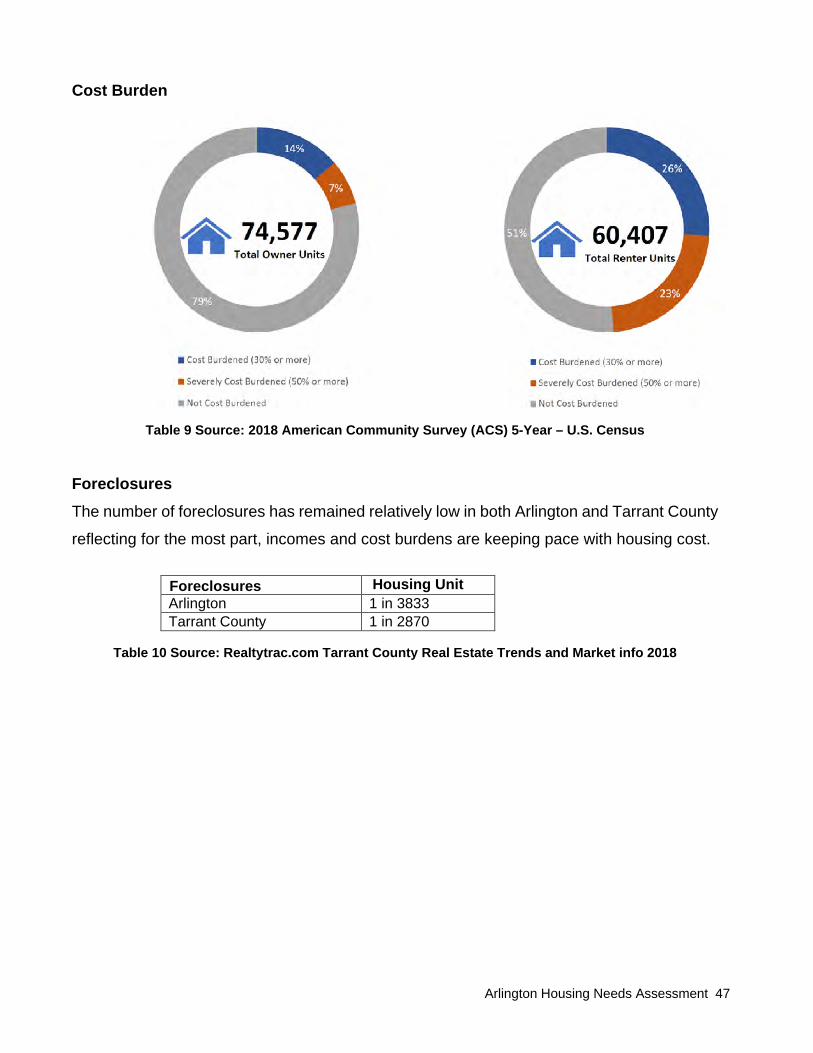
Cost Burden Owner Occupied Housing Cost burden is a growing concern as the gap between cost of housing and income to support
housing increases for some in the market. The federal government indicators show that
households paying more than 30% of their household income for housing and housing-
related cost, mortgage principal and interest – taxes and insurance, rent and utility cost, in
either category, are considered cost burdened and severely cost burdened if paying 50% or
greater for the cost of housing.
6%
63%
31%
Home Loans Originated by Type of Loan
Home improvement Home purchase Refinancing
Arlington Housing Needs Assessment 47
Cost Burden
Table 9 Source: 2018 American Community Survey (ACS) 5-Year – U.S. Census
Foreclosures The number of foreclosures has remained relatively low in both Arlington and Tarrant County
reflecting for the most part, incomes and cost burdens are keeping pace with housing cost.
Foreclosures Housing Unit Arlington 1 in 3833 Tarrant County 1 in 2870
Table 10 Source: Realtytrac.com Tarrant County Real Estate Trends and Market info 2018

Arlington Housing Needs Assessment 48
RENTAL HOUSING DEMAND Rental Housing Supply In 2018, rental housing was estimated at 60,407
units, approximately 44.8% of the total 134,984
occupied housing units in Arlington. A portion of the
single-family housing stock served as part of the
rental housing in addition to traditional multifamily
rental units with 5 units or more, particularly older
units and units without a mortgage. Apartment
developments with 5 units or more were estimated to
be approximately 46,328 units according to ALN
Apartment Data. In Tarrant County, rental housing was
estimated at 293,027 units, 37.6% of the total 779,037
housing units. As of 2019, apartment developments
with 5 units or more were estimated to be
approximately 206,522 according to ALN Apartment
Data.
The number of households in Arlington living in rental occupied units was 60,407 in 2018
representing 44.8 percent of Arlington’s total households. Renter households with a
householder under the age of 35 represented 41 percent or 25,296 renter households.
Whites were the dominate race of renter households at 47.1 percent, followed by Black or
African Americans at 35.7 percent and Hispanics at 28.3 percent. Education attainment of
renter households reports 39.5 percent of renters have some college or Associates degree.
The median income of renter households was $39,592 with 26 percent of households
experiencing cost burden (30% or more) and 23 percent experiencing severe cost burdened
(50% or more). The following table below provides the number of household’s supply of
housing units affordable by income range.
Table 11 Source: 2018 American Community Survey (ACS) 5-Year – U.S. Census
15,145
2,679
3,173
5,909
9,094
23,478
929
1, detached1, attached
23 or 45 to 9
10 or moreMobile home
Renter Occupied Units by Type

Arlington Housing Needs Assessment 49
Table 12 Source: 2018 American Community Survey (ACS) 5-Year – U.S. Census
Renter Cost # of Renter Units
Occupied
Annual Income needed to afford
Renter Cost
Less than $100 69 $3,960 $100 to $149 0 $5,960 $150 to $199 50 $7,960 $200 to $249 227 $9,960 $250 to $299 238 $11,960 $300 to $349 238 $13,960 $350 to $399 237 $15,960 $400 to $449 130 $17,960 $450 to $499 477 $19,960 $500 to $549 611 $21,960 $550 to $599 1,109 $23,960 $600 to $649 1,431 $25,960 $650 to $699 2,556 $27,960 $700 to $749 3,021 $29,960 $750 to $799 2,960 $31,960 $800 to $899 7,648 $35,960 $900 to $999 8,447 $39,960 $1,000 to $1,249 14,121 $59,003 $1,250 to $1,499 6,732 $87,410 $1,500 to $1,999 6,406 $131,864 $2,000 or more 1,766 $267,202
Table 13 Source: 2018 American Community Survey (ACS) 5-Year – U.S. Census

Arlington Housing Needs Assessment 50
Rental Cost The average rent paid for an apartment in Arlington increased from $968 in 2017 to $1,046
in 2019, representing an 8 percent increase. Renter units Table 13, renter units were largely
occupied with 20,853 units in the $1,000 to $1,499 renter cost range. The largest proportion
of rental units in Arlington were 1-bedroom units with an average rental rate of $893, followed
by 2-bedroom units with an average rental rate of $1,141. Using the standard 30 percent
method of determining housing affordability, the annual household income needed to afford
a 2-bedroom apartment in Arlington is about $59,003, which is above the median household
income of renters of $39,592.
Households and Residents Receiving Rental Assistance The City of Arlington reports about 6,097 households receiving rental assistance through
federally subsidized programs and properties receiving Low Income Housing Tax Credits.
The programs are serving about 15,077 residents including children, elderly, adults, and
disabled persons. The chart below details the source of residents and households currently
receiving rental assistance.
24-Month Comparison
2019 Market Statistics Total Units/Average Rent
Efficiency 1BED 2BED 3BED
Breakdown Oct-19 Oct-17 % Change
1,558/ $836
22,473/ $893
18,353/ $1,141
3,932/ $1,289
Occupancy Rate: 92.50% 91.60% 1%
Average Rental Rate: $1,046.47 $968.67 8.03%
Effective Rental Rate: $1,038.92 $963.40 7.84%
New Units Added/Lost: 735
Absorption: 1,097
Table 14 Source: 2019 ALN Apartment Data
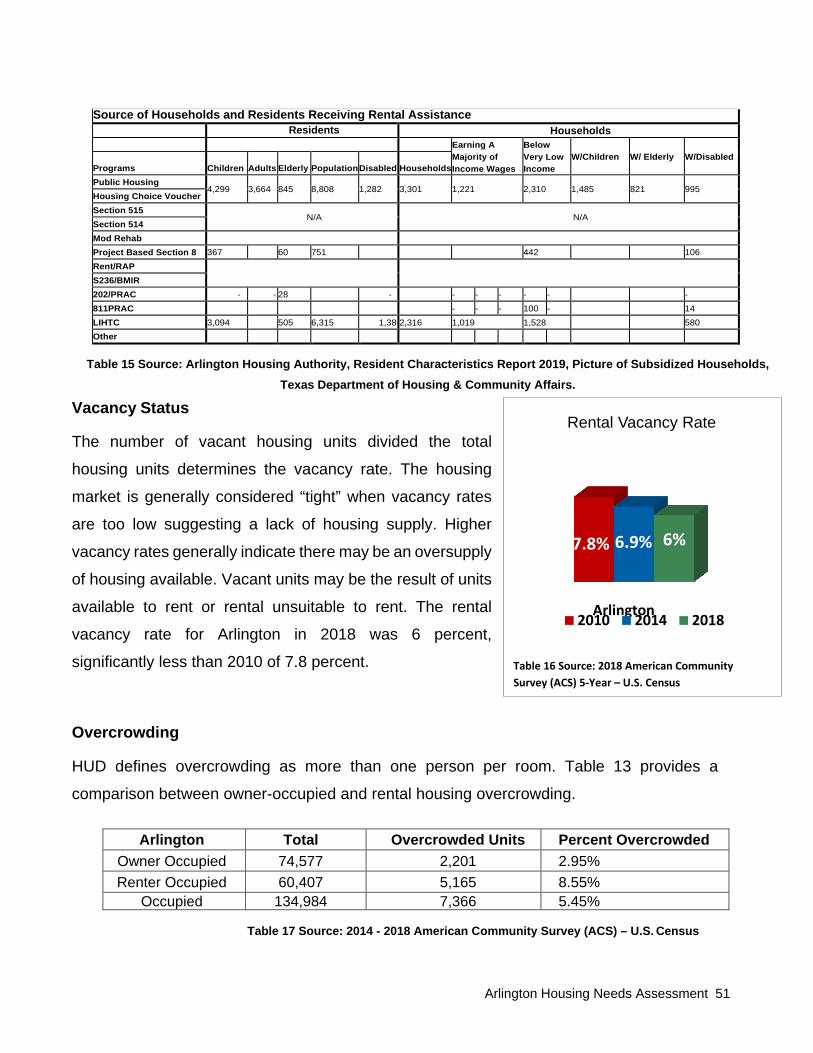
Arlington Housing Needs Assessment 51
Source of Households and Residents Receiving Rental Assistance Residents Households Earning A
Majority of Income Wages
Below Very Low Income
W/Children
W/ Elderly
W/Disabled
Programs Children
Adults
Elderly
Population
Disabled
Households
Public Housing 4,299
3,664
845
8,808
1,282
3,301
1,221
2,310
1,485
821
995
Housing Choice Voucher Section 515
N/A
N/A Section 514 Mod Rehab Project Based Section 8 367 60 751 442 106 Rent/RAP
S236/BMIR 202/PRAC - - 28 - - - - - - - 811PRAC - - - 100 - 14 LIHTC 3,094 505 6,315 1,380 2,316 1,019 1,528 580 Other
Table 15 Source: Arlington Housing Authority, Resident Characteristics Report 2019, Picture of Subsidized Households,
Texas Department of Housing & Community Affairs.
Vacancy Status The number of vacant housing units divided the total
housing units determines the vacancy rate. The housing
market is generally considered “tight” when vacancy rates
are too low suggesting a lack of housing supply. Higher
vacancy rates generally indicate there may be an oversupply
of housing available. Vacant units may be the result of units
available to rent or rental unsuitable to rent. The rental
vacancy rate for Arlington in 2018 was 6 percent,
significantly less than 2010 of 7.8 percent. Overcrowding
HUD defines overcrowding as more than one person per room. Table 13 provides a
comparison between owner-occupied and rental housing overcrowding.
Arlington Total Overcrowded Units Percent Overcrowded Owner Occupied 74,577 2,201 2.95% Renter Occupied 60,407 5,165 8.55%
Occupied 134,984 7,366 5.45%
Table 17 Source: 2014 - 2018 American Community Survey (ACS) – U.S. Census
Table 16 Source: 2018 American Community Survey (ACS) 5-Year – U.S. Census
Arlington
7.8% 6.9% 6%
Rental Vacancy Rate
2010 2014 2018

Arlington Housing Needs Assessment 52
New Housing Development New or Upcoming Construction Multifamily 5 Units or More According to data supplied by City of Arlington Planning and Development Services,
multifamily housing developments of 5 units or more reflect a steady increase in 2018 and
2019 including 21 new and upcoming developments comprising a total of 3,791 units.
New or Upcoming Construction Multifamily 5 Units or More
Table 18 Source: City of Arlington Planning and Development Services

Arlington Housing Needs Assessment 53
Building Permits Equally important were steady increasing residential development building permits issued from
2017 to 2019. According to City of Arlington data, 1,167 single family and 18 multifamily permits
were issued in 2017 and 2018. Table 19 above provides the number of permits through the
third quarter of 2019 as well as the number of units completed by sub area.
Permits Issued
Table 19 Source: City of Arlington
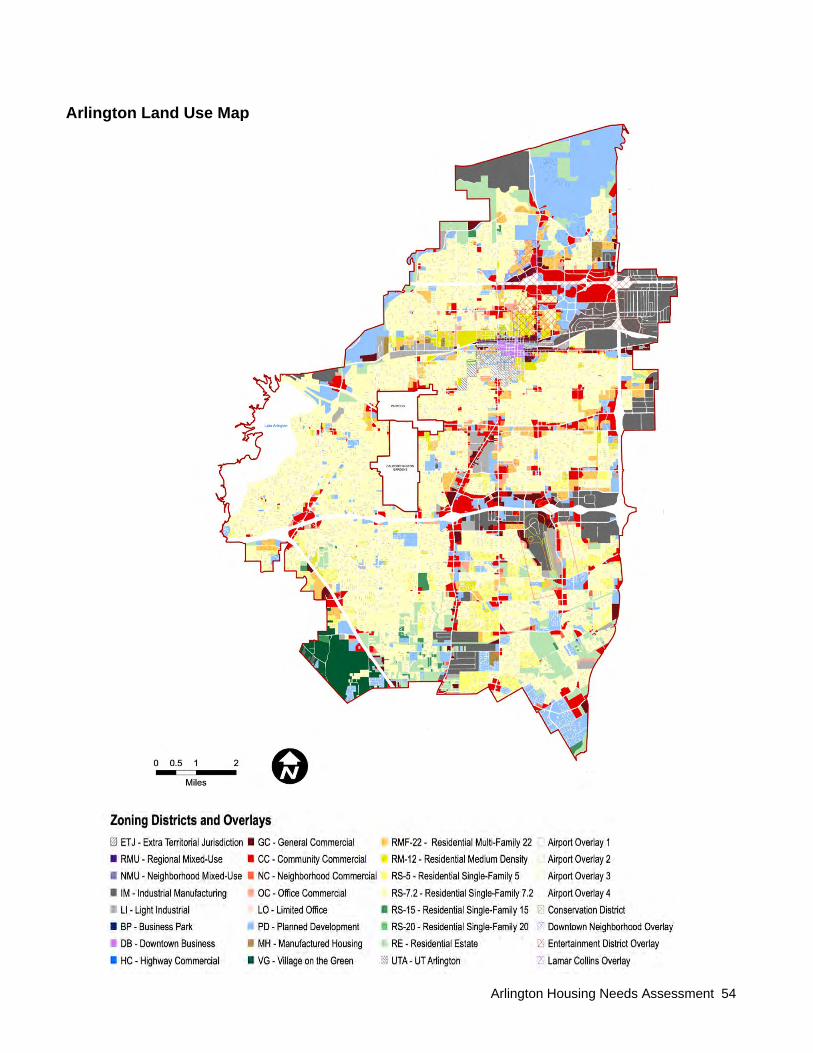
Arlington Housing Needs Assessment 54
Arlington Land Use Map
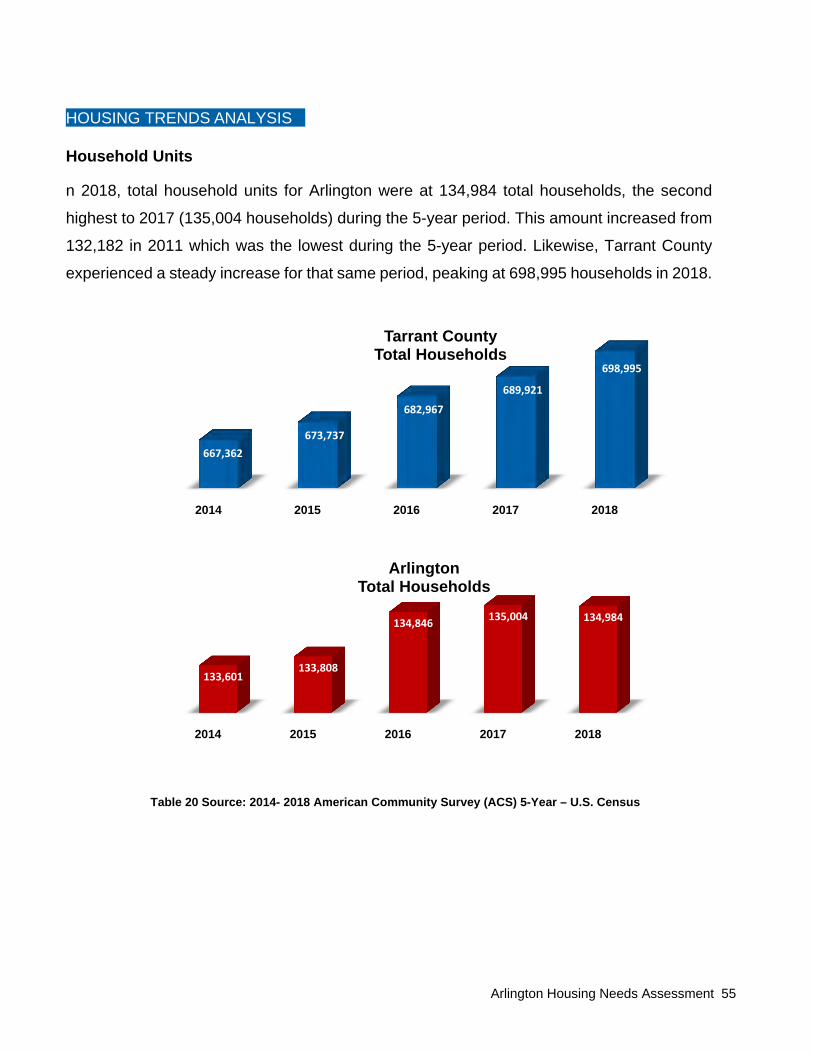
Arlington Housing Needs Assessment 55
HOUSING TRENDS ANALYSIS Household Units n 2018, total household units for Arlington were at 134,984 total households, the second
highest to 2017 (135,004 households) during the 5-year period. This amount increased from
132,182 in 2011 which was the lowest during the 5-year period. Likewise, Tarrant County
experienced a steady increase for that same period, peaking at 698,995 households in 2018.
Table 20 Source: 2014- 2018 American Community Survey (ACS) 5-Year – U.S. Census
2014 2015 2016 2017 2018
133,601133,808
134,846 135,004 134,984
ArlingtonTotal Households
2014 2015 2016 2017 2018
667,362 673,737
682,967
689,921
698,995
Tarrant County Total Households
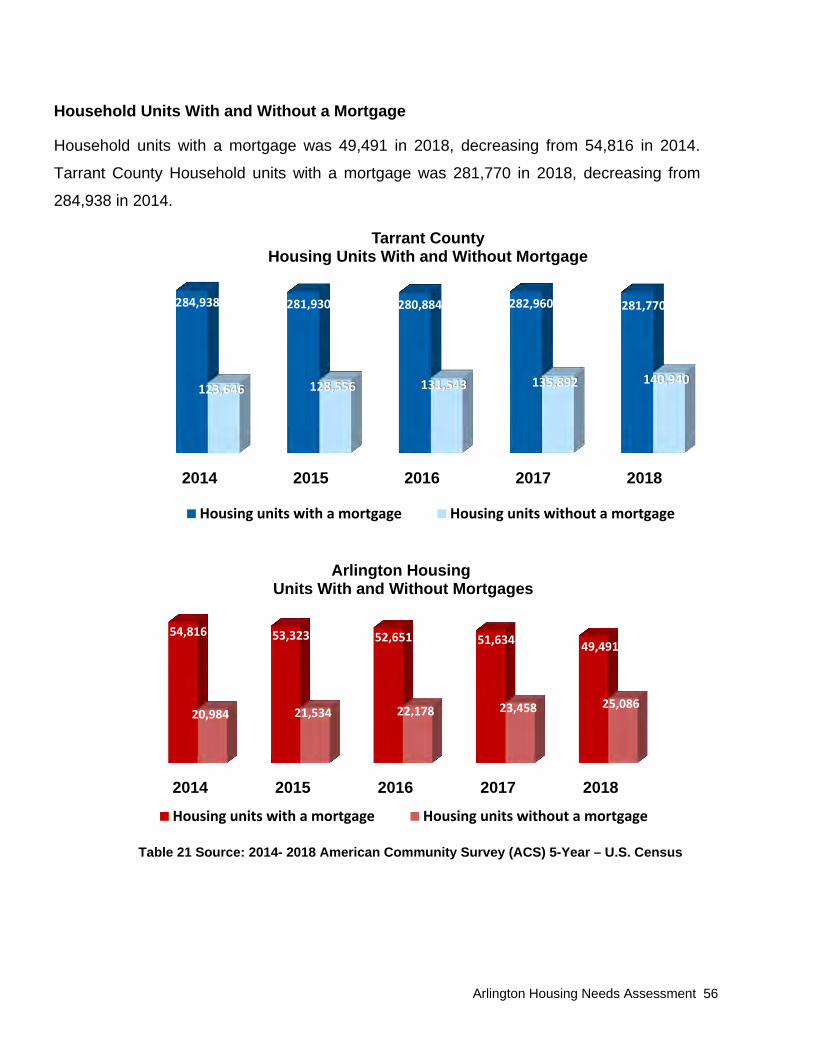
Arlington Housing Needs Assessment 56
Household Units With and Without a Mortgage Household units with a mortgage was 49,491 in 2018, decreasing from 54,816 in 2014.
Tarrant County Household units with a mortgage was 281,770 in 2018, decreasing from
284,938 in 2014.
Table 21 Source: 2014- 2018 American Community Survey (ACS) 5-Year – U.S. Census
2014 2015 2016 2017 2018
284,938 281,930 280,884 282,960 281,770
123,646 128,556 131,543 135,892 140,940
Tarrant County Housing Units With and Without Mortgage
Housing units with a mortgage Housing units without a mortgage
2014 2015 2016 2017 2018
54,816 53,323 52,651 51,634 49,491
20,984 21,534 22,178 23,458 25,086
Arlington HousingUnits With and Without Mortgages
Housing units with a mortgage Housing units without a mortgage

Arlington Housing Needs Assessment 57
Average Household Size Tarrant County’s and Arlington’s average household size peaked in 2018 to 2.86 and 2.88 percent,
respectively. The total population for Arlington and Tarrant County household size correlated to
population growth.
Table 22 Source: 2014-2018 American Community Survey (ACS) 5-Year – U.S. Census
2014 2015 2016 2017 2018
2.79
2.812.82
2.84
2.86
Tarrant County Average Household Size
2014 2015 2016 2017 2018
2.78
2.812.82
2.85
2.88
ArlingtonAverage Household Size

Arlington Housing Needs Assessment 58
Total Families The total families for Arlington and Tarrant County increased from 2014 to 2018. There was a marginal
increase from 2014 to 2018 in Arlington. Tarrant County total families increased at a higher rate than Arlingt
in the same period.
Table 23 Source: 2014-2018 American Community Survey (ACS) Five-year – U.S. Census
2014 2015 2016 2017 2018
461,209
466,070
473,777
481,588
488,262
Tarrant County Total Families
2014 2015 2016 2017 2018
90,676
91,120
92,261
92,746 92,819
Arlington Total Families

Arlington Housing Needs Assessment 59
Households with Children under 18 year The number of households with children under the age of 18 significantly decreased from
46,825 for Arlington in 2014 to 45,275 in 2018. Tarrant County’s most significant change
occurred between 2017 and 2018, increasing from 238,924 to 241,532.
Table 24 Source: 2014-2018 American Community Survey (ACS) 5-Year – U.S. Census
2014 2015 2016 2017 2018
234,870235,778
237,995238,924
241,532
Tarrant CountyHouseholds with Own Children of the
Householder Under 18 years
2014 2015 2016 2017 2018
46,825
46,354
45,525
45,14745,275
ArlingtonHouseholds with Own Children of the
Householder Under 18 years
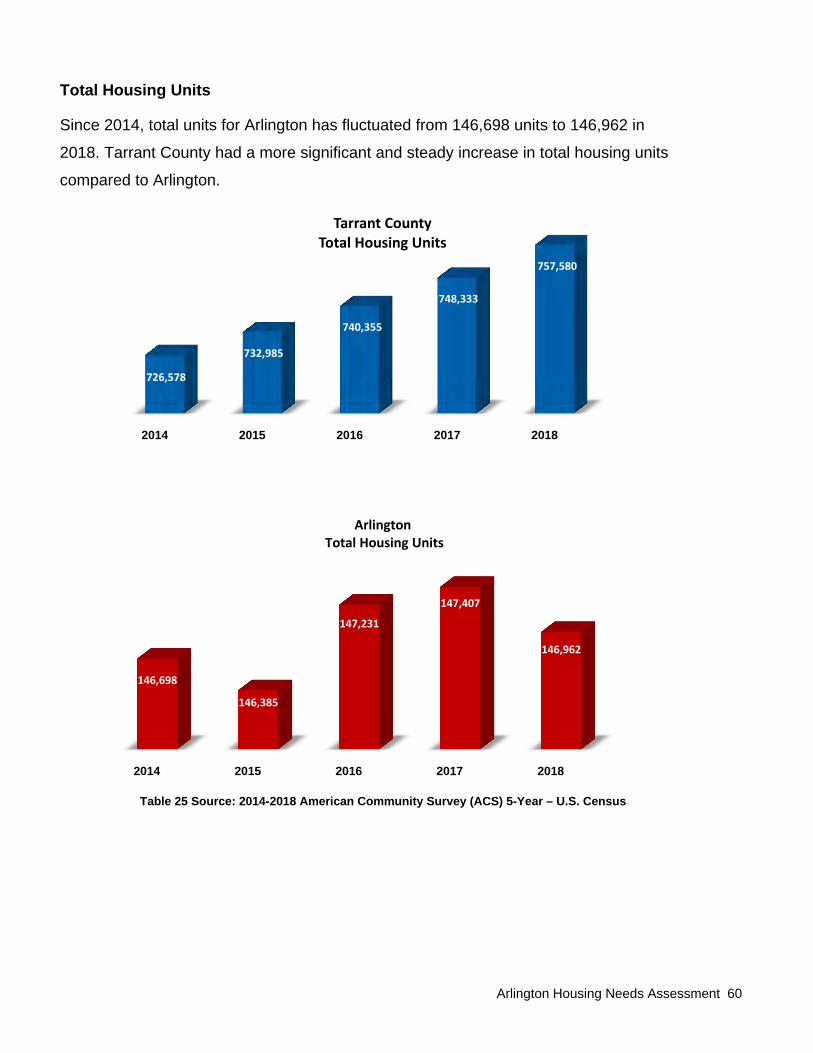
Arlington Housing Needs Assessment 60
Total Housing Units Since 2014, total units for Arlington has fluctuated from 146,698 units to 146,962 in
2018. Tarrant County had a more significant and steady increase in total housing units
compared to Arlington.
Table 25 Source: 2014-2018 American Community Survey (ACS) 5-Year – U.S. Census
2014 2015 2016 2017 2018
726,578
732,985
740,355
748,333
757,580
Tarrant CountyTotal Housing Units
2014 2015 2016 2017 2018
146,698
146,385
147,231
147,407
146,962
ArlingtonTotal Housing Units

Arlington Housing Needs Assessment 61
Occupied Housing Units & Vacant Housing Units A housing unit is classified as occupied if it is the current place of residence of the person or
group of people living in it at the time of Census interview or if the occupants are only
temporarily absent from the residence for two months or less. If occupants residing in the
unit at the time of the interview are staying there for two months or less, a unit is temporarily
occupied and classified as “vacant.” The occupants may be a single family, one person living
alone, two or more families living together, or any other group of related or unrelated people
who share living quarters. A housing unit is vacant if no one is living in it at the time of interview.
Units occupied at the time of interview entirely by persons who are staying two months or less
and who have a more permanent residence elsewhere are temporarily occupied and are
classified as “vacant.” Vacancy excludes units with a sign stating to be condemned or
demolished.
Table 26 Source: 2014 - 2018 American Community Survey (ACS) 5-Year – U.S. Census
2014 2015 2016 2017 2018
667,362 673,737 682,967 689,921 698,995
59,216 59,248 57,388 58,412 58,585
Tarrant County Occupied/Vacant Housing Units
Occupied housing units Vacant housing units
2014 2015 2016 2017 2018
133,601 133,808 134,846 135,004 134,984
13,097 12,577 12,385 12,403 11,978
Arlington Occupied/Vacant Housing Units
Occupied housing units Vacant housing units

Arlington Housing Needs Assessment 62
Specified owner-occupied and vacant-for-sale units include only one (1) single-family house
on less than 10 acres. The data for “specified units” excludes mobile homes, houses on 10
or more acres, and housing units in multi-unit buildings.
Owner Occupied Housing Units & Rent Occupied Housing Units
Table 27 Source: 2014- 2018 American Community Survey (ACS) 5-Year – U.S. Census
2014 2015 2016 2017 2018
408,584 410,486 412,427 418,852 422,710
258,778 263,251 270,540 271,069 276,285
Tarrant County Owner/Renter Occupied
Owner-occupied Renter-occupied
2014 2015 2016 2017 2018
75,800 74,857 74,829 75,092 74,577
57,801 58,951 60,017 59,912 60,407
Arlington Owner/Renter Occupied
Owner-occupied Renter-occupied

Arlington Housing Needs Assessment 63
Arlington Monthly Owner Costs as Percentage of Household Income: Housing Units with a Mortgage
Monthly Owner Cost Selected monthly owner costs are the sum of payments for mortgages, deeds of trust,
contracts to purchase, or similar debts on the property (including payments for the first
mortgage, second mortgages, home equity loans, and other junior mortgages); real estate
taxes; fire, hazard, and flood insurance on the property; utilities (electricity, gas, water and
sewer); and fuels (oil, coal, kerosene, wood, etc.). It also includes, where appropriate, the
monthly condominium fee for condominiums and mobile home costs (personal property
taxes, site rent, registration fees, and license fees).
Arlington and Tarrant County Monthly Owner Costs as Percentage of Household income for Housing Units with a Mortgage
From 2014 to 2018, the majority of selected monthly owner costs as a percentage of
household income, with a mortgage, in the county and city remained at 30% or less.
2014 2015 2016 2017 2018
116,632 121,767 126,925 130,387 131,661
52,291 51,421 48,875 49,209 47,55734,934 33,838 32,911 32,666 31,28520,135 18,832 18,891 18,364 19,029
59,378 54,535 51,949 51,177 51,229
Tarrant County Owner Costs as Percent of Household Income: With Mortgage
Less than 20.0 percent 20.0 to 24.9 percent 25.0 to 29.9 percent 30.0 to 34.9 percent 35.0 percent or more
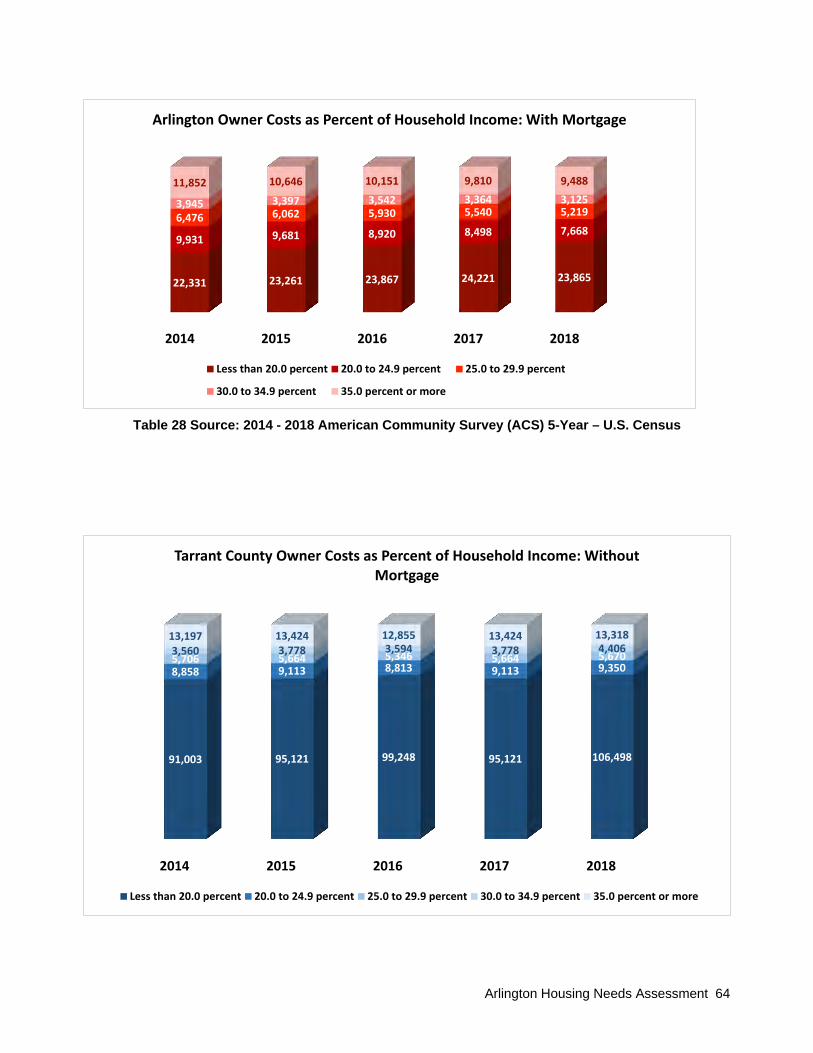
Arlington Housing Needs Assessment 64
Table 28 Source: 2014 - 2018 American Community Survey (ACS) 5-Year – U.S. Census
2014 2015 2016 2017 2018
22,331 23,261 23,867 24,221 23,865
9,931 9,681 8,920 8,498 7,6686,476 6,062 5,930 5,540 5,2193,945 3,397 3,542 3,364 3,125
11,852 10,646 10,151 9,810 9,488
Arlington Owner Costs as Percent of Household Income: With Mortgage
Less than 20.0 percent 20.0 to 24.9 percent 25.0 to 29.9 percent
30.0 to 34.9 percent 35.0 percent or more
2014 2015 2016 2017 2018
91,003 95,121 99,248 95,121 106,498
8,858 9,113 8,813 9,113 9,3505,706 5,664 5,346 5,664 5,6703,560 3,778 3,594 3,778 4,406
13,197 13,424 12,855 13,424 13,318
Tarrant County Owner Costs as Percent of Household Income: Without Mortgage
Less than 20.0 percent 20.0 to 24.9 percent 25.0 to 29.9 percent 30.0 to 34.9 percent 35.0 percent or more

Arlington Housing Needs Assessment 65
Table 29 Source: 2014 - 2018 American Community Survey (ACS) 5-Year – U.S. Census
Arlington and Tarrant County Monthly Owner Costs Housing Units with a Mortgage
From 2015 to 2018, the majority of selected monthly owner costs, with a mortgage, in both
Tarrant County and the City remained from $1000 to $1,499.
2014 2015 2016 2017 2018
16,090 16,246 16,956 16,246 19,562
1,406 1,451 1,408 1,451 1,3991,058 1,045 898 1,045 945412 457 490 457 720
1,868 2,144 2,193 2,144 2,186
Arlington Owner Costs as Percent of Household Income: Without Mortgage
Less than 20.0 percent 20.0 to 24.9 percent 25.0 to 29.9 percent 30.0 to 34.9 percent 35.0 percent or more
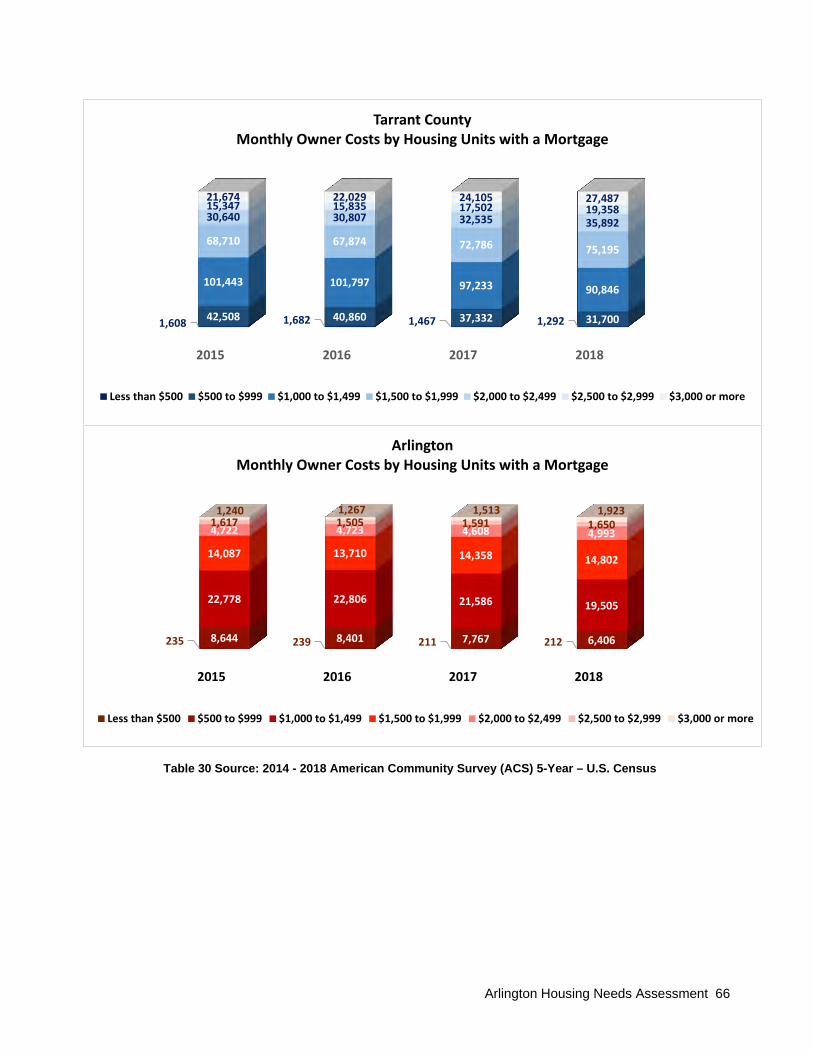
Arlington Housing Needs Assessment 66
Table 30 Source: 2014 - 2018 American Community Survey (ACS) 5-Year – U.S. Census
2015 2016 2017 2018
1,608 1,682 1,467 1,29242,508 40,860 37,332 31,700
101,443 101,797 97,233 90,846
68,710 67,874 72,786 75,195
30,640 30,807 32,535 35,89215,347 15,835 17,502 19,35821,674 22,029 24,105 27,487
Tarrant CountyMonthly Owner Costs by Housing Units with a Mortgage
Less than $500 $500 to $999 $1,000 to $1,499 $1,500 to $1,999 $2,000 to $2,499 $2,500 to $2,999 $3,000 or more
2015 2016 2017 2018
235 239 211 2128,644 8,401 7,767 6,406
22,778 22,806 21,586 19,505
14,087 13,710 14,358 14,802
4,722 4,723 4,608 4,9931,617 1,505 1,591 1,650
1,240 1,267 1,513 1,923
ArlingtonMonthly Owner Costs by Housing Units with a Mortgage
Less than $500 $500 to $999 $1,000 to $1,499 $1,500 to $1,999 $2,000 to $2,499 $2,500 to $2,999 $3,000 or more

Arlington Housing Needs Assessment 67
Table 31 Source: 2014 - 2018 American Community Survey (ACS) 5-Year – U.S. Census
Arlington Monthly Gross Rent Costs Gross rent is the contract rent plus the estimated average monthly cost of utilities (electricity,
gas, water, and sewer) and fuels (oil, coal, kerosene, wood, etc.) if these are paid by the renter
(or paid for the renter by someone else).
2015 2016 2017 2018
10,690 10,288 9,664 8,901
24,426 24,371 23,700 22,643
41,046 41,369 42,106 41,349
25,705 26,925 28,500 31,229
12,262 12,801 13,947 16,127
14,427 15,789 17,975 20,691
Tarrant CountyMonthly Owner Costs by Housing Units Without a Mortgage
Less than $250 $250 to $399 $400 to $599 $600 to $799 $800 to $999 $1,000 or more
2015 2016 2017 2018
972 1,025 1,135 1,3023,517 3,527 3,496 3,522
7,463 7,788 8,031 8,004
5,572 5,908 6,355 6,899
2,318 2,191 2,522 3,128
1,692 1,739 1,919 2,231
ArlingtonMonthly Owner Costs by Housing Units Without a Mortgage
Less than $250 $250 to $399 $400 to $599 $600 to $799 $800 to $999 $1,000 or more

Arlington Housing Needs Assessment 68
Table 32 Source: 2014 - 2018 American Community Survey (ACS) 5-Year– U.S. Census
2015 2016 2017 2018
13,140 12,163 10,947 10,292
139,297 136,413 124,694 111,177
76,526 82,996 90,855 100,082
19,355 22,414 26,694 34,5794,502 4,7625,540 7,547
1,141 1,776 2,318 2,6861,266 1,552 1,569 1,620
Tarrant County Monthly Gross Rent
Less than $500 $500 to $999 $1,000 to $1,499 $1,500 to $1,999
$2,000 to $2,499 $2,500 to $2,999 $3,000 or more
2015 2016 2017 2018
2,036 1,830 1,791 1,666
35,744 35,017 32,007 27,783
14,775 16,303 18,16420,853
3,549 3,800 4,722 6,406792 932 960 1,293170 244 310 355
139 132 118 118
Arlington Monthly Gross Rent
Less than $500 $500 to $999 $1,000 to $1,499 $1,500 to $1,999
$2,000 to $2,499 $2,500 to $2,999 $3,000 or more

Arlington Housing Needs Assessment 69
Arlington Educational Attainment The total population over the age of 25, approximately 85% percent have graduated from high
school. The table below focuses on education attainment over the age of 25 in Arlington.
Table 33 Source: 2014 - 2018 American Community Survey (ACS) 5-Year – U.S. Census
7%8%
23%
24%
8%
20%
10%
Education Attainment for Population Over 25
Less than 9th grade9th to 12th grade, no diplomaHigh school graduate (includes equivalency)Some college, no degree

Arlington Housing Needs Assessment 70
Arlington is located within the Dallas-Fort Worth-Arlington Metropolitan Statistical Area of Texas,
in Tarrant County, Texas. The population of Arlington was 392,462 in 2018 based on data from
the American Community Survey. In 2018 there were 134,984 households in Arlington, with an
average size of 2.88 people per household. The American Communities Survey (ACS) estimates
146,962 total housing units, rental and homeownership combined, in Arlington in 2018, with 63.9
percent single-family, 34.6 percent multifamily and 1.5 percent other housing types. The ACS
estimated that 55.2 percent of housing is owner occupied and 44.8 percent renter occupied. The
median room size was 5.3 rooms and a median value of $157,600. The median income for
Arlington was $58,502.
DEMOGRAPHIC CHARACTERISTICS Population - Arlington has experienced positive trends in population adding nearly 12,746
new residents from 2015 to 2018. The total population of Arlington in 2018 was 392,462. A
comparison of surrounding cities near Arlington reported populations of 191,104 for Grand
Prairie, and 67,492 for Mansfield. Additionally, Tarrant County’s population was 2,019,997
for 2018.
Geography
2010
2015
% Change (2010-2015)
2018
%Change
(2015-2018)
Arlington 359,410 379,716 5.6% 392,462 3.4% Tarrant County
1,743,300
1,914,526
9.8%
2,019,977
5.5%
Table 34 Source: 2010 - 2018 American Community Survey (ACS) 5-Year U.S. Census
SECTION 4: DEMOGRAPHICS AND SOCIO-ECONOMIC CHARACTERISTICS

Arlington Housing Needs Assessment 71
Population by Age
The median age of Arlington’s population
was 33.3 years according to the 2018
American Community Survey. By
comparison Grand Prairie’s median age is
33.0, Mansfield’s 36.3 and Tarrant
County’s 34.3. Arlington’s largest
population group is 25 to 34 years
accounting for 60,589 or 15.4 percent of
the population. Growth in this range has
remained strong since 2010, increasing by
9.2 percent during the period. Arlington’s
older population of 60 to 64 years and 65
to 74 years collectively account for 45,195
or 11.6 percent of the population. Housing
considerations will likely remain a focus for
60 to 64 years and 65 to 74 years age
ranges as population since 2010 has
increased by 50 percent. The following
table provides detailed age data for
Arlington, Grand Prairie, Mansfield, and Tarrant County.
28,148
28,898
27,022
29,274
30,775
57,046
52,167
51,792
20,266
16,889
33,027
26,311
29,051
29,559
29,019
31,204
60,589
52,877
51,020
23,244
19,487
40,101
Under 5 years
5 to 9 years
10 to 14 years
15 to 19 years
20 to 24 years
25 to 34
35 to 44
45 to 54
55 to 59 years
60 to 64 years
65 and over
2014 2018
Table 32 Source: 2010-2018 American Community Survey (ACS) 5-Year – U.S. Census

Arlington Housing Needs Assessment 72
As with other communities across the country, the median age of the population is expected
to rise in the coming years as the “Baby Boom” generation continues moving up the age
distribution. In the next two decades the baby boomers will move entirely into the over 65 age
categories, creating the largest group in the over-65 category in U.S. history. These trends
are expected to have an impact on housing needs in Arlington as well as the rest of the
country.
Population Projections
Arlington’s population is projected to increase by 10.8 percent, or 441,259 by 2025 and 7.9
percent, or 476,362 by 2030. At the county level, Tarrant County’s population is projected to
increase by 11.3 percent or 2,322,418 by 2025 and 7.9 percent, or 2,507,170 by 2030. These
Population by Age Arlington Grand Prairie Mansfield Tarrant County
Pop %Pop Pop %Pop Pop %Pop Pop %Pop Under 5
years 26,311 6.70% 13,469 7.00% 4,178 6.20% 144,494 7.20% 5 to 9 years 29,051 7.40% 14,939 7.80% 4,946 7.30% 151,834 7.50%
10 to 14 years 29,559 7.50% 15,363 8.00% 6,536 9.70% 154,147 7.60%
15 to 19 years 29,019 7.40% 15,172 7.90% 6,122 9.10% 143,146 7.10%
20 to 24 years 31,204 8.00% 14,092 7.40% 3,369 5.00% 135,990 6.70%
25 to 34 years 60,589 15.40% 27,381 14.30% 7,301 10.80% 300,991 14.90%
35 to 44 years 52,877 13.50% 28,156 14.70% 11,776 17.40% 277,505 13.70%
45 to 54 years 51,020 13.00% 26,244 13.70% 9,606 14.20% 269,412 13.30%
55 to 59 years 23,244 5.90% 10,620 5.60% 4,393 6.50% 121,880 6.00%
60 to 64 years 19,487 5.00% 9,001 4.70% 2,971 4.40% 103,987 5.10%
65 to 74 years 25,708 6.60% 11,108 5.80% 3,856 5.70% 132,708 6.60%
75 to 84 years 10,674 2.70% 3,983 2.10% 1,854 2.70% 60,433 3.00%
85 years and over 3,719 0.90% 1,576 0.80% 584 0.90% 23,450 1.20%
Median age (years) 33.3 33.0 36.3 34.3
Table 35 Source: 2018 American Community Survey (ACS) 5-Year - U.S. Census

Arlington Housing Needs Assessment 73
growth projections are in correlation to the growth projections of Texas provided by the Texas
Demographic Center. The table below includes population growth from 2010 and comparison at
state, county, and city level. Arlington’s population growth is calculated using Tarrant County’s
projected increase because city-level data is not available from the Texas Demographic Center.
Table 36 Source: 2010 - 2018 American Community Survey (ACS) 5-Year – U.S. Census,
Texas Demographic Center
Note: City of Arlington’s response to consultant’s population projections In projecting future population growth for Arlington, JQUAD utilized a model that relied on a
specific group of publicly available datasets to determine a 2025 population of 441,259.
However, it should be noted that using historic population data along with local knowledge of
development patterns, the City of Arlington’s internal projection shows an expected maximum
population of around 423,000 at buildout.
Year Texas Tarrant County Arlington Population/
Projection %
Growth Population/ Projection
% Growth
Population/ Projection
% Growth
2010
24,311,891
1,743,300
359,410
2018
27,885,195
14.7%
2,019,977
15.9%
392,462
9.2%
2025
32,204,920
15.5%
2,322,418
15%
441,259
12.4%
2030
34,894,452
8.4%
2,507,170
8%
476,362
8%

Arlington Housing Needs Assessment 74
Race/Ethnicity The largest racial/ethnic group in Arlington according the 2018 American Community Survey
were Whites, which accounted for 39.1 percent of the population and a 7 percent decline
since 2010. The second largest racial/ethnic group is Hispanic, which accounted for 29.2
percent of the population and a 20 percent growth since 2010. The thirds largest racial/ethnic
group is African Americans, which account for 22 percent and a 30 percent increase since
2010.
Arlington Grand Prairie Year 2010 2018 %Change 2010 2018 %Change Total population 359,410 392,462 9% 165,776 191,104 15% White alone 164,375 153,476 -7% 54,616 42,133 -23% Black or African American alone 66,218 86,186 30% 29,651 43,443 47%
American Indian and Alaska Native alone 1,099 1,029 -6% 572 437 -24% Asian alone 24,670 26,720 8% 9,960 13,933 40%
Native Hawaiian and Other Pacific Islander alone 284 488 72% 187 93 -50% Some other race alone 1,103 1,067 -3% 188 238 27% Two or more races 6,209 8,901 43% 2,016 4,044 101% Hispanic or Latino (of any race) 95,452 114,595 20% 68,586 86,783 27% Mansfield Tarrant County Year 2010 2018 %Change 2010 2018 %Change Total population 50,941 67,492 32% 1,743,300 2,019,977 16% White alone 33,398 38,495 15% 928,812 958,302 3% Black or African American alone 6,310 11,873 88% 248,965 319,829 28%
American Indian and Alaska Native alone 124 170 37% 6,285 5,797 -8% Asian alone 2,214 2,920 32% 78,566 106,427 35%
Native Hawaiian and Other Pacific Islander alone 45 #DIV/0! 3,003 3,474 16% Some other race alone 28 199 611% 4,360 3,976 -9% Two or more races 1,149 1,788 56% 25,961 45,930 77% Hispanic or Latino (of any race) 7,718 12,002 56% 447,348 576,242 29%
Table 37 Source: 2010, 2018 American Community Survey (ACS) 5-Year - U.S. Census

Arlington Housing Needs Assessment 75
According the 2018 American Community Survey, Arlington had 134,984 total households in
2018. Of the total households, 68.8 percent were family households and 31.2 percent were
non-family households. Grand Prairie had 60,503 total households of which, 76.3 percent
were family households and 23.7 percent were non-family households. Mansfield had 21,856
households of which, 81.1 percent are family households and 18.9 percent are non-family
households. For Tarrant County, total household were 698,995 of which 69.9 percent were
family households and 30.1 percent were non-family households.
Geography
Family Households
Married- Couple Family
Other Family
Male Householder no wife
Female householder no husband
Nonfamily households
Householder living alone
Arlington 92,819 63,323 29,496 8,625 20,871 42,165 34,084 Grand Prairie
46,194 32,311 13,883 3,913 9,970 14,309 11,721
Mansfield 17,716 14,484 3,232 819 2,413 4,140 3,560 Tarrant County
488,262 350,111 138,151 38,588 99,563 210,733 172,090
Table 38 Source: 2018 American Community Survey Five-Year (ACS) – U.S. Census
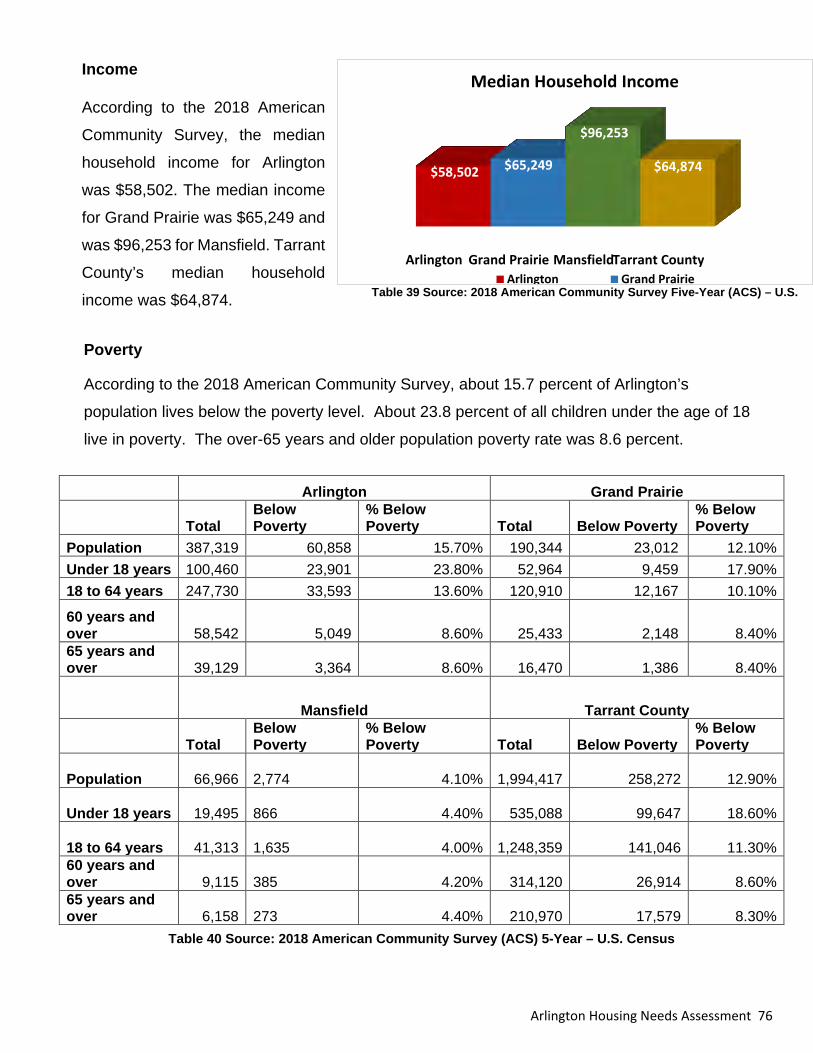
Arlington Housing Needs Assessment 76
Income According to the 2018 American
Community Survey, the median
household income for Arlington
was $58,502. The median income
for Grand Prairie was $65,249 and
was $96,253 for Mansfield. Tarrant
County’s median household
income was $64,874. Table 39 Source: 2018 American Community Survey Five-Year (ACS) – U.S.
Poverty
According to the 2018 American Community Survey, about 15.7 percent of Arlington’s
population lives below the poverty level. About 23.8 percent of all children under the age of 18
live in poverty. The over-65 years and older population poverty rate was 8.6 percent.
Arlington Grand Prairie
Total Below Poverty
% Below Poverty Total Below Poverty
% Below Poverty
Population 387,319 60,858 15.70% 190,344 23,012 12.10% Under 18 years 100,460 23,901 23.80% 52,964 9,459 17.90% 18 to 64 years 247,730 33,593 13.60% 120,910 12,167 10.10%
60 years and over 58,542 5,049 8.60% 25,433 2,148 8.40% 65 years and over 39,129 3,364 8.60% 16,470 1,386 8.40%
Mansfield Tarrant County
Total Below Poverty
% Below Poverty Total Below Poverty
% Below Poverty
Population 66,966 2,774 4.10% 1,994,417 258,272 12.90%
Under 18 years 19,495 866 4.40% 535,088 99,647 18.60%
18 to 64 years 41,313 1,635 4.00% 1,248,359 141,046 11.30%
60 years and over 9,115
385 4.20% 314,120 26,914 8.60%
65 years and over 6,158
273 4.40% 210,970 17,579 8.30%
Table 40 Source: 2018 American Community Survey (ACS) 5-Year – U.S. Census
Arlington Grand Prairie MansfieldTarrant County
$58,502 $65,249
$96,253
$64,874
Median Household Income
Arlington Grand Prairie

Arlington Housing Needs Assessment 77
Income Equality The 2018 American Community Survey (ACS) 5-Year average reports a measure of income
equality within specific geographies called the GINI Index of Income Inequality. The results
of the calculation show the extent to which incomes within the geography are equitably
distributed. An index value of zero represents a perfectly equitable distribution. A value of “1”
represents maximal inequality where a single person has all the money. A value of “0”
indicates earning with no income inequality.
The GINI index for Arlington reported in 2018 was 0.4360. The lower values are represented
primarily in areas within Arlington where the incomes of the tracts for residents are relatively
similar. These are areas where populations sometimes face higher cost for housing. The
GINI Index includes consideration of the lower median household income, concentrations of
poverty, low rates of owner-occupied housing, lower home values, and older housing stock
shown in high percentages of cost burden owner-occupied housing, high percentage of
vacant housing, and a high percentage of vacant home. The ACS estimates that 15.7% of
individuals were at or below poverty during the 5-year estimate. Housing Characteristics The housing supply in Arlington was analyzed under three frameworks. First, the analysis
examined the characteristics of the overall housing supply. Second, the housing supply
was analyzed by tenure (owner-occupied and renter-occupied housing). Third, the housing
supply was analyzed by housing type, including single-family, duplex, multifamily, mobile
home, and other types of housing. The analysis is based on data collected from the U.S.
Census Bureau. The ACS estimates 146,962 total housing units, rental and
homeownership combined, in Arlington in 2018, with 60.3 percent single-family, 38.2
percent multifamily and 1.5 percent other types. The ACS estimated that 91.8 percent of
housing was occupied and 8.2 percent vacant.
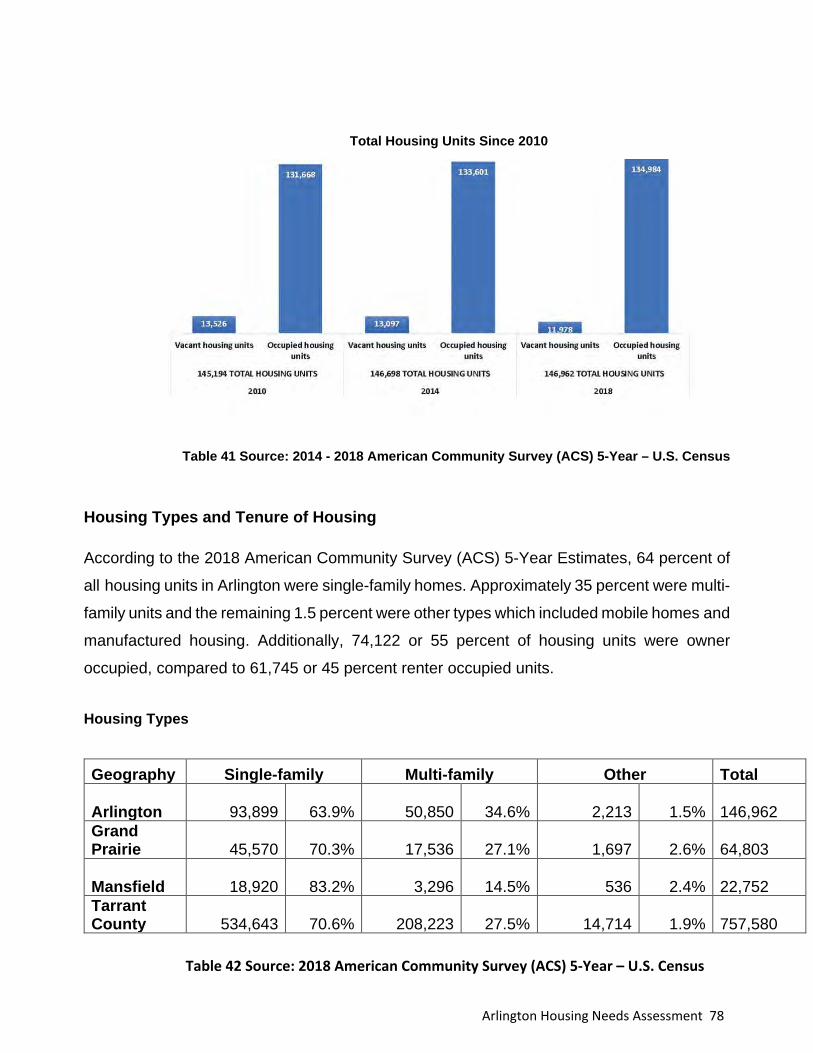
Arlington Housing Needs Assessment 78
Total Housing Units Since 2010
Table 41 Source: 2014 - 2018 American Community Survey (ACS) 5-Year – U.S. Census
Housing Types and Tenure of Housing According to the 2018 American Community Survey (ACS) 5-Year Estimates, 64 percent of
all housing units in Arlington were single-family homes. Approximately 35 percent were multi-
family units and the remaining 1.5 percent were other types which included mobile homes and
manufactured housing. Additionally, 74,122 or 55 percent of housing units were owner
occupied, compared to 61,745 or 45 percent renter occupied units.
Housing Types
Geography Single-family Multi-family Other Total
Arlington 93,899 63.9% 50,850 34.6% 2,213 1.5% 146,962
Grand Prairie 45,570 70.3% 17,536 27.1% 1,697 2.6%
64,803
Mansfield 18,920 83.2% 3,296 14.5% 536 2.4% 22,752
Tarrant County 534,643 70.6% 208,223 27.5% 14,714 1.9% 757,580
Table 42 Source: 2018 American Community Survey (ACS) 5-Year – U.S. Census
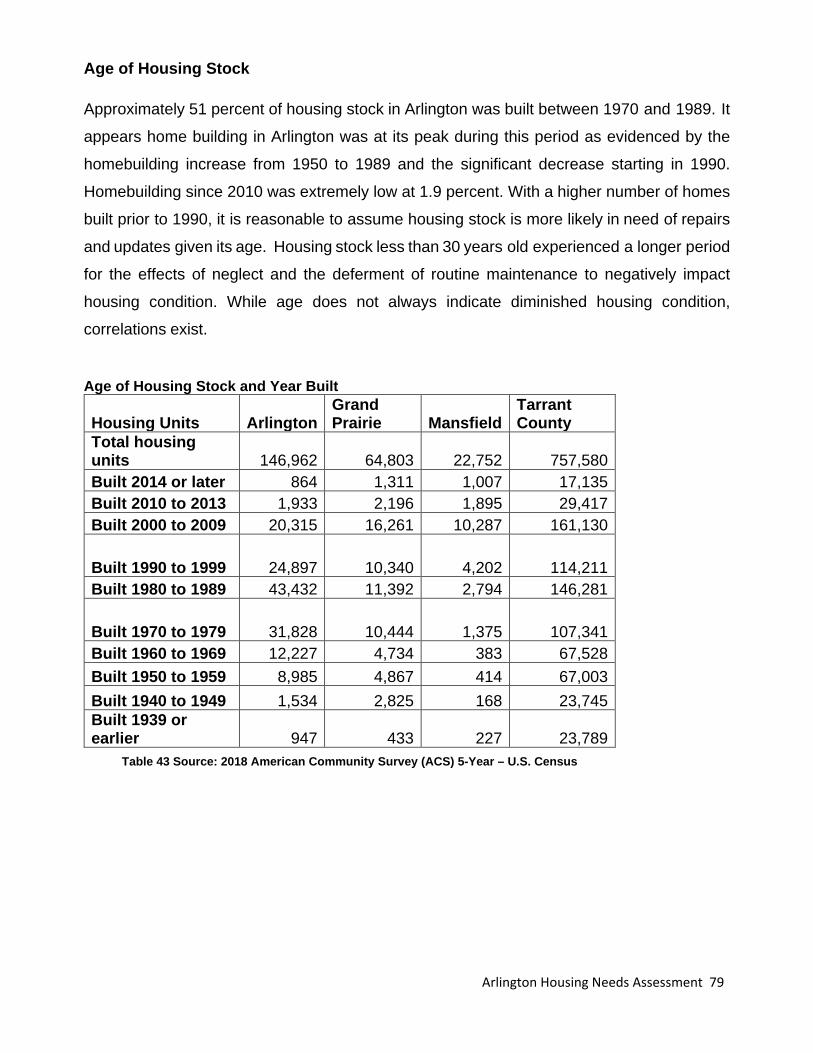
Arlington Housing Needs Assessment 79
Age of Housing Stock Approximately 51 percent of housing stock in Arlington was built between 1970 and 1989. It
appears home building in Arlington was at its peak during this period as evidenced by the
homebuilding increase from 1950 to 1989 and the significant decrease starting in 1990.
Homebuilding since 2010 was extremely low at 1.9 percent. With a higher number of homes
built prior to 1990, it is reasonable to assume housing stock is more likely in need of repairs
and updates given its age. Housing stock less than 30 years old experienced a longer period
for the effects of neglect and the deferment of routine maintenance to negatively impact
housing condition. While age does not always indicate diminished housing condition,
correlations exist.
Age of Housing Stock and Year Built
Housing Units Arlington Grand Prairie Mansfield
Tarrant County
Total housing units 146,962 64,803 22,752 757,580 Built 2014 or later 864 1,311 1,007 17,135 Built 2010 to 2013 1,933 2,196 1,895 29,417 Built 2000 to 2009 20,315 16,261 10,287 161,130
Built 1990 to 1999 24,897 10,340 4,202 114,211 Built 1980 to 1989 43,432 11,392 2,794 146,281
Built 1970 to 1979 31,828 10,444 1,375 107,341 Built 1960 to 1969 12,227 4,734 383 67,528 Built 1950 to 1959 8,985 4,867 414 67,003 Built 1940 to 1949 1,534 2,825 168 23,745 Built 1939 or earlier 947 433 227 23,789
Table 43 Source: 2018 American Community Survey (ACS) 5-Year – U.S. Census
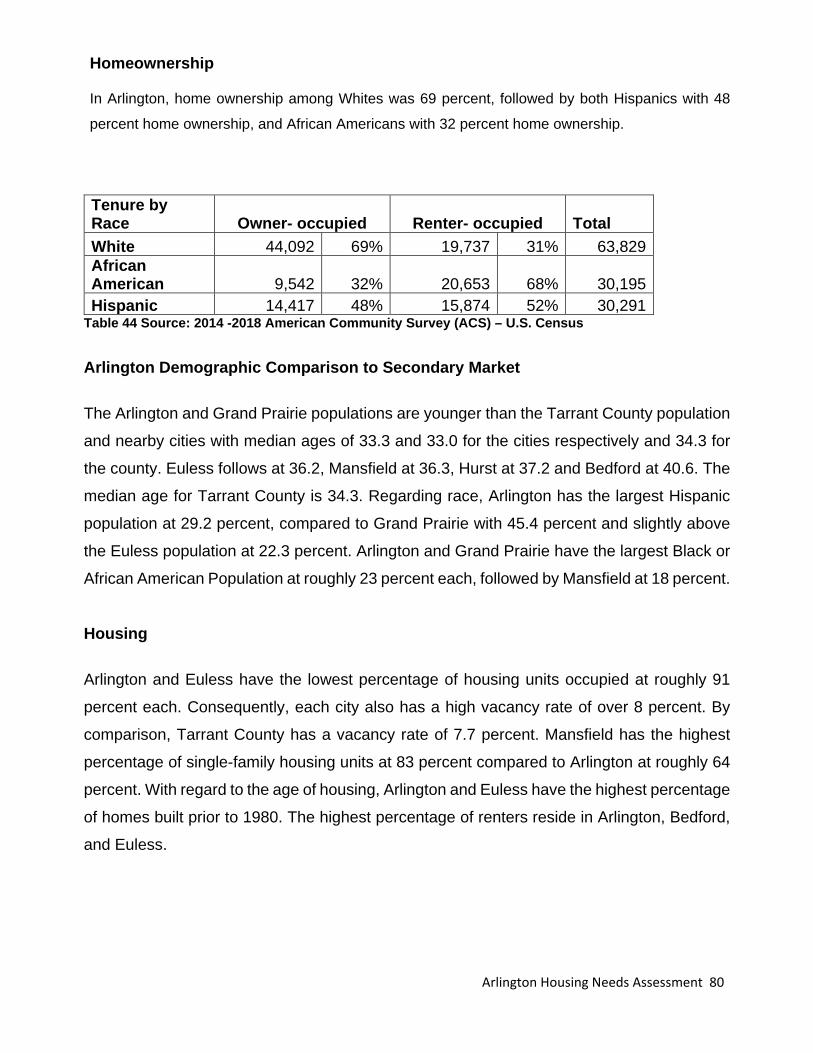
Arlington Housing Needs Assessment 80
Homeownership In Arlington, home ownership among Whites was 69 percent, followed by both Hispanics with 48
percent home ownership, and African Americans with 32 percent home ownership.
Tenure by Race Owner- occupied Renter- occupied Total White 44,092 69% 19,737 31% 63,829 African American 9,542 32% 20,653 68% 30,195 Hispanic 14,417 48% 15,874 52% 30,291
Table 44 Source: 2014 -2018 American Community Survey (ACS) – U.S. Census Arlington Demographic Comparison to Secondary Market The Arlington and Grand Prairie populations are younger than the Tarrant County population
and nearby cities with median ages of 33.3 and 33.0 for the cities respectively and 34.3 for
the county. Euless follows at 36.2, Mansfield at 36.3, Hurst at 37.2 and Bedford at 40.6. The
median age for Tarrant County is 34.3. Regarding race, Arlington has the largest Hispanic
population at 29.2 percent, compared to Grand Prairie with 45.4 percent and slightly above
the Euless population at 22.3 percent. Arlington and Grand Prairie have the largest Black or
African American Population at roughly 23 percent each, followed by Mansfield at 18 percent.
Housing Arlington and Euless have the lowest percentage of housing units occupied at roughly 91
percent each. Consequently, each city also has a high vacancy rate of over 8 percent. By
comparison, Tarrant County has a vacancy rate of 7.7 percent. Mansfield has the highest
percentage of single-family housing units at 83 percent compared to Arlington at roughly 64
percent. With regard to the age of housing, Arlington and Euless have the highest percentage
of homes built prior to 1980. The highest percentage of renters reside in Arlington, Bedford,
and Euless.

Arlington Housing Needs Assessment 81
Economic Arlington’s 2018 American Community Survey (ACS) reported an unemployment rate of 4.9
percent which ranks as the second highest of nearby cities behind Grand Prairie at 5.2. The
lowest unemployment rate is in Mansfield with 3.6. The median household income in
Arlington was $58,502, the lowest of nearby cities and significantly lower than the county
median income of $64,874. Arlington’s poverty rate is among the highest at 15.7 while
Mansfield is the lowest with 4.10 percent. Additionally, Arlington’s senior poverty rate is 8.6
percent, the highest of nearby cities. See Appendix D for the complete unemployment data
analysis and data comparability table.
SOCIO ECONOMIC CHARACTERISTICS Affordability and Cost Burden Housing Affordability Lack of housing affordability, which are households having inadequate income to acquire
housing currently available in the market, may be the most critical impediment in the study
area. The correlation between median home values and household income underscores this
issue. The median housing value according to the 2018 ACS Five-Year in Arlington was
estimated at $157,600. The median gross rent was $997. The average income required to
qualify for a mortgage based on the Arlington median home value of $157,600, is
approximately $65,000 to $75,000 in household income. The average income needed to
qualify for a contract rent of $997 is $35,000 to $39,000. Approximately 42.1 percent of
Arlington’s population earn $49,000 or less. As a point of reference, $35,000 per year is
approximately $17.00 per hour for a forty-hour work week, 52 weeks a year for a single wage
earner. Factor in housing-related expenses other than mortgage or rent payments such as
taxes, insurance, and utilities, home ownership and rental housing is not attainable without
cost burden to many in Arlington especially persons at 80% and below the median income
without some form of home buyer subsidy or rental assistance.

Arlington Housing Needs Assessment 82
Cost Burden Cost Burden is defined by the U.S. Department of Housing and Urban Development as
paying more than 30% of a household income on housing expenses. As shown in Table 43,
cost burden in Arlington has decreased since 2015 for homeowners and to a smaller degree
for renters. Cost Burden among renters was most significant reflecting 48 percent of renters
in Arlington's cost burdened. According to the 2016 Comprehensive Housing Affordability
Strategy (CHAS), 20 percent of Arlington’s homeowners were cost burdened, paying more
than 30 percent of their income on selected mortgage costs.
Table 45 Source: Comprehensive Housing Affordability Strategy 2016
Economic Variables
According to the 2018 Annual Community Survey (ACS) 5-Year estimate, over 80 percent of
the population over the age of 25 have a high school diploma or more. Approximately 4.9
percent of the population 16 or older considered to be in the labor force were unemployed.
Of the total population in the civilian labor force, 3.4 percent were unemployed. Of those
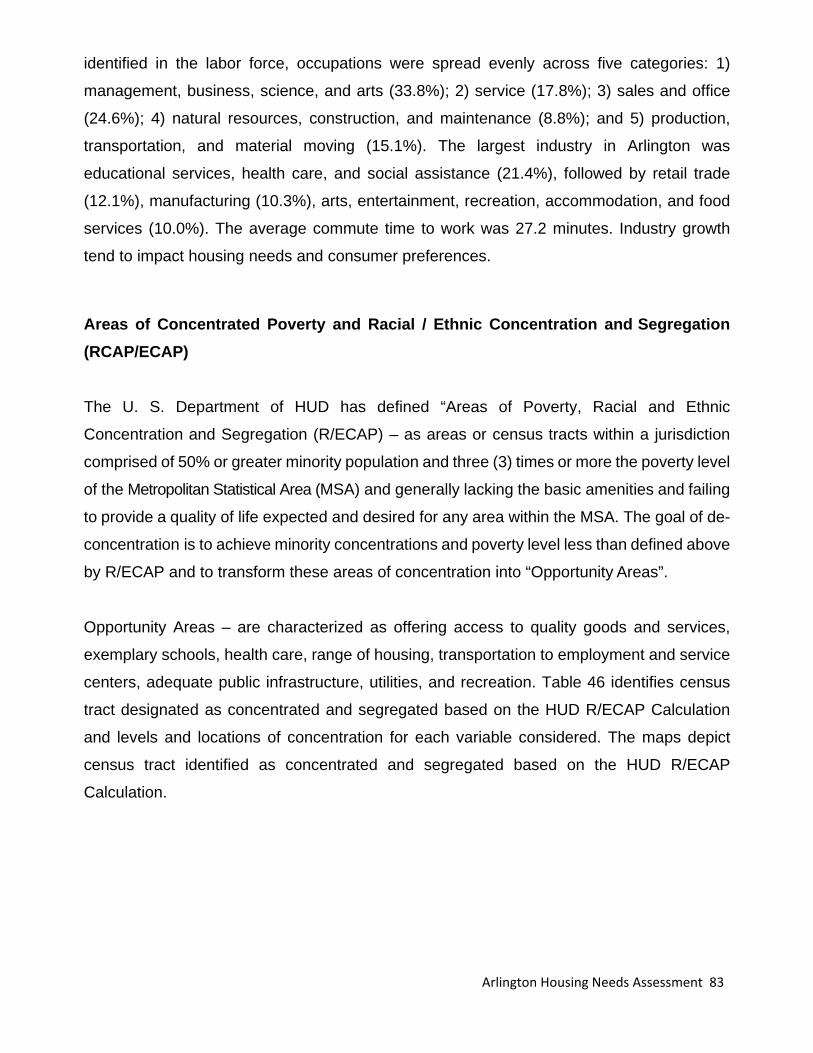
Arlington Housing Needs Assessment 83
identified in the labor force, occupations were spread evenly across five categories: 1)
management, business, science, and arts (33.8%); 2) service (17.8%); 3) sales and office
(24.6%); 4) natural resources, construction, and maintenance (8.8%); and 5) production,
transportation, and material moving (15.1%). The largest industry in Arlington was
educational services, health care, and social assistance (21.4%), followed by retail trade
(12.1%), manufacturing (10.3%), arts, entertainment, recreation, accommodation, and food
services (10.0%). The average commute time to work was 27.2 minutes. Industry growth
tend to impact housing needs and consumer preferences.
Areas of Concentrated Poverty and Racial / Ethnic Concentration and Segregation (RCAP/ECAP)
The U. S. Department of HUD has defined “Areas of Poverty, Racial and Ethnic
Concentration and Segregation (R/ECAP) – as areas or census tracts within a jurisdiction
comprised of 50% or greater minority population and three (3) times or more the poverty level
of the Metropolitan Statistical Area (MSA) and generally lacking the basic amenities and failing
to provide a quality of life expected and desired for any area within the MSA. The goal of de-
concentration is to achieve minority concentrations and poverty level less than defined above
by R/ECAP and to transform these areas of concentration into “Opportunity Areas”.
Opportunity Areas – are characterized as offering access to quality goods and services,
exemplary schools, health care, range of housing, transportation to employment and service
centers, adequate public infrastructure, utilities, and recreation. Table 46 identifies census
tract designated as concentrated and segregated based on the HUD R/ECAP Calculation
and levels and locations of concentration for each variable considered. The maps depict
census tract identified as concentrated and segregated based on the HUD R/ECAP
Calculation.

Arlington Housing Needs Assessment 84
RCAP/ECAP Areas in Arlington
Map 46 Source: U.S. Census, US Department of Housing and Development

Arlington Housing Needs Assessment 85
Food Access in Arlington
Map 46-a Source: U.S. Department of Agriculture
Low-income and low-access - A low-income tract with at least 500 people, or 33 percent of the population, living more than 1 mile (urban areas) or more than 10 miles (rural areas) from the nearest supermarket, supercenter, or large grocery store.
Low-access - A tract with at least 500 people, or 33 percent of the population, living more than 1 mile (urban areas) or 10 miles (rural areas) from the nearest supermarket, supercenter, or large grocery store. Please note, two R/ECAP tracts (122300 & 122400) exist in Low-Income and Low-Access areas with households living more than 1 mile from a grocery store. The remaining R/ECAP tracts (122200, 121903 &121905) exist in Low-Income and Low-Access areas with households living more than ½ mile from a grocery store.
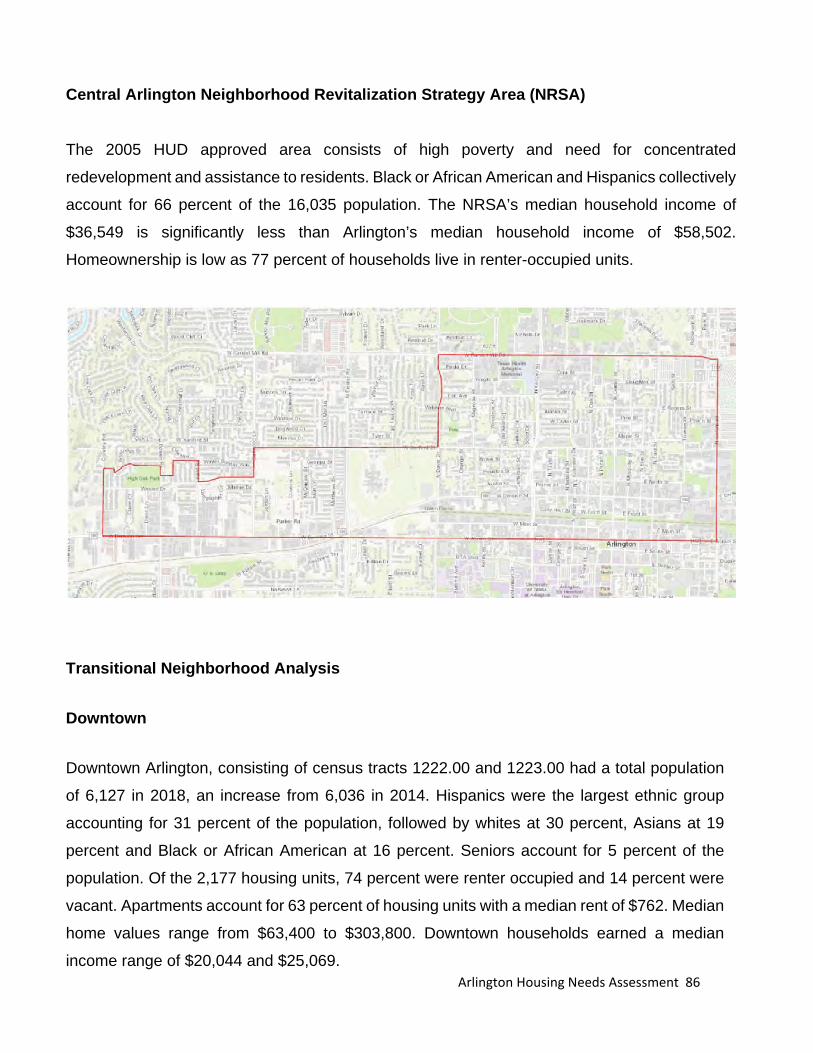
Arlington Housing Needs Assessment 86
Central Arlington Neighborhood Revitalization Strategy Area (NRSA) The 2005 HUD approved area consists of high poverty and need for concentrated
redevelopment and assistance to residents. Black or African American and Hispanics collectively
account for 66 percent of the 16,035 population. The NRSA’s median household income of
$36,549 is significantly less than Arlington’s median household income of $58,502.
Homeownership is low as 77 percent of households live in renter-occupied units.
Transitional Neighborhood Analysis
Downtown Downtown Arlington, consisting of census tracts 1222.00 and 1223.00 had a total population
of 6,127 in 2018, an increase from 6,036 in 2014. Hispanics were the largest ethnic group
accounting for 31 percent of the population, followed by whites at 30 percent, Asians at 19
percent and Black or African American at 16 percent. Seniors account for 5 percent of the
population. Of the 2,177 housing units, 74 percent were renter occupied and 14 percent were
vacant. Apartments account for 63 percent of housing units with a median rent of $762. Median
home values range from $63,400 to $303,800. Downtown households earned a median
income range of $20,044 and $25,069.
Arlington Housing Needs Assessment 87
East Arlington
The largest ethnic population group in East Arlington was Hispanics, accounting for 72 percent
of the 33,258 in population. Whites were the second largest racial group at 16 percent followed
by Black or African American at 8 percent. The overall population had increased by 6 percent
since 2014. In 2018, East Arlington consists of 10,179 housing units, of which 61 percent were
built prior to 1970. Single Family housing units accounted for 63 percent of the total units while
apartments accounted for 36 percent. Median home values range from $73,700 to $126,000
and the average gross rent of $948. The unemployment rate was 8 percent for the area and
28 percent of population earned less than a high school degree. The median household income
range was $33,826 to $54,052.
I-20/US 287
The total population increased 7 percent from 19,901 in 2014 to 21,203 in 2018. Whites
account for 59 percent of the population, followed by Hispanics at 18 percent and Black or
African American at 15 percent. The total housing units for this area was 8,690 of which 58
percent were owner occupied and 72 percent were single family homes. The median home
value range was $159,500 to $236,500. The unemployment rate was 5.8 percent and 7 percent
of the population reported earning less than a high school diploma. The median household
income ranged from 58,580 to 82,022.
Southeast Arlington
Consisting of census tract 1115.47, the total 2018 population of 19,240 increased from its’
2014 population of 17,531 in 2014. The largest racial group of the population was Black or
African American at 40 percent, Hispanics at 31 percent, Whites at 18 percent and Asians at
16 percent. Of the 4,956 total housing units, 98 percent were single family and 78 percent were
owner-occupied. The median home value was $150,800 and over 5 percent of the homes were
built after 1980. The household median income was 71,455 and the unemployment rate was
2.9 percent.
Arlington Housing Needs Assessment 88
Lamar/Collins
The total population for 2018 was 7,241 of which, 46 percent were white, 41 percent were
Black or African American. Roughly 87 percent of the 3,783 housing were occupied, leaving
12.4 percent or 470 vacant. Resident in this area were mostly renter as apartments account
for over 80 percent of the total housing units. Median home value was $245,950 and median
gross rent was $879. Over 37 percent of renter households were paying more than 30 percent
of their monthly income on housing cost. The percent of residents with less than a high school
diploma was 11 percent and median household income was $49,189. See complete table of
all neighborhood data in the Appendix E.
Anti-Poverty The City of Arlington coordinates with public and private organizations to produce and preserve
affordable housing and related services for low-income persons. Arlington reduces the number
of families in poverty through strategies such as: coordinating with United Way Arlington on
financial literacy and asset-building strategies; continued partnership with transportation
providers such as the Via rideshare app to provide employment-related transportation;
continued funding for housing, community, and economic development for low-income
residents; continued partnership with multiple partners in East Arlington for a concept similar
to the Promise Zone designation, whereby poverty is addressed through increased jobs,
educational opportunity and improved housing and public safety; continued support of United
Way Arlington to facilitate coordinated solutions to reduce poverty; continued support of
services to homeless families and families at risk of homelessness to increase housing options;
continued support of information and referral networks to allow easier access to community
dissemination of information about specific anti- poverty programs such as the Earned Income
Tax Credit (EITC), Family Self-Sufficiency Program, Head Start, and mainstream public
assistance resources.

Arlington Housing Needs Assessment 89
In 2019, the City partnered with Foundation Communities to support the Volunteer Income Tax
Assistance (VITA) sites in Arlington. Working closely with Foundation Communities,
approximately 2,801 of Arlington low and middle-income families received increased access
to free tax assistance and EITC. Locally, the American Association of Retired People (AARP)
assists taxpayers age 60 and older.
National Association of Realtors Index The Housing Affordability Index (HAI) measures whether a typical family earns enough income
to qualify for a mortgage loan on a typical home at the regional level based on the most recent
price and income data. A higher HAI indicates relatively greater affordability. A ratio of 1.00
means that the median family income is exactly enough to purchase the median-priced home.
A HAI above 1.00 means the MFI exceeds the required income to purchase a median-priced
home. Conversely, a HAI below 1.00 indicates that the MFI is not enough to purchase the
median-priced home. Arlington 2018 HAI of 157.9 indicates the median family income is
enough to purchase the median priced home.
Table 47 Source: National Association of Realtors
Housing Opportunity Index
The National Association of Home Builders (NAHB) has developed a Housing Opportunity
Index, which is defined as the share of homes affordable for median household incomes for
each Metropolitan Statistical Area (MSA). Within Arlington, 58.25 percent of homes sold in
2018 were affordable to households earning the median income.
2015 2016 2017 2018
186.60 187.60 174.70 157.90
Affordability Index of Existing Single-Family Homes

Arlington Housing Needs Assessment 90
Table 48 Source National Association of Home Builders
Housing and Transportation Affordability The Center for Neighborhood Technology (CNT) developed the Housing and
Transportation Affordability Index (H+T Index) which measures housing and transportation
costs and sets the benchmark at no more than 45 percent of household income. The
traditional measure of affordability recommends that housing cost no more than 30% of
household income. The H+T Index for Arlington using 2015 American Community Survey
(ACS) and 2014 Longitudinal Employer-Household Dynamics data is 45 percent.
2015 2016 2017 2018
67.72 67.55 61.55 58.25
Housing Opportunity Index

Arlington Housing Needs Assessment 91
Affordable Housing 2019 Developments receiving Low Income Housing Tax Credits Source: Texas Department of Housing & Community Affairs (TDHCA) *Source: ALN Apartment data shows the current subsidized rent is $917. There is only one LIHTC property with 4 bedrooms.
Table 49 Source: Texas Department of Housing and Community Affairs
Developments Receiving Low Income House Tax Credits – Elderly Only
Table 50 Source: Texas Department of Housing and Community Affairs
Source: Texas Department of Housing & Community Affairs (TDHCA)

Arlington Housing Needs Assessment 92
Residents Receiving Rental Assistance
Table 51 Source: Texas Department of Housing & Community Affairs, National Housing Preservation Database Housing Conditions and Housing Needs The Needs Assessment identified Arlington’s housing conditions in older neighborhoods as
a concern. Older neighborhoods are a primary source of alternative lower cost housing. Some
existing homes in older neighborhoods are becoming less desirable due to deteriorating
conditions and consumer preferences for newer homes with up-to-date construction
technologies, with respect to finish-out, amenities and energy efficiency.
In the neighborhoods experiencing decline, households have the least housing options.
Some rental housing has deteriorated over time as, due to lack of maintenance either because
of rental income not keeping pace with needed improvements and maintenance or through
landlords unwilling to spend rental income or investment dollars on their properties. Whatever
the cause, poor maintenance eventually leads to issues with major systems such as roofs
and foundations, water infiltration and more rapid deterioration from that point forward. Over
time, the conditions of the units cause some to become uninhabitable, difficult to sell, and
blights on the community. Demolition removes the blight of the dilapidated structure, but often
leaves vacant lots.
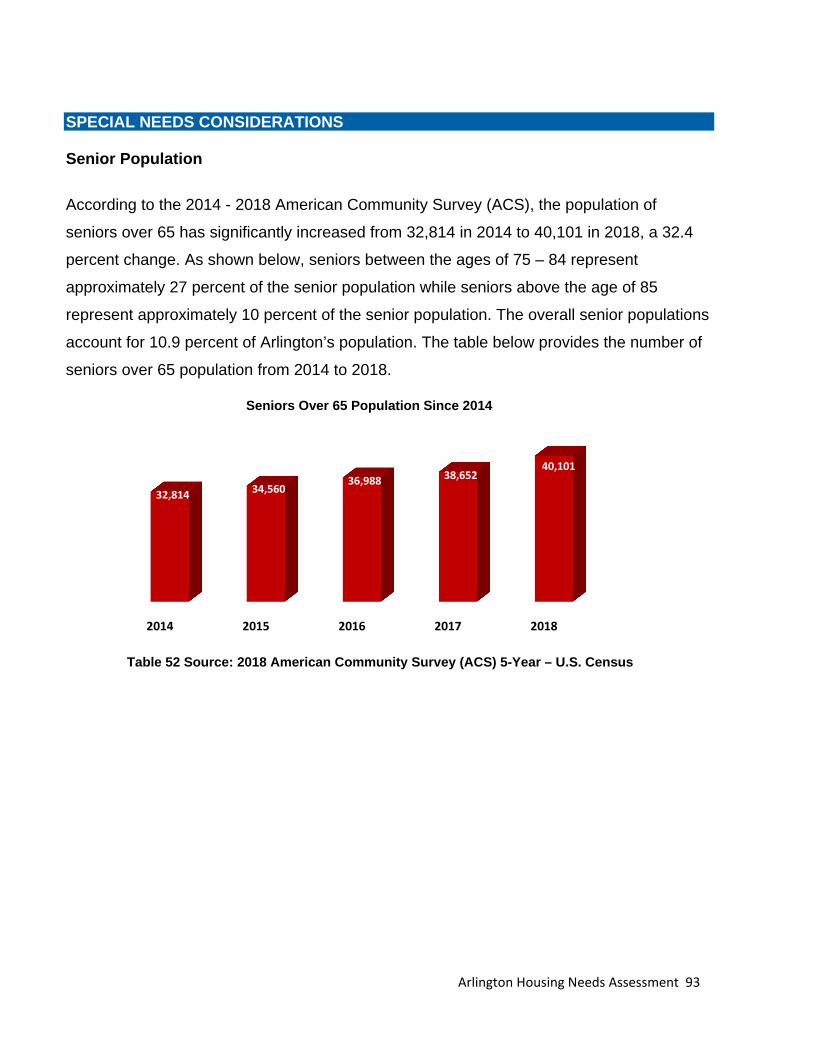
Arlington Housing Needs Assessment 93
SPECIAL NEEDS CONSIDERATIONS Senior Population
According to the 2014 - 2018 American Community Survey (ACS), the population of
seniors over 65 has significantly increased from 32,814 in 2014 to 40,101 in 2018, a 32.4
percent change. As shown below, seniors between the ages of 75 – 84 represent
approximately 27 percent of the senior population while seniors above the age of 85
represent approximately 10 percent of the senior population. The overall senior populations
account for 10.9 percent of Arlington’s population. The table below provides the number of
seniors over 65 population from 2014 to 2018.
Table 52 Source: 2018 American Community Survey (ACS) 5-Year – U.S. Census
2014 2015 2016 2017 2018
32,814 34,560 36,988 38,652
40,101
Seniors Over 65 Population Since 2014
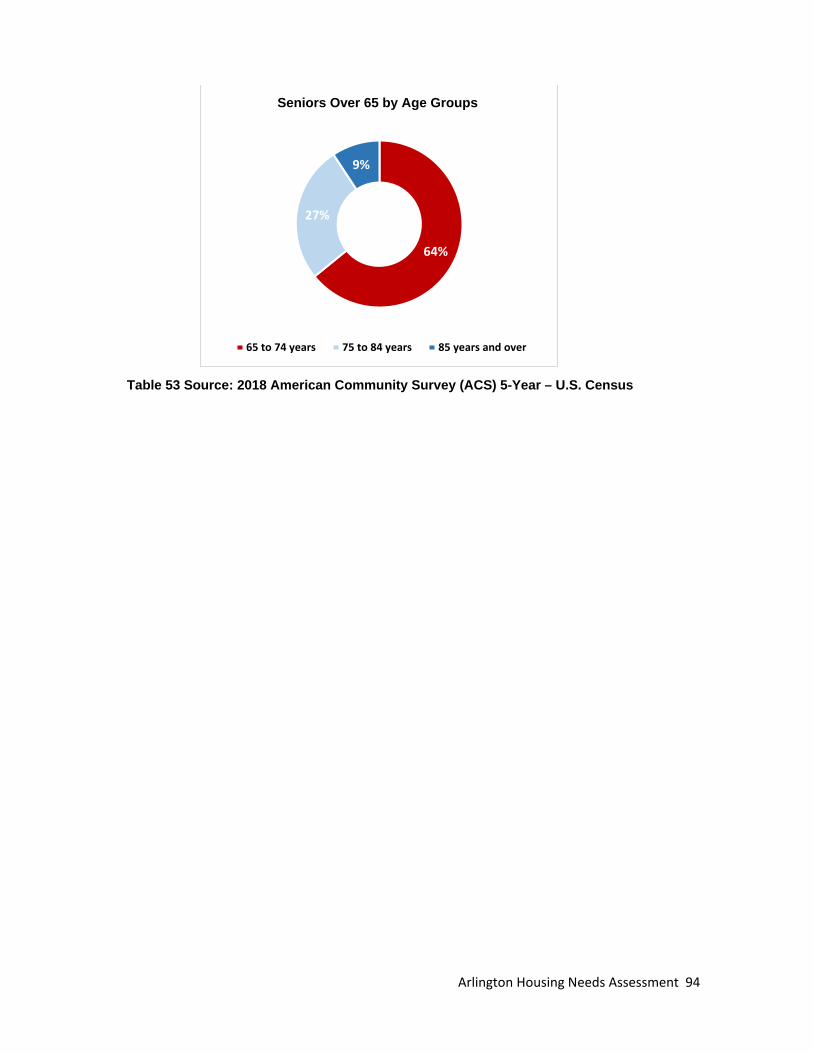
Arlington Housing Needs Assessment 94
Table 53 Source: 2018 American Community Survey (ACS) 5-Year – U.S. Census
64%
27%
9%
Seniors Over 65 by Age Groups
65 to 74 years 75 to 84 years 85 years and over
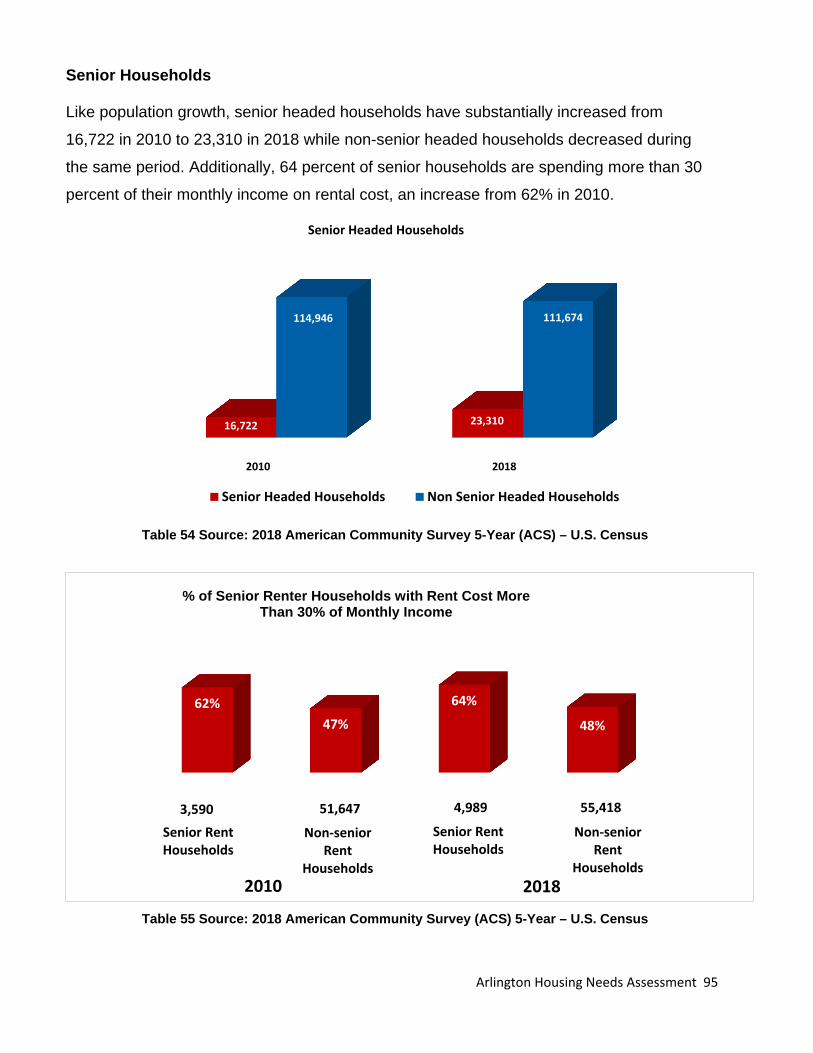
Arlington Housing Needs Assessment 95
Senior Households Like population growth, senior headed households have substantially increased from
16,722 in 2010 to 23,310 in 2018 while non-senior headed households decreased during
the same period. Additionally, 64 percent of senior households are spending more than 30
percent of their monthly income on rental cost, an increase from 62% in 2010.
Table 54 Source: 2018 American Community Survey 5-Year (ACS) – U.S. Census
Table 55 Source: 2018 American Community Survey (ACS) 5-Year – U.S. Census
2010 2018
16,722 23,310
114,946 111,674
Senior Headed Households
Senior Headed Households Non Senior Headed Households
62%47%
64%
48%
% of Senior Renter Households with Rent Cost More Than 30% of Monthly Income
3,590 51,647 4,989 55,418
Senior Rent Households
Non-senior Rent
Households
Senior Rent Households
Non-senior Rent
Households 2010 2018

Arlington Housing Needs Assessment 96
Disability Status Disabilities among non-institutionalized persons accounted for 38,714 or 9.9 percent of the
population in 2018. The largest age group with disabilities were persons 65 years and over at
34.9 percent. The table below provides disability percentages of the population by age
groups.
Table 56 Source: 2018 American Community Survey (ACS) 5-Year – U.S. Census
1%
6%5%
10%
26%
52%
Population with Disability by Age Groups
Under 5 years 5 to 17 years 18 to 34 years
35 to 64 years 65 to 74 years 75 years and over
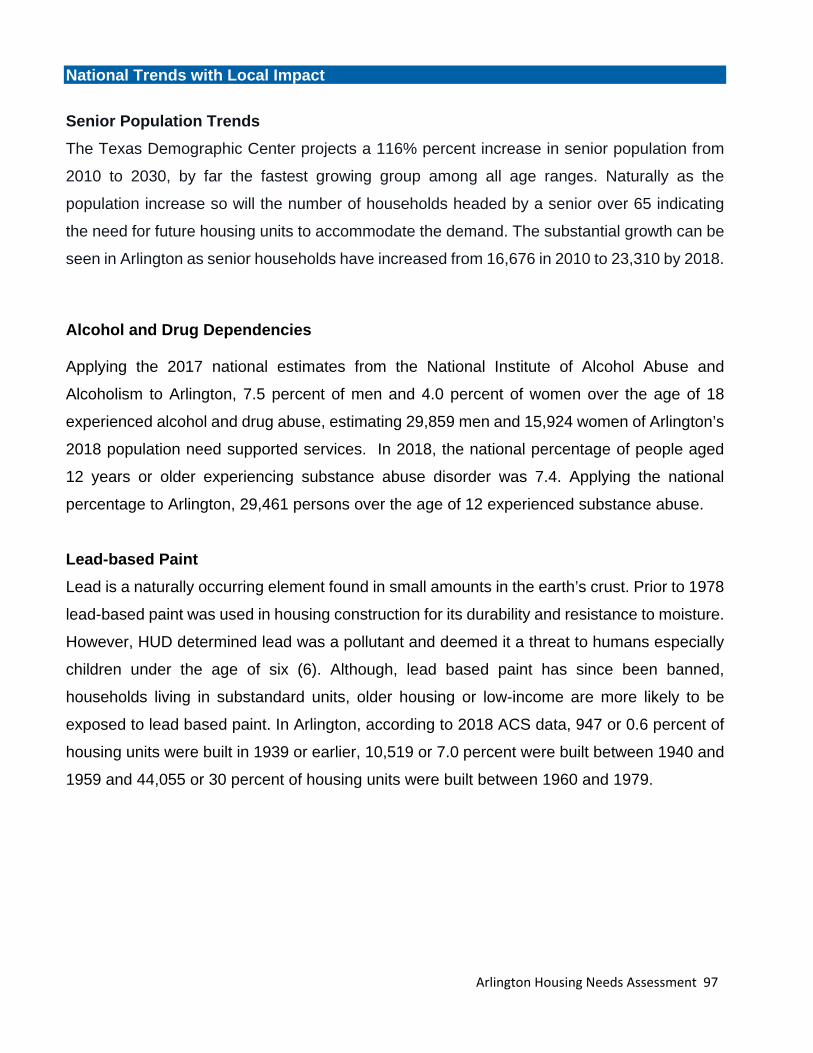
Arlington Housing Needs Assessment 97
National Trends with Local Impact
Senior Population Trends The Texas Demographic Center projects a 116% percent increase in senior population from
2010 to 2030, by far the fastest growing group among all age ranges. Naturally as the
population increase so will the number of households headed by a senior over 65 indicating
the need for future housing units to accommodate the demand. The substantial growth can be
seen in Arlington as senior households have increased from 16,676 in 2010 to 23,310 by 2018.
Alcohol and Drug Dependencies Applying the 2017 national estimates from the National Institute of Alcohol Abuse and
Alcoholism to Arlington, 7.5 percent of men and 4.0 percent of women over the age of 18
experienced alcohol and drug abuse, estimating 29,859 men and 15,924 women of Arlington’s
2018 population need supported services. In 2018, the national percentage of people aged
12 years or older experiencing substance abuse disorder was 7.4. Applying the national
percentage to Arlington, 29,461 persons over the age of 12 experienced substance abuse.
Lead-based Paint Lead is a naturally occurring element found in small amounts in the earth’s crust. Prior to 1978
lead-based paint was used in housing construction for its durability and resistance to moisture.
However, HUD determined lead was a pollutant and deemed it a threat to humans especially
children under the age of six (6). Although, lead based paint has since been banned,
households living in substandard units, older housing or low-income are more likely to be
exposed to lead based paint. In Arlington, according to 2018 ACS data, 947 or 0.6 percent of
housing units were built in 1939 or earlier, 10,519 or 7.0 percent were built between 1940 and
1959 and 44,055 or 30 percent of housing units were built between 1960 and 1979.

Arlington Housing Needs Assessment 98
Homeless Persons According to the Tarrant County Homeless Coalition’s Point in Time count on January 23,
2020, approximately 201 people were identified as homeless in Arlington, a decrease from 245
persons identified as homeless in 2019. Emergency sheltered persons accounted for 94 of
the homeless identified, while unsheltered and transitional housing served persons accounted
for 91 and 16, respectively.
Annual Homeless Point in Time Count – Housing Needs
Table 57 Source 2020 Tarrant County Homeless Coalition State of Homeless Annual Report
Persons with HIV - AIDS According to the 2017 HIV Surveillance Report, 97 people listing Arlington addresses as their
residence were diagnosed with HIV and 37 were diagnosed with AIDS. As noted by the
National AIDS Housing Coalition, persons with HIV or AIDS receiving inadequate treatment
are most likely to face housing instability and homelessness. Additionally, housing
discrimination is a challenge faced by persons with HIV or AIDS. Arlington has assisted in
providing housing for people with HIV or AIDS and supports the AIDS Outreach Center.
Samaritan House provides housing vouchers for persons with HIV/AIDS in Tarrant County,
including Arlington through the Genesis Project and Tarrant County HOPWA competitive
grant.
Arlington Housing Needs Assessment 99
SPECIAL INTEREST HOUSING
Student Housing The most recent student housing report detailing existing inventory on and off campus was
completed in 2013. Residence halls provided housing for 2,180 students which has since
increased to 2,382 as of 2019 according to the University of Arlington’s Division of Student
Affairs. The number of on-campus apartment units available provided housing to 2,109
students as of 2013. According to the 2018 Arlington Downtown Master Plan, 7,565 students
were housed in Arlington and projects 8,123 students will be housed by 2023 and 8,723
housed by 2028 assuming UTA's enrollment rate remains constant at 28 percent.
LGBTQ+ Housing Needs The National Human Rights Commission, HRC Foundation, released this year “A National
Epidemic: Fatal Anti-Transgender Violence in the United States in 2019”. It is a distressing
report highlighting at least 22 transgender people and gender non-conforming people were
killed nationally in 2019 and details the contributing factors that lead to this tragic violence.
While this may be the most tragic and impactful issue relative to life and death for the Arlington
and Metro area LGBTQ+ community, housing and fair housing remain major concerns as well.
Through research provided by the National Association of Gay & Lesbian Real Estate
Professionals (NAGLREP) and local based Housing Education Learning Project (HELP), the
housing needs assessment identified critical issues relative to housing and housing related
needs of the LGBTQ+ community including:
Housing - Housing discrimination based on sexual orientation and gender identity is still not
illegal nationally or in Arlington and perceptions of occurrences of discrimination appears to
remain high. Housing discrimination and perceptions negatively impacts the community. For
example, LGBTQ+ homeownership rates nationally are lower than the national average where
49% of LGBTQ+ individuals own a home, compared to the 65% national average. This means
for the City of Arlington, a potential loss of LGBTQ+ home buyers and renters to surrounding
cities. Most of HELP’s resources address non-housing needs, therefore, new resources are
needed to address housing related needs.

Arlington Housing Needs Assessment 100
Stigmas – Addressing negative stigmas and limited understandings of the LGBTQ+
community in general, people living with HIV and AIDS, and others facing discrimination, bias,
and persons negatively impacted by crime due to sexual orientation and gender equality
remains a high priority.
Access to Services and Homelessness – Many in the LGBTQ+ community are seeking
help in addressing needs including healthcare, homelessness, housing discrimination, access
to housing, transportation, goods, and services. Limited access to public or low-cost
transportation is a significant issue with services most available in the larger cities of Dallas
and Fort Worth.
Safety and Security – A recent survey conducted in July 2019 by HELP found that a major
issue faced by LGBTQ+ populations both statewide and in Arlington is safety and security.
This ranged from actual crimes and violence to intimidation. A majority of respondents
statewide indicated they do not feel safe or treated fairly. Survey participants cited their need
to spend money and resources for costs outside of housing, in other cities such as Fort Worth
and Dallas to access the entertainment, goods and services they prefer as an obstacle to
living in Arlington. This was a statewide survey and specific data for Arlington is still being
analyzed and tabulated.
According to the National Association of Gay & Lesbian Real Estate Professionals
(NAGLREP), “there remains a major problem in the real estate industry as housing
discrimination based on sexual orientation and gender identity is still not illegal.” This reality
is detailed in the NAGLREP 2019-2020 annual report. The report reveals how and why
LGBTQ+ home ownership rates are lower than the national average and how housing
discrimination negatively impacts the community.
The NAGLREP report explains how the U.S. Supreme Court’s decision to legalize same-sex
marriage in 2015 has greatly influenced home ownership and home-buying habits.
NAGLREP’s annual report details this trend. Life events, especially marriage, are traditional
drivers of homeownership. The LGBTQ+ community has clearly benefited since same-sex
marriage was legalized in the historic Obergefell v. Hodges Supreme Court decision on June
26, 2015. The ruling has impacted home buying habits. Freddie Mac’s consumer study
Arlington Housing Needs Assessment 101
showed that 73% of all married LGBTQ+ couples own their own home, compared to 41% of
non-married LGBTQ+ couples and only 35% of LGBTQ+ singles. NAGLREP members – 55%
of those surveyed – believe more married LGBTQ+ couples are buying homes since the
Supreme Court victory. The number has grown from 46% just two years ago. Despite this
trend, the LGBTQ+ community may still experience discrimination in the home search
process. A staggering 64% of NAGLREP members cited fear of being welcomed in a new
community as being a factor in the lower LGBTQ homeownership rates. The Equality Act, a
bill that would amend the Civil Rights Act of 1964 to prohibit discrimination on the basis of
sexual orientation and gender identity in employment, public accommodations, public
education, federal funding, credit, and jury system was reintroduced in Congress on March
13, 2019, but has not yet passed. This bill, if passed would essentially lead to sexual
orientation and gender identity being added as protected classes under the U.S. Fair Housing
Act. Local actions needed relative to this issue and HNA recommendations will be further
discussed in the Analysis of Impediments as well.
Housing for Younger Demographics
Esri's Tapestry Segmentation “Young and Restless” - Esri's Tapestry Segmentation is a
geodemographic system that identifies 68 distinctive markets in the U.S. based on
socioeconomic and demographic characteristics to provide an accurate, comprehensive
profile of U.S. consumers. These segments are then combined into one of 12 LifeMode
groups. Segments and groups are assigned to neighborhoods by sorting more than 60
attributes including income, employment, home value, housing type, education, household
composition, age, and other key determinants of consumer behavior. The dominant LifeMode
group and market segment in Arlington is Midtown Singles, or ”Young and Restless”. With a
homeownership rate of 13 percent, the ‘Young and Restless’ segment is more likely to favor
renting. This market segment ranks among the top 5 for renters, movers, those enrolled in
college, and labor force participation rate. About 1 in 5 residents move each year. More than
half of all householders in this category are under the age of 35, and the majority live alone
or in shared non-family dwellings. Their median household income is still below the national
average, smartphones are a way of life, and they use the Internet extensively. ’Young and
Restless’ consumers are diverse, favoring densely populated neighborhoods in large
metropolitan areas. Over 50% are in the South; of those, one fifth live in Texas.

Arlington Housing Needs Assessment 102
FEDERAL FUNDED PROGRAMS Arlington provides funding to meet the affordability needs of renter and homeowner
households through federal programs administered by the U.S Department of Housing and
Urban Development (HUD). Federal funds are awarded to Arlington to implement programs
including but not limited to Project Based Section 8, Section 811, and Section 202. Federal
programs are also provided to address homelessness and individuals with special needs.
Community Development Block Grant (CDBG) Arlington receives annual grants on a formulaic basis to develop viable communities by
providing decent housing, suitable living environment, and expanding economic opportunities,
principally for low- and moderate-income persons.
Home Investment Partnership Program (HOME) The HOME Investment Partnerships Program (HOME) provides formula grants to states and
localities, often in partnership with local nonprofit groups. HOME funds are used to fund a
wide range of activities including building, buying, and/or rehabilitating affordable housing for
rent or homeownership or providing direct rental assistance to low-income people. HOME is
the largest Federal block grant to state and local governments designed exclusively to create
affordable housing for low-income households. In 2019, Arlington received $1,156,155 in
HOME funds which were allocated to NRSA and city-wide focused projects addressing
housing development, housing rehabilitation, homeless prevention, and home ownership. Arlington Homebuyer’s Assistance Program (AHAP) The Arlington Homebuyers’ Assistance Program (AHAP) provides down payment and closing
cost assistance to low income, first-time homebuyers. Down payment and closing cost
assistance are provided in the form of a forgivable loan of up to $20,000 based on each
applicant’s underwriting and subsidy layering assessment. Additionally, the program is
restricted to households earning less than 80 percent of the area median income. In 2018,
AHAP assisted 6 families with the purchase of a new home.
Arlington Housing Needs Assessment 103
Housing Rehabilitation Program Housing Rehabilitation Repair grants provide low-income homeowners with a one-time,
interest-free, forgivable loan of up to $24,500. The loan is used to bring properties into
compliance with local City codes, and primarily addresses repairs such as the electrical,
heating, and plumbing systems. A 5-year lien is placed on the home and the loan is forgiven
at a rate of 1.67% monthly. Removal of lien is then requested once the 5-year affordability
period has been met. Under this program in 2018, a total of 64 low-income households
received housing rehabilitation assistance.
Emergency Repair Grant Emergency Repair Grant provides low-income homeowners with a one-time grant, up to
$5,000 per household during a three-year period, for emergency repairs to their home. An
emergency is a situation or condition that occurred recently (generally within 90 days) without
warning, that is detrimental or a threat to life, health, or safety, and requires immediate action.
Use of funds include but are not limited to structural damage or mechanical equipment repair
for health and safety concerns. The program provided emergency repairs to 39 low-income
households.
Architectural Barrier Removal Grant Architectural Barrier Removal Grants assist low-income, disabled individuals and families with
housing modifications to allow for greater mobility. The improvements may include, but are
not limited to installation of ramps, safety rails or widening of doorways. The number of
households assisted by this program for 2018 was 10.
Emergency Solutions Grants Emergency Solutions Grants are funds awarded to Arlington and allocated to organizations
providing shelter and services to homeless individuals and families. The ESG program is
funded by the U.S. Department of Housing and Urban Development (HUD). As of the 2019
Annual Action Plan, Arlington received $279,640 to use for shelter services, rapid rehousing,
and homeless prevention. Temporary shelter was provided to 1,928 homeless individuals in
2018 at the Arlington Life Shelter, Salvation Army, and Safe Haven. The total served included
642 children, 33 percent and 1,286 adults, 67 percent.
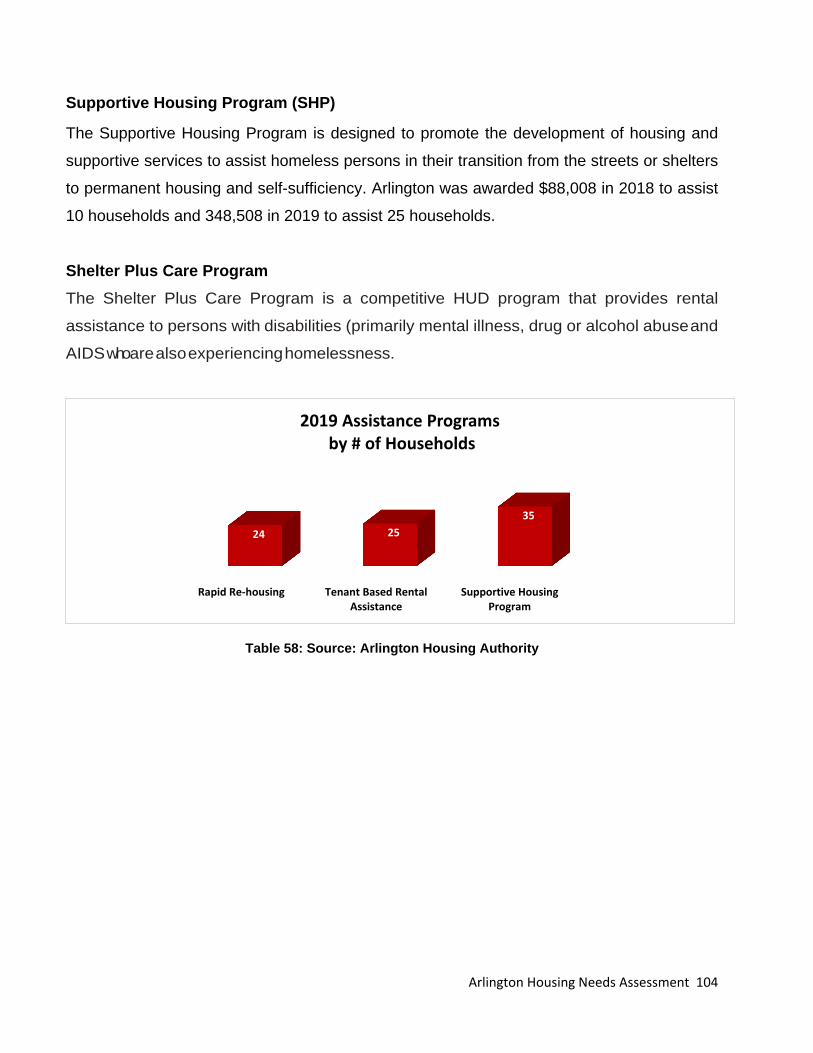
Arlington Housing Needs Assessment 104
Supportive Housing Program (SHP)
The Supportive Housing Program is designed to promote the development of housing and
supportive services to assist homeless persons in their transition from the streets or shelters
to permanent housing and self-sufficiency. Arlington was awarded $88,008 in 2018 to assist
10 households and 348,508 in 2019 to assist 25 households.
Shelter Plus Care Program The Shelter Plus Care Program is a competitive HUD program that provides rental
assistance to persons with disabilities (primarily mental illness, drug or alcohol abuse and
AIDS who are also experiencing homelessness.
Table 58: Source: Arlington Housing Authority
Rapid Re-housing Tenant Based RentalAssistance
Supportive HousingProgram
24 2535
2019 Assistance Programsby # of Households

Arlington Housing Needs Assessment 105
CITY OF ARLINGTON PROGRAMS
In addition to federal entitlement funded programs, Arlington has implemented several
programs funded by the City of Arlington and the State of Texas to assist residents with the
purchase, maintenance, or rehabilitation of housing.
Housing Finance Mortgage Credit Certificate Program The Mortgage Credit Certificate program is a federal income tax credit program that allows
first time homebuyers to take a federal income tax credit equity of up to 30% of their annual
interest paid on the home, up to a maximum of $2,000 per year.
Non-Profit Owned Renter-Occupied Housing Rehabilitation in Designated Target Areas
The City’s Housing Rehabilitation Program helps non-profit organizations rehabilitate single-
family or duplex rental properties located in a designated target area. The tenant must be low-
income and must reside in the property at the time the application is processed. For low-
income tenants, the program will fund 100 percent of the eligible repairs up to $24,500.
Homeless Housing and Services Program (HHSP) Homeless Housing and Services Program (HHSP) is a state funded initiative used in
Arlington to help the homeless and those in imminent danger of becoming homeless. The
funds are primarily utilized for Arlington renters who are in imminent danger of being evicted
from their rental unit and without financial assistance, would become homeless. The City of
Arlington anticipates it will serve approximately 60 families annually from October 2019 to
August 2020, or until funding is depleted.

Arlington Housing Needs Assessment 106
ARLINGTON HOUSING AUTHORITY PROGRAMS Housing Choice Vouchers (HCV) The Housing Choice Voucher program assist very low-income families, elderly, and disabled
persons in finding affording decent, safe, and sanitary housing. Participants in this program
receive subsidies to lease units from private property owners. Each unit must pass a Housing
Quality Standards (HQS) inspection and be rent reasonable as compared to other similar
units in the area. Since housing assistance is provided on behalf of the family or individual,
participants can find their own housing, including single-family homes, townhouses, and
apartments. The program is administered by the Arlington Housing Authority which as of
March 2020, controls 3173 vouchers.
Tenant Based Rental Assistance The Tenant Based Rental Assistance (TBRA) program is a federally funded program
regulated by the U.S. Department of Housing and Urban Development (HUD), managed and
operated in the City of Arlington by the Arlington Housing Authority (AHA). The funding
source for the TBRA program is HUD HOME program funding. HUD allocates HOME funds
to the City of Arlington annually. The Arlington City Council determines the amount of HOME
funding received that will be allocated to the TBRA program.
The purpose of the TBRA program is to provide rental housing assistance in connection with
supportive services to homeless persons or other low-income persons in need of decent
affordable housing. Housing assistance is provided for up to two (2) years. Arlington allocated
$410,000 in HOME funds to assist 33 homeless and at-risk households in 2019.
Family Self Sufficiency Program The Family Self-Sufficiency Program (FSSP) assists eligible families in becoming
economically self-sufficient members of the community. The program provides a range of
services including educational assessment, academic remediation, and GED preparation, as
well as self-esteem and assertiveness training, vocational assessment, employment and job
training, reimbursement for job related expenses, budgeting skills training, gasoline

Arlington Housing Needs Assessment 107
allowance, and minor car repair assistance (limited). The FSSP program also provides
supportive services such as childcare, educational opportunities, job training and
employment counseling, substance / alcohol abuse treatment or counseling, budgeting,
saving and resource management, household skill training, and homeownership counseling.
Arlington was awarded $183,423 to be administered by the Arlington Housing Authority.

Arlington Housing Needs Assessment 108
MARKET ANALYSIS AND HOUSING PROJECTIONS The Housing Needs Assessment (HNA) evaluated market demand for various housing types
and price-points in Arlington and provided projections for future housing needs, utilizing U.S.
Bureau of the Census data, American Community Survey (ACS), Comprehensive Housing
Affordability Strategy (CHAS) as well as Envision Tomorrow software. The market analysis
compared existing rental and owner housing unit supply in 2018 with the demand for housing
of householders in 2025 and 2030 by income. Arlington population projections were provided
by the Texas Demographic Center.
The Balanced Housing Model was used to analyze Arlington’s existing housing supply,
including the matches and mismatches by age, household income and tenure (rental or
owner-occupied). It was also used to conduct a capacity analysis of development potential and
to forecast age and income cohorts. Using this information, the model was then used to
create a series of policy and strategic recommendations for a balanced, sustainable future
housing supply along with targeted goals that can be used to determine Arlington’s future
progress in implementing its plan. Current and future housing needs of Arlington depends on
the underlying economic conditions. This section examines population, occupations, wages,
and employment data provided by Texas Labor Market and U.S Bureau of Labor Statistics.
Future housing needs were partially determined utilizing year 2040 population projections
completed by the Texas Demographic Center which factors demographic change, mortality,
fertility, and migration under the Cohort Component Population Projection Method.
SECTION 5: HOUSING NEEDS PROJECTIONS

Arlington Housing Needs Assessment 109
UNEMPLOYMENT AND EMPLOYMENT Arlington Annual Unemployment Rate: 2011 - 2018 The data on the graph represents the annual unemployment rate decrease from 2011 to 2018.
Arlington’s unemployment rate has remained in line with Tarrant County’s unemployment
rate with the only outlier in 2013, in which Arlington’s unemployment was noticeably higher
than Tarrant County.
Table 59 Source U.S Bureau of Labor Statistics
2019 Top 10 Employers
Table 60 Source Arlington Economic Development
Tarrant County Arlington
2018 2017 2016 2015 2014 2013 2012 2011
3.7 4.2
3.9
4.6
5.9
6.9
7.1
7
7.6 8.2
8 1
Unemployment Rate 2011 - 2018

Arlington Housing Needs Assessment 110
Employment Projections & Wages Office and administrative support occupations, sales and related occupations, production
occupations and food preparation, and transportation occupations dominate Arlington’s
employment by industry with 85,000 to 100,000 jobs. By 2026, the total number of jobs is
expected to grow by 16.8 percent according to Texas Labor Market Information. Healthcare support occupations, healthcare practitioners and technical occupations,
computer and mathematical occupations, and personal care and service occupations are
expected to top all other industries in growth by year 2026. All these industries are projected
by Texas Labor Market Information to increase annually by over 2 percent. Occupation Title
Estimated Employment (2016)
Projected Employment (2026)
Change in Employment
Annualized Percent Growth
Architecture and Engineering Occupations 15,534 17,909 2,375 Arts, Design, Entertainment, Sports, and Media Occupations
12,721 14,665 1,944 1.43
Building and Grounds Cleaning and Maintenance Occupations
26,211
29,897
3,686
1.32
Business and Financial Operations Occupations 39,975 46,564 6,589 1.54 Community and Social Service Occupations 14,960 17,550 2,590 1.61 Computer and Mathematical Occupations 21,744 25,486 3,742 1.6 Construction and Extraction Occupations 44,894 54,247 9,353 1.91 Education, Training, and Library Occupations 50,054 60,351 10,297 1.89 Farming, Fishing, and Forestry Occupations 1,149 1,281 132 1.09 Food Preparation and Serving Related Occupations 85,962 102,682 16,720 1.79 Healthcare Practitioners and Technical Occupations 50,087 64,473 14,386 2.56 Healthcare Support Occupations 21,139 28,528 7,389 3.04 Installation, Maintenance, and Repair Occupations 41,228 47,339 6,111 1.39 Legal Occupations 6,135 7,313 1,178 1.77 Life, Physical, and Social Science Occupations 4,740 5,682 942 1.83 Management Occupations 36,542 43,502 6,960 1.76 Office and Administrative Support Occupations 158,267 175,931 17,664 1.06 Personal Care and Service Occupations 36,282 45,956 9,674 2.39 Production Occupations 58,305 64,283 5,978 0.98 Protective Service Occupations 19,905 22,474 2,569 1.22 Sales and Related Occupations 100,660 114,136 13,476 1.26 Transportation and Material Moving Occupations 85,069 98,226 13,157 1.45 Total, All Occupations 931,563 1,088,475 156,912 1.57
Table 61 Source Dept. of Bureau of Labor Statistics

Arlington Housing Needs Assessment 111
Arlington at Place of Employment in Top 10 Industries and Projected Growth All the top 10 industries, as determined by number of jobs, should experience growth by
2026 except for production occupations.
Projected Job Growth in Top 10 Industries
Table 62 Source: Texas Labor Market Information
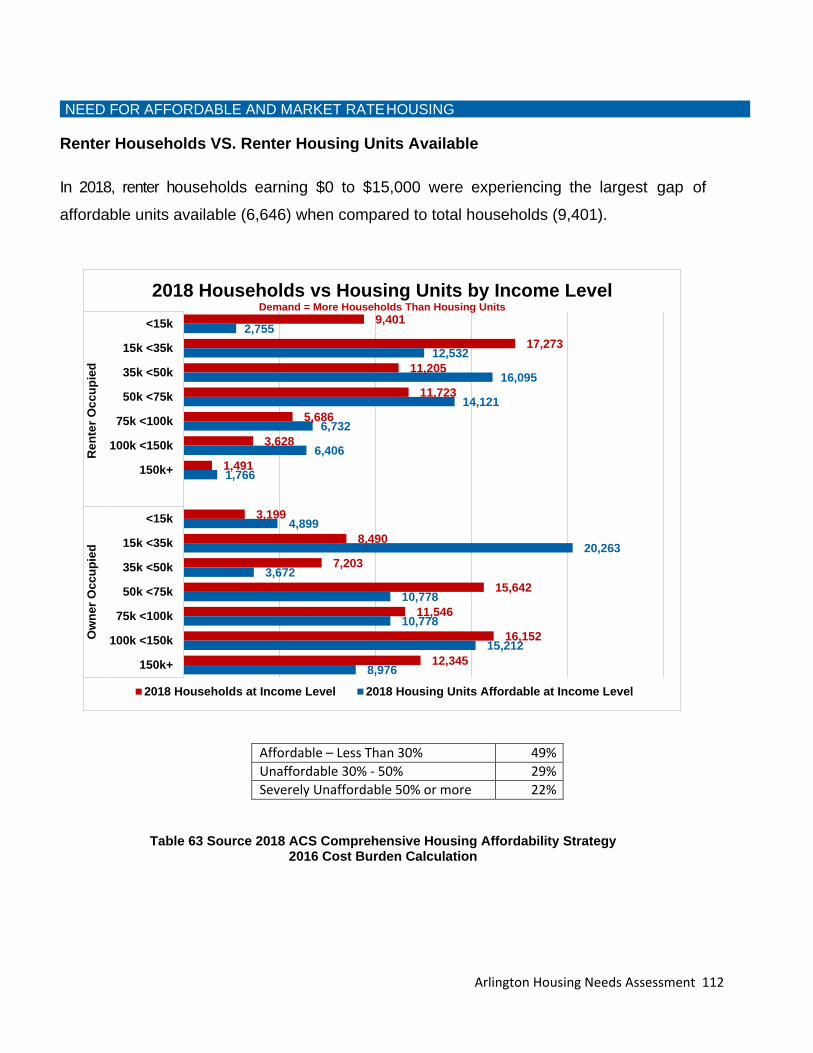
Arlington Housing Needs Assessment 112
NEED FOR AFFORDABLE AND MARKET RATE HOUSING Renter Households VS. Renter Housing Units Available
In 2018, renter households earning $0 to $15,000 were experiencing the largest gap of
affordable units available (6,646) when compared to total households (9,401).
Table 63 Source 2018 ACS Comprehensive Housing Affordability Strategy 2016 Cost Burden Calculation
9,401
17,273
11,205
11,723
5,686
3,628
1,491
3,199
8,490
7,203
15,642
11,546
16,152
12,345
2,755
12,532
16,095
14,121
6,732
6,406
1,766
4,899
20,263
3,672
10,778
10,778
15,212
8,976
<15k
15k <35k
35k <50k
50k <75k
75k <100k
100k <150k
150k+
<15k
15k <35k
35k <50k
50k <75k
75k <100k
100k <150k
150k+
Ren
ter O
ccup
ied
Ow
ner O
ccup
ied
2018 Households vs Housing Units by Income LevelDemand = More Households Than Housing Units
2018 Households at Income Level 2018 Housing Units Affordable at Income Level
Affordable – Less Than 30% 49% Unaffordable 30% - 50% 29% Severely Unaffordable 50% or more 22%

Arlington Housing Needs Assessment 113
Rent Affordability - HUD Adjusted Family Incomes Ranges and Market Rate Rents. Using HUD’s Adjusted Family Income ranges, rental units available at market rate would be
considered unaffordable to household earning income less than $32,000. According to ALN
Apartment Data, the average rent for a 1-bedroom apartment is $893, when compared to the
affordable rent rate based on household income and using HUD’s cost burden calculation
there is a cost gap of $420. Median Household Income $58,502
Income Max Income Affordable Rent Average Rent Gap/Surplus
1BED 2BED 3BED 1BED 2BED 3BED 0 - 30% HMFI $17,551 $439
$893 $1,141 $1,289
($454) ($702) ($850) 31%-50% HMFI $29,251 $731 ($162) ($410) ($558) 51%-80% HMFI $46,802 $1,170 $277 $29 ($119) 81%-100% HMFI $58,502 $1,463 $570 $322 $174 101% - 120% HMFI $70,202 $1,755 $862 $614 $466 121% or greater HMFI $70,787 $1,770 $877 $629 $481
Table 64 Source ALN Apartment Data ACS, HUD Adjusted Family Income
Table 64-A: Source 2018 ACS ALN Apartment Data ACS, HUD Adjusted Family Income
SUPPLY AND DEMAND OWNER OCCUPIED HOUSING
Incomes of Renters
Households
Affordable Income Level
Renter occupied: 60,407 Less than $5,000 2,890 2,002 $5,000 to $9,999 2,471 277 $10,000 to $14,999 4,040 476 $15,000 to $19,999 4,480 844 $20,000 to $24,999 4,121 1,720 $25,000 to $34,999 8,672 9,968 $35,000 to $49,999 11,205 16,095 $50,000 to $74,999 11,723 14,121 75k <100k 5,686 6,732 100k <150k 3,628 6,406 150k+ 1,491 1,766
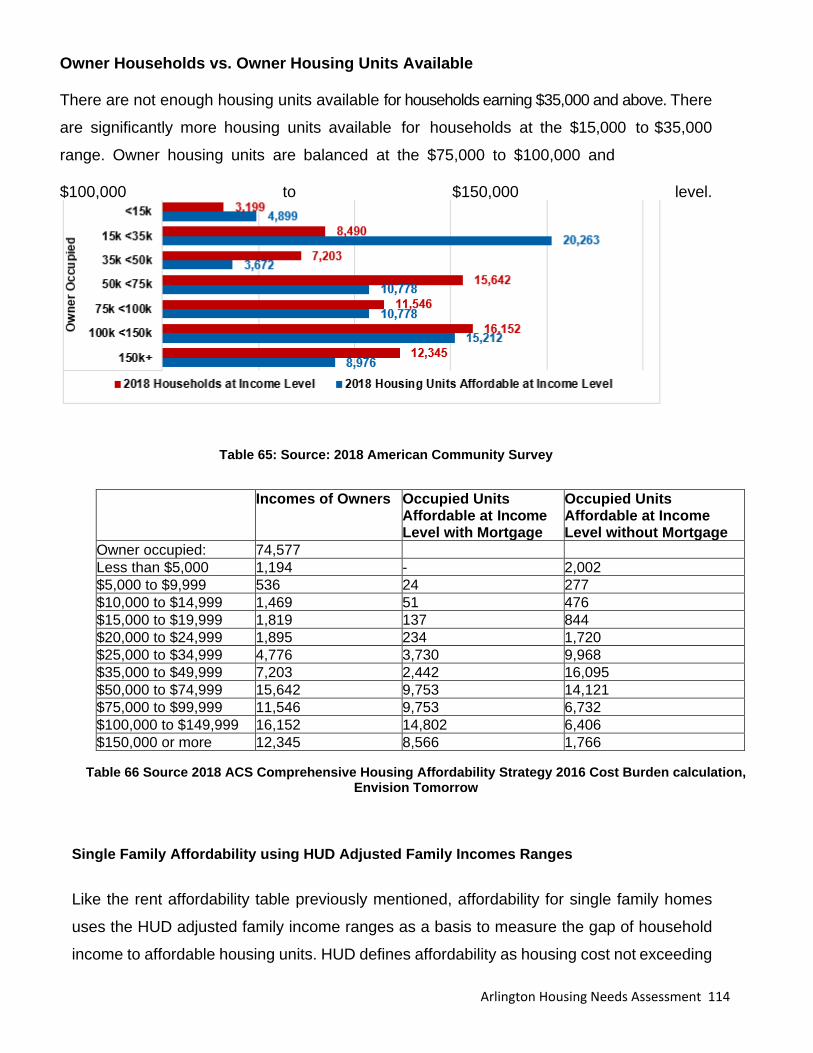
Arlington Housing Needs Assessment 114
Owner Households vs. Owner Housing Units Available There are not enough housing units available for households earning $35,000 and above. There
are significantly more housing units available for households at the $15,000 to $35,000
range. Owner housing units are balanced at the $75,000 to $100,000 and
$100,000 to $150,000 level.
Table 65: Source: 2018 American Community Survey
Table 66 Source 2018 ACS Comprehensive Housing Affordability Strategy 2016 Cost Burden calculation,
Envision Tomorrow Single Family Affordability using HUD Adjusted Family Incomes Ranges
Like the rent affordability table previously mentioned, affordability for single family homes
uses the HUD adjusted family income ranges as a basis to measure the gap of household
income to affordable housing units. HUD defines affordability as housing cost not exceeding
Incomes of Owners Occupied Units Affordable at Income Level with Mortgage
Occupied Units Affordable at Income Level without Mortgage
Owner occupied: 74,577
Less than $5,000 1,194 - 2,002 $5,000 to $9,999 536 24 277 $10,000 to $14,999 1,469 51 476 $15,000 to $19,999 1,819 137 844 $20,000 to $24,999 1,895 234 1,720 $25,000 to $34,999 4,776 3,730 9,968 $35,000 to $49,999 7,203 2,442 16,095 $50,000 to $74,999 15,642 9,753 14,121 $75,000 to $99,999 11,546 9,753 6,732 $100,000 to $149,999 16,152 14,802 6,406 $150,000 or more 12,345 8,566 1,766
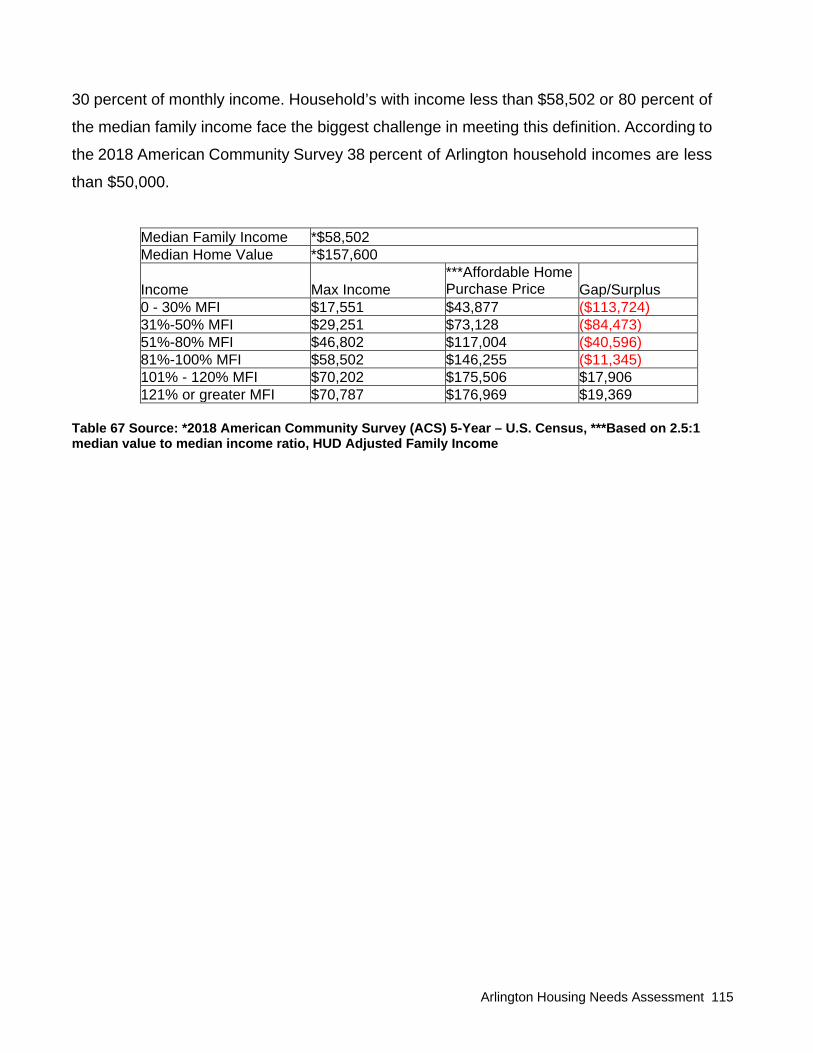
Arlington Housing Needs Assessment 115
30 percent of monthly income. Household’s with income less than $58,502 or 80 percent of
the median family income face the biggest challenge in meeting this definition. According to
the 2018 American Community Survey 38 percent of Arlington household incomes are less
than $50,000.
Median Family Income *$58,502 Median Home Value *$157,600 Income
Max Income
***Affordable Home Purchase Price
Gap/Surplus
0 - 30% MFI $17,551 $43,877 ($113,724) 31%-50% MFI $29,251 $73,128 ($84,473) 51%-80% MFI $46,802 $117,004 ($40,596) 81%-100% MFI $58,502 $146,255 ($11,345) 101% - 120% MFI $70,202 $175,506 $17,906 121% or greater MFI $70,787 $176,969 $19,369
Table 67 Source: *2018 American Community Survey (ACS) 5-Year – U.S. Census, ***Based on 2.5:1 median value to median income ratio, HUD Adjusted Family Income

Arlington Housing Needs Assessment 116
BALANCED HOUSING MODEL PROJECTION
What Are Arlington’s Housing Needs?
Arlington, also known as “The American Dream City”, has been featured in
several national and local “Best City” publications highlighting Arlington’s rapid
economic expansion, sports entertainment attractions and cultural diversity. For
these reasons, new residents are moving to Arlington making the City one of DFW
Motorplex’s’ most popular places to live. The purpose of this section is to discover
what impact Arlington’s rapid growth is having on its housing market, current
supply of housing units, and projected housing units needed in the future. The
approach used to project Arlington’s future housing needs starts with examining
the demographic and household characteristics of Arlington’s existing residents.
Step 1: Summarize Arlington’s historical, current, and projected population figures as a basis to measure the city’s future housing growth.
Arlington’s population in 2018 was 392,692, an over 9 percent increase from the
population in 2010 of 359,410. During this period, the average annual growth rate
was 1.21 percent, however, since 2014 Arlington’s population has increased
significantly by 4.6 percent, compared to 4.4 percent between 2010 and 2014, as
shown in the table below. The rapid population increase from 2014 is in correlation
with Arlington’s overall economic growth. Expect continued population growth at
1.55 percent annually meaning, 48,567 new residents are projected to move to
Arlington by 2025 for an
estimated population of
441,259. To explain it another
way, on average 6,938 new
residents annually will move to
Arlington by 2025. Tarrant
County is growing faster
annually than Arlington at 2.8
percent. Overall, Arlington is a growing city within one of the fastest growing
metropolitan areas in the United States.
359,410
375,305
392,692
340,000
350,000
360,000
370,000
380,000
390,000
400,000
2010 2011 2012 2013 2014 2015 2016 2017 2018
Population
4.4% Population Increase
from 2010 - 2014
4.6% Population Increase
from 2014 - 2018

Arlington Housing Needs Assessment 117
Step 2: Summarize Arlington’s total households and housing units to identify trends and project 2025 households.
Since 2010, Arlington has experienced tremendous economic growth and
population growth. However, the supply of housing units during this period has
remained unchanged. The table below compares the population, jobs, and
housing units since 2010. As of 2018, Arlington had a total of 146,962 housing
units, up slightly from 145,194 in 2010. Households, defined as a person or group
of persons living in a housing unit is a crucial component used to project future
housing needs. In 2018 Arlington had 134,984 households. The average
household size for Arlington in 2018 was 2.88, meaning every home contained an
average of three persons. Arlington’s 2025 household projections are determined
by dividing Arlington’s 2.88 average household size in 2018 by the 2025 projected
population of 441,259. Using the average household size for projection purposes
assumes the number will remain relatively the same through 2025. As Arlington’s
household growth continues, special attention should focus on the groups most
impacted by rising housing costs as a result of housing unit stagnation. Seniors,
elderly, and low- to moderate-income households are more vulnerable to
affordability issues over rising rents, for example. The Balanced Housing Model
assumes one housing unit per household, with every household having
access to an affordable housing unit for a housing market to be “balanced.”
359,410 392,462
145,194 146,962
181,209 198,646
2010 2011 2012 2013 2014 2015 2016 2017 2018
More People, More Jobs...Less Housing?
Population Total Housing Units Jobs
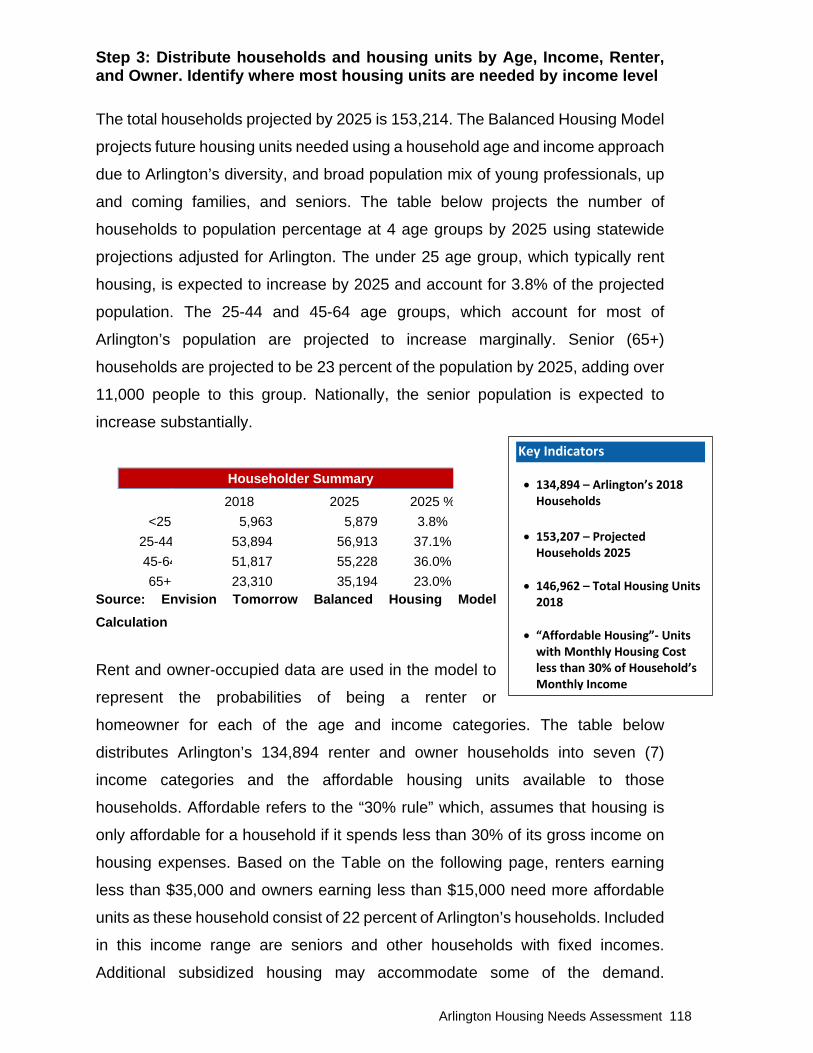
Arlington Housing Needs Assessment 118
Step 3: Distribute households and housing units by Age, Income, Renter, and Owner. Identify where most housing units are needed by income level
The total households projected by 2025 is 153,214. The Balanced Housing Model
projects future housing units needed using a household age and income approach
due to Arlington’s diversity, and broad population mix of young professionals, up
and coming families, and seniors. The table below projects the number of
households to population percentage at 4 age groups by 2025 using statewide
projections adjusted for Arlington. The under 25 age group, which typically rent
housing, is expected to increase by 2025 and account for 3.8% of the projected
population. The 25-44 and 45-64 age groups, which account for most of
Arlington’s population are projected to increase marginally. Senior (65+)
households are projected to be 23 percent of the population by 2025, adding over
11,000 people to this group. Nationally, the senior population is expected to
increase substantially.
Source: Envision Tomorrow Balanced Housing Model Calculation
Rent and owner-occupied data are used in the model to
represent the probabilities of being a renter or
homeowner for each of the age and income categories. The table below
distributes Arlington’s 134,894 renter and owner households into seven (7)
income categories and the affordable housing units available to those
households. Affordable refers to the “30% rule” which, assumes that housing is
only affordable for a household if it spends less than 30% of its gross income on
housing expenses. Based on the Table on the following page, renters earning
less than $35,000 and owners earning less than $15,000 need more affordable
units as these household consist of 22 percent of Arlington’s households. Included
in this income range are seniors and other households with fixed incomes.
Additional subsidized housing may accommodate some of the demand.
Householder Summary
2018 2025 2025 % <25 5,963 5,879 3.8%
25-44 53,894 56,913 37.1% 45-64 51,817 55,228 36.0% 65+ 23,310 35,194 23.0%
Key Indicators
• 134,894 – Arlington’s 2018 Households
• 153,207 – Projected Households 2025
• 146,962 – Total Housing Units
2018
• “Affordable Housing”- Units with Monthly Housing Cost less than 30% of Household’s Monthly Income

Arlington Housing Needs Assessment 119
Additionally, there are income ranges with more housings units than households
representing a surplus. Absorption of surplus units by other income ranges may
reduce the gap of housing at those income levels. Note: income range with more households than housing units indicates a demand
for more housing units.
Step 4: Use the Population and Household data from the 3 previous sections to project the number of housing units Arlington needs at each income level to meet the demand by 2025 and 2030.
The 2025 total housing demand is based on the actual income distribution of the
Arlington’s residents. With this in mind, we add the total Projected Units at 30%
Income level for 2025 at all 7 income levels (160,974) and the total units needed to
Replace Obsolete Units (2,908) and subtracted the 2018 total Occupied Housing
Units Affordable at 30% of Income (134,984) for a total housing need of 28,898. It
is expected that some of these units will likely be absorbed by the households with
income ranges between $15,000 to $50,000 and $100,000 to $150,000 which are
showing 7,494 more existing housing units than projected housing units, otherwise
9,401
17,273
11,205
11,723
5,686
3,628
1,491
3,199
8,490
7,203
15,642
11,546
16,152
12,345
2,755
12,532
16,095
14,121
6,732
6,406
1,766
4,899
20,263
3,672
10,778
10,778
15,212
8,976
<15k
15k <35k
35k <50k
50k <75k
75k <100k
100k <150k
150k+
<15k
15k <35k
35k <50k
50k <75k
75k <100k
100k <150k
150k+
Ren
ter O
ccup
ied
Ow
ner O
ccup
ied
2018 Households vs Housing Units by Income LevelDemand = More Households Than Housing Units
2018 Households at Income Level 2018 Housing Units Affordable at Income Level

Arlington Housing Needs Assessment 120
known as a surplus. By subtracting the housing unit surplus amount of 7,494 from
the total housing units’ need of 28,898, the adjusted total of housing units needed
is 21,404 by 2025.
The surplus assumes that existing supply is partially utilized or consumed entirely
by existing and new households before the new population demands more new
units based on a ratio of one new unit for each new household. The model assumes
that future housing needs will be heavily influenced by population growth and
consumption by income ranges may fluctuate based on preferences regardless of
income range.
Total Housing Needs 2025
Income Category – Column 1 The seven categories used to distribute households and housing unit projections.
2018 Total Units Within Affordable Price Range (Supply) – Column 2 Arlington’s 134,984 total occupied (owner/renter) housing units distributed by
income category in 2018 and 11,978 vacant units equaling 146,962 total housing
units per ACS.

Arlington Housing Needs Assessment 121
2018 Arlington Households (Demand) – Column 3 Arlington’s existing 2018 total households of 134,984 distributed by income
categories.
Surplus/Gap within Affordable Price Range – Column 4 The difference of housing units (column 2) and households (column 3) distributed
by income category. A gap indicates fewer housing units than households and a
surplus indicate more housing units than households.
2025 Projected Arlington Households (Demand) – Column 5 Arlington’s 2025 projected households (demand) of 153,207 in need of housing
units distribute by income category.
2025 Projected Total Units Within Affordable Price Range (Supply) – Column 6 2025 projected total housing units of 163,882 are the total housing units needed
to accommodate the needs of 153,207 projected households. The 163,882 total
units were determined by combining the projected renter housing units of 77,790
and owner housing units of 83,184. Additionally, 6,619 renter vacant units and
1,148 owner vacant units are added using Arlington’s 2018 renter vacancy rate of
9.3 and owner vacancy rate of 1.4. Lastly, rental replacement units of 1,403 and
owner replacement units of 1,505 are added using a replacement of 1.8 percent.
The Balanced Housing Model includes vacancy and replacement rate to housing
projections to simulate normal housing turnover conditions.
Units Needed to Replace Obsolete Stock – Column 7 Total replacement units of 2,908 are the total of 1,403 renter replacement units
and 1,505 owner replacement units. Replacement units are housing units needed
to replace existing units considered obsolete or unmarketable.
2025 Projected Total Housing Units Needed to Meet Demand – Column 8 Represents the difference in Arlington’s 2018 total units of 134,984 within
affordable price range (supply) – Column 2 and 2025 projected total units of
163,882 within affordable price range (supply) Column 6 distributed by income
category.

Arlington Housing Needs Assessment 122
Housing Surplus (Additional Units Beyond Projected Need) – Column 9 The number of 2018 renter and owner housing units exceeding the number of
2025 projected renter and owner housing units by income category for a total
housing surplus of 7,494.
2025 Arlington Total Housing Need – Column – 10 The complete projected total housing units needed to accommodate 153,207
households is 21,404, which is determined by subtracting Arlington’s 2018 actual
occupied housing units of 134,984 from the 2025 projected total housing units of
163,882 and housing surplus of 7,494.
Rental Housing Projections 2025
Table 68 Source: American Community Survey 2018, Texas Demographic Center, Envision Tomorrow

Arlington Housing Needs Assessment 123
Owner Housing Projections 2025
Table 69 - Source: American Community Survey 2018, Texas Demographic Center, Envision Tomorrow
Senior Total Housing Projections 2025
Table 70 – Source: American Community Survey 2018, Texas Demographic Center, Envision Tomorrow

Arlington Housing Needs Assessment 124
Senior Renter Housing Projections 2025
Table 71 - Source: American Community Survey 2018, Texas Demographic Center, Envision Tomorrow
Senior Owner Housing Projections 2025
Table 72 – Source: American Community Survey 2018, Texas Demographic Center, Envision
Tomorrow When reviewing Arlington’s housing demand numbers, keep in mind the projections
assume the character of Arlington in terms of income dispersal among its residents
will not change significantly between 2018 through 2030. Additionally, the projected
demand numbers, which are based on household income, may overstate the
number of low and moderate-income units needed for three key reasons:
• Seniors with assets but low annual incomes which may be living in homes fully
paid for. Seniors may be living in homes they could not otherwise afford if they
had to purchase it today.

Arlington Housing Needs Assessment 125
• Households paying more than 30% of its income on housing to live in each
community as these households may feel the added housing cost is worth the
benefit of living in the community.
• Households may double up in a housing unit so they
can afford to live in a desirable community. There
are a variety of moving parts within any given
housing market that will affect the demand for
housing, some predictable and some not used in the
Balanced Housing Model.
Again, it is important to note that in Arlington, there are
income ranges with more existing housing units than
projected housing units representing a potential surplus. Absorption of surplus units
by other income ranges may reduce the gap of housing at those income levels.
Note: The Balanced Housing Model projects 28,898 units by 2025. While the
Model’s formula considers vacancy rates and other factors in calculating future
housing needs, it does net out the 7,494 more existing housing units than projected
housing units, otherwise known as a surplus, that exist currently. By subtracting the
housing unit surplus of 7,494 from the total housing units needed of 28,898, the
adjusted total of housing units needed is 21,404 by 2025. The surplus assumes that
existing supply is partially utilized or consumed entirely by existing households
before considering new population demands for more new units based on a ratio of
one new unit for each new household. The model assumes future consumption of
existing units will continue at its’ current rate based on current consumption
characteristics and future housing needs heavily influenced by population growth.
Consumption is expected to fluctuate based on preferences regardless of income
range. This means that the surplus may have some impact on the projected number
of units needed, but not expected to create a one for one decrease in projected
units based on population and household growth.
Key Indicators in the Balanced Housing Model
• Age • Income • Vacancy Rate Renter/Own • Household Growth Rates • Obsolescence Rate
(Replacement) • Future Construction • Affordability Ranges and
Tenure • Unit size

Arlington Housing Needs Assessment 126
Housing Projections by Bedroom Size
Projecting the number of housing units needed by bedroom size was determined by distributing
the 163,882 projected units by the average of Arlington’s bedroom allocation percentages from
2010 to 2018 using the American Community Survey (ACS) 5-Year data. Since there has been
marginal changes in bedroom size allocation since 2010, the projections assume the changes will
remain marginal.
2…
18%
42%
20%
16%
2%
% Housing Units Projected by Bedroom Size
5 or more bedrooms4 bedrooms3 bedrooms2 bedrooms1 bedroomNo bedroom
Housing Units by Bedroom Size
% Housing Units by Bedroom Size
No bedroom 449 2%
1 bedroom 3,375 16%
2 bedrooms 4,388 21%
3 bedrooms 8,883 42%
4 bedrooms 3,846 42%
5 bedrooms 464 2%
Total 21,404 100%

Arlington Housing Needs Assessment 127
Housing Projections Summary
By 2025, Arlington projects a need of 28,898 total renter and owner housing units combined, however, 7,494 surplus units reduces this need to 21,404.
Renter households earning between $0 - $35,000 project the most units needed of any income category as this group has a 2018 housing shortage of 11,387 units.
By 2025, Owner households in the $15,000 to $35,000 income category project a surplus of 4,427 housing units. These units may be aborbed by households in other income categories.

Arlington Housing Needs Assessment 128
Balanced Housing Model Projections for Housing Units Needed by Income 2025
By 2025, seniors will grow from 17 percent of all households in 2018 to 23 percent of all households, the largest growth of any age group.
The renter income category needing the most housing units is the $15,000 to $35,000 category which currently has a deficit of 1,198 housing units.
By 2025, Seniors project a need for 11,917 units, represtiong 56 percent of Arlington's total housing need fo 21,404 units.

Arlington Housing Needs Assessment 129
Housing Projections by Type: ESRI Tapestry data and National Residential Preference Surveys
ESRI Tapestry market research data was used to identify groups of market
segments comprising the largest percentages of each community’s population
today. The largest LifeMode groups were summarized for Arlington. As noted earlier,
ESRI data is useful in helping the City understand and take advantage of the types
of housing and neighborhoods preferred by these groups. JQUAD also used the
LifeMode characteristics to approximate each LifeMode group’s current housing
type preference, and their propensity for living in a compact or non-traditional
neighborhood in the future.
Table 73 Source: ESRI Tapestry Segmentation
Young and Restless21%
Home Improvement19%
Up and Coming Families
14%
NeWest Residents
13%
Old and Newcomers10%
Savvy Suburbanites
8%
American Dreamers8%
Metro Fusion7%

Arlington Housing Needs Assessment 130
A Balanced Housing Profile for City of Arlington in 2025 Occupied
Housing Supply City of Arlington (2018)
Future Total Units (includes new units, rehabbed vacant units, and vacancy (2018-2025)
Future Incremental Units (includes new units, rehabbed vacant units, and vacancy (2018-2025)
Future Incremental Units % (2018-2025)
Single Family 84,793
93,883
9,532
66%
Standard Large Lot SF 61,871
66,967
5,225
36%
Small Lot SF 22,922
26,915
4,306
30%
Townhome 4,524
5,992
1,662
11%
Multifamily 44,176
46,635
3,338
23%
Mobile Home/Other 2,374
2,374
-
0%
Table 74 Source: Envision Tomorrow, Balanced Housing Model
Several recent national surveys on residential preference were analyzed and
incorporated into the City’s projections. These surveys were compiled by the
University of Utah’s Dr. Arthur C. Nelson in The New California Dream: How
Demographic and Economic Trends May Shape the Housing Market. The summary
of the nation’s estimated future demand is shown below.
National Trends Average National
Housing Stock 2011 (AHS) ◊
RCLCO 2020 National
Demand (2008)
Average Future National Demand
Chris Nelson 2025 National
Demand ◊ Single Family 63% 62% 62% 62% Standard and Large Lot SF
45% 25% 25% 25%
Small Lot SF 17% 37% 37% 37% Townhome 6% 11% 13% 15% Multifamily 25% 27% 25% 23% Mobile Home/Other
7% 0% 0% 0%
Table 75 Source Dr. Arthur C. Nelson, Urban Land Institute, December 2011; Nelson
(2006); RCLCO (2008); U.S. Census Bureau (2010)

Arlington Housing Needs Assessment 131
Introduction The recommendations and strategies presented in this section are intended to address
housing needs emerging from the housing market, demographic, economic and
trends analyses. Recommendations were refined based on interviews, focus
group sessions and surveys. The strategies and recommendations are based on four fundamental principles.
First, the recommendations are based on broad strategies that collectively address
a wide range of physical, financial, development, economic, quality of life, policy and
regulatory issues that potentially impact future housing needs. Quantitative data
collected from national, federal, state, and local sources and qualitative data
gathered from community input of residents, industry, businesses, and other
stakeholders, provided the basis for the recommendations reported in this section.
The recommendations focus on diverse types of housing development strategies
needed to achieve future housing projections ranging from creating new
development consistent with emerging development patterns in areas experiencing
various levels of growth, increasing reinvestment, reversing decline and
disinvestment, and strategies creating a greater infusion of resources to help
reverse decline and to support sustainability.
Second the HNA addresses needed improvements to the community’s basic
attributes of a clean and safe community, adequate delivery of government services,
convenient access to quality retail and commercial services, development of
affordable housing, recreation for all age groups, effective regulatory enforcement,
and programmatic enhancements that ensure a reasonable quality of life for
residents.
Third, the HNA identifies strategies aimed at ensuring future housing needs are met
and recommends increased resources that can be dedicated to maintaining existing
housing through innovative programming. This includes partnerships between
government, business, industry, and community with emphasis on cultivating and
expanding community support.
SECTION 6: RECOMMENDATIONS AND STRATEGIES

Arlington Housing Needs Assessment 132
Fourth, the HNA emphasizes that implementers and policy makers directing the
implementation process and enacting housing policies make tough decisions
relative to resource targeting, leveraging of resources, and the priorities and
timelines associated with each recommendation outlined in the overall HNA.
Finally, the disparity between resource availability and existing needs, dictate that
careful planning and consensus building be at the forefront of implementation to
ensure that priority is given to the most critical issues facing the City of Arlington.
These fundamental principles serve as a starting point for launching the
implementation of the HNA. Implementation of strategies in response to key issues
may require additional customization to address the specific needs in Arlington.
Some actions and recommendations are a conceptual framework for addressing
future housing needs and include prototypical best practice examples demonstrating
how other communities have dealt with similar issues. Therefore, some
recommendations will require further research, analysis, and final program design
by the City of Arlington for implementation.
Background
Arlington is now the third largest jurisdiction in the DFW Metropolitan Statistical
Area (MSA) and is no longer considered one of the smaller suburban towns in
the middle of the MSA. The current population of Arlington is over 392,462 and
is projected to grow to 441,259 by 2025. The City’s economic base is diverse
and receives national attention because of its professional sports teams and
tourist attractions. The City, home to institutions of higher education including
the University of Texas at Arlington, is experiencing record growth with 43,939
students enrolled in the spring semester of 2019 according to the Texas Higher
Education Coordinating Board. Arlington’s job growth is increasing, but at a
slower rate in comparison to other communities in the area. Arlington’s job
growth was 2.7% for 2018 compared to a DFW MSA average of 3.2%. These
growth trends are noteworthy since job growth and population are two of the
most significant factors influencing housing needs. Arlington faces similar
concerns that other metropolitan area face, transportation, growth management,
environmental issues, sustainability, as well as providing a range of housing

Arlington Housing Needs Assessment 133
alternatives for its residents. In determining future housing needs, a number of
factors driving current and projected housing needs in Arlington were
considered. Some trends differ from national trends.
Demographic Characteristics - The demographic characteristics of the
population is a major factor influencing future housing needs. Seniors are the
fastest growing segment of the population and likewise are expected to account
for a substantial portion of the projected housing units needed by 2025. The
Texas Demographic Center projected a 116% percent increase in senior population
from 2010 to 2030 - by far the fastest growing group among all age ranges. Naturally
as the population increase so will the number of households headed by a senior over
65 indicating the need for future housing units to accommodate the demand. The
substantial growth can be seen in Arlington as senior households increased from
16,722 in 2010 to 23,310 in 2018.
Arlington’s to ta l population is a lso expected to grow, however , that growth
is not expected to follow national trends. The number of baby boomers, seniors,
and millennials may, grow as expected, but other age groups are not expected to
increase as significantly as in other areas of the country. The millennial generation
is expected to grow at a slower pace than in comparable jurisdictions, resulting
in not only fewer of them, but also fewer children. The housing needs of seniors
and millennials, the two largest growth groups, will be similar in that both the
baby boomers and millennials will likely seek smaller housing units, throughout
the community, near amenities, families, and friends. There is the potential for
higher density and mixed-use development near work, shopping, and
entertainment. The need for rental units will likely be significant, particularly for
millennials and seniors who face economic/income challenges.
Millennials’ housing preferences are expected to change over time, with some
seeking larger single-family units in a suburban setting once they begin having
families. The larger suburban home is also more likely to appeal to recent immigrants
who often prefer to reside in areas near ethnic or cultural groups and they often seek
larger housing units for larger or extended families. Thus, the market for larger single-
family units will continue, though perhaps at a lower rate in Arlington. Based on price
point, many are likely to seek existing housing in established and revitalizing

Arlington Housing Needs Assessment 134
neighborhoods but will demand updated amenities in areas showing signs of
revitalization. Areas such as central Arlington and NRSA neighborhoods could
become a primary source of affordable housing for rental and homeownership for
households earning less than $50,000 per year.
Income and Job Growth - In addition to population growth, demographics,
household characteristics, and housing preferences among seniors and
millennials, jobs and income levels will influence housing needs and the types of
housing being sought. Arlington has a broad and solid economic base. Office and
administrative support occupations, sales and related occupations, production, food
preparation, and transportation dominate Arlington’s employment industry with
85,000 to 100,000 jobs each By 2026, the total number of jobs in these industries
are expected to grow by 16.8 percent, accounting for 45 percent of total jobs
according to the Texas Labor Market Information. Healthcare support occupations,
healthcare practitioners, technical occupations, computer and mathematical
occupations, personal care, and service occupations are expected to top all other
industries in growth by year 2026. According to the Texas Labor Market, all
occupations mentioned above are projected to increase annually by over 2 percent.
Despite job growth, wages are not keeping pace with housing affordability.
Currently, the per capita earnings for employed persons in Arlington is $27,513
and median household income is $58,502. Approximately 26 percent of
households earn less than $35,000 and 38 percent earn less than $50,000. By
HUD definition, 37 percent of Arlington households are considered low- and
moderate- income earning 80 percent or less of the median income and
approximately 48 percent of renter and 20 percent of owner households currently
are cost burdened paying more than 30 percent of their income for housing.
Wages and income remain somewhat stagnant and economists are not certain
when the economy will show significant vitality and increased per capita wage
earnings that keep pace with housing cost. The job growth anticipated by the
Texas Workforce Commission indicates that the fastest growing jobs and those
jobs with the largest increase in number will be predominantly low-paying
positions. Affordability will continue to be an important consideration in
developing housing.
Arlington Housing Needs Assessment 135
Housing Needs and Transportation - The HNA is not intended to address
transportation issues directly, however, transportation limitations should be
considered in developing strategies for meeting future housing needs. Arlington
has a significant location advantage in the M e t r o p o l i t a n S t a t i s t i c a l
A r e a ( MSA), yet it lacks a public transportation system, connecting
neighborhoods within the city or connecting Arlington to other parts of the MSA.
Approximately 62.5 percent of Arlington residents commute to work outside the city
and not all persons working in the City reside in Arlington. We suggest that planning
and implementation of the HNA and projected housing needs including new
higher density housing development be conscious of the need for public
transportation and that development be designed to accommodate and take
advantage of public transportation in the future. Most often planning for future
growth and meeting housing needs are guided by transportation availability. In
Arlington, the reverse appears to be the case. Transportation should be
considered when addressing the needs of existing residential, employment, and
shopping/amenity development.
The Center for Neighborhood Technology (CNT) developed the Housing and
Transportation Affordability Index (H+T Index) which measures housing and
transportation costs and sets the benchmark at no more than 45 percent of
household income. The traditional measure of affordability recommends that
housing cost no more than 30% of household income. The H+T Index for
Arlington using American Community Survey (ACS) and Longitudinal Employer-
Household Dynamics data is 45 percent which suggest the need to monitor if
transportation is negatively influencing housing affordability in the future.
Housing Needs and Affordability - The housing market analysis revealed
significant affordability gaps in both ownership and rental units. The housing supply
and demand analysis for owner units in the City shows significant gaps in the supply
within the price range of all household income categories except for moderate-
income households. Affordability within the extremely low and very-low household
income categories are normal, as ownership opportunities within these lower income
levels is cost prohibitive. However, the large gap in the supply of owner units, when
compared to demand within some upper household income price ranges
($75,000 to $150,000) is significant and points to the general unavailability of owner

Arlington Housing Needs Assessment 136
units in the City to accommodate the price points and housing preferences of
households earning greater than 121 percent of Median Family Income (MFI).
The housing supply and demand analysis for renter units in the City shows a
significant gap in the supply of affordable renter units for extremely low households,
but sizeable gaps also within the price ranges of “moderate” and “upper” household
income categories. The median income of renter households in 2018 was $39,592
with 26 percent of households experiencing cost burden (30% or more) and 23
percent experiencing severe cost burdened (50% or more). The largest proportion
of rental units in Arlington were 1-bedroom units with an average rental rate of $893,
followed by 2-bedroom units with an average rental rate of $1,141. Using the
standard 30 percent method of determining housing affordability, the annual
household income needed to afford a 2-bedroom rental apartment in Arlington is
about $59,003, which is above the median household income of renters of $39,592.
Rehabilitation of Existing Housing – Rehabilitation of existing housing and
vacant lot infill housing development continues to be the most effective method
of preserving the City’s aging housing stock which constitutes a large portion
of Arlington’s affordable housing supply. HNA data and anecdotal information
from focus group attendees, persons interviewed during the research process,
as well as members of the real estate community indicate that many of the units
built during the period of rapid growth in the 1970s and 1980s now require
significant rehabilitation having suffered from poor quality construction and/or
experiencing issues resulting from deferred maintenance and lack of updates.
This can include wiring, plumbing, insulation, and foundation work in addition to
maintenance of roofs, windows, and painting, which are all necessary for the
preservation of older structures.
Furthermore, the data for multi-family subsidized units revealed that 21.1 percent
of s u b s i d i z e d units were constructed between 1964 and 1970, while 14.0
percent were built between 1975 and 1979. Another 19.5 percent were built
between 1980 and 1987. Thus, 54.6 percent of the City’s subsidized units are 25
years old or older. The potential need for rehabilitation to maintain existing
subsidized housing stock is significant, and such projects must be weighed against
the cost benefit of further investment to improve the structure for the owner and
the consumer.

Arlington Housing Needs Assessment 137
The housing needs of special needs populations, including seniors, millennials,
and individuals with low-moderate income, were considered in developing
housing recommendations and strategies. According to the 2014 - 2018 ACS, the
population of seniors over 65 has significantly increased from 32,814 in 2014 to
40,101 in 2018, a 32.4 percent change. This population is expected to increase
2025. Those between the ages of 19 to 34 years, were 24.8 percent of total
population in 2018. The number of persons with disabilities is also expected to
increase as the population grows, particularly among the elderly and frail elderly,
where growth will be significant over the next fifteen years. The evaluation of
housing values, monthly cost and yearly incomes compared to market values
suggest homeownership for households earning $35,000 or less annually is
challenging. Approximately $35,760 in household income is needed to afford a
mortgage of $100,000 and 26 percent of the 2018 population earned $35,000 or
less.
Concentrated Poverty, Income, Assisted - Subsidized Housing and Neighborhood Sustainability - Stabilization and sustainability of existing housing
and neighborhoods are important factors in addressing future housing needs.
Approximately 51 percent of the housing stock in Arlington was built between 1970
and 1989. Homebuilding since 2010 decreased to 1.9 percent. With a higher number
of homes built prior to 1990, it is reasonable to assume housing stock is more likely
in need of repairs and updates given its age. Housing stock 30 years and older have
a longer period for the effects of deferred routine maintenance to negatively impact
housing condition. While age does not always indicate diminished housing condition,
correlations exist. Higher income areas with older but higher priced housing tend to
have less correlation between age of housing and condition of housing than lower
income areas. Neighborhood covenants and homeowner associations which are
generally associated with higher cost housing also contribute to stability. Some
housing, neighborhoods, and commercial corridors conditions, particularly in central
Arlington, demonstrate the impact of disinvestment in areas more than others. There
is also a correlation between concentrated poverty, race, ethnicity, public and
assisted housing, and areas of decline.
The U. S. Department of Housing and Urban Development (HUD) has defined
“Areas of Poverty, Racial and Ethnic Concentration and Segregation (R-ECAP) – as
Arlington Housing Needs Assessment 138
areas or census tracts within a jurisdiction comprised of 50% or greater minority
population, three (3) times or more the poverty level of the Metropolitan Statistical Area
(MSA), and generally lacking basic amenities and failing to provide a quality of life
expected and desired for any area within the MSA.
The goal of de-concentration is to achieve minority concentrations and poverty level
less than defined above by R-ECAP and to transform these areas of concentration
into “opportunity areas”. Opportunity areas are characterized as offering access to
quality goods and services, exemplary schools, health care, range of housing,
transportation to employment and service centers, adequate public infrastructure,
utilities, and recreation. Census tracts, 122200, 122300, 122400, 121905 and
121903 are designated R/ECAP areas and are highlighted in the HNA.

Arlington Housing Needs Assessment 139
Recommendation
The following are recommendations for meeting the future housing needs in
Arlington based on the HNA and the Balanced Housing Model housing projections.
Recommendations include a range of options relative to housing development and
finance, policy, and regulatory changes. Best practices for implementing
recommendations are included in the strategies for addressing future housing
needs.
Restoring the “Basic Attributes” of Existing Housing and Neighborhoods Success in meeting future housing needs, developing housing that is affordable to a
wide range of consumers, and stimulating revitalization and reinvestment in existing
areas must include addressing needed improvements to the community’s basic
attributes. These attributes include public safety, street maintenance, clean streets,
timely infrastructure improvements, trash collection, brush collection, well
maintained buildings, keeping vacant lots regularly mowed and free of debris,
regular yard maintenance, and having a good, general neighborhood appearance
and level of community involvement that suggests that people care about their
community. Public schools must continue to demonstrate academic programming
and student achievement c om p a r a b l e to that of surrounding school districts,
and the public’s perception of the quality of their schools must validate that
comparison. Residents must feel safe in their homes and confident they can conduct
their daily routines in the neighborhood without being victimized by crime. These
basic attributes tend to shape both the way a community sees itself and how non-
residents entering the community view it as well. In an effort to achieve the goal of
improved basic attributes, the following are proposed strategies and
recommendations identified for Arlington and prototypical examples of their
application to specific areas that may also be applied throughout the City, as
appropriate.
o Enhance community’s image, identity, and physical attributes
o Deconcentrate poverty, race-ethnicity, and public and assisted housing
o Define area destination and purpose
o Reclaim vacant lots for residential development

Arlington Housing Needs Assessment 140
o Improve neighborhood identity, marketing, and branding
o Improve neighborhood image and physical attributes
o Create new mixed-use development and mixed housing types
o Improve access to recreation, retail, and desired destinations
o Enhance gateway and corridor improvements
o Introduce new residential types and financing for housing development that
increase affordability
Housing for Senior and Disabled Persons
According to the 2014 - 2018 ACS, the population of seniors over 65 has significantly
increased from 32,814 in 2014 to 40,101 in 2018, a 32.4 percent change. Seniors
between the ages of 65 - 74 represent 63 percent of the senior population, seniors
between the ages of 75 - 84 represent 27 percent, and seniors above the age of 85
represent 10 percent of the senior population. The overall senior populations
account for 10.9 percent of Arlington’s total population. According to 2014 – 2018
ACS data, when comparing growth among senior households to other age groups,
senior-headed households have substantially increased from 16,676 in 2010 to
23,310 in 2018. Non-senior headed households decreased during the same period,
but at a lower rate.
The Texas Demographic Center projects a 116% increase in senior population from
2010 to 2030, by far the fastest growing group among all age ranges. Naturally as
the population increase so will the number of households headed by seniors over
65 indicating the need for future housing units to accommodate their increased
demand for housing. An estimated 4,989 (21%) of seniors are renters and 18,321
(79%) are owners. Additionally, 68 percent of senior households are spending more
than 30 percent of their monthly income on rental cost, an increase from 62% in
2010. Senior (65+) households are projected to be 26 percent of total households
by 2025, adding over 14,000 people to this group. Senior housing preferences are
changing demonstrating a shift from the single-family housing where they raised a
family to smaller cluster homes, condominiums, multi-family rental, and active senior
developments depending on income and equity in larger homes no longer needed,

Arlington Housing Needs Assessment 141
and the need to reduce maintenance and other cost associated with remaining in
older larger homes. The Balanced Housing Model forecasts a needed increase of
21,404 total households by 2025 and projects seniors (65 and older) will account for
56 percent (11,917) of needed units projected. The types of housing recommended
for seniors and strategies for addressing future housing needs will be discussed
below.
Cottage Housing - Many elderly homeowners find themselves over-housed once
their children leave home or following the death of a spouse or family member who
once shared the cost of housing. Cottage or ‘cluster housing’, as it is often referred,
, provides a smaller unit as a homeownership option or as an alternative to continuing
ownership of a larger unit that essentially over-houses or has become too costly to
maintain. It should also be considered a viable alternative to a grant-funded major
rehabilitation if the elderly applicant is living in unsafe conditions and the
rehabilitation costs exceed the projected value of the completed structure. There
may also be applicants who, as a result of limited funding, wait years for assistance
because their application is near the end of a long rehabilitation program wait list. Of
those applicants, some may be unable to continue maintaining the home and paying
operating costs after receiving the rehabilitation grant and would therefore find
themselves in need of future grants. Cottage housing could also be an option for
addressing the needs of elderly homeowners seeking more appropriately sized and
cost-effective rental or owner housing. The major objection to moving into
smaller units for many seniors in these circumstances is losing familiar
surroundings and social networks.
One possibility in addressing these concerns is to develop a program that supports
small neighborhood cottage or cluster housing developments, preferably on vacant
and/or redevelopment parcels, built in or near existing neighborhoods. The sale of
a senior’s exist ing home would enable them to utilize available equity from
that sale to buy a cluster unit. Those with limited equity could apply for a grant as
part of the City’s homebuyer program to purchase the unit in lieu of applying for a
grant to renovate their existing home. Recommended Funding: City of Arlington
CDBG and HOME programs. Recommended Areas: City-wide with an emphasis on
older neighborhoods affordable to low-moderate income households including
Central Arlington, East Arlington and designated NRSAs.

Arlington Housing Needs Assessment 142
The Program Objectives:
• Construct developments of 8 to 12 housing units, formulated built in a cluster
housing configuration, typically 800 to 1200 square feet with common walls;
similar to those e walls found in duplex construction. Identify senior household
participants for the purchase of a cottage home. Prospective buyers who
either currently own their home, with or without a mortgage, and who are over-
housed, may be willing to purchase a cottage, could sell their existing home
at market value. Seniors who currently rent could also be eligible as first-time
home buyers.
• Facilitate the existing home sale and the purchase of the cottage unit by
the eligible senior using the equity from the sale of their existing home.
• Offer a v a i l a b l e federal or state grants t o cover the difference between
a v a i l a b l e equity and market value of the unit, if necessary.
• Like market rate subdivisions, sponsorship could include homeowner
association dues paid by owners to provide maintenance of the cottage
community, partially funded through homeowner dues and the non-profit/civic
organization’s maintenance fund.
• Providing first time homebuyer funding in the form of principle reduction,
down payment and/or, closing cost assistance, and funding for renovation
cost in conjunction with private mortgage financing could enhance approval
rates among low-to-moderate income families looking to purchase housing
sold by a senior household.

Arlington Housing Needs Assessment 143
Intergenerational and Shared Housing for the Elderly – Intergenerational or
shared housing provides a shared residence that houses a single elderly adult or
senior who shares the unit with an unrelated single adult or a single parent with
dependent children. They become a structured family unit, sharing common areas
such as kitchen and living room, and having their own private bedroom with private
or semi-private bath.
The purpose of intergenerational housing is to provide longer term transitional
housing to the individual and families needing supportive services and special
assistance as they identify and secure permanent housing. The program is generally
sponsored by non-profit agencies, community development corporations, religious
institutions, and others utilizing a variety of funding sources ranging from federal
CDBG funding to foundation grants. Some programs operate as homeless housing,
receiving funding under the HUD Super NOFA/Supportive Housing Grant Program
and McKinney Act Funding. The concept is to provide housing and a safety network
of supportive services that offer opportunities to improve education, job training,
employment placement, social and economic status so that clients may regain self-
sufficiency and return to long-term rental or homeownership housing.
Through support service networks and partnerships, efforts are made to offer
daycare, mental health counseling, and life skills training. In some instances, older
residents provide childcare for the working single parent and in return are supported
by the single adult with support for shopping and other needs. This program strives
to provide a living environment for older adult clients and single parent families that
will enable them to develop an alternative “family” network for self-help and
independent living.
In some instances, the sponsoring agency provides staff supervision of the group
residence to assure maintenance, sanitation, and safety. Staff are generally
responsible for the delivery of case management regarding screening new
applicants and placing exiting residents in a more permanent living situation.
Everyday household chores are the responsibility of each resident. Contractual
services, networking relationships, and volunteers are available to assist the
residents throughout their stay in counseling, budgeting, programming, and other
special needs.

Arlington Housing Needs Assessment 144
Eligible Program Participants:
Elderly adults and single-parent families who are homeless, at risk of becoming
homeless, or who have income constraints preventing them from acquiring housing
without shared cost or subsidies are eligible. Typically, applicants are restricted to
persons seeking affordable temporary housing options, but not rehabilitation or
substance abuse services.
Residents must be self-sufficient in their own lifestyles and promote a self-help, self-
care independent living environment.
Heads of household of single parent families must be 21 years or older.
Children of the single parent family must not exceed the ages of 10 for boys and 12
for girls, when accepted into the program and the adult participants are same sex.
Typically, the residence is modeled to assist the individual/family through a
transitional period in their life and should not exceed 18 – 24 months.
Typical Services:
• Case-management to assist with immediate personal/family crisis.
• Provision of groceries, clothing, personal toiletries, medicines, and
transportation.
• Educational and training classes in nutrition, personal hygiene, and first aid.
• Access to employment placement, job training, and other resources.
• Tutorial assistance to school-age children and adults enrolled in classes.
• Budgeting and financial management classes.
• Assistance in securing permanent housing placement.
• Daycare services provided by social service agencies or by the elderly
resident.
• Mental health counseling (individual/family) referrals.
Program Participant Cost:
Recommend cost-sharing by residents of $100.00 or 30% of their income, whichever
is less, per month to be collected by the sponsoring agency. Single-parent families
must be employed, employable, or attending school. The older adult may volunteer

Arlington Housing Needs Assessment 145
or work, if social security or other sources of income are inadequate to meet the
minimum rental cost.
Recommended Funding: City of Arlington’s CDBG and HOME programs, private
funding, foundation or non-profit sponsorship, HUD Super NOFA/Supportive
Housing Grant Program, McKinney Act funding, and churches and philanthropic
organizations. Recommended Areas: City-wide with an emphasis on commercial
corridors and mixed-use development areas conveniently located with access to
public transportation and services needed by low- to moderate-income households.
Grand Families Public Housing Development – Grandparents raising their
grandchildren become a responsibility for many middle aged and senior households.
In recognition of this growing responsibility, public housing authorities and HUD are
working to provide housing that specifically supports those families who find
themselves in this situation and in need of subsidized housing. We recommend
the Arlington Housing Authority explore HUD funding for Grand Families Public or
Assisted Housing in conjunction with non-profit, religious, and philanthropic
organizations. An example of this program is Pemberton Park, located in Kansas
City. Pemberton Park Grand Family Homes opened in 2011 and was developed by
the Kansas City Housing Authority in partnership with Cougar Capital. It is the first development of its kind in Kansas City and was specifically designed to
serve grandparents, age 55 and older, who are raising their grandchildren and have
legal guardianship of them. The apartment community’s location, design, and
supportive services were refined us ing grandparent focus groups and features a
playground, large community room, grandparents lounge, computer learning center,
craft room, and social work office. Pemberton Park has 36 two-, three-, and four-
bedroom apartments, with units that are fully accessible or adaptable for those with
disabilities. Apartments are fully equipped with all appliances, including a full-sized
washer and dryer. Staffing includes a service coordinator who organizes programs
and activities
Recommended Funding: HOME program, LIHTC funding or new market tax
credits. Recommended Areas: City-wide with an emphasis on commercial corridors
and mixed-use development areas conveniently located with access to public

Arlington Housing Needs Assessment 146
transportation and services needed by low-moderate income households.
Senior Housing/Tax Credit Financing – The Housing Tax Credit (HTC) Program
operated by the Texas Department of Housing and Community Affairs is one of the
primary means of directing private capital toward the development and preservation
of affordable rental housing for low-income households. The Competitive (9%) tax
credits are awarded to eligible participant developers once a year and provide a
source of equity financing for the development of affordable housing. Investors in
qualified affordable multi-family residential developments can use the HTCs as a
dollar-for-dollar reduction of federal income tax liability. The value associated with
the HTCs allows housing to be leased to qualified families at below market rate rents.
The Non-Competitive (4%) Housing Tax Credit program receives applications year-
round and HTCs are coupled with the TDHCA Multi-family Bond Program when the
bonds finance at least 50% of the cost of land and buildings in the development.
There are a variety of State HTC programs from which to select, with some
limitations on the location of the development.
Arlington has been successful in attracting both LIHTC and Senior Tax Credit
developments. Some existing commercial buildings in Arlington are marginal or
non-contributing asset to the community’s well-being and could be adaptively reused
as housing for seniors. Their proximity to various senior services and commercial
goods and services make these buildings an attractive prospect for adaptive re-use
as senior housing. Vacant land is also available. According to the 2018 American
Community Survey (ACS) data, the median household income for Arlington was
$58,502. Both LIHTC and Senior Tax Credit developments typically are rent
restricted to persons and households earning no more than 60 percent of the
median income which was $37,854 in 2018. Senior renter households were 6,419
of total senior households in 2018. Approximately 41.8 percent (2,689) earned
$35,000 or more and 27.8 percent (1,790) earned $50,000 or more in household
income potentially disqualifying them for tax credit restricted units. We therefore
recommend Arlington support tax credit developments that provide a mix of units,
offering both market rate and tax credit supported units that meet the needs of
seniors earning greater than 60 percent of median income. This may require
financing developments in part with private debt or non-tax credit generated equity,
including the use of CDBG and HOME funds that allow persons earning 80 percent

Arlington Housing Needs Assessment 147
of median income to rent units.
55+ and Active Seniors’ Housing Development – The Dallas/Fort Worth/
Arlington Metropolitan Statistical Area (MSA) has been successful in attracting 55+
active senior housing developments. This housing type is primarily a private sector
development product requiring very little to no government subsidy at all. Seniors /
active adults with household incomes and the financial means are choosing 55+
active adult communities as an option to meet their housing needs. This housing
product recognizes that senior owners are exchanging larger, older existing homes,
for housing in communities that combine world-class resort amenities with new
luxury homes that meet their changing needs and preferences. Communities with
amenities such as: golf courses, club house facilities, activities, health clubs,
classes & social opportunities that allow them to enjoy an exceptional lifestyle.
Seniors who can afford housing in such developments prefer a home they can
personalize and that to suits their lifestyle of having the flexibility to create the living
space and life of their dreams.
In 2018, according to the 2014 – 2018 ACS 5-year average, seniors age 65 and
older, were 17 percent (23,310) of total households. Of those 73 percent (17,040)
were homeowners. The ACS also estimated approximately 30 percent (3,107) of
total senior household have incomes of $75,000 or more, not including equity in
existing homes, investments, and other resources. The median income of senior
households in 2018 was $52,308. Households with that earning potential could
conceivably afford a home priced at $240,000 or more if the buyer were obtaining a
mortgage for the total sales price. Based on the Balanced Housing Model, senior
owner households age 65 and older demand is expected to increase another 5,285
units by 2025. The median housing value according to 2018 American Community
Survey (ACS) in Arlington was $188,800. According to the Arlington Board of
Realtors, the average sales price for the 3rd quarter ending September 2019 was
$239,052. The 55+ active senior product is mostly accessible to seniors with
incomes above $50,000. This product could meet some of the projected need, given
the number of seniors who owned their home in 2018, as well as those with income
sufficient to afford senior housing, combined with the projected 2025 increase. We
therefore recommend that Arlington market these factors to perspective developers
of 55+ senior housing.

Arlington Housing Needs Assessment 148
Rehabilitation of Existing Residential Structures – Increased financing is needed
for the rehabilitation of existing residential structures in marginal or poor condition,
and to build replacement units on vacant lots. Existing residential is an essential
component of the supply of single-family affordable housing for both home
ownership and rental. The need for infill housing on vacant lots and rehabilitation of
existing multi-family housing is evident in the Fuller Street Corridor and
neighborhood.
Arlington currently operates several programs designed to assist existing low-
moderate income households with improving their properties and low-moderate
income households in becoming homeowners. Other programs are designed to
assist rental housing providers with maintaining existing rental units. Those programs
appear to be successful but have limited funding. The City should explore coupling
funding to CHDO and non-profit organizations for development, with tax abatement,
building and permitting abatement, as well as utilizing PID and TIFS to pay for
infrastructure. The recommendations in this section also identify Economic
Development 4B funding that can be used to support infill housing development.
Arlington Homebuyer’s Assistance Program (AHAP) - The Arlington
Homebuyers’ Assistance Program (AHAP) provides down payment and closing cost
assistance to low income, first-time homebuyers. Down payment and closing cost
assistance are provided in the form of a forgivable loan of up to $20,000 based on
each applicant’s underwriting and subsidy layering assessment. Additionally, the
program is restricted to households earning less than 80 percent of the area median
income. In 2018, AHAP assisted 6 families with the purchase of a new home.

Arlington Housing Needs Assessment 149
Housing Rehabilitation Program - Housing Rehabilitation Repair grants provide low-income homeowners with a one-
time, interest-free, forgivable loan of up to $24,500. The loan is used to bring
properties into compliance with local City codes, and primarily addresses repairs
such as the electrical, heating, and plumbing systems. A 5-year lien is placed on the
home and the loan is forgiven at a rate of 1.67% monthly. Removal of lien is then
requested once the 5-year affordability period has been met. Under this program in
2018, a total of 64 low-income households received housing rehabilitation
assistance.
Architectural Barrier Removal Grant Architectural Barrier Removal Grants assist low-income, disabled individuals and
families with housing modifications to allow for greater mobility. The improvements
may include, but are not limited to installation of ramps, safety rails or widening of
doorways. The number of households assisted by this program for 2018 was 10.
Housing Finance Mortgage Credit Certificate Program – The City of Arlington
currently operates the Mortgage Credit Certificate program, a federal income tax
credit program that allows first time homebuyers to take a federal income tax credit
equity of up to 30% of their annual interest paid on the home, up to a maximum of
$2,000 per year. It is recommended that the City continue this program.
Non-Profit Owned Renter-Occupied Housing Rehabilitation in Designated Target Areas - The City’s Housing Rehabilitation Program helps non-profit
organizations rehabilitate single-family or duplex rental properties located in a
designated target area. The tenant must be low-income and must reside in the
property at the time the application is processed. For low-income tenants, the City
of Arlington will fund 100 percent of the eligible repairs up to $24,500. It is
recommended that the City continue this program.
Housing for Younger Demographics - Esri's Tapestry Segmentation ‘Young and
Restless’ - Esri's Tapestry Segmentation is a geodemographic system that identifies
68 distinctive markets in the U.S. based on socioeconomic and demographic

Arlington Housing Needs Assessment 150
characteristics to provide an accurate, comprehensive profile of U.S. consumers.
These segments are then combined into one of 12 LifeMode groups. Segments and
groups are assigned to neighborhoods by sorting more than 60 attributes including
income, employment, home value, housing type, education, household composition,
age, and other key determinants of consumer behavior. The dominant LifeMode
group and market segment in Arlington is Midtown Singles, or ‘Young and Restless.’
With a homeownership rate of 13 percent, the ‘Young and Restless’ segment is more
likely to favor renting. This market segment ranks among the top 5 for renters,
movers, those enrolled in college, and those in the labor force. About 1 in 5 move
each year. More than half of all householders in this category are under the age of
35, and the majority live alone or in shared non-family dwellings. Their median
household income is still below the national average, smartphones are a way of life,
and they use the Internet extensively. ‘Young and Restless’ consumers are diverse,
favoring densely populated neighborhoods in large metropolitan areas. Over 50%
are located in the South; of those, one-fifth live in Texas. ESRI data is useful in
helping Arlington understand and take advantage of the types of housing and
neighborhoods preferred. For Arlington, there appears to be a preference for rental
housing, with amenities and located in mixed use, downtown and near entertainment
districts.
Texas Economic Development 4A and 4B Funding in Support of Homeownership – While younger demographics currently have a homeownership
rate of 13 percent, they are expected to favor homeownership as they age, marry,
or have families. Many will still prefer rental housing located in mixed use districts,
entertainment districts and in and around downtown. The Arlington Downtown Plan
and Neighborhood Revitalization Strategy Area Plan creates a transformation vision
for revitalization of the downtown and target areas through reinvestment in housing,
infrastructure, and economic development. The City of Port Arthur, Texas Downtown
Plan which began in 2016 and was completed in 2018 outlines a strategic plan for
development of 30 to 60 new housing units over the next 3 - 6 years utilizing Port
Arthur Economic Development Corporation (PAEDC) Section 4A and 4B Financing
as well as City of Port Arthur Community Development Block Grant (CDBG) and
Home Investment Partnership Fund (HOME) grants designed to leverage private
investment. This housing development initiative serves as a catalyst to attract
additional private sector investment in housing, business, and commercial
Arlington Housing Needs Assessment 151
development, thereby creating jobs, economic opportunity and sustainable
neighborhoods in the target area and surrounding neighborhoods. Approximately 40
units were either complete, under construction, or in the site development stage as
of 2019.
The Development Corporation Act of 1979 gives cities the ability to finance new and
expanded business enterprises in their local communities through economic
development corporations (EDCs). Chapters 501, 504 and 505 of the Local
Government Code outline the characteristics of Type A and Type B economic
development corporations, which authorize cities to adopt a sales tax to fund the
corporations and define projects EDCs can undertake. Type A Economic
Development Corporations are typically created to fund industrial development
projects such as business infrastructure, manufacturing and research and
development. Type A EDC’s can also fund military base realignment, job training
classes and public transportation. Type B economic development corporations can
fund all projects eligible under Type A, as well as parks, museums, sports facilities,
and affordable housing. However, Type B Economic Development Corporations are
subject to more administrative restrictions than Type A including limitations on how
sales tax revenues can be used to fund a project. Eligible expenditures include:
• acquisition of land;
• machinery and equipment;
• construction costs;
• planning and professional services related to the project;
• financial transactions and reserve funds; and
• administrative and other necessary expenditures
Arlington could utilize Type B funding to support housing development affordable to
person up to 120 percent of median income. In May 2016, Port Arthur, Texas citizens
approved an Affordable Housing Ballot Proposition which allows Port Arthur
Economic Development Corporation (PAEDC) Economic Development 4B funds to
be used to implement an affordable housing program in downtown Port Arthur,
Texas. The program is designed to assist citizens of Port Arthur with obtaining
housing in the downtown area and to assist developers building new single-family
dwellings. The boundaries must be consistent with the proposition. The Port Arthur
Affordable Housing Proposition commenced on October 1, 2016 and extending

Arlington Housing Needs Assessment 152
until September 30, 2019, and stated that the PAEDC shall utilize funding allocated
under the existing Section 4B (Type A Economic Development Corporation) Sales
and Use Tax within the City of Port Arthur for the cost of land, buildings, equipment,
facilities, and improvements found by the City of Port Arthur Section 4B Economic
Development Corporation Board of Directors to be required or suitable for the
promotion of development and expansion of affordable housing, as described by 42
U. S.C. 12745. Affordable Housing Development is a category of projects under
Section 505. 153 of the Local Government Code (Type 4B Economic Development
Corporation) with the condition it will be limited to single family dwellings and the
total annual spending by the City of Port Arthur Section 4A Economic Development
Corporation will not exceed $900,000 roughly ($30,000 for 30 homes). This period
of time can and will likely be extended an additional three (3) years by the City
Council which requires two thirds (2/3) vote once Council reviews public comment
on the proposed cost and impact of the project.
The City approved the use of land bank lots resulting from a HUD funded
Neighborhood Stabilization Grant (NSP) and CDBG funding to leverage 4B funding.
This allows subsidies for down payments and principle reductions up to $30,000 to
households at 80 percent of median or below using CDBG, and up to $30,000 to
households at 120 percent of median or below using 4B funds. New homes being
developed are at an average cost of $165,000. The City should consider 4B funding
for affordable housing in Central Arlington, downtown, and in designated NRSA
districts combined with CDBG funding.
Financial Literacy - Initial considerations when attempting to increase
homeownership rates should include improving financial literacy and home buying
preparedness of potential buyers. Homebuyer counseling programs work with
buyers to address their creditworthiness and help them work through any issues
that may interfere with their ability to qualify for a home mortgage. Banks and credit
agencies will work with buyers to educate them on their maintenance responsibilities
as homeowners. Homebuyer education classes are a pre-requisite for homebuyer
assistance programs providing down payment assistance. Programs typically work
with buyers to address their creditworthiness and to help them correct any credit
issues that may interfere with their ability to qualify for a home mortgage. The 18 to
35-year-old demographic is impacted by financial literacy even more. A well-ordered
personal budget enables homebuyers to qualify for the best credit terms in major

Arlington Housing Needs Assessment 153
purchases and eliminates major obstacles to loan origination. An early start in
managing personal finances can prepare an individual for those major purchases.
The City should consider working with local school districts to increase courses that
provide financial literacy education for high school juniors and seniors. Local
lending institutions and real estate professionals should be recruited to assist in
curriculum development and to provide instructors for the classes. The City may
consider working with school districts to identify funding for pilot programs.
Opportunity Zones - The Federal Opportunity Zone Program is a community and
economic development tool that aims to drive long-term private investment into low-
income communities throughout the country. The program was established by
Congress in the Tax Cuts and Jobs Act of 2017 and encourages investors with
recently realized capital gains to invest in local businesses, real estate, or
development projects in exchange for a reduction in their tax obligations. There are
areas in the City of Arlington designated by the Governor to be a part of this program.
The program incentivizes investors to make equity investments in Opportunity Zone-
based businesses and development projects by providing:
• A temporary tax deferral for any realized, but not recognized, capital gains
reinvested through the program (the “Original Gain”);
• The potential for a 10% to 15% reduction in the amount of tax otherwise
payable on the Original Gain;
• Receipt of a permanent exclusion of any capital gains derived from the eventual sale or exchange of the Opportunity Zone investment (not the Original Gain), if the investment is held for ten years or more
The designated Opportunity Zones for Arlington include Downtown and Central
Arlington, and areas designated for future growth and revitalization. While the
regulations are not yet finalized, it appears the Opportunity Zones could provide a
source of equity for housing and economic development initiatives like tax credit
equity generated by LIHTC. This is of added importance due to Arlington’s older
residential and commercial areas, as well as a shift toward diversification of mixed
income and mixed housing types, will require unrestricted equity that doesn’t rely
on concentrations of low-moderate income persons in current R-ECAP Areas.
It is essential that Arlington continue to develop alternative approaches for utilizing
the Opportunity Zone designation to generate reinvestment dollars for

Arlington Housing Needs Assessment 154
neighborhoods suffering decline and areas such as downtown that appear most
marketable to younger demographics and those seeking more affordable housing.
College Student Housing – College housing for students, off-campus, and on-
campus, is not directly addressed in the HNA. However, student housing presents a
unique challenge for Arlington which is home to the University of Texas Arlington.
The most recent student housing report detailing existing inventory of on and off-
campus housing was completed in 2013. At that time, residence halls provided
housing for 2,180 students which has since increased to 2,382 as of 2019 according
to University’s Division of Student Affairs. The number of on-campus apartment units
available provided housing to 2,109 students as of 2013. According to the 2018
Arlington Downtown Master Plan, 7,565 students were housed in Arlington and the
plan projects 8,123 students will be housed by 2023 and 8,723 housed by 2028.
This assumes the University’s enrollment rate remains constant at 28 percent and
projects a growing need for housing for students off- campus and on. The trend
among universities is to partner with private developers to produce housing suitable
for students near the university. An example is the University of Texas at Austin
(UT) and the area known as West Campus. Developers are producing rental units
designed to support student lifestyles for those desiring off-campus housing. Rental
communities offer countless benefits for students who choose to live alone and away
from the dormitory lifestyle or those wanting to co-rent with other student’s off-
campus. Students value their own space and desire a place to concentrate and study
free from distractions. Off-campus apartments meet their financial need for housing
which is generally in the $895 range. West Campus housing offer a variety of
amenities and floor plans including studios up to four bedrooms, for single living and
units that can easily be shared by roommates. While these accommodations are
perfect for students, they are also ideal for non-students starting a new job,
relocating, divorced, or just wanting to be close to the university and live
in apartments near downtown. In Arlington, units should be encouraged near UTA.
Some opportunities include replacing obsolete development with this type of housing
model along commercial corridors and in downtown or near sports and
entertainment districts in locations accessible to the nightlife, entertainment, and

Arlington Housing Needs Assessment 155
popular destinations. We therefore recommend that the City work with UTA and
other institutions to identify developers and opportunities to partner to meet the
needs of a growing student population, while generating developer interest in
revitalizing areas of the City. This model can also help lessen the impact of student
consumption of affordable housing that is needed to accommodate income ranges
in need of affordable rental units.
New Market Housing Tax Credits - The New Markets Tax Credit Program (NMTC
Program) was established by Congress in 2000 to spur new or increased
investments into operating businesses and real estate projects located in low-
income communities. The NMTC Program attracts investment capital to low-income
communities by permitting individual and corporate investors to receive a tax credit
in exchange for making equity investments in specialized financial institutions called
Community Development Entities (CDEs). The credit totals 39 percent of the original
investment amount and is claimed over a period of seven years five percent for each
of the first three years, and six percent for each of the remaining four years. The
investment in the CDE cannot be redeemed before the end of the seven-year period.
In order to spur organic growth within the organization, and to supply additional
financing products to its market, Housing Channel, an Arlington Community Housing
Development Organization (CHDO) was recently awarded NMTCs for an affordable
housing development in East Arlington, and the City should continue to encourage
its partnership with developer to spur more housing affordable.
Changes in City Regulation, Policies, Development Incentives
Zoning Regulations and Development Incentives - Regulatory options include
revisions to regulations ensuring land uses compatibility and development options;
zoning code and subdivision regulations that codify changes to support sustainability
and resiliency. The City of Arlington has adopted building and code enforcement
regulations, and local officials must continue to aggressively address substandard
housing conditions, abandoned or obsolete commercial structures, and adverse
land use that are contributing to the decay of the area. Developer incentives may be
needed to encourage the development of a mix of housing types, affordable to

Arlington Housing Needs Assessment 156
persons with diverse incomes and needs. Recommendations include consideration
of enacting regulations for incentivized zoning, and city incentives for tax
abatement, development subsidies and a variety of programs funding with federal
entitlement funds to encourage housing development.

Arlington Housing Needs Assessment 157
Inclusionary Zoning - Inclusionary Zoning (IZ) refers to a set of strategies that aim
to create balanced housing development and mixed-income communities by
ensuring that some portion of new housing development is affordable. This strategy
may be appropriate to encourage a mix of incomes in the City of Arlington where
development may create neighborhoods of homogenous home prices and residents
of similar incomes. Mixed-income communities broaden access to services and
jobs, as well as provide openings through which lower-wage earning families can
buy homes in appreciating housing markets and accumulate wealth. Inclusionary
Zoning policies can be voluntary or mandatory. Austin, Texas is an example of a
city with a voluntary inclusionary zoning policy implemented through its Safe, Mixed-
Income, and Reasonably Priced housing program. The program provides fee
waivers and other incentives on a sliding scale according to the share of affordable
units included in new developments. Perhaps the best know example of a
mandatory inclusionary zoning policy is that of Montgomery County, Maryland,
which was enacted in 1974. The policy requires developments of more than 50 units
to include 15 percent moderately priced dwelling units. Of that, two-thirds (15%) are
sold to moderate-income first-time homebuyers and the remainder can be
purchased by the local housing commission or local non-profits for use in their
affordable rental programs.
In 2019, the City of Austin approved a plan to increase the amount of affordable
housing by loosening zoning restrictions and providing incentives for higher
densities in affordable and mixed-income developments. The City hopes to make
more housing available to residents for whom the cost of living in Austin is becoming
out of reach. Affordability Unlocked, a density bonus program, aims to cut through
barriers in the City’s land development code that can make building of affordable
and multi-family housing difficult, if not impossible, by waiving many requirements
as well as granting incentives in exchange for building housing that meets the
program’s criteria. As a baseline, 50 percent of housing in a development must be
affordable. That means rentals must be priced for families earning 60 percent or less
of median family income for the area, with some required at 50 percent of MFI.
Home-buying prices must be affordable at 80 percent of MFI and below. If their
projects meet baseline criteria, those offering deeper affordability could earn
additional site privileges (essentially amounting to bonuses that increase density and
thus total rentable or saleable space), including height increases above a zoning

Arlington Housing Needs Assessment 158
district’s current limits. Local programs can structure the density bonus and
affordability requirements to fit local needs.
A companion to the Inclusionary Zoning regulations would be to establish a local
housing trust fund. The Housing Trust Fund operates similarly to the federal
entitlement grant programs providing funding to achieve affordability in other
developments that benefit low-moderate income persons. The State of Texas
provides competitive grants to support local housing trust funds as well.
Developers could alternatively satisfy the creation of a portion of the required
Inclusionary Zoning (IZ) affordable units by making a payment in lieu to the trust
fund and the City would utilize trust fund dollars as leverage for CDBG and
HOME program funded housing initiatives.
Continue to Expand Crime Prevention Through Environmental Design (CPTED) – one of the issues identified was the need to address crime and the
perception of crime older neighborhoods and along commercial corridors. The HNA
recommends a collaboration between Law Enforcement, neighborhood residents,
commercial and institutional interest examining ways to improve crime prevention,
safety, and the perception of crime in area along major commercial corridors
including Collins, Cooper, and Center Street. CPTED is based on the premise that "The proper design and effective use of the
built environment can lead to a reduction in the fear of crime and incidence of crime,
and to an improvement in quality of life." CPTED strategies are ideal for law
enforcement officers, city planners, city managers, mayors and city council,
architects and developers, security consultants, educators or anyone involved in
designing neighborhoods, schools, downtowns, buildings, or revitalization efforts. It
is an effective way of fighting crime and promoting business. Example of what types
of activities or regulatory changes could be used or offered in the implementation of
CPTED programs is listed below:
• Improved signage, reduce barriers;
• Enhanced fencing and landscaping that does not compromise security'
• Improved lighting for safety;
• Development review by city officials of new multi-family development;
• Traffic and signals, crosswalks and protected crossings;

Arlington Housing Needs Assessment 159
• Gated entry for residential subdivisions and multi-family developments; and
• Limited access points in and out of multi-family developments.
Low Income Tax Credit Policies and Regulations – Currently federally assisted
housing and LIHTC assisted developments are predominately located in
areas/census tracts where minority populations are concentrated and in areas of
concentrated poverty, lower incomes, and areas of poor housing conditions as
defined by HUD’s definition of concentrated Racial and Ethnic, Poverty and Low
Income (R-ECAP). The fair market rents approved for the Section 8 Housing Choice
Voucher program while in theory was intended to support housing choice are
resulting in voucher holders being largely concentration in these same areas. The
areas surrounding the federally assisted housing developments are largely
concentrated by with minority persons based on race-ethnicity and lower income
persons and exhibit advanced signs of disinvestment and poor housing and living
conditions. The need for de-concentration makes revitalization which is aimed at
reversing these conditions a high priority. Recommendations include the City of
Arlington taking the following actions:
• Request HUD funding for Choice Neighborhood Program Implementation;
• Request HUD funding for Neighborhood Revitalization in R/ECAP areas and
new housing development and investment in Opportunity Areas;
• Request HUD provide funding to Incentivize Landlord Participation in Section
8 Voucher Program; and fund After School Learning Centers and Adult
Literacy Programs in privately owned multi-family housing development; and
• Request HUD funding to improve and renovate obsolete public housing and
to assist surrounding property owners to improve the condition of their
properties.
Zoning and Development Incentives – Incentives are needed to encourage the
development of a mix of housing types, affordable to persons with diverse incomes
and needs. Recommendations include incentivized zoning, tax abatement,
development subsidies and a variety of programs funding with federal entitlement
funds.
Arlington Housing Needs Assessment 160
Mixed-Income Infill - Incentives for mixed-income infill housing development may
be appropriate as a part of the overall strategy to rebuild older neighborhoods and
replace demolished homes and vacant lots, and substandard housing, particularly
in neighborhoods identified as “Declining” or “Neighborhoods in Transition.” Many
of the Declining and In Transition Areas have vacant lots available for
redevelopment. Lower income and older neighborhoods which are otherwise strong
may see an immediate benefit if the vacant lot or vacant house on a block is replaced
with a new home. This type of development, known as infill housing development
places new housing on scattered vacant or underutilized lots in established
neighborhoods or in an area within a neighborhood which has previously been left
undeveloped.
Development Incentives - The needs assessment advocates for mixed-income
housing development, housing development which does not necessarily focus
exclusively on affordability for low to moderate-income persons at 80% or below the
median income. Rather, mixed-income infill looks to create a broader range of infill
housing types and values affordable to persons 80 to 120 percent of median and
market rate buyers and renters. This type of development does not necessarily
mean a one-for-one replacement of residential stock currently being built on vacant
lots, but typically accommodates higher densities and different housing options,
including townhome and duplex development, cluster housing, cottage housing and
assisted / independent living for the elderly where appropriate.
Generating Developer Interest - Developers may be hesitant to initiate an infill
project if their experience in the area is limited. A training and outreach program or
seminar on infill development, showcasing incentives for this type of development
including opportunities for City government to donation or subsidized pricing on tax
foreclosure or adjudicated properties, may provide developers with the tools to start
infill activities. Identification of infill priority areas and creating a list of available infill
sites could be undertaken as well. This list showing potential infill sites could be
accessed by developers searchable on the government websites. Reducing Development Costs – The City should examine the reduction or waving
of development fees for infill and subdivision development. Often vacant lots are
difficult to develop because doing so involves a lengthier review and approval
process not associated with other developments. This process may involve
Arlington Housing Needs Assessment 161
variances from setbacks and other restrictions which may be granted. Changes to
regulatory requirements can make the process more streamlined and efficient. One
way to reduce development costs may include ‘fast-tracking’ permitting and
variance processes for infill status projects. Developing one lot is more costly than
developing several contiguous lots. One strategy includes creating a public land
assembly and land write-down program to generate larger impacts than piecemeal
development. It is recommended the City examine the appropriateness of financial
assistance to spur development through loan guarantees, tax abatements, and
below-market financing using state and federal funding for affordable housing. Generating Market Awareness - An infill housing or subdivision development
strategy will be less likely to be successful if no one is aware of it. Consider a
publicity campaign targeting builders, real estate professionals, and lenders,
encouraging them to take advantage of government development incentives
available through the city or state. Provide development incentives though planning,
zoning, and permitting offices, and distribute materials explaining programs through
builder associations and the boards of realtors. Minimize opposition for lenders to
finance housing development which they may be unfamiliar with by providing
information on successful projects. A “Parade of Homes” event offering tours of
housing recently built sponsored by the local government in conjunction with
developers, non-profit / CHDO developers, realtors and private home builders may
be appropriate. This recommendation could be combined with other strategies
including the Economic Development 4B initiative, and affordable housing finance
and homebuyer initiatives.
Land Use Compatibility is an issue in older residential areas and could adversely
impact future housing development and reinvestment in these neighborhoods.
These areas had a variety of problems which included:
• Commercial adjacency / buffering between residential neighborhoods;
• Multi-family adjacency to single family residential;
• Vacant lots and residential structures along arterials; and
• Development along corridors that form the buffers, boundaries or transition
for Residential neighborhoods or other developed land use areas

Arlington Housing Needs Assessment 162
Housing and Neighborhood Conditions A major discussion during the analysis phase of needs assessment was the general
state of existing housing and neighborhoods. Some areas exemplified single-family
housing conditions that were substandard, requiring major repairs, but some area
housing needed only minor repair. Areas where housing required minor repair were
characterized as needing classification schemes associated with the “stable”, and
the “in transition” approach primarily due to the high concentrations of structures in
need of minor repair which evidenced a lack of routine maintenance. The analysis
considered the income concentrations in areas and the correlation between lower
income and areas identified as declining, in transition, and deterioration.
As discussed in the land use compatibility issue, there are non-viable portions of
planning areas and arguably some entire neighborhoods that are candidates for
transition from residential to nonresidential uses strictly based on planning
principles, advanced signs of transition or the degree of neighborhood decline.
However, the historical and cultural presence, resident input, and issues associated
with replacement housing for those who would be displaced must be considered.
Other areas identified as declining and in transition were also areas with high
numbers of renter-occupied single-family homes, and multi-family units in poor
condition. Strategies to facilitate rehabilitation are discussed in the regulatory
compliance and code enforcement.
Land Acquisition and Land Bank Program - An aggressive land banking
program is recommended to allow the City to revitalize blighted neighborhoods and
create infill housing. A land bank is a public authority created to efficiently hold,
manage, and develop tax-foreclosed property. Land Banks act as a legal and
financial mechanism to transform vacant, abandoned and tax-foreclosed property
back to productive use. The Land Bank concept involves acquiring unproductive,
vacant, and developable lots for affordable single-family housing development. The
Land Bank helps reduce unproductive expenditures and increase local government
revenues. Cities establish certain criteria for acquiring properties and for properties
to be considered for Land Bank use. These criteria include: 1) the property must
owe five years or more in back taxes; 2) the total taxes and liens must be greater
than the value of the property; 3) the purchaser must demonstrate the financial
ability to immediately develop the property for affordable housing. The Land Bank
Arlington Housing Needs Assessment 163
generally acquires the foreclosure properties from the Sheriff’s Sale, maintains the
properties and assembles parcels for sale to for-profit and non-profit developers.
Land Bank properties are sometimes acquired as donations by property owners,
purchases from owners willing to sale property at reduced prices, and as surplus
City or County-owned land deemed no longer needed for public purpose. The
strategy section provides an illustration of a land bank program.
The Land Bank Program could include the following:
• Land Transfer Program - The City should evaluate, design, and implement of
a residential land bank and acquire eligible tax foreclosed, abandoned,
surplus or vacant properties. For-profit and non-profit groups would have an
opportunity to develop affordable housing by acquiring land bank properties
from the City's inventory. The City would receive vacant lots because of
property tax foreclosure, acquisitions, or donations and would sale some
properties to eligible non-profit groups at a below market price for the
development of affordable housing. The City could evaluate extending this
opportunity to sale land bank properties to for profit organizations for the
development of affordable housing at or below market price.
• Release of Non-Tax Liens - The City could provide for the release of non-
tax municipal liens on privately held property in exchange for the development of affordable housing by the owner. Interested parties must apply for consideration and agree to pay the delinquent taxes, penalties, and interest on the property. This would include fines resulting from code enforcement issues and liens that have resulted from demolition of substandard structures.
• Residential Development Acquisition Loan Program - Provides for direct
City acquisition or loans for developer acquisition of vacant or improved
properties for affordable housing development through rehabilitation or
demolition and new construction. The City could use CDBG and HOME or
apply for Section 108 Loan Guarantee funding to capitalize the loan funds and
pay program administrative cost.

Arlington Housing Needs Assessment 164
• Infrastructure and Incentive Program – The City could provide incentives
for developers to build affordable and mixed-income housing areas in need of
public intervention to prompt the market. These incentives could include cost
participation funding for infrastructure to support development of affordable
single-family housing within new mixed-income subdivisions of 50 or more
units. The jurisdiction could apply for Section 108 Loan Guarantee funding to
participate in the cost of onsite infrastructure normally paid for by the
developer. Other incentives could include fee rebates for platting, zoning, and
permitting.
• Land Assembly - Land acquisition and land assembly aim to produce
contiguous parcels for redevelopment. Often the plans of organizations involved in redevelopment are not coordinated and work is done in a piecemeal, less cost- effective manner. Redevelopment plans are often stymied by difficulties in acquiring critical parcels or acreage to make a project feasible. The jurisdictions may consider a program with land assembly having
responsibility for receiving and maintaining property for future redevelopment in the target areas.
• Area Improvement Plans - The H o u s i n g Needs Assessment
recommends parallel efforts where the area(s) develop individual goals and
objectives for improvement components of the Plan. The jurisdictions will
identify public/private partnership opportunities for implementing various
housing and neighborhood plan recommendations. These range from litter
pickup to specific contractual relationships with entities that are involved in
housing rehabilitation or development. The area improvement plan identifies
improvements needed. Area Improvement Plans include physical
improvements to support reinvestment such as urban design amenities,
traffic controls, street closures, neighborhoods, and self-help initiatives (e.g.
such as clean up campaigns, plantings in medians or parkways, and public
safety initiatives like crime watch, bicycle patrols, and crime prevention
workshops). Support services may be provided by neighborhood
associations and social service providers. The development of area
improvement plans brings participants together around a shared-vision for the
Arlington Housing Needs Assessment 165
neighborhood, identifies specific strategies and tools to be used to improve
the area, and community-wide actions that support and facilitate revitalization
activities. Model Block Improvement Plans have also been used to target
resources to smaller geographies to improve success in transforming areas
one block at a time. Other community initiatives include self-help and
volunteer programs involving partnerships between the community,
residents, civic organizations, business, and industry, working together to
affect change. This may include resources donated and man-woman power
generated by volunteers.
Increased Self-Help Initiatives - Volunteer-based initiatives aimed at improving
housing conditions and neighborhood stability are needed. Our recommendation is
that current activities be continued, and that the City consider expanding volunteer
activities as funds become available. Other activities that could be considered
include:
• Implement "fix-up," "paint-up," or "clean-up" campaigns and "corporate
repair projects.” To increase resources, neighborhood residents, religious institutions, community organizations, and corporations are recruited to participate in repair of homes occupied by elderly, disabled, and indigent homeowners through organized volunteer efforts involving their members and employees.
• Implement a Youth Build and Repair Program in conjunction with
the local school district. Youth Build programs teach young people how to build new homes and repair older ones. HUD once offered competitive grants to cities and non-profit organizations to help high- risk youth, between the ages of 16 and 24, develop housing construction job skills and to complete their high school education. These efforts are now being funded by industry, trade organizations, and trade schools.
• Organize “Compliance Stores” where home builders, building supply stores, merchants, and celebrities, such as radio and television personalities, are used to demonstrate simple, cost effective ways to make improvements to houses and donate building supplies for use in self-help projects. The supplies and storage facility could be provided to enrollees by building supply
Arlington Housing Needs Assessment 166
stores, contractors, and hardware stores.
• Organize "adopt-a-block" and "adopt-an-intersection" campaigns Neighborhood groups, residents, scout troops, and businesses could adopt key vistas and intersections to maintain and implement beautification projects, such as flower and shrub plantings and maintenance.
Affordable and Market Rate Housing
Lease Purchase - Another option for home buyers seeking to qualify for mortgage
financing is lease purchase. A viable tool for cash-poor, but gainfully employed
households, lease/purchase programs traditionally allow rental of a home for some
preset period of time with a portion of the rental payment going toward the down-
payment to help purchase the rented property. Lease purchase programs allow a
buyer to make rental payments virtually equal to the mortgage payments they will
eventually pay on a loan they can assume after several years of adequate credit
and loan payment behavior. Lease Purchase Housing Example Shreveport, Louisiana Lease Purchase Program – The City of Shreveport
collaborated with Federal Home Loan Bank, Fannie Mae, and local banks to build
Shepherd Place, a 22-unit single-family, new construction and gated subdivision in
northwest Shreveport. Illustration 6 highlights the subdivision which features both
one-story and two-story designs at a purchase price of $100,000 to $130,000.
Families receive up to $30,000 in subsidies for principal reduction, down payment
and closing cost and have up to three (3) years, to repair credit and to qualify for
the permanent mortgage. If applicants are unable to qualify at the end of the
specified period, they will be dropped from the program and any accumulated
contributions toward closing costs and down-payments will be forfeited.
The Community Development Department administered the program, responsible
for qualifying applicants, administering a lease-purchase contract, collecting rents,
maintenance, and closing the permanent mortgage. Non-refundable administrative
and maintenance fees are charged to the applicants to pay for program
administration, home maintenance, and other activities. Program funds accumulate

Arlington Housing Needs Assessment 167
from a portion of the rents paid by those who fail to qualify for permanent mortgages
from Fannie Mae. The Shreveport model is only one best practice example. Other
lease purchase programs increase homeownership opportunities among persons
that can afford monthly mortgage and other housing expenses but fail to qualify due
to credit or inability to provide the down-payment and closing costs. Other lease
purchase programs are designed to help younger demographics who have incomes
that support purchase of homes but their obstacle to homeownership is down-
payment or credit issues that can be resolved in a short time frame. The strategy
section provides an illustration of a lease purchase housing subdivision constructed
in the MLK Neighborhood in Shreveport. Employer Assisted Housing - The City should work with local employers to market
Employer Assisted Housing (EAH) as a means of creating homeownership
opportunities for the workforce. It is vital that we increase awareness among major
employers that some wage levels are not adequate for people to enter
homeownership, without down-payment and other assistance. City governments
and school districts should also consider initiating programs to assisted qualified
employees with becoming homeowners. The City could coordinate with major
employers and lenders to design and aid firms in the implementation of Employer-
Assisted Housing (EAH) programs, encouraging employers to work with employees
in their efforts to purchase housing in the Plan area. Employer-Assisted Housing programs benefit employers, employees, and the
community. Employers benefit through greater employee retention. Employees
receive aid to move into homeownership. Ultimately, communities benefit though
investment in the neighborhoods where the employers and employees are located.
The most common benefits provided by employers are grants, forgivable loans,
deferred or repayable loans, matched savings, interest-rate buy downs, shared
appreciation, and homebuyer education (provided by an employer-funded
counseling agency). Successful EAH programs use a combination of some of the
benefits listed above. One program that has met with success was developed by
Fannie Mae, which not only has their own EAH program, but also helps employers
implement EAH programs. Fannie Mae's EAH program has made it possible for
2,200 of its employees to become homeowners. Seventy-six (76%) percent of all
Fannie Mae employees own their own homes, compared with a national average of
Arlington Housing Needs Assessment 168
sixty-eight (68%) percent. Asset Control Area - The Asset Control Area (ACA) program is another way to
increase homeownership opportunities through rehabilitation. The ACA program is
operated by the U.S. Department of Housing and Urban Development (HUD) and
takes foreclosed properties and sales them to local government agencies and non-
profits at discounted rates. The program is targeted at increasing homeownership
for households that have incomes no more than 115 percent of the area’s median
income. Congress created the nationwide ACA initiative in 1998 to enable local governments
and qualified non-profit developers to acquire Federal Housing Administration
(FHA)-owned homes at a discount for rehabilitation and resale to buyers in targeted
communities with high foreclosure and low homeownership rates. The program
promotes several important objectives: increasing homeownership opportunities for
low- to moderate-income households, stabilizing distressed neighborhoods,
transitioning federally foreclosed homes back into stable assets for communities,
limiting losses from future foreclosures, and preventing real estate speculation that
exacerbates neighborhood blight and homeownership disparities. Under the ACA
program, HUD sales foreclosed homes in designated revitalization areas to local
governments and experienced non-profit organizations at a discount.
Individual Development Accounts - Individual Development Accounts (IDAs) are
offered through local community development organizations, in conjunction with
funding provided by the U.S. Department of Health and Human Services. Qualified
participants establish savings accounts with participating financial institutions.
These funds are matched by the IDA program. Participants receive case
management, counseling, and financial literacy training and may use the funds as a
down payment for a home purchase.
Acquisition and Rehabilitation - Existing homes in Arlington area potentially will
become rental properties as the community’s housing stock ages and as the market
for single family homes for rental continues to grow. Owner/Investor Purchases of
existing homes is an alternative way of conserving homeownership rates and
minimizing owner occupied housing to rentals. Mortgage products have been

Arlington Housing Needs Assessment 169
developed that help buyers purchase and renovate existing homes and to purchase
homes they currently rent. Greater public awareness of mortgage products and
community promotion of their availability should help begin to transform the stock of
rental into homeowner opportunities for area households. Banks and mortgage
companies offer acquisition and rehabilitation programs that provide mortgage
funding for the purchase and repair of a home in a single loan. These loan
products allow buyers to make needed repairs without the cost or inconvenience of
two closings. One example is the Fannie Mae Home Style Renovation mortgage. A
Home Style Renovation mortgage is a government-backed loan that allows qualified
borrowers to add extra money for remodeling or improvements to an initial home
purchase mortgage or a mortgage refinancing. The loans are meant to offer a
“convenient and economical” way for homeowners, homebuyers and investors
to finance minor or moderate home improvements through a single-close first
mortgage or refinance, rather than having to apply for a second mortgage, home
equity line of credit or other costlier finance options, according to Fannie Mae. The
loan amount is based on the future “as-completed” value of the property once the
renovations are performed, rather than its existing present value. A key benefit of
these loans is that the renovations they enable could help create equity in the
property.
Housing for special needs populations
Arlington receives funding from several federal entitlement and completive grants
that assist the homeless and those at risk of homelessness with acquiring shelter
and supportive services. Arlington is an active participant in the Continuum of Care
Coalition and actively participates in the annual one-night count of homeless
persons. Arlington and its community partners should continue to seek funding that
expands and sustains these efforts. Program successes include:
Emergency Solutions Grants - Emergency Solutions Grants were awarded to
Arlington and allocated to organizations providing shelter and services to homeless
individuals and families. The program is funded by the HUD. According to the 2019
Annual Action Plan, Arlington received $279,640 to use for shelter services, rapid
rehousing, and homeless prevention. Temporary shelter was provided to 1,928

Arlington Housing Needs Assessment 170
homeless individuals in 2018 at the Arlington Life Shelter, Salvation Army, and Safe
Haven. The total served included 642 children, representing 33 percent and 1,286
adults, which is 67 percent.
Supportive Housing Program (SHP) - The Supportive Housing Program is
designed to promote the development of housing and supportive services to assist
homeless persons in their transition from the streets or shelters to permanent
housing and self-sufficiency. Arlington was awarded $88,008 in 2018 to assist 10
households and 348,508 in 2019 to assist 25 households. Shelter Plus Care
Program funding has also been used to supplement funding for rental housing and
prevention of homelessness. The Shelter Plus Care Program is a competitive
HUD program that provides rental assistance to persons with disabilities,
primarily mental disabilities. This grant is essential to households attempting to
avoid homelessness due to their inability to afford utilities and other housing
related cost.
Homeless Housing and Services Program (HHSP) - Homeless Housing and
Services Program (HHSP) is a state funded initiative used in Arlington to help the
homeless and those in imminent danger of becoming homeless. The funds are
primarily utilized for Arlington renters who are in imminent danger of being evicted
from their rental unit and without financial assistance, would become homeless. The
City of Arlington anticipates it will serve approximately 60 families annually from
October 2019 to August 2020, or until funding is depleted.
Non-Profit Owned Renter-Occupied Housing Rehabilitation in Designated Target Areas - The City’s Housing Rehabilitation Program helps non-profit
organizations rehabilitate single-family or duplex rental properties located in a
designated target area. The tenant must be low-income and must reside in the
property at the time the application is processed. For low-income tenants, the City
of Arlington will fund 100 percent of the eligible repairs up to $24,500. It is
recommended that the City continue this program.

Arlington Housing Needs Assessment 171
LGBTQ+ Housing Needs
According to the National Association of Gay & Lesbian Real Estate Professionals
(NAGLREP), “there remains a major problem in the real estate industry as housing
discrimination based on sexual orientation and gender identity is still not illegal.” This
reality is detailed in the NAGLREP 2019-2020 annual report. The report reveals how
and why LGBTQ+ home ownership rates are lower than the national average and
how housing discrimination negatively impacts the community. Through research
provided by the National Association of Gay & Lesbian Real Estate Professionals
(NAGLREP) and local based Housing Education Learning Project (HELP), the
housing needs assessment identified critical issues relative to housing and housing
related needs of the LGBTQ+ community including:
Housing - Housing discrimination based on sexual orientation and gender identity
is still not illegal nationally or in Arlington and perceptions of occurrences of
discrimination appears to remain high. Housing discrimination and perceptions
negatively impacts the community. For example, LGBTQ+ homeownership rates
nationally are lower than the national average where 49% of LGBTQ+ individuals
own a home, compared to the 65% national average. This means for the City of
Arlington, a potential loss of LGBTQ+ home buyers and renters to surrounding cities.
Most of HELP’s resources address non-housing needs, therefore, new resources
are needed to address housing related needs.
Stigmas – Addressing negative stigmas and limited understandings of the LGBTQ+
community, people living with HIV and Aids, others facing discrimination, bias, and
person impacted by crime due to sexual orientation and gender equality remains a
high priority.
Access to Services and Homelessness – Many in the LGBTQ+ community are
seeking help in addressing needs including healthcare, homelessness, housing
discrimination, access to housing, transportation, goods, and services. Limited
access to public or low-cost transportation is a significant issue with services most
available in the larger cities of Dallas and Fort Worth.
Safety and Security – A recent survey conducted in July 2019 by HELP found that
a major issue faced by LGBTQ+ populations both statewide and in Arlington is safety
and security. This ranged from actual crimes and violence to intimidation. A majority

Arlington Housing Needs Assessment 172
of respondents statewide indicated that they do not feel safe or treated fairly. Survey
participants cited their need to spend money and resources for other than housing,
in other cities such as Fort Worth and Dallas to access the entertainment, goods and
services they prefer as an obstacle to living in Arlington. This was a statewide survey
and specific data for Arlington is still being analyzed and tabulated.
Assisted Housing Programs
Assisted housing programs are operated primarily by the by the Arlington Housing
Authority with funding from the U.S. Department of HUD. Other funding sources
include New Market Tax Credits, HFC, and LIHTC. Programs include:
Housing Choice Vouchers (HCV) - The Housing Choice Voucher program assist
very low-income families, elderly, and disabled persons in affording decent, safe,
and sanitary housing. Participants in this program receive subsidies to lease units
from private property owners. Each unit must pass a Housing Quality Standards
(HQS) inspection and be rent reasonable as compared to other similar units in the
area. Since housing assistance is provided on behalf of the family or individual,
participants can find their own housing, including single-family homes, townhouses,
and apartments. The program is administered by the Arlington Housing Authority
which as of March 2020 controls 3,713 vouchers.
Tenant Based Rental Assistance -
The Tenant Based Rental Assistance (TBRA) program is a federally funded program
regulated by the U.S. Department of Housing and Urban Development (HUD),
managed and operated in the City of Arlington by the Arlington Housing Authority
(AHA). The funding source for the TBRA program is HUD HOME program funding.
HUD allocates HOME funds to the City of Arlington annually. The Arlington City
Council determines the amount of HOME funding received that will be allocated to
the TBRA program.
The purpose of the TBRA program is to provide rental housing assistance in
connection with supportive services to homeless persons or other low-income
persons in need of decent affordable housing. Housing assistance is provided for up
Arlington Housing Needs Assessment 173
to two (2) years. Arlington allocated $410,000 in HOME funds to assist 33 homeless
and at-risk households in 2019.
Family Self Sufficiency Program - The Family Self-Sufficiency Program (FSSP)
assists eligible families in becoming economically self-sufficient, provides a range of
services including educational assessment, academic remediation, and GED
preparation, self-esteem and assertiveness training, vocational assessment,
employment and job training, reimbursement for job related expenses, budgeting
skills training, gasoline allowance, and minor car repair assistance. The program
provides childcare, educational opportunities, job training, substance / alcohol abuse
treatment or counseling, budgeting, and other counseling. Arlington was awarded
$183,423 administered by Arlington Housing Authority.
Neighborhood Revitalization Recommendations De-concentration of Poverty, Lower Income Persons, Race-Ethnicity, and Public and Assisted Housing - Improving existing minority and income
concentrated neighborhoods will have to be a major focus of city and county
governments. Broad community involvement and outreach will be needed both in
introducing the concept of de-concentration and building community support and
consumer buy-in into the implementation recommendations. Equally important and
perhaps even more challenging is the goal to transform de-concentration areas into
opportunity areas. For de-concentration to be achieved, we must begin to move
areas of concentration closer to becoming opportunity areas. We must identify
changes that need to occur, what neighborhood amenities and quality of life issues
need to be addressed and how do we achieve and pay for such improvements. A
more difficult concern is what public and assisted housing units, and in some cases
private units, must be demolished to make way for new housing and amenities and
what residents stay to reap the benefits of change versus which residents must move
to existing opportunity areas to achieve de-concentration. Current residents in
concentrated areas will be most concerned with when designated as a household
that should move, “Will there be adequate assisted housing choice in the opportunity
areas”; “What sort of neighborhood should I move to” and ”Will the areas and its’
existing residents be supportive of my transition?” Other impacts that must be dealt
Arlington Housing Needs Assessment 174
with include:
Impact: Lack of housing choices available to minority and lower income populations,
persons dependent upon housing assistance in R-ECAP areas and lack of access
to “Opportunity Areas”.
Impact: Gaps in infrastructure in support of housing opportunities – educational
attainment and quality schools, transportation and mobility, job creation,
neighborhood revitalization, crime, public infrastructure, limited housing types, public
and assisted housing resources.
Impact: Lack of a Public Participation Plan aimed at expanding broad community
involvement and support for and reducing barriers to fair housing choice.
Impact: Social Equity for populations and geographies performing below the area
median and opportunities to elevate those populations closer to the median
Impact: Community and Industry Resistance, Discrimination, and Opposition to Fair
Housing Choice – nimbyism, discrimination, segregation, historic and cultural
heritage, gentrification.
HUD Choice Neighborhood Program Grants - The City of Arlington, in
conjunction with the Arlington Housing Authority, should apply for the HUD Choice
Neighborhood Planning Grant. The U.S. Department of Housing and Urban
Development awarded Choice Neighborhoods Implementation Grants including
$24.2 million to the City of Shreveport for fiscal year 2018 and $29.5 million to the
City of Baton Rouge in 2019 to assist in the transformation, rehabilitation and
preservation of public housing and privately-owned HUD-assisted housing, and
surrounding distressed neighborhoods. The Choice Neighborhood initiative expands
on the success of the HOPE VI program by recognizing that communities must link
affordable housing with quality education, public transportation, good jobs, and safe
streets. As part of HUD’s overall plan to revitalize areas of concentrated poverty, the
Choice Neighborhoods Grants are intended to help transform distressed and at risk
public or assisted housing, and their surrounding neighborhoods into sustainable,
mixed-income housing that connects to key services, such as education and
transportation, and supports positive outcomes for the neighborhood’s
families. Eligible applicants are public housing authorities, local governments, non-
Arlington Housing Needs Assessment 175
profit organizations, and for-profit developers that apply jointly with a public
entity. Applicants must demonstrate their plan to revitalize the neighborhood
through public-private partnerships that seek to develop high-quality public schools
and early learning programs, public transportation, and improved access to jobs and
well-functioning services.

Arlington Housing Needs Assessment 176
STRATEGIES The strategies present an alternative way of addressing key issues, opportunities,
and recommendations. Strategies include policy, regulatory, housing products and
programs that have proven to remove development constraints in other
communities. Some strategies demonstrate alternative approaches for Arlington
due to the unique characteristics and concerns relative to future housing needs in
the city. It is important to note that the strategies are presented as options in the
creation of an overall implementation plan that will serve as the basis for meeting
future housing needs and sustaining existing housing and neighborhoods. Some
strategies will need to be evaluated for incorporated in the City’s 5-Year Consolidated
Plan. The following are key strategies in support of the implementation of
recommendations. Restoring the “Basic Attributes” of Existing Housing and Neighborhoods Success in meeting future housing needs, developing housing that is affordable to a wide
range of consumers, and stimulating revitalization and reinvestment in existing areas must
include addressing needed improvements to existing conditions and restoring the
community’s basic attributes. This includes census tracts along the Cooper and Collins
Street corridors, and NRSA designated districts. Examples include: North Cooper Street Corridor

Arlington Housing Needs Assessment 177
Avalon Apartments 1215 N. Cooper Street – Low Income Housing Tax Credit
While maintaining and enhancing neighborhood stability is the immediate vision and
goal, achieving sustainability is an essential recommendation for all areas where
future growth in housing is expected to occur. At the core of this vision is enhancing
“Image and Identity” of areas as a means of attracting new residents and retaining
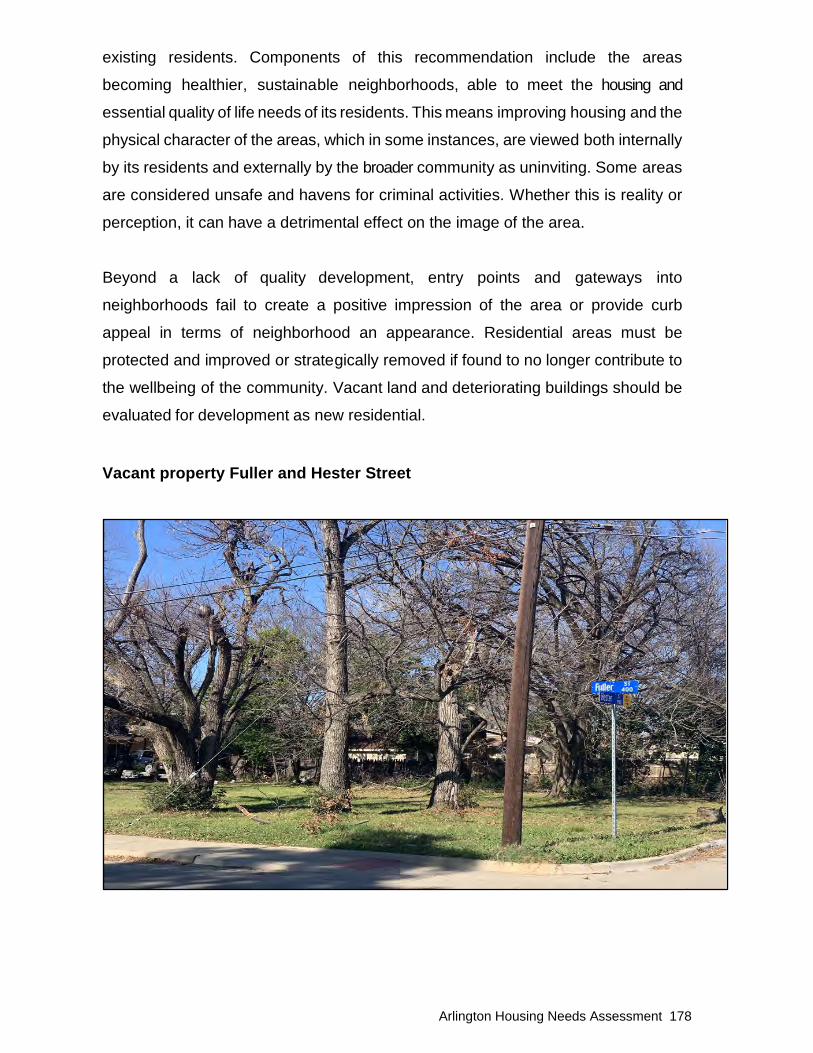
Arlington Housing Needs Assessment 178
existing residents. Components of this recommendation include the areas
becoming healthier, sustainable neighborhoods, able to meet the housing and
essential quality of life needs of its residents. This means improving housing and the
physical character of the areas, which in some instances, are viewed both internally
by its residents and externally by the broader community as uninviting. Some areas
are considered unsafe and havens for criminal activities. Whether this is reality or
perception, it can have a detrimental effect on the image of the area.
Beyond a lack of quality development, entry points and gateways into
neighborhoods fail to create a positive impression of the area or provide curb
appeal in terms of neighborhood an appearance. Residential areas must be
protected and improved or strategically removed if found to no longer contribute to
the wellbeing of the community. Vacant land and deteriorating buildings should be
evaluated for development as new residential.
Vacant property Fuller and Hester Street
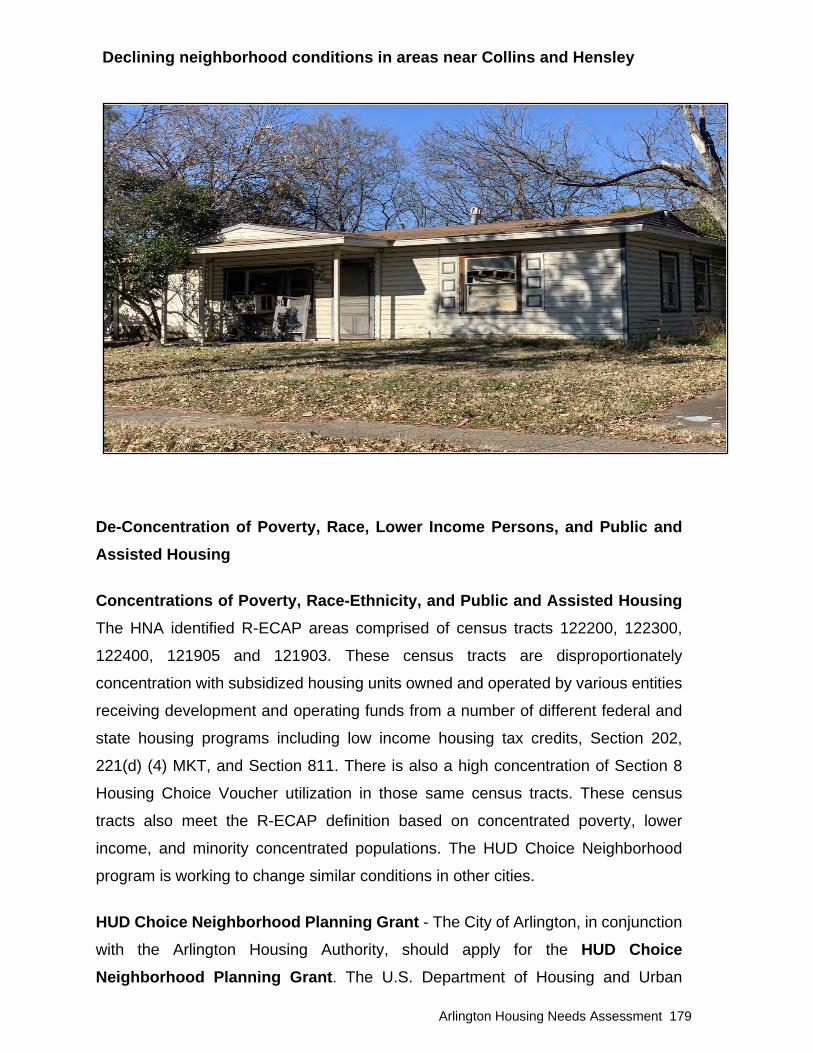
Arlington Housing Needs Assessment 179
Declining neighborhood conditions in areas near Collins and Hensley
De-Concentration of Poverty, Race, Lower Income Persons, and Public and Assisted Housing
Concentrations of Poverty, Race-Ethnicity, and Public and Assisted Housing The HNA identified R-ECAP areas comprised of census tracts 122200, 122300,
122400, 121905 and 121903. These census tracts are disproportionately
concentration with subsidized housing units owned and operated by various entities
receiving development and operating funds from a number of different federal and
state housing programs including low income housing tax credits, Section 202,
221(d) (4) MKT, and Section 811. There is also a high concentration of Section 8
Housing Choice Voucher utilization in those same census tracts. These census
tracts also meet the R-ECAP definition based on concentrated poverty, lower
income, and minority concentrated populations. The HUD Choice Neighborhood
program is working to change similar conditions in other cities.
HUD Choice Neighborhood Planning Grant - The City of Arlington, in conjunction
with the Arlington Housing Authority, should apply for the HUD Choice Neighborhood Planning Grant. The U.S. Department of Housing and Urban

Arlington Housing Needs Assessment 180
Development awarded Choice Neighborhoods Implementation Grants to cities of
comparable size to Arlington including $24.2 million to the City of Shreveport for
fiscal year and $29.5 million to the City of Baton Rouge in 2019 to assist in the
transformation, rehabilitation and preservation of areas with concentrated race-
ethnicity, poverty, public and privately owned HUD-assisted housing, and
surrounding distressed neighborhoods. The Choice Neighborhood initiative expands
on the success of the HOPE VI program by recognizing that communities must link
affordable housing with quality education, public transportation, good jobs, and safe
streets. As part of HUD’s overall plan to revitalize areas of concentrated poverty, the
Choice Neighborhoods Grants are intended to help transform distressed and at risk
public or assisted housing, and their surrounding neighborhoods into sustainable,
mixed-income housing that connects to key services, such as education and
transportation, and supports positive outcomes for the neighborhood’s
families. Eligible applicants are public housing authorities, local governments, non-
profit organizations, and for-profit developers that apply jointly with a public
entity. Applicants must demonstrate their plan to revitalize the neighborhood
through public-private partnerships that seek to develop high-quality public schools
and early learning programs, public transportation, and improved access to jobs and
well-functioning services. Adaptive reuse of existing commercial land uses, and
new residential development is needed as well. Tracts of land ranging from vacant
lots and abandoned residential, to potential redevelopment site adjacent to existing
multi-family provide opportunities for new housing and to revived commercial.
Housing examples are based on new construction single family units ranging in size
from 1100 to 1800 square feet and multi-family and higher density residential
ranging from one story to four stories.

Arlington Housing Needs Assessment 181
Interim Land Uses and Repurposed Development – Interim land uses and
strategy for repurposing underutilized buildings are needed for structures and
vacant lots in poor condition. If market conditions improve and development
opportunities desired become a reality, some owners may opt to redevelop their
properties for alternative development types. However, during this interim period
while the redevelopment concepts are taking shape, existing business must continue
to operate until. Their survival as viable businesses are linked to immediate
improvements by making minimal investments that attract increased client traffic.
Land use such as outdoor markets can quickly retrofit existing building and
transform vacant lots into business enterprises.
Illustration 1: Examples of Interim Land Uses and Underutilized Buildings

Arlington Housing Needs Assessment 182
Illustration 2: Interim Land Use Opportunity - Open Air Festival Market or Spray Park Property located near the
intersection of East Division
and North Collins Streets in
Arlington are aging, poor
condition, and therefore likely
candidates for re-investment
and redevelopment in the
near future. Interim uses
should be considered until the
market absorbers these
properties for redevelopment.
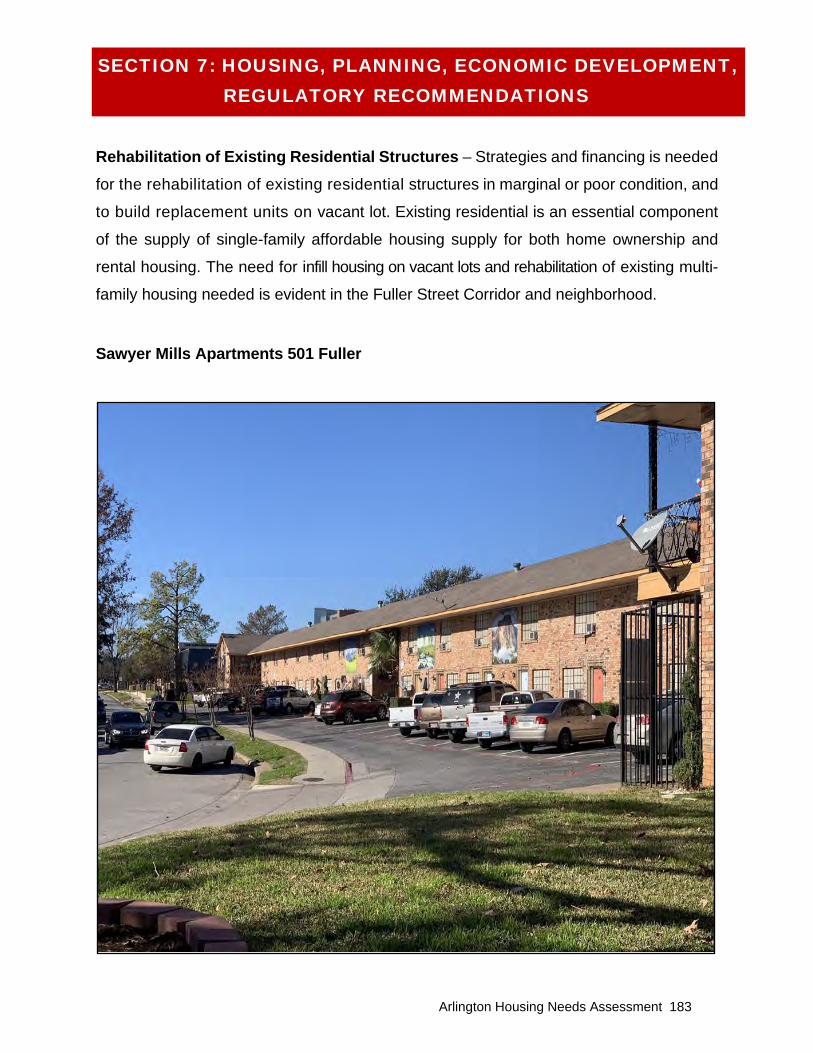
Arlington Housing Needs Assessment 183
Rehabilitation of Existing Residential Structures – Strategies and financing is needed
for the rehabilitation of existing residential structures in marginal or poor condition, and
to build replacement units on vacant lot. Existing residential is an essential component
of the supply of single-family affordable housing supply for both home ownership and
rental housing. The need for infill housing on vacant lots and rehabilitation of existing multi-
family housing needed is evident in the Fuller Street Corridor and neighborhood.
Sawyer Mills Apartments 501 Fuller
SECTION 7: HOUSING, PLANNING, ECONOMIC DEVELOPMENT, REGULATORY RECOMMENDATIONS

Arlington Housing Needs Assessment 184
Fuller Street Corridor

Arlington Housing Needs Assessment 185
Land Use Compatibility is an issue in older residential areas and could adversely impact
future housing development and reinvestment in these neighborhoods. These areas had
a variety of problems which included:
• Commercial adjacency/buffering between residential neighborhoods;
• Multi-family adjacency to single family residential;
• Vacant lots and residential structures along arterials; and
• Development along corridors that form the buffers, boundaries, or transition
for residential neighborhoods or other developed land use areas
Collins Street corridor and neighborhoods adjacent to the corridor
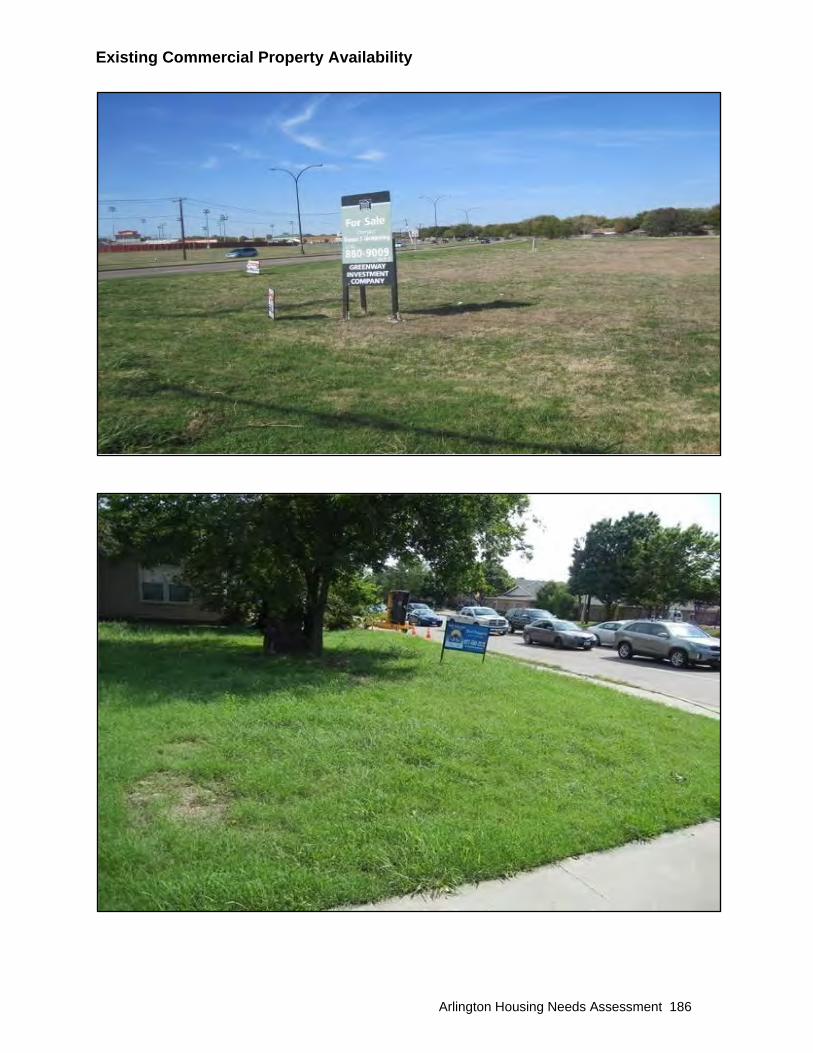
Arlington Housing Needs Assessment 186
Existing Commercial Property Availability

Arlington Housing Needs Assessment 187
Housing and Neighborhood Conditions A major discussion during the analysis phase of needs assessment was the general state
of existing housing in the areas. Some areas exemplified single-family housing
conditions that were substandard, requiring major repairs, but some area housing
needed only minor repair.
Area Improvement Plans - The Needs Assessment recommends parallel efforts
where the area(s) develop individual goals and objectives for improvement components
of the Plan. The jurisdictions will identify public/private partnership opportunities for
implementing various housing and neighborhood plan recommendations. These range
from litter pickup to specific contractual relationships with entities that are involved in
housing rehabilitation or development. The area improvement plan identifies needed
improvements. Area Improvement Plans include physical improvements to support
reinvestment such as urban design amenities, traffic controls, or street closures;
neighborhoods, self-help initiatives, such as clean up campaigns and plantings in
medians or parkways; public safety initiatives like crime watch, bicycle patrols, and crime
prevention workshops; and support services provided by neighborhood associations and
social service providers.
The development of area improvement plans brings participants together around a shared-
vision for the neighborhood, identifies specific strategies and tools to be used to improve
the area, and community-wide actions that support and facilitate revitalization activities.
Model Block Improvement Plans have also been used to target resources to smaller
geographies to improve success in transforming areas one block at a time.
Other community initiatives include self-help and volunteer programs involving
partnerships between the community, residents, civic organizations, business, and
industry, working together to affect change. This may include resources donated and
man-woman power generated by volunteers.
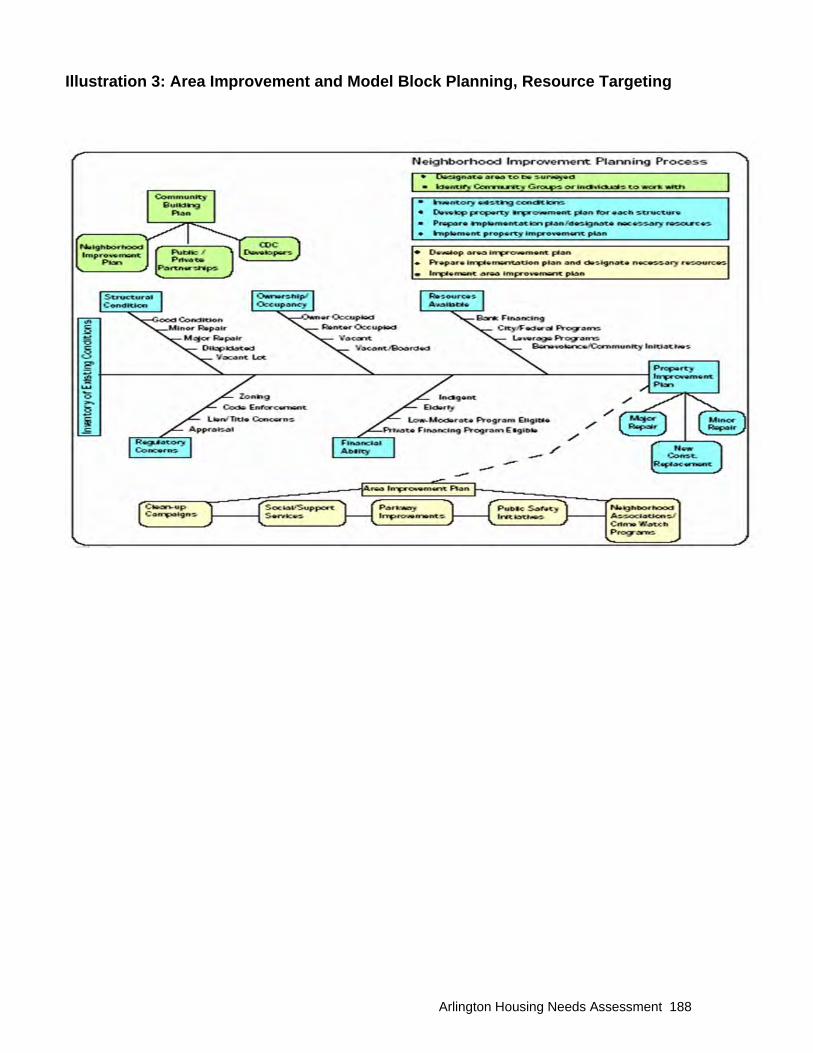
Arlington Housing Needs Assessment 188
Illustration 3: Area Improvement and Model Block Planning, Resource Targeting

Arlington Housing Needs Assessment 189
Increased Self-Help Initiatives - Volunteer-based initiatives aimed at improving housing
conditions and neighborhood stability are needed. Our recommendation is that current
activities be continued, and that the City consider expanding volunteer activities as funds
become available. Current and new activities that could be considered include:
UTA Community Garden, 406 Summit Plots available for $25 Rentals
Regulatory and Policy Reform Land Acquisition and Land Bank Program - An aggressive land banking program is
recommended to allow the City to revitalize blighted neighborhoods and create infill
housing. A land bank is a public authority created to efficiently hold, manage, and develop
tax-foreclosed property. Land banks act as a legal and financial mechanism to transform
vacant, abandoned and tax-foreclosed property back to productive use. The Land Bank
concept involves acquiring unproductive, vacant, and developable lots for affordable
single-family housing development. The Land Bank helps to reduce unproductive
expenditures and increase local government revenues. Cities establish certain criteria
for acquiring properties and for properties to be considered for Land Bank use. These
criteria include: 1) the property must owe five years or more in back taxes; 2) the total
taxes and liens must be greater than the value of the property; 3) the purchaser must
demonstrate the financial ability to immediately develop the property for affordable
Arlington Housing Needs Assessment 190
housing. The Land Bank generally acquires the foreclosure properties from the Sheriff
Sale, maintains the properties and assembles parcels for sale to for-profit and non-profit
developers. Land Bank properties are sometimes acquired as donations by property
owners, purchases from owners willing to sale property at reduced prices, and as surplus
City or County-owned land deemed no longer needed for any public purpose.
The Land Bank and Acquisition Model - The Land Bank and Acquisition Model would
support the acquisition of tax foreclosure and abandoned properties that are, for the most
part, blighted, unproductive and vacant lots and undeveloped land tracts that would be
used for affordable housing development. The City’s current land bank is limited to
foreclosed and surplus property. The City could establish and implement certain criteria
to guide the acquisition and title clearance of tax foreclosure property, acquisition, and
disposition of land bank property and a process for insuring adherence to State Laws. The criteria for acquisition should include: 1) the property must be a property acquired
through voluntary sale, or tax foreclosure disposition procedures as an abandoned or a
mortgage or tax foreclosure property; 2) a process is needed to acquire clear title
eliminate all tax liens, mortgage liens and other encumbrances upon the property title to
be eligible for land bank acquisition; 3) the disposition price to developers acquiring land
bank property, whenever financially feasible, will provide recovery of dollars expended by
the land bank for taxes and other liens provided such liens are not greater than the fair
market value of the property; 4) the purchaser must demonstrated the financial ability to
immediately develop the property for affordable housing. The function of the land bank includes acquiring the properties, maintaining properties
until disposition, and assembling, and marketing development parcels for sale. Land
Bank properties may also include donations by property owners, purchases from owners
willing to sale property at reduced prices, and as surplus City owned land deemed no
longer needed for any public purpose. Sources of funds for acquisition cost and other land
bank operations may be available from federal and state resources. Illustration 4
graphically depicts the land bank and acquisition process.

Arlington Housing Needs Assessment 191
Illustration 4: Land Bank and Acquisition Model

Arlington Housing Needs Assessment 192
Housing and Neighborhood Strategies and Solutions Overview - The Housing and Neighborhood Strategies and Recommendations build
upon the assessment of existing conditions, development opportunities, infrastructure,
alternative resources for development, and alternative ways for improving existing
housing conditions. It incorporates the evaluation of socio-economic and housing market
conditions and area characteristics with an analysis of housing and neighborhood
conditions, community engagement, and a housing needs assessment to create
revitalization and sustainability recommendations. This section addresses a wide range
of alternatives for implementation including programs, financing, public policy, regulatory,
and development.
Affordability concerns appears throughout this analysis and the need for affordable
housing, for both low-income and middle-income residents has been described.
Affordable units for low-income residents are a pressing need and multi-family units
should be included in development and redevelopment projects where possible. Multi-
family and single-family housing can be built using a variety of mechanisms to make them
financially attractive to developers.
The City already employs some of these mechanisms to encourage development. They
should be marketed so developers are aware of what mechanisms are available and
when and how they are applied. These programs, as well as a range of homeownership
programs such as mortgage assistance, down payment assistance, and employer
assisted housing efforts can be used to assist a variety of prospective homebuyers,
especially first-time homebuyers. Additional tools that the city should explore include
density bonuses, fee waivers, deferred fees, and land banking.
CDBG and HOME program funding for homebuyer program - The U.S. Department
of Housing and Urban Development provides funding to the City of Arlington to help
finance portions of the development cost and supplement the home buyer cost to make
housing affordable. Funding is provided under the Community Development Block Grant
Program and the Home Investment Partnerships Program.

Arlington Housing Needs Assessment 193
Recent privately funded new Construction – located on Collins Street
Arlington Medium Density Townhouse – Condominium Development

Arlington Housing Needs Assessment 194
Lease Purchase - Another option for home buyers seeking to qualify for mortgage
financing is lease purchase. A viable tool for cash-poor, but gainfully employed
households, lease/purchase programs traditionally allow you to rent a home for some
preset period of time with a portion of the rental payment going toward the down-payment
to help purchase the rented property. Lease purchase programs allows a buyer to make
rental payments virtually equal to the mortgage payments they will eventually pay on
a loan they can assume after several years of adequate credit and loan payment
behavior. Lease Purchase Housing Example Shreveport, Louisiana Lease Purchase Program – The City of Shreveport collaborated
with Federal Home Loan Bank, Fannie Mae, and local banks to build Shepherd Place, a
22-unit single-family, new construction and gated subdivision in northwest Shreveport.
Illustration 6 highlights the subdivision which features both one-story and two-story
designs at a purchase price of $100,000 to $130,000. Families receive up to $30,000
in subsidies for principal reduction, down payment and closing cost and have up to three
(3) years, to repair credit and to qualify for the permanent mortgage. If applicants are
unable to qualify at the end of the specified period, they will be dropped from the program
and any accumulated contributions toward closing cost and down-payments will be
forfeited.
The City Community Development Department administered the program and was
responsible for qualifying applicants, administering a lease-purchase contract, collecting
rents, maintenance, and ultimately closing the permanent mortgage. Non-refundable
administrative and maintenance fees are charged to the applicants to pay for program
administration, home maintenance, and other activities. Program funds accumulate from
a portion of the rents paid by those who fail to qualify for permanent mortgages from
Fannie Mae. The Shreveport model is only one best practice example. Other lease
purchase programs have been implemented by non-profit and private developers, and
other entities to increase homeownership opportunities among persons that can afford
monthly mortgage and other housing expenses but fail to qualify due to credit or inability
to provide the down-payment and closing cost. Other lease purchase programs are
designed to help younger demographics who have incomes that support purchase of
homes but their obstacle to homeownership is down-payment or credit issues that can be
resolved in a short time frame.
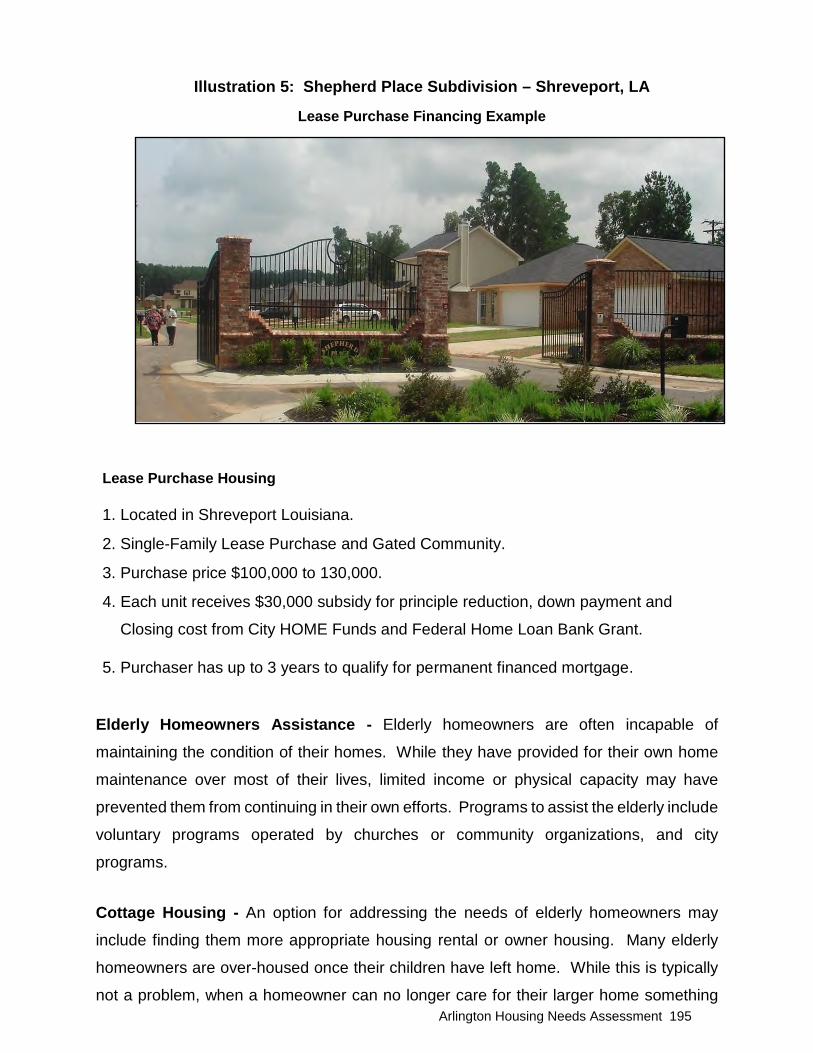
Arlington Housing Needs Assessment 195
Illustration 5: Shepherd Place Subdivision – Shreveport, LA
Lease Purchase Financing Example
Lease Purchase Housing
1. Located in Shreveport Louisiana.
2. Single-Family Lease Purchase and Gated Community.
3. Purchase price $100,000 to 130,000.
4. Each unit receives $30,000 subsidy for principle reduction, down payment and
Closing cost from City HOME Funds and Federal Home Loan Bank Grant. 5. Purchaser has up to 3 years to qualify for permanent financed mortgage.
Elderly Homeowners Assistance - Elderly homeowners are often incapable of
maintaining the condition of their homes. While they have provided for their own home
maintenance over most of their lives, limited income or physical capacity may have
prevented them from continuing in their own efforts. Programs to assist the elderly include
voluntary programs operated by churches or community organizations, and city
programs.
Cottage Housing - An option for addressing the needs of elderly homeowners may
include finding them more appropriate housing rental or owner housing. Many elderly
homeowners are over-housed once their children have left home. While this is typically
not a problem, when a homeowner can no longer care for their larger home something

Arlington Housing Needs Assessment 196
smaller and more easily cared for may be more appropriate. The major objection that
many in these circumstances have is losing their familiar surroundings and social
networks. Small neighborhood cottage housing developments can address these housing
needs. Instead of providing expensive repairs to a housing unit that may be occupied
by only one or two persons, other buyers can purchase their home allowing them to
transition to a smaller unit, while relieving them of the burden of the larger home. The
program would them rehabilitate their home and sale it to a larger family through a new
homebuyer program. Cottage housing, or cluster housing as it is sometimes called,
provides a smaller unit for the elderly as a homeownership option or as an alternative to
continuing ownership of a larger unit that essentially over-houses them or has become too
costly to maintain. It should also be considered a viable alternative to a grant-funded major
rehabilitation when an elderly applicant is living in unsafe conditions and the rehabilitation
costs exceed the projected value of the completed structure. There may also be
applicants who, as a result of limited funding, will have to wait years for assistance
because their application is at the end of a long rehabilitation program waiting list.
The Program Objectives:
• Construct developments of 8 to 12 housing units built in a cluster housing
configuration, common walls like the walls found in duplex construction.
• Identify e l ig ib le elderly participants for the purchase of a cottage. The
prospective buyer would either currently own their home but is over-housed
and is willing to purchase the cottage and sale their existing home at market
value, or they are in the market to buy an affordable unit.
• Facilitate the existing home sale and the purchase of the Cottage for the
participant using the proceeds of the sale of their home.
• Add federal or state grant contribution to cover the difference between the
buyer’s equity and the market value of the cottage, if necessary.
• Provide maintenance of the cottage community, partially funded through
homeowner dues and the non-profit/civic organization’s maintenance fund.

Arlington Housing Needs Assessment 197
Cottage Housing Models Cottage housing is generally designed to contain 450 to 600 square feet. Other features
include front porches with appealing exterior design features, one bedroom, bathroom,
den, and kitchen. The site could be laid-out to provide opportunities for community
gardens or green space/courtyard in the interior of the development. The entire site
should be enclosed with wrought iron fencing with the front of the cottages facing the
common green space.
Cottages should incorporate Universal Design features and be energy efficient. Cottage
housing can be larger and developed for different markets and price points depending on
the targeted purchasers. In addition to market rate cottage housing developed by private
developers, some cottage housing is developed to meet the needs of seniors with limited
incomes and those needing financial incentives or special financing to ensure affordability
while still securing their equity investment as a homeowner. This sometimes requires
development financing and homebuyer assistance provided through CDBG or HOME
funding, with additional participation solicited from financial institutions that express an
interest in leading the way toward funding progressive housing projects. Development
subsidies to developers, principal reduction grant funding to purchasers is available from
the Federal Home Loan Bank (FHLB) through a member bank as part of FHLB’s
Affordable Housing Grant Program.
A non-profit or religious organization can also serve as developer. That entity could also
provide ongoing maintenance support after the sale based on a monthly assessment to
the residents of the cottage community. A monthly assessment should cover the cost of
maintaining the grounds. The maintenance fund provided by these contributions and/or
an escrow derived from the sale of the cottages could be used for routine maintenance as
well as paint-up and fix-up needs of the housing units in the future. Cottage or cluster
housing as it is sometimes referred to, can also be an alternative housing in areas
currently zoned for high density residential but currently developed as single family.
Other areas may need medium density home ownership type residential housing as an
alternative to medium density or larger scale multi-family rental housing.

Arlington Housing Needs Assessment 198
Cottage / Cluster Housing for Seniors – Illustration 6
Prototypical cottage housing development that could be replicated on sites to accommodate cluster - cottage housing development.
Grand Families Public Housing Development – Grandparents responsible for raising
their grandchildren has become a responsibility for many middle aged and senior
households. In recognition of this growing lifestyle responsibility, public housing
authorities and HUD are working to provide housing that specifically supports those
families who find themselves in this situation and in need of subsidized housing. We
recommend that that Arlington Housing Authority explore HUD funding for Grand Families
Public or Assisted Housing. One example of the program is the Pemberton Park
development in Kansas City. Pemberton Park for Grand Families – Kansas City Missouri Housing Authority Pemberton Park for Grand families is the first development in Kansas City designed
specifically to serve grandparents raising their grandchildren. The development is an
exclusive apartment community for 55+ Grandparents raising their Grandchildren.
Grandparents 55+ will love the supportive environment for them and their minor
grandchildren. Legal guardianship of the grandchildren by the tenant grandparent is
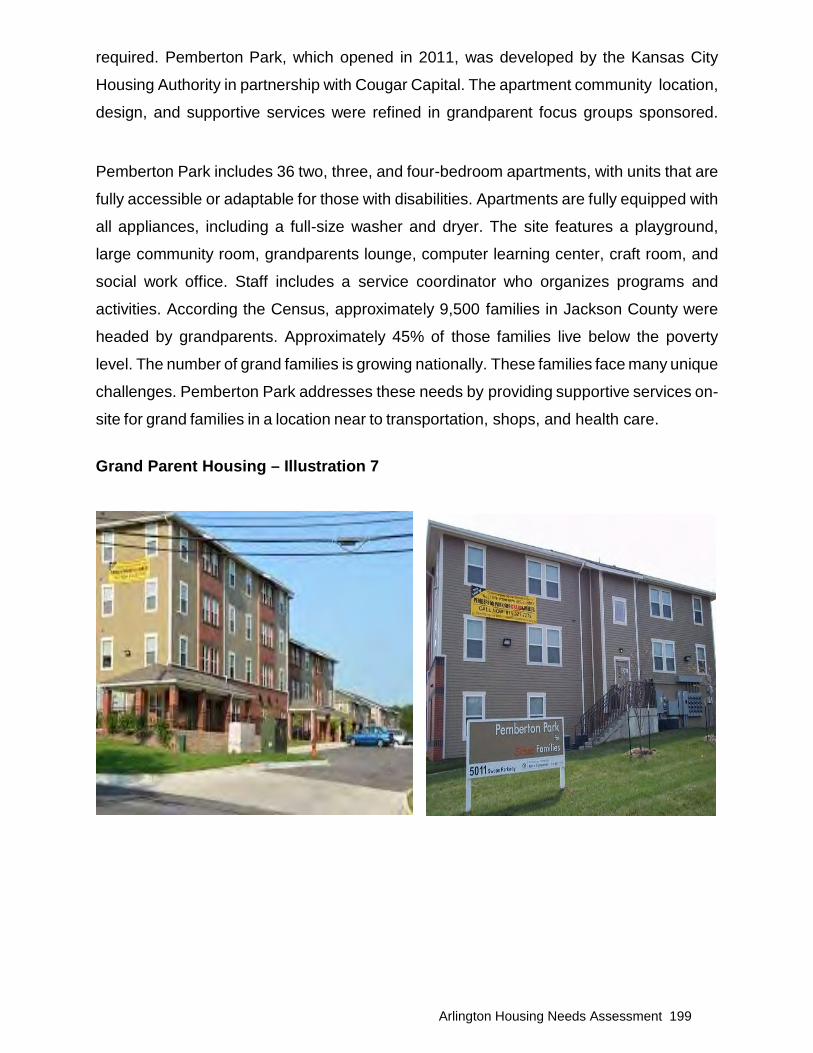
Arlington Housing Needs Assessment 199
required. Pemberton Park, which opened in 2011, was developed by the Kansas City
Housing Authority in partnership with Cougar Capital. The apartment community location,
design, and supportive services were refined in grandparent focus groups sponsored.
Pemberton Park includes 36 two, three, and four-bedroom apartments, with units that are
fully accessible or adaptable for those with disabilities. Apartments are fully equipped with
all appliances, including a full-size washer and dryer. The site features a playground,
large community room, grandparents lounge, computer learning center, craft room, and
social work office. Staff includes a service coordinator who organizes programs and
activities. According the Census, approximately 9,500 families in Jackson County were
headed by grandparents. Approximately 45% of those families live below the poverty
level. The number of grand families is growing nationally. These families face many unique
challenges. Pemberton Park addresses these needs by providing supportive services on-
site for grand families in a location near to transportation, shops, and health care. Grand Parent Housing – Illustration 7
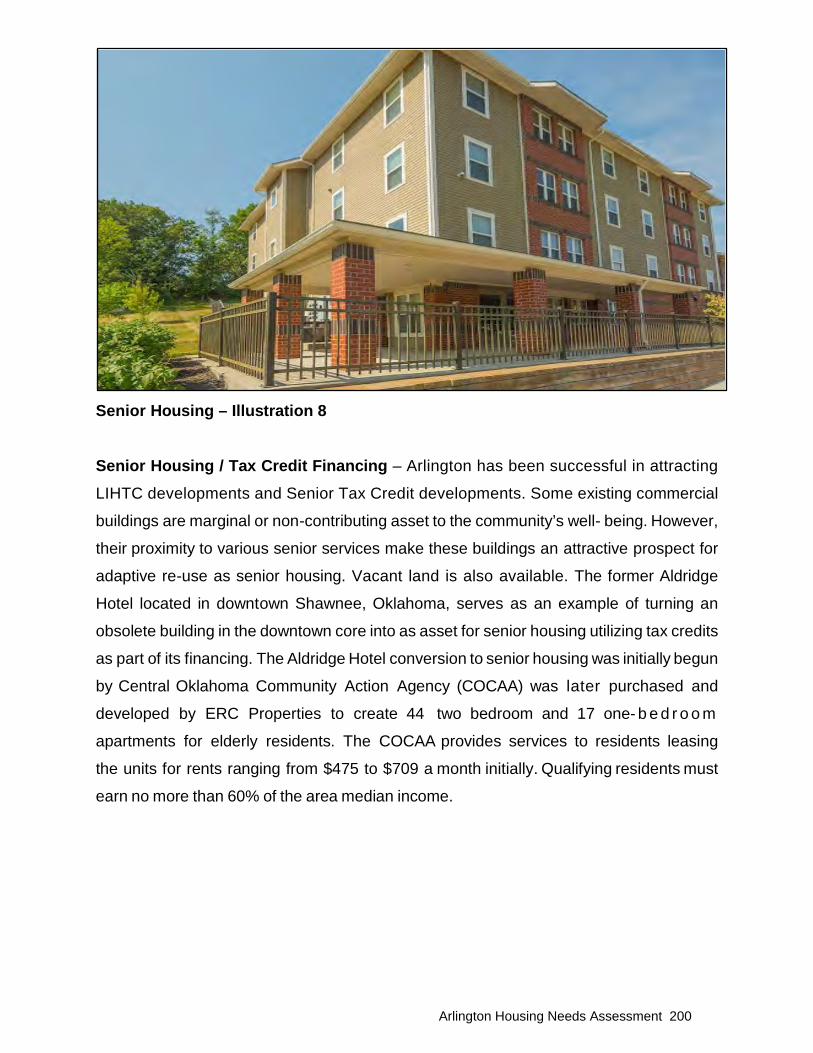
Arlington Housing Needs Assessment 200
Senior Housing – Illustration 8 Senior Housing / Tax Credit Financing – Arlington has been successful in attracting
LIHTC developments and Senior Tax Credit developments. Some existing commercial
buildings are marginal or non-contributing asset to the community’s well- being. However,
their proximity to various senior services make these buildings an attractive prospect for
adaptive re-use as senior housing. Vacant land is also available. The former Aldridge
Hotel located in downtown Shawnee, Oklahoma, serves as an example of turning an
obsolete building in the downtown core into as asset for senior housing utilizing tax credits
as part of its financing. The Aldridge Hotel conversion to senior housing was initially begun
by Central Oklahoma Community Action Agency (COCAA) was later purchased and
developed by ERC Properties to create 44 two bedroom and 17 one- b e d r o o m
apartments for elderly residents. The COCAA provides services to residents leasing
the units for rents ranging from $475 to $709 a month initially. Qualifying residents must
earn no more than 60% of the area median income.

Arlington Housing Needs Assessment 201
Senior Housing – Illustration 9
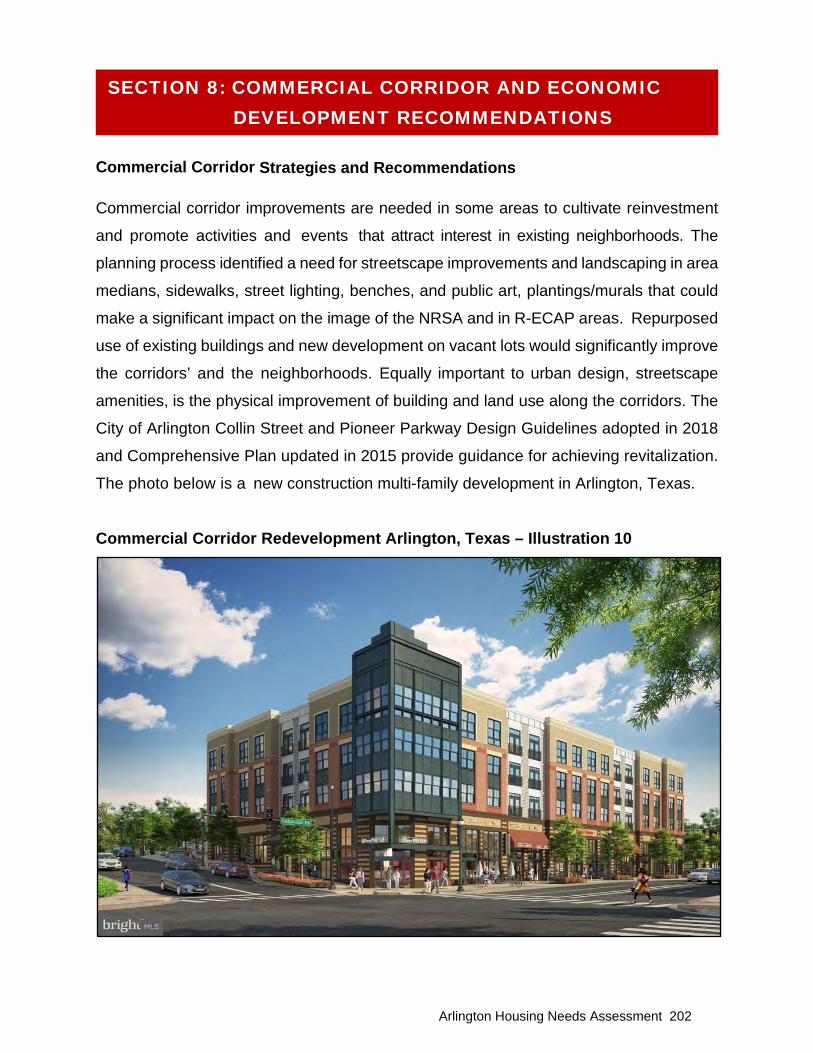
Arlington Housing Needs Assessment 202
Commercial Corridor Strategies and Recommendations Commercial corridor improvements are needed in some areas to cultivate reinvestment
and promote activities and events that attract interest in existing neighborhoods. The
planning process identified a need for streetscape improvements and landscaping in area
medians, sidewalks, street lighting, benches, and public art, plantings/murals that could
make a significant impact on the image of the NRSA and in R-ECAP areas. Repurposed
use of existing buildings and new development on vacant lots would significantly improve
the corridors’ and the neighborhoods. Equally important to urban design, streetscape
amenities, is the physical improvement of building and land use along the corridors. The
City of Arlington Collin Street and Pioneer Parkway Design Guidelines adopted in 2018
and Comprehensive Plan updated in 2015 provide guidance for achieving revitalization.
The photo below is a new construction multi-family development in Arlington, Texas.
Commercial Corridor Redevelopment Arlington, Texas – Illustration 10
SECTION 8: COMMERCIAL CORRIDOR AND ECONOMIC DEVELOPMENT RECOMMENDATIONS
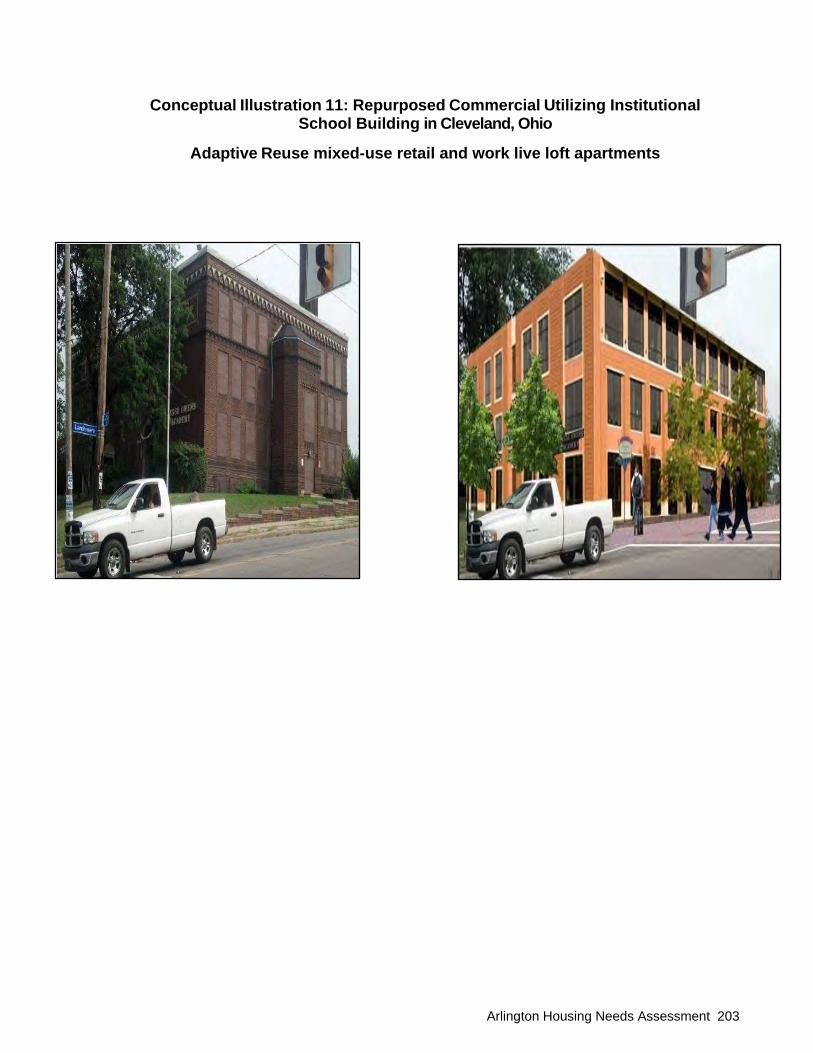
Arlington Housing Needs Assessment 203
Conceptual Illustration 11: Repurposed Commercial Utilizing Institutional School Building in Cleveland, Ohio
Adaptive Reuse mixed-use retail and work live loft apartments

Arlington Housing Needs Assessment 204
Conceptual Illustration 12: Work Live Residential - Street Level Retail
Featuring Urban Design and Streetscape Amenities

Arlington Housing Needs Assessment 205
Conceptual Illustration 13: IKEA furniture kitchen and office in work live loft apartments
Arlington Housing Needs Assessment 206
Economic Development and Job Creation – Economic development along commercial
corridors are needed both to stimulate quality retail and commercial development, but
also to increase economic viability of the areas and job creation for residents.
Increased Vocational Training – Housing is a major issue for persons without high
school diplomas or basic skills, the underemployed, ex-offenders, and others. Programs
are needed linking vocational training and jobs with a person’s attainment of a high
school diploma, basic skills, and ex-offenders in need of employment opportunities. The
following are example programs and approaches that have worked successfully in other
communities:
• Pittsburg Manchester Bidwell Project operates educational and job training
programs in technology, culinary, horticulture and medical fields for
disadvantaged youth.
• State of Louisiana Workforce Commission dual enrollment, work- based
learning, and industry-based certification programs in web design, nursing,
automobile technology and other fields.
• The City of Cleveland Ohio Ex-offender program offers tax and procurement
incentives to businesses that train and employ ex-offenders. Government
contracting policies consider offender training and employment in their criteria for
procuring goods and services. Recently, City of Cleveland criteria for awarding
dry cleaning contracts for city uniform or janitorial contracts for public building were
included.
• Private Business Ex-offender programs are offering opportunities for ex-felons
and opportunity to transaction from incarnation to job training and educational
training. Programs include lodging, job training, GED, and trade school certification
to assist with their re-entry to the job market. One successful program is a culinary
arts program.

Arlington Housing Needs Assessment 207
Edwin’s Restaurant is the first restaurant in Cleveland, Ohio and in the U.S.
specifically created and designed to employ individuals who have been sentenced for
crimes and in most cases served prison time. Employees participate in formal culinary
education programs at local colleges and technical training programs, assistance with
tuition, housing allowances and counseling.
Illustration 14: Edwin’s Restaurant and Culinary Education Program for Ex-Offenders

Arlington Housing Needs Assessment 208
Economic Development and Business Enterprises – Economic development along
commercial corridors are needed both to stimulate quality retail and commercial
development, but also to increase economic viability of the areas and job creation for
residents.
The UTA campus in an important asset and anchor to the commercial corridors along
Collins, Division Street, and Cooper. Businesses that create jobs for area residents
continue to be a strong priority.
One successful example is Arlington’s Center for Business Excellence (CBE) of Central
Texas, founded in 2001 as a partnership between the Arlington Chamber of Commerce
and the University of Texas at Arlington. In a multi-state initiative that includes Texas,
New Mexico, Colorado, Kansas, Oklahoma, Missouri, Arkansas, and Louisiana, both the
Department of Defense and Department of Agriculture have designated the Center for
Innovation in Arlington as their agencies’ office of technology transition and
commercialization.
The Center is the only organization in the nation with technology based economic
development Partnership Intermediary Agreements with multiple federal agencies. The
existing corridors have retail and commercial property that could be converted to
incubator and retail space, based on their location, housing opportunities could be
identified in close proximity and within walking distance to the corridors supported by the
jobs created through the retail and business incubators. Living wages paid by business
enterprises will increase the likelihood of finding affordable housing.
Retail and Business Incubators - are multi-tenant facilities with on-site management
providing technical assistance to firms designed to leave the program financially viable
and freestanding. Business incubator programs usually provide clients with appropriate
rental space and flexible leases, shared business services, equipment, technology
support, and assistance in financing for company growth. Programs are designed to train
and support local food industry entrepreneurs and businesses.

Arlington Housing Needs Assessment 209
Illustration 15: Prototypical Retail Incubator example

Arlington Housing Needs Assessment 210
Adaptive Reuse Architecture Example
The Vandergriff Building C, located at 1928 Arlington TX – The Vandergriff development includes
the adaptive re-use of 2 story building, Beaux- Arts styled commercial construction as offices.
ERN Architects prepared applications for Federal, Historic Tax Credits and obtained listing
on the National Register. 16,300 square feet. SCM Real Estate Services, Arlington, Texas.
Arlington Housing Needs Assessment 211
A Housing Policy is a statement developed by jurisdictions on a city, county, or regional
basis. The policy is designed to guide the community beyond individual perceptions, ideas
and disconnected interpretations as to what are our housing needs and goals and how
do we achieve those goals, and toward creating consensus and vision for an overall
housing strategy that ensures that policies relative to housing and neighborhood needs,
development, and future sustainability, are well-coordinated and well-tailored to meet
diverse needs and objectives. The policy is generally developed based on discussions
and consensus building involving board community representation, government’s
guidance and with a diverse group of stake holders providing input throughout the
planning process.
The needs assessment recommends developing individual housing policies for Arlington,
focusing on implementation of the needs assessment recommendations and on
addressing issues of housing supply, affordability, location, future needs, amenities, and
quality to ensure that housing is available for individuals and families at all income levels.
Important to the process is how each jurisdiction will address housing needs based on
both future growths, as well as current and future sustainability. Challenges include
forecasting and addressing special needs including housing for seniors, multi-family
housing, downtown housing, public and assisted housing, work force housing and
housing supporting economic growth.
SECTION 9: HOUSING POLICY RECOMMENDATIONS
Arlington Housing Needs Assessment 212
Implementation - The Needs Assessment recommendations are designed to guide
implementation of actions and solutions identified in the report. The recommendations
should be divided into categories of short-term, mid-term and long-term for purposes of
estimating timeframes to carry out the implementation program. The categories and
timeframes identified to guide implementation may vary depending upon resources
required for implementation or public policy and regulatory changes that must be
enacted before implementation can occur. Short-term implementation actions should include evaluation of the recommendations
contained in the report to determine fiscal impact, policy implications and to what extent
recommendations and timeframes for implementation should be adjusted to meet the
needs of individual jurisdictions. Formal adoption of the Needs Assessment by Arlington
is recommended. Adoption of the Needs Assessment will underscore the importance of
this effort to those who must carry out the implementation. The City of Arlington will be responsible for post-planning activities and determine the level
of community involvement necessary for implementation. The strategies and
recommendations of the report are intended to guide the implementation of the Plan.
The stakeholders, including neighborhood residents, home buyers, business, industry,
local school districts and colleges, and religious institutions should be encouraged to
continue to provide leadership in refining the recommendations and transforming the
planning area through implementation of the needs assessment and plan
recommendations.
The initiatives and programs described in the Needs Assessment may require further
study for implementation and in some instance, pilot programs can be used to further
evaluate their potential application in individual jurisdictions. An evaluation and revision
process should be considered providing for annual auditing of accomplishments and
adjustments as needed, to be successful.
SECTION 10: IMPLEMENTATION
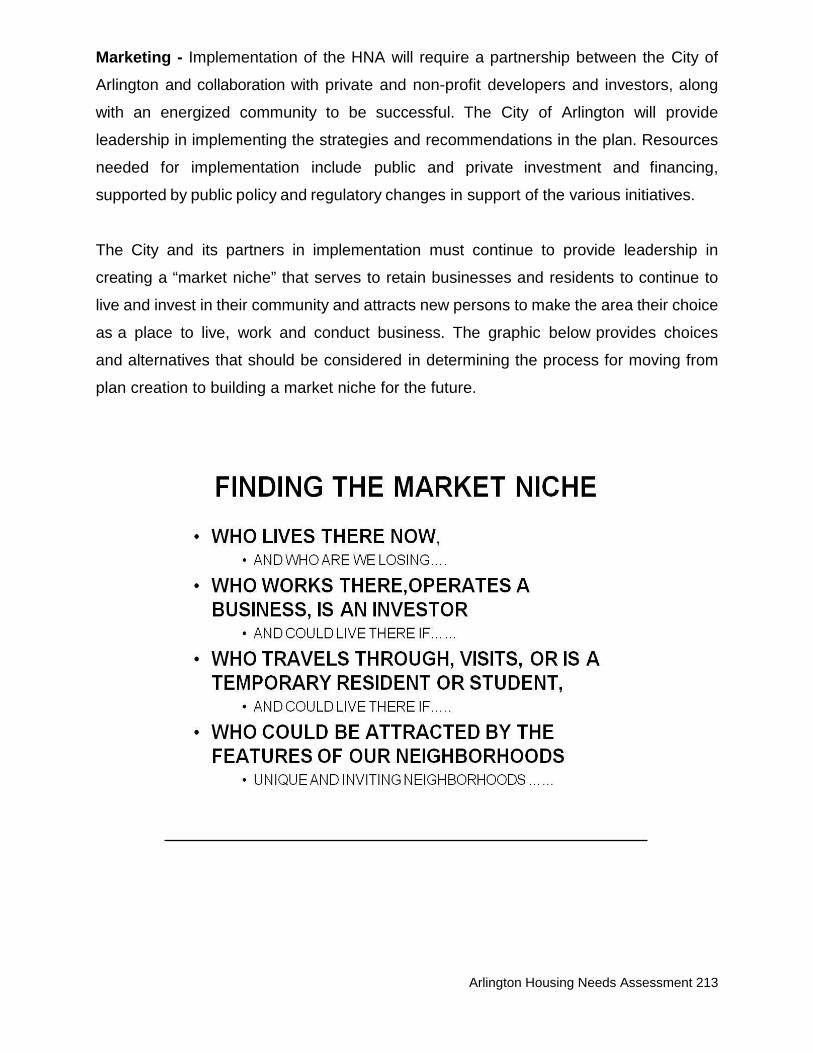
Arlington Housing Needs Assessment 213
Marketing - Implementation of the HNA will require a partnership between the City of
Arlington and collaboration with private and non-profit developers and investors, along
with an energized community to be successful. The City of Arlington will provide
leadership in implementing the strategies and recommendations in the plan. Resources
needed for implementation include public and private investment and financing,
supported by public policy and regulatory changes in support of the various initiatives.
The City and its partners in implementation must continue to provide leadership in
creating a “market niche” that serves to retain businesses and residents to continue to
live and invest in their community and attracts new persons to make the area their choice
as a place to live, work and conduct business. The graphic below provides choices
and alternatives that should be considered in determining the process for moving from
plan creation to building a market niche for the future.
214
Introduction The recommendations and strategies presented in this section are intended to address
housing needs emerging from the housing market, demographic, economic and
trends analyses. Recommendations were refined based on interviews, focus group
sessions and surveys. The strategies and recommendations are based on four
fundamental principles. First, the recommendations are based on broad strategies that
collectively address a wide range of physical, financial, development, economic, quality
of life, policy and regulatory issues that potentially impact future housing needs.
Quantitative data collected from national, federal, state, and local sources and qualitative
data gathered from community input of residents, industry, businesses, and other
stakeholders, provided the basis for the recommendations reported in this section. The
recommendations focus on diverse types of housing development strategies needed to
achieve future housing projections ranging from creating new development consistent
with emerging development patterns in areas experiencing various levels of growth,
increasing reinvestment, reversing decline and disinvestment, and strategies creating a
greater infusion of resources to help reverse decline and to support sustainability.
Secondly, the HNA addresses needed improvements to the basic attributes of a clean and
safe community, adequate delivery of government services, convenient access to quality
retail and commercial services, development of affordable housing, recreation for all age
groups, effective regulatory enforcement, and programmatic enhancements that ensure
a reasonable quality of life for residents.
Third, the HNA identifies strategies aimed at ensuring future housing needs are met and recommends increased resources that can be dedicated to maintaining existing housing through innovative programming. This includes partnerships between government, business, industry and community with emphasis on cultivating and expanding community support.
SECTION 11: RECOMMENDATIONS – IMPLEMENTATION
SHORT-TERM, MID-TERM AND LONG-TERM GOALS

215
Fourth, the HNA emphasizes that implementers and policy makers directing the
implementation process and enacting housing policies make tough decisions relative to
resource targeting, leveraging of resources, and the priorities and timelines associated
with each recommendation outlined in the overall HNA.
Finally, the disparity between resource availability and existing needs, dictate that careful
planning and consensus building be at the forefront of implementation to ensure that
priority is given to the most critical issues facing the City of Arlington. These fundamental
principles serve as a starting point for launching the implementation of the HNA.
Implementation of strategies in response to key issues may require additional
customization to address the specific needs in Arlington. Some actions and
recommendations are a conceptual framework for addressing future housing needs and
include prototypical best practice examples demonstrating how other communities have
dealt with similar issues. Therefore, some recommendations will require further research,
analysis, and final program design by the City for implementation.
Recommendations - The Needs Assessment recommendations are designed to guide
implementation of actions and solutions identified in the report. The recommendations
are divided into categories of short-term (2 years), mid-term and long-term (3 to 5 years)
for purposes of estimating timeframes to carry out the implementation program. The
categories and timeframes identified to guide implementation may vary depending upon
resources required for implementation or public policy and regulatory changes that must
be enacted before implementation can occur. Implementation - Implementation actions should include evaluation of the
recommendations contained in the report to determine fiscal impact, policy implications
and to what extent recommendations and timeframes for implementation should be
adjusted to meet the needs of individual jurisdictions. Formal adoption of the Needs
Assessment by Arlington is recommended. Adoption of the Needs Assessment will
underscore the importance of this effort to those who must carry out the implementation.
The City of Arlington will be responsible for post-planning activities and determine the level
of community involvement necessary for implementation. The strategies and
recommendations of the report are intended to guide the implementation of the Plan.
216
SHORT TERM RECOMMENDATIONS
Restoring the “Basic Attributes” of existing housing and neighborhoods - Success in meeting future housing needs, developing housing that is affordable to a wide
range of consumers, and stimulating revitalization and reinvestment in existing areas must
include addressing needed improvements to the community’s basic attributes. These
attributes include public safety, street maintenance, clean streets, timely infrastructure
improvements, trash collection, brush collection, well maintained buildings, and vacant
lots regularly mowed and free of debris, regular yard maintenance, and a general
neighborhood appearance and level of community involvement that suggests that people
care about their community. These basic attributes tend to shape both the way a
community sees itself and how non-residents entering the community view it as well. In
an effort to achieve this goal of improved basic attributes, the following are proposed
strategies and recommendations identified for Arlington and prototypical examples of
their application to specific areas that may also be applied throughout the city, as
appropriate.
o Enhance communities’ image, identity, and physical attributes
o Deconcentrate poverty, race-ethnicity, and public and assisted housing
o Define area destination and purpose
o Reclaim vacant lots for residential development
o Improve neighborhood identity, marketing, and branding
o Improve neighborhood image and physical attributes
o Create new mixed-use development, mixed housing types
o Improve access to recreation, retail, and desired destinations
o Enhance gateway and corridor improvements
o Introduce new residential types and financing for housing development that
increase affordability
Arlington Housing Needs Assessment 217
Economic Development and Job Creation – Economic development along commercial
corridors are needed both to stimulate quality retail and commercial development, but also to
increase economic viability of the areas and job creation for residents.
Increased Vocational Training – Housing is a major issue for persons without high school
diplomas or basic skills, the underemployed, ex-offenders, and others. Programs are needed
linking vocational training and jobs with a person’s attainment of a high school diploma,
basic skills, and ex-offenders in need of employment opportunities. The following are example
programs and approaches that have worked successfully in other communities:
o Pittsburg Manchester Bidwell Project operates educational and job training
programs in technology, culinary, horticulture and medical fields for disadvantaged
youth.
• State of Louisiana Workforce Commission dual enrollment, work- based learning,
and industry-based certification programs in web design, nursing, automobile
technology and other fields.
• The City of Cleveland Ohio Ex-offender program offers tax and procurement
incentives to businesses that train and employ ex-offenders. Government contracting
policies consider offender training and employment in their criteria for procuring goods
and services. Recently, City of Cleveland criteria for awarding dry cleaning contracts
for city uniform or janitorial contracts for public building were included.
• Private Business Ex-offender programs are offering opportunities for ex-felons and
opportunity to transaction from incarnation to job training and educational training.
Programs include lodging, job training, GED and trade school certification to assist with
their re-entry to the job market. One successful program is a culinary arts program.

Arlington Housing Needs Assessment 218
MID-TERM – LONG-TERM RECOMMENDATIONS
Housing for Senior and Disabled Persons -
The Texas Demographic Center projects a 116% increase in senior population from 2010 to
2030, by far the fastest growing group among all age ranges. As the population increase so
will the number of households headed by seniors over 65 need for future housing units. An
estimated 4,989 (21%) of seniors are renters and 18,321 (79%) are owners. Additionally, 68
percent of senior households are spending more than 30 percent of their monthly income on
rental cost, an increase from 62% in 2010. Senior (65+) households are projected to be 26
percent of total households by 2025, adding over 14,000 people to this group. Senior housing
preferences are changing demonstrating some shift from the single family housing where they
raised a family to smaller cluster homes, condominiums, multi-family rental, and active senior
developments depending on income and equity in larger homes no longer needed, and the
need to reduce maintenance and other cost associated with remaining in older but larger
homes.
The Balanced Housing model forecast a needed increase of 21,404 total households by 2025
and projects seniors (65+) will account for 56 percent (11,917) of needed units projected. The
following types of housing are recommended for seniors and strategies for addressing future
housing needs are detailed in Section 6 of the HNA Report.
o Cottage or cluster housing as it is sometimes called, provides a smaller unit for the
elderly as a homeownership option or as an alternative to continuing ownership of a
larger unit that essentially over-houses them or has become too costly to maintain.
o Intergenerational or shared housing provides a shared residence which houses a single
elderly adult or senior who shares the unit with an unrelated single adult or single parent
with dependent children. In a structured family unit, they share common areas such as
kitchen and living room, and have their own private bedroom, semi-private bath. The
purpose of intergenerational housing is to provide longer term transitional housing
seniors and families needing supportive services.
o Rehabilitation of existing residential structures, single family infill on vacant lots and
increased financing is needed in existing neighborhoods in marginal or poor condition.

Arlington Housing Needs Assessment 219
Existing residential is an essential component of the supply of single-family affordable
housing for both home ownership and rental. The need for infill housing on vacant lots and
rehabilitation of existing multi-family housing needed is evident in the Fuller Street
Corridor and other neighborhoods.
o Accessibility Modifications funding is needed to support persons with disabilities,
especially elderly low-income individuals and families needing modifications to their
home to allow for greater mobility. The improvements may include, but are not limited
to installation of ramps, safety rails or widening of doorways. The number of households
assisted by this program for 2018 was 10.
Texas Economic Development 4A and 4B Funding in Support of Homeownership - While younger demographics currently have a homeownership rate of 13 percent, they are
expected to favor homeownership as they age, marry or have families. Many will still prefer
rental housing located in mixed use districts, entertainment districts and in and around
downtown. The Arlington Downtown Plan and Neighborhood Revitalization Strategy Area
Plan creates a transformation vision for revitalization of the downtown and target areas
through reinvestment in housing, infrastructure, and economic development. Section 4B
Financing and City of Arlington CDBG and HOME Entitlement Grants can be used to leverage
private investment. This housing development initiative serves as a catalyst to attract
additional private sector investment in housing, business, and commercial development,
creating economic opportunity and sustainable neighborhoods in the target area.
Lease Purchase Housing Financing – Lease purchase is another option for home buyers
seeking to qualify for mortgage financing. A viable tool for cash-poor, but gainfully employed
households, lease/purchase programs traditionally allow you to rent a home for some preset
period of time with a portion of the rental payment going toward the down-payment to help
purchase the rented property. Lease purchase programs allows a buyer
to make rental payments virtually equal to the mortgage payments they will eventually pay
on a loan they can assume after several years of adequate credit and loan payment behavior.
Financial Literacy - The first considerations when attempting to increase homeownership
rates should include improving the financial literacy and home buying preparedness of
potential buyers. Homebuyer counseling programs work with buyers to address their

Arlington Housing Needs Assessment 220
creditworthiness and help them work through any issues that may interfere with their ability
to qualify for a home mortgage. Banks and credit agencies will work with buyers to educate
them on their maintenance responsibilities as homeowners. Homebuyer education classes
are a pre-requisite for homebuyer assistance programs providing down payment assistance.
The 18 to 35-year-old demographic is impacted by financial literacy even more. The City
should consider working with local school districts to increase courses that provide financial
literacy education for high school juniors and seniors. Local lending institutions and real
estate professionals should be recruited to assist in curriculum development. The City may
consider working with school districts to identify funding for pilot programs. Opportunity Zones - The Federal Opportunity Zone Program is a community and economic
development tool that aims to drive long-term private investment into low-income communities
throughout the country. The program was established by Congress in the Tax Cuts and Jobs
Act of 2017 and encourages investors with recently realized capital gains to invest in local
businesses, real estate, or development projects in exchange for a reduction in their tax
obligations. There are areas in the City of Arlington designated by the Governor to be a part of
this program. The program incentivizes investors to make equity investments in Opportunity
Zone-based businesses and development projects. These areas include downtown and NRSA
designated areas.
Inclusionary Zoning - Inclusionary Zoning (IZ) refers to a set of strategies that aim to create
balanced housing development and mixed-income communities by ensuring that some portion
of new housing development is affordable. This strategy may be appropriate to encourage a
mix of incomes in the City of Arlington where development may create neighborhoods of
homogenous home prices and residents of similar incomes. Mixed-income communities
broaden access to services and jobs, as well as provide openings through which lower-wage
earning families can buy homes in appreciating housing markets and accumulate wealth.
Inclusionary Zoning policies can be voluntary or mandatory. Perhaps the best know example
of a mandatory inclusionary zoning policy is that of Montgomery County, Maryland, which was
enacted in 1974. The policy requires developments of more than 50 units to include 15 percent
moderately priced dwelling units. Of that, two-thirds (15%) are sold to moderate-income first-
time homebuyers and the remainder can be purchased by the local housing commission or
local non-profits for use in their affordable rental programs.
Arlington Housing Needs Assessment 221
In 2019, the City of Austin approved a Voluntary IZ plan to increase the amount of affordable
housing by loosening zoning restrictions and providing incentives for higher densities in
affordable and mixed-income developments. The City hopes to make more housing available
to residents for whom the cost of living in Austin is becoming out of reach. Affordability
Unlocked, a density bonus program, aims to cut through barriers in the City’s land development
code that can make building of affordable and multi-family housing difficult, if not impossible,
by waiving many requirements as well as granting incentives in exchange for building housing
that meets the program’s criteria.
As a baseline, 50 percent of housing in a development must be affordable. That means rentals
must be priced for families earning 60 percent or less of median family income for the area,
with some required at 50 percent of MFI. Home-buying prices must be affordable at 80 percent
of MFI and below. If their projects meet baseline criteria, those offering deeper affordability
could earn additional site privileges (essentially amounting to bonuses that increase density
and thus total rentable or saleable space), including height increases above a zoning district’s
current limits.
Housing Trust Fund - A companion to the Inclusionary Zoning regulations would be to
establish a local housing trust fund. The Housing Trust Fund operates similarly to the
federal entitlement grant programs providing funding to achieve affordability in other
developments that benefit low-moderate income persons. The State of Texas provides
competitive grants to support local housing trust funds as well. Developers could
alternatively satisfy the creation of a portion of the required IZ affordable units by making
a payment in lieu to the trust fund and the City would utilize trust fund dollars as leverage
for CDBG and HOME program funded housing initiatives.
On Going Program Implementation Recommendations – Section 6 and Section 7
outline additional recommendations not included in the Short and Long Term Goals in this
Appendix. These include existing programs and initiatives currently operated by the City
of Arlington that should be continued and in some instances expanded as funding is
available, to impact more people.

Arlington Housing Needs Assessment 222
Nonprofit Development Incentives - Discussions are already underway regarding
increased incentives and funding for nonprofit and CHDO developers and should be
considered an important short term goal. Considerations should be given to providing tax
abatements and building fee / permitting rebates to help reduce the cost of development.
Substantially Equivalent local Fair Housing Ordinance - Recommendations such as local
fair housing legislation and enforcement and addressing racial and ethnic concentrated
poverty and disparate impact should be further evaluated as long-term goals.
Green technology, energy efficiency in construction, and visitable housing standards to
enhance accessibility have been identified as recommendations that should be evaluated
by the City for inclusion in building codes.
Special Needs – Many in the LGBTQ+ community are seeking help in addressing needs
including healthcare, homelessness, housing discrimination, access to housing,
transportation, goods, and services.

Arlington Housing Needs Assessment 223
January 2019 to
APPENDICES
APPENDIX A: DEFINITIONS AND ACRONYMS
APPENDIX B: BALANCED HOUSING MODEL DATA APPENDIX B: HOUSING SURVEY DATA AND RESULTS
APPENDIX A: DEFINITIONS AND ACRONYMS
APPENDIX C: APPLICATION OF HOUSING NEEDS ASSESSMENT METHODOLOGY
APPENDIX D: SECONDARY MARKET CITY COMPARISON TABLES
APPENDIX E: TRANSISTIONAL NEIGHORHOOD ANALYSIS
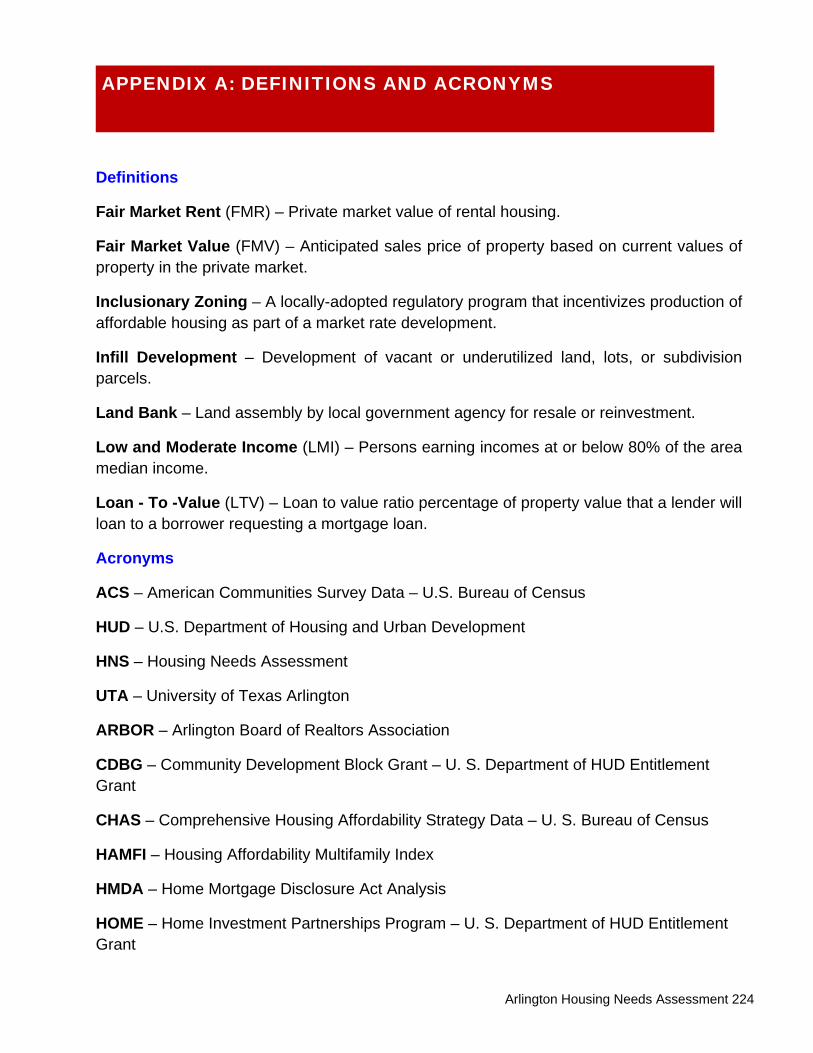
Arlington Housing Needs Assessment 224
Definitions
Fair Market Rent (FMR) – Private market value of rental housing.
Fair Market Value (FMV) – Anticipated sales price of property based on current values of property in the private market.
Inclusionary Zoning – A locally-adopted regulatory program that incentivizes production of affordable housing as part of a market rate development.
Infill Development – Development of vacant or underutilized land, lots, or subdivision parcels.
Land Bank – Land assembly by local government agency for resale or reinvestment.
Low and Moderate Income (LMI) – Persons earning incomes at or below 80% of the area median income.
Loan - To -Value (LTV) – Loan to value ratio percentage of property value that a lender will loan to a borrower requesting a mortgage loan.
Acronyms
ACS – American Communities Survey Data – U.S. Bureau of Census
HUD – U.S. Department of Housing and Urban Development
HNS – Housing Needs Assessment
UTA – University of Texas Arlington
ARBOR – Arlington Board of Realtors Association
CDBG – Community Development Block Grant – U. S. Department of HUD Entitlement Grant
CHAS – Comprehensive Housing Affordability Strategy Data – U. S. Bureau of Census
HAMFI – Housing Affordability Multifamily Index
HMDA – Home Mortgage Disclosure Act Analysis
HOME – Home Investment Partnerships Program – U. S. Department of HUD Entitlement Grant
APPENDIX A: DEFINITIONS AND ACRONYMS
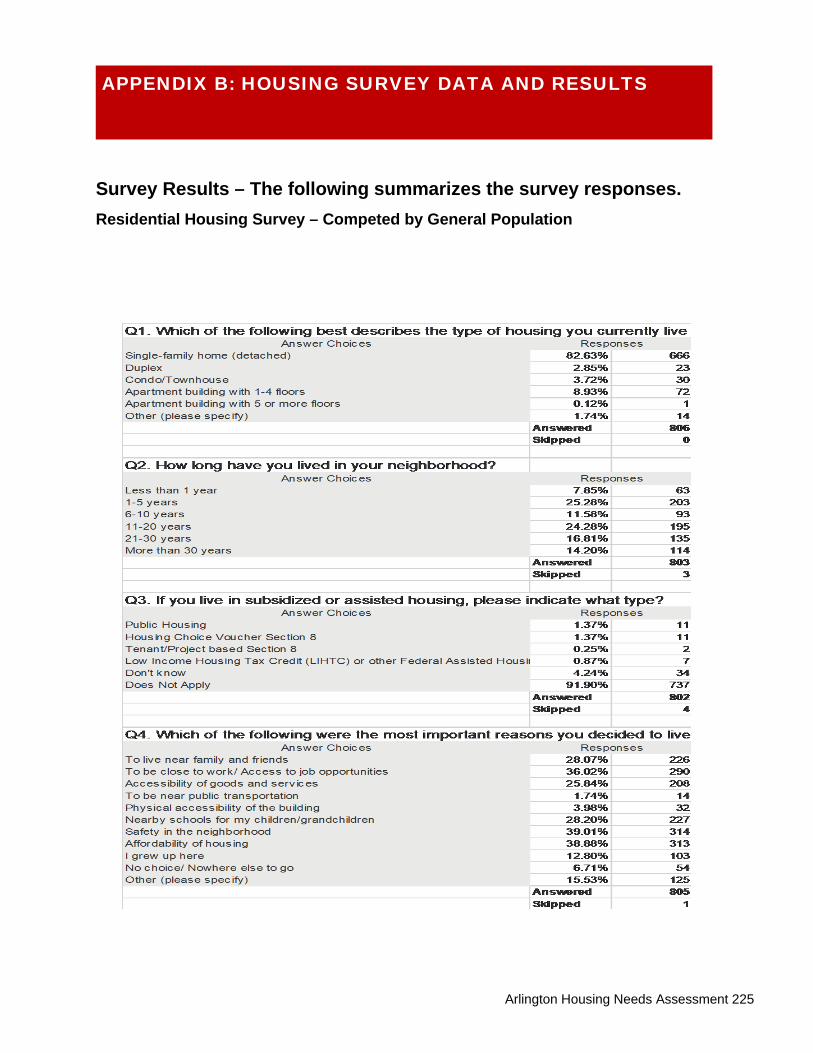
Arlington Housing Needs Assessment 225
Survey Results – The following summarizes the survey responses. Residential Housing Survey – Competed by General Population
APPENDIX B: HOUSING SURVEY DATA AND RESULTS
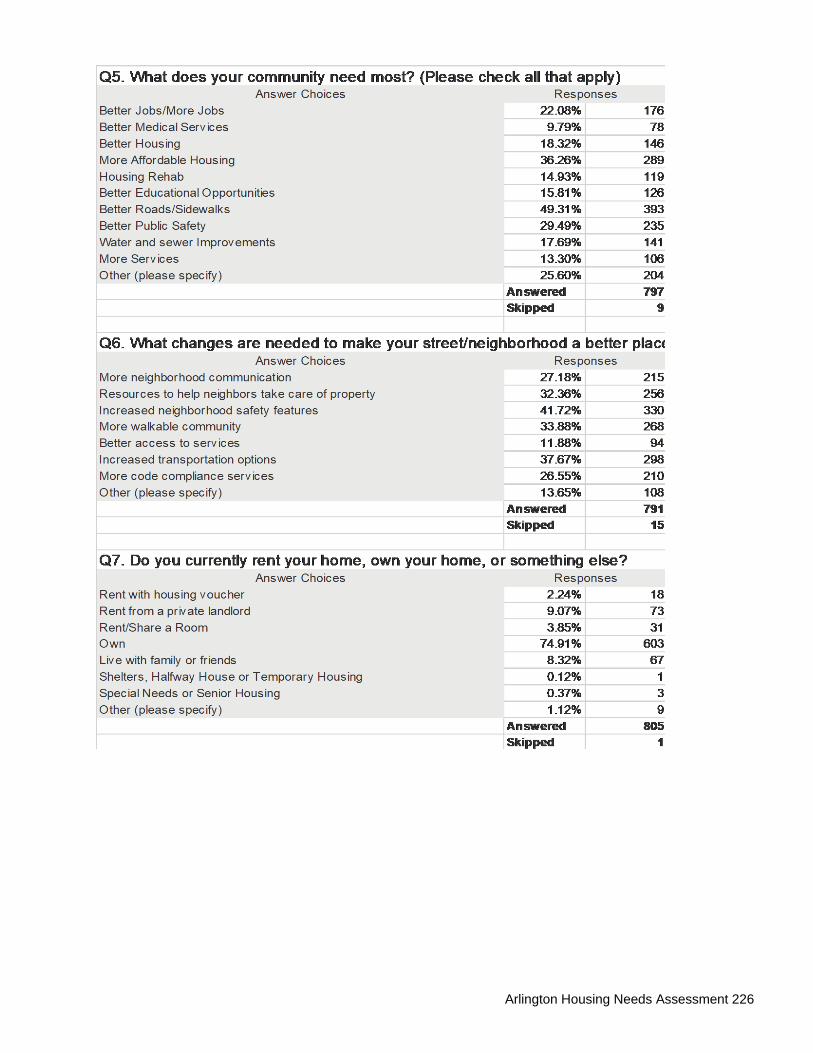
Arlington Housing Needs Assessment 226
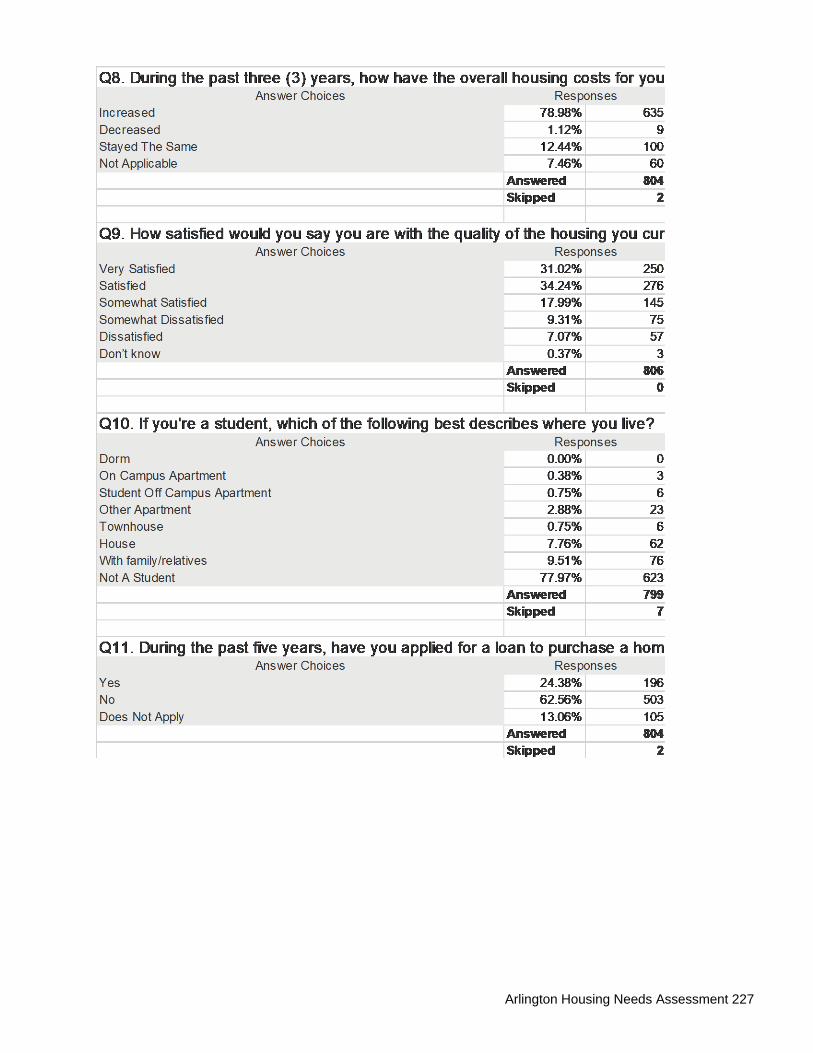
Arlington Housing Needs Assessment 227
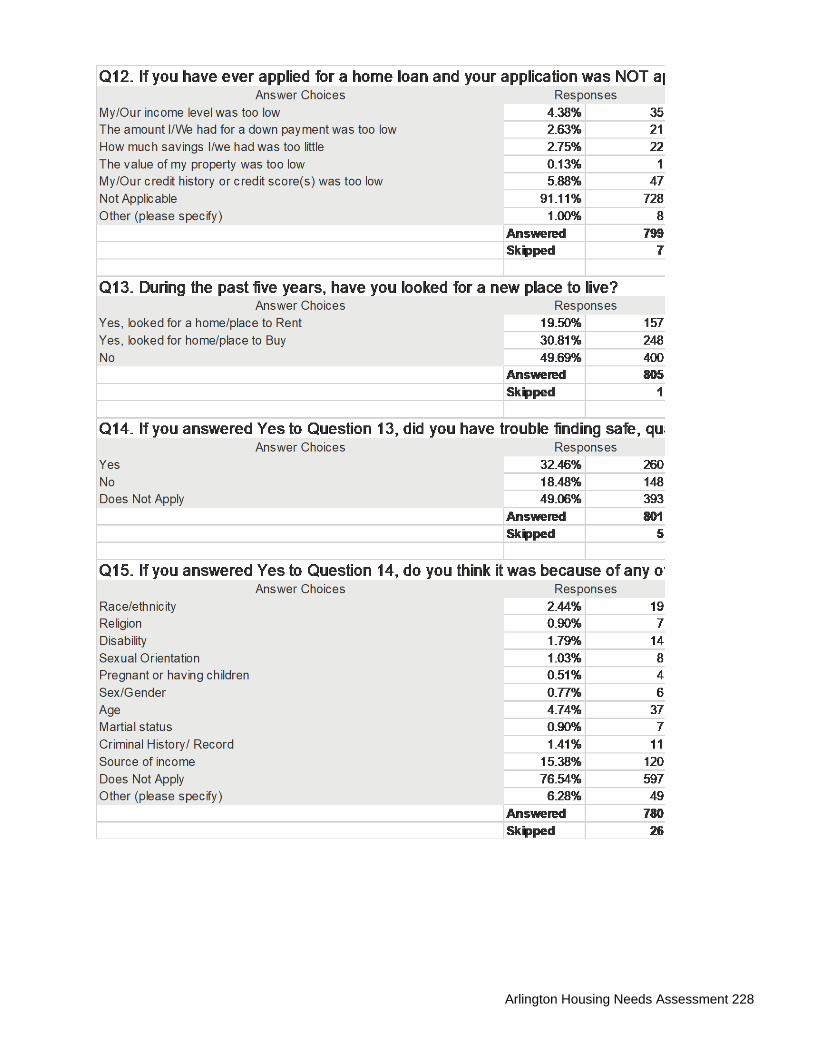
Arlington Housing Needs Assessment 228
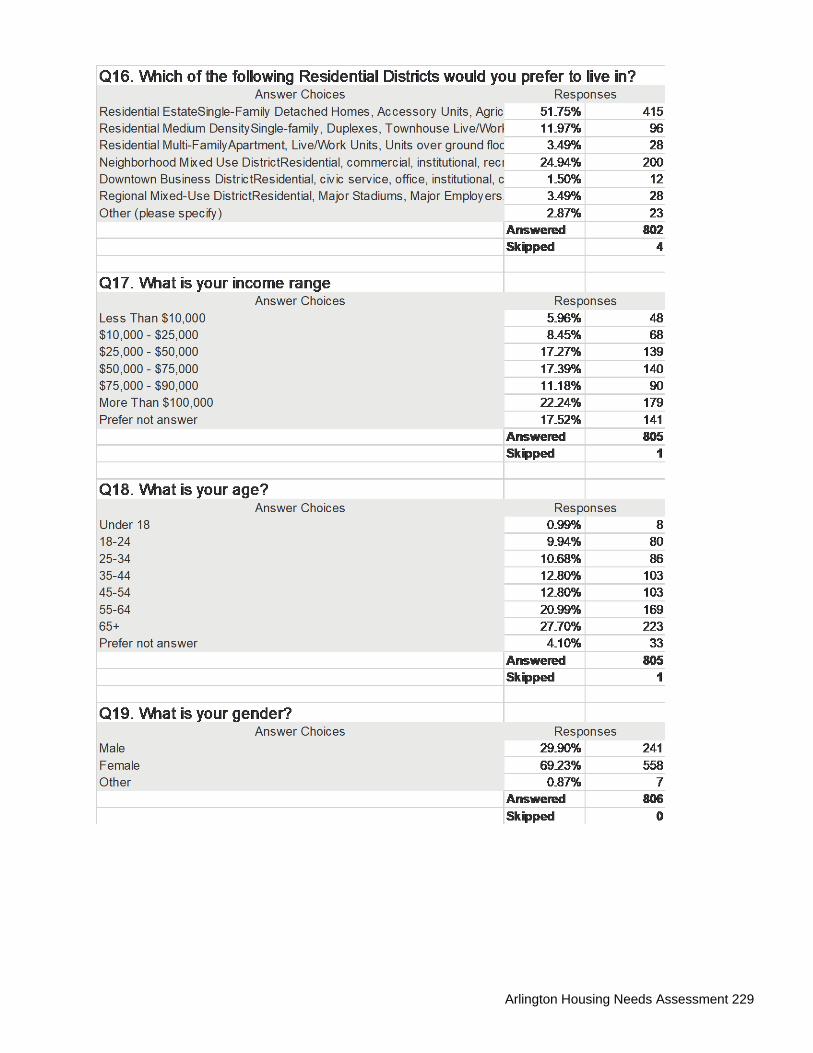
Arlington Housing Needs Assessment 229
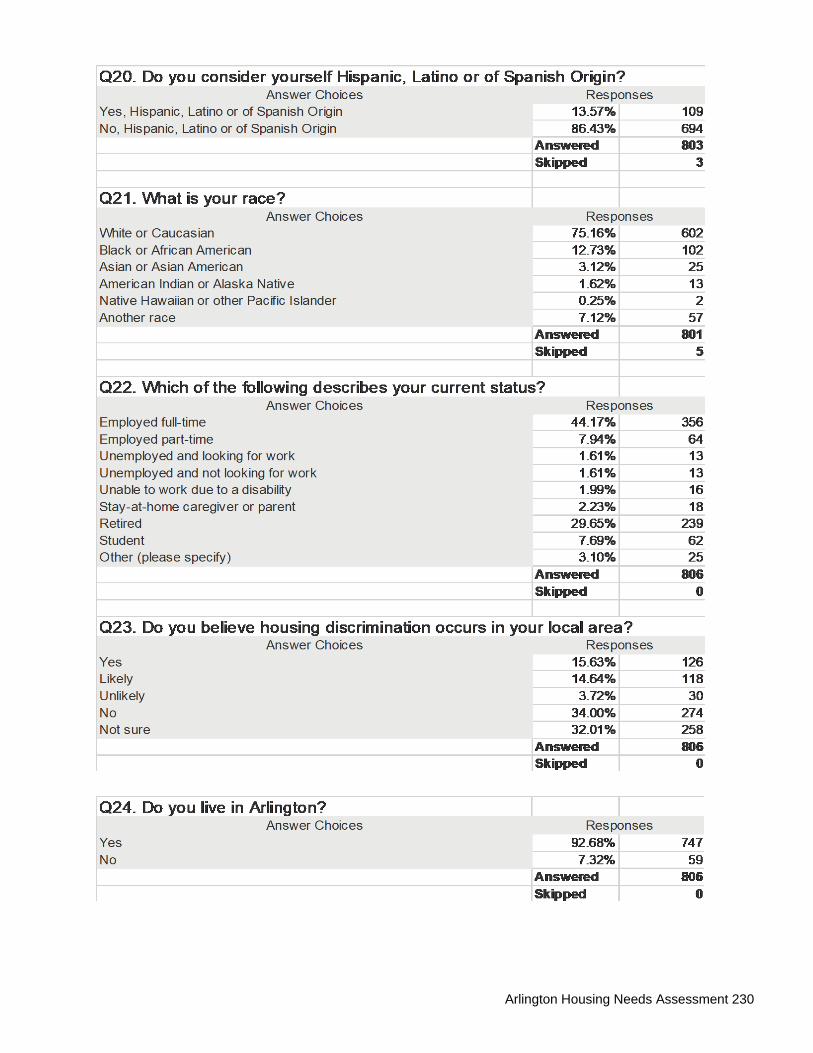
Arlington Housing Needs Assessment 230

Arlington Housing Needs Assessment 231
Arlington Housing Authority Survey Results – Completed by AHA Clients
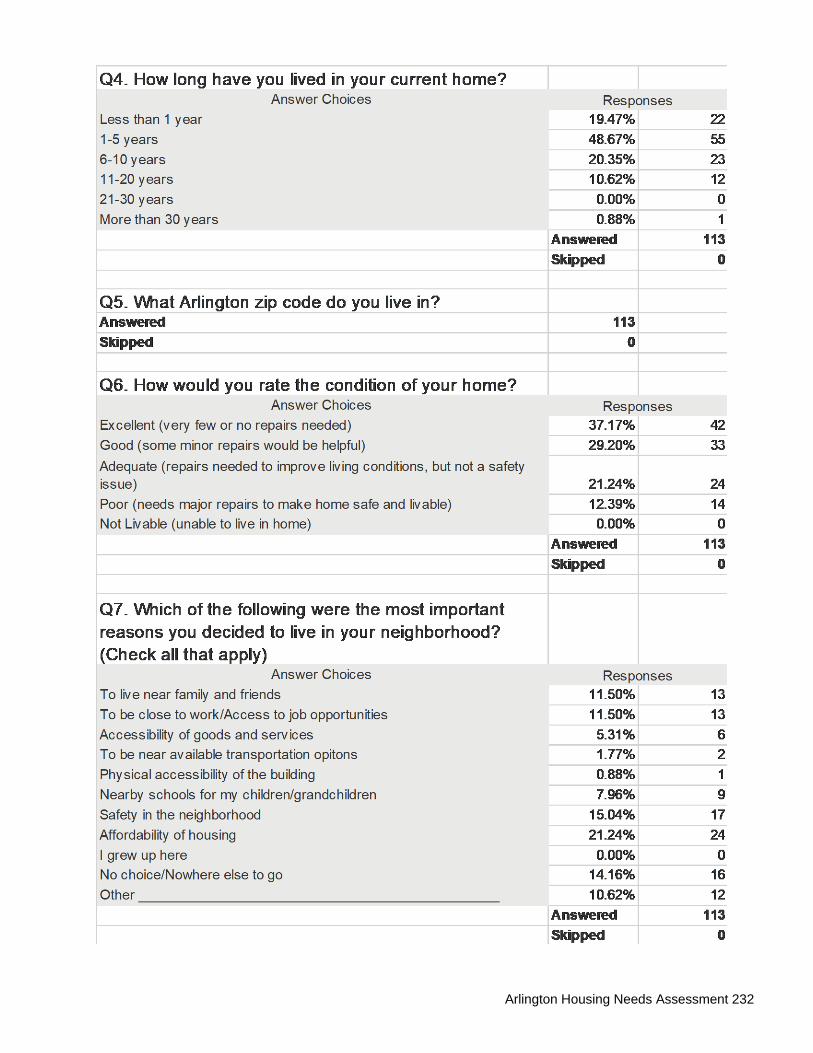
Arlington Housing Needs Assessment 232

Arlington Housing Needs Assessment 233

Arlington Housing Needs Assessment 234
Q11. During the past five (5) years, have you looked for
new place to live?
Answer Choices Responses
Yes, looked for a home/place to Rent 55.3
Yes, looked for home/place to Buy 10.7
No 29.4
Don’t remember 4.4
Answered 1
Skipped
Q12. If you answered Yes to Question 12, did you have
trouble finding safe, quality housing that you could affor
in a neighborhood you would like to live in?
Answer Choices Responses
Yes, 61.61% 69
No 15.18% 17
Don’t know 8.04% 9
Does not apply 15.18% 17
Answered 112
Skipped 1
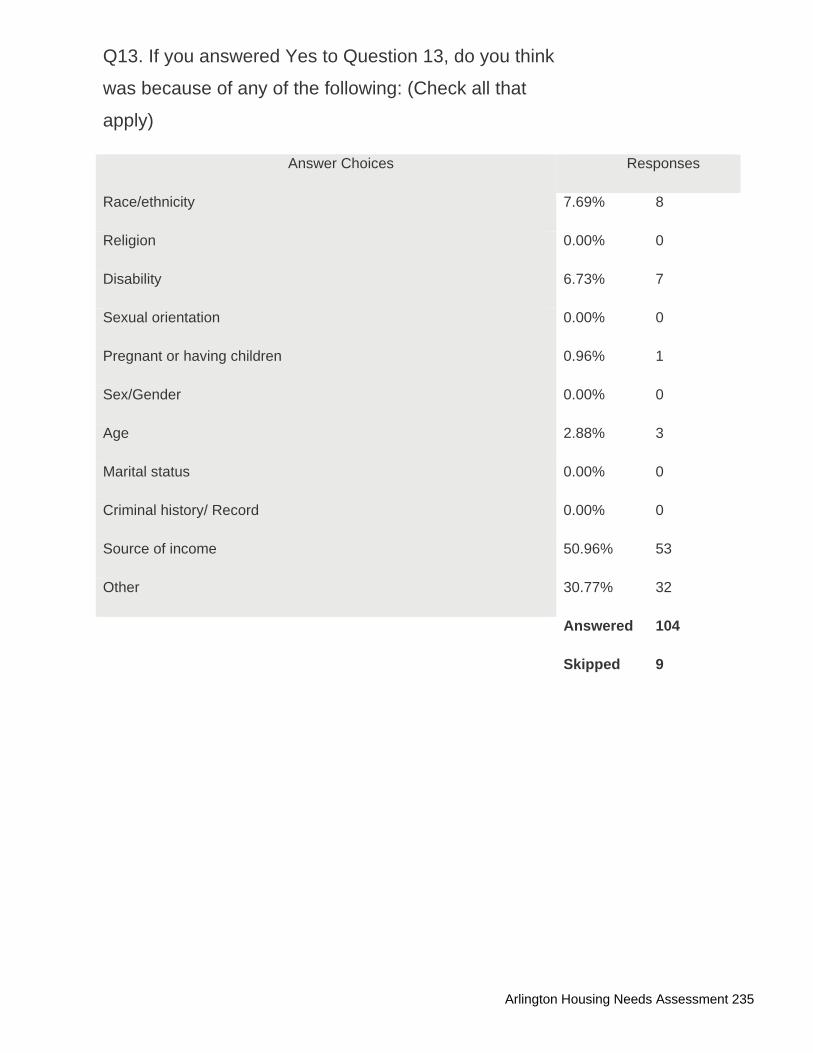
Arlington Housing Needs Assessment 235
Q13. If you answered Yes to Question 13, do you think
was because of any of the following: (Check all that
apply)
Answer Choices Responses
Race/ethnicity 7.69% 8
Religion 0.00% 0
Disability 6.73% 7
Sexual orientation 0.00% 0
Pregnant or having children 0.96% 1
Sex/Gender 0.00% 0
Age 2.88% 3
Marital status 0.00% 0
Criminal history/ Record 0.00% 0
Source of income 50.96% 53
Other 30.77% 32
Answered 104
Skipped 9
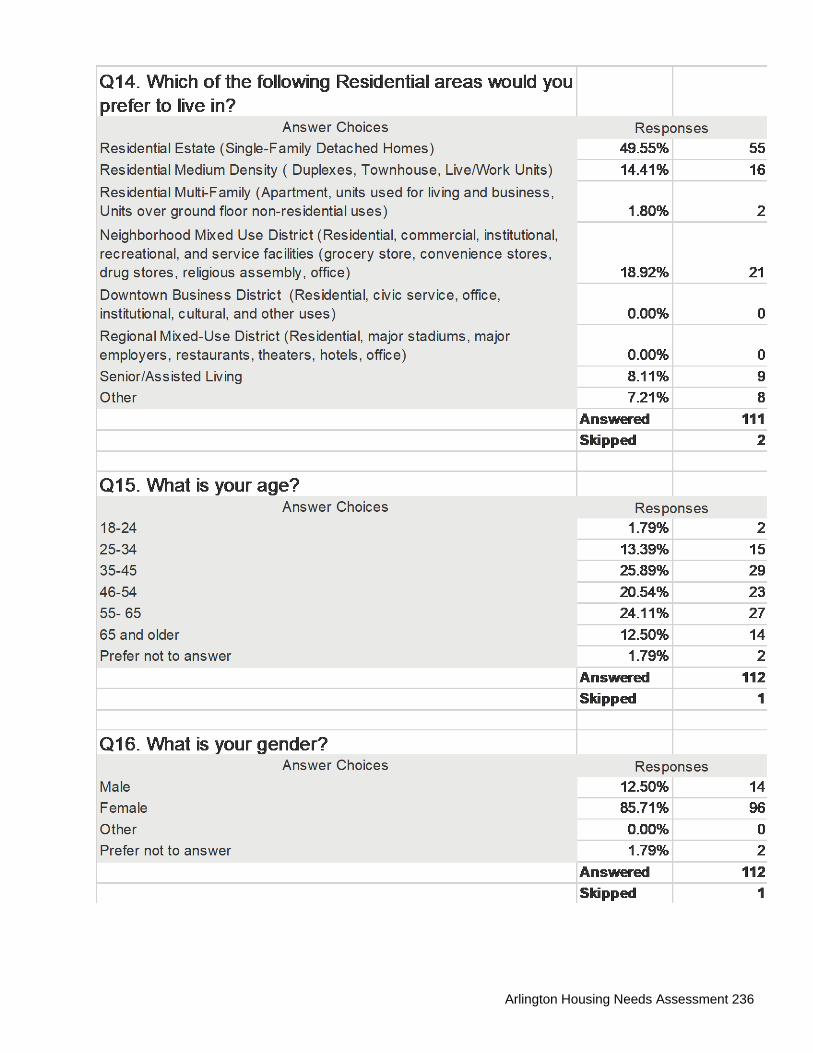
Arlington Housing Needs Assessment 236
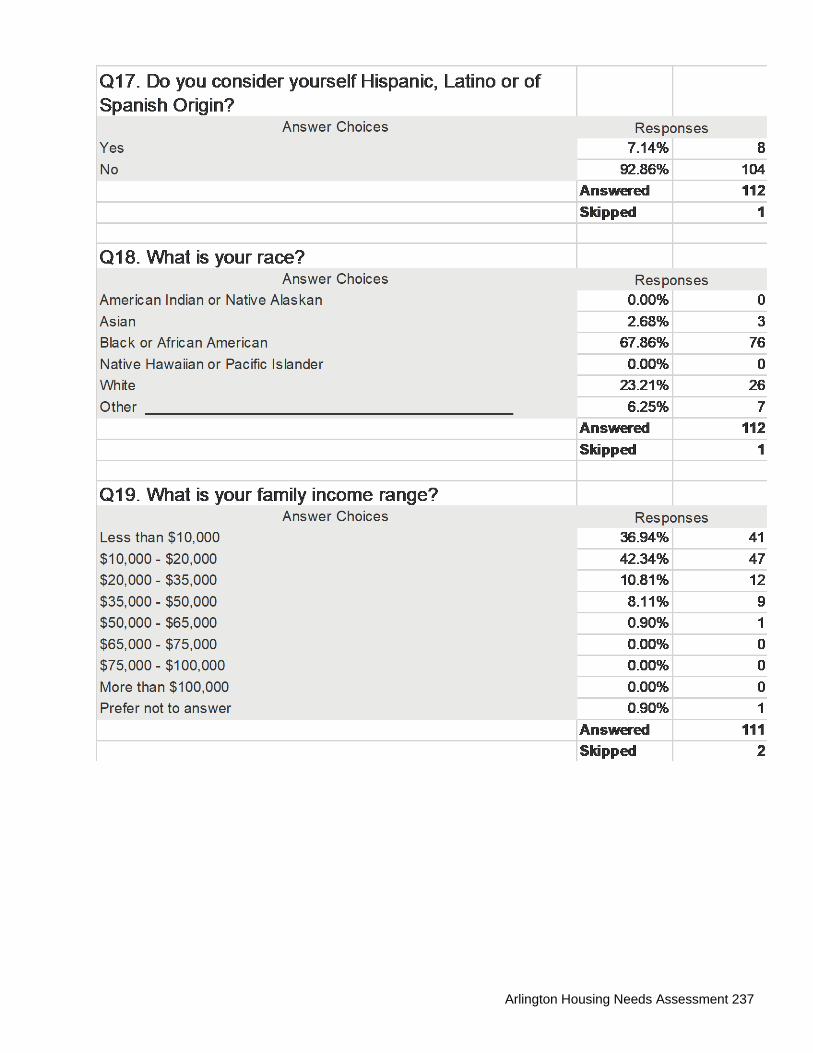
Arlington Housing Needs Assessment 237
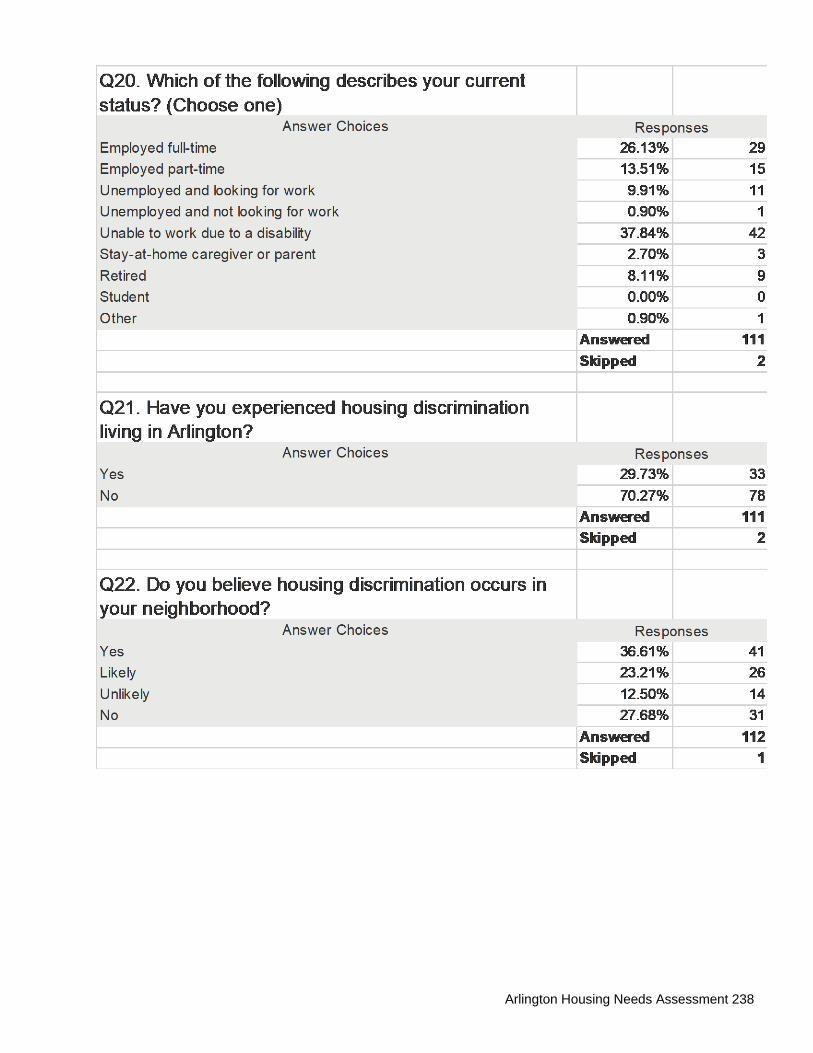
Arlington Housing Needs Assessment 238
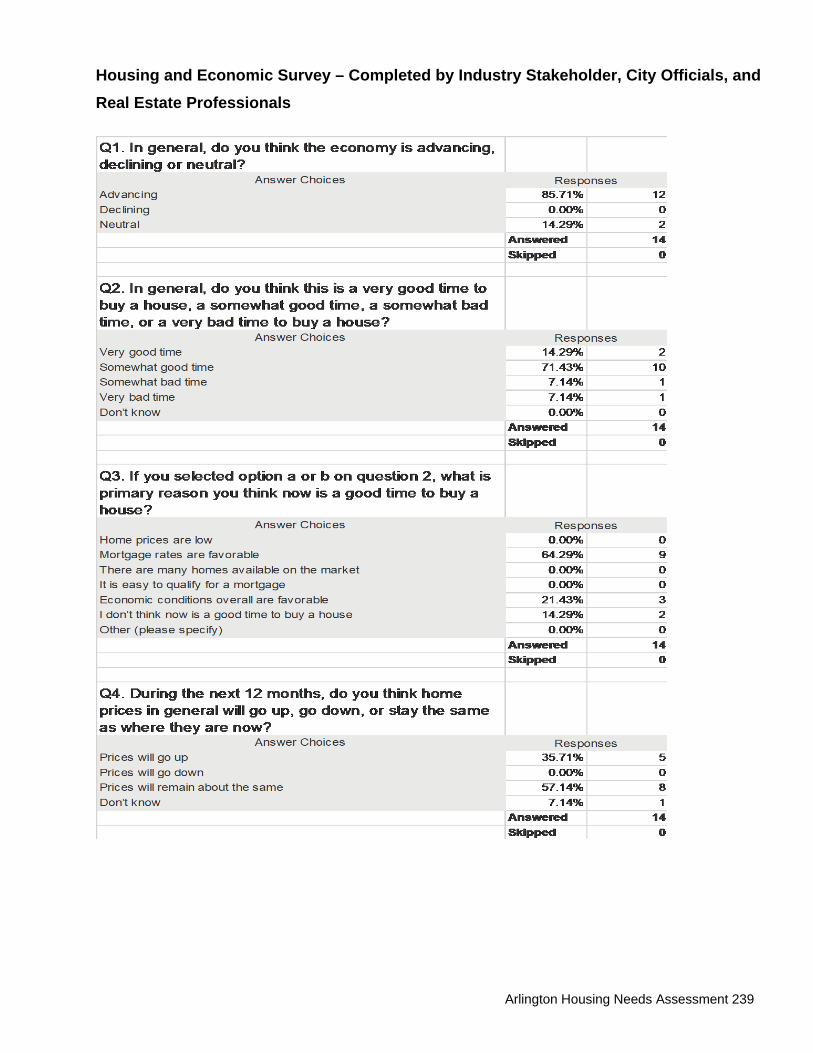
Arlington Housing Needs Assessment 239
Housing and Economic Survey – Completed by Industry Stakeholder, City Officials, and Real Estate Professionals

Arlington Housing Needs Assessment 240
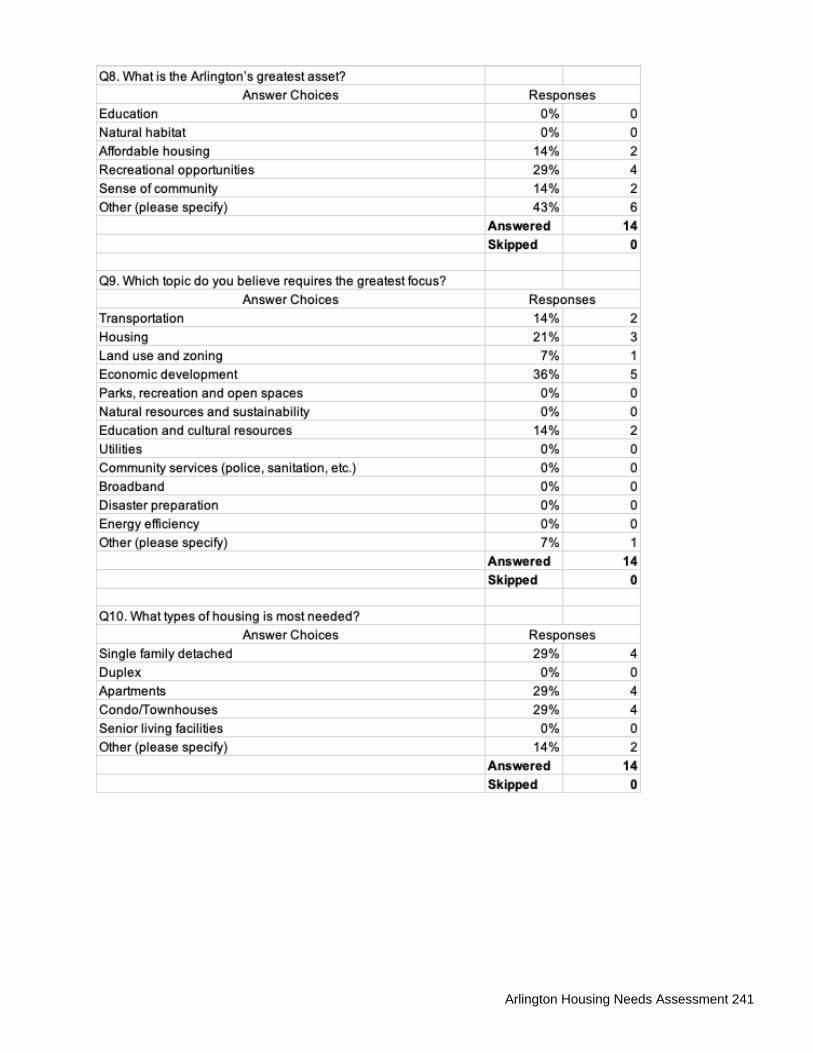
Arlington Housing Needs Assessment 241

Arlington Housing Needs Assessment 242

Arlington Housing Needs Assessment 243
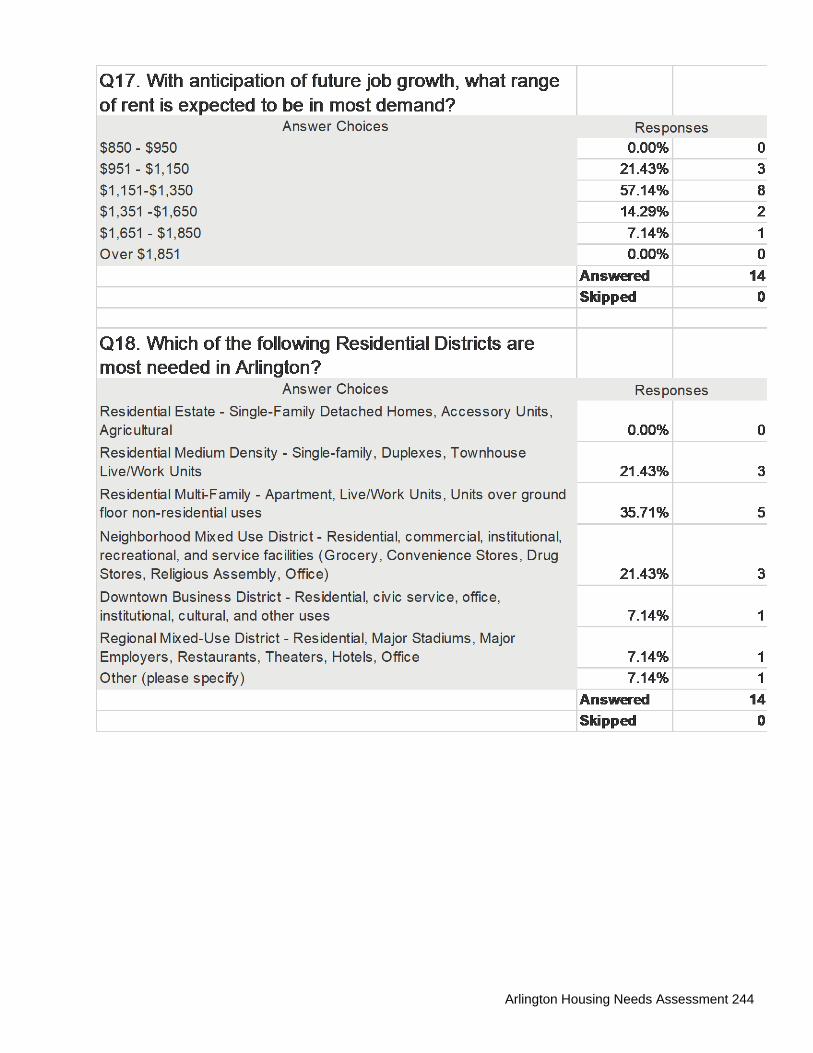
Arlington Housing Needs Assessment 244

Arlington Housing Needs Assessment 245
Arlington Board of Realtors Focus Group Session Survey

Arlington Housing Needs Assessment 246

Arlington Housing Needs Assessment 247
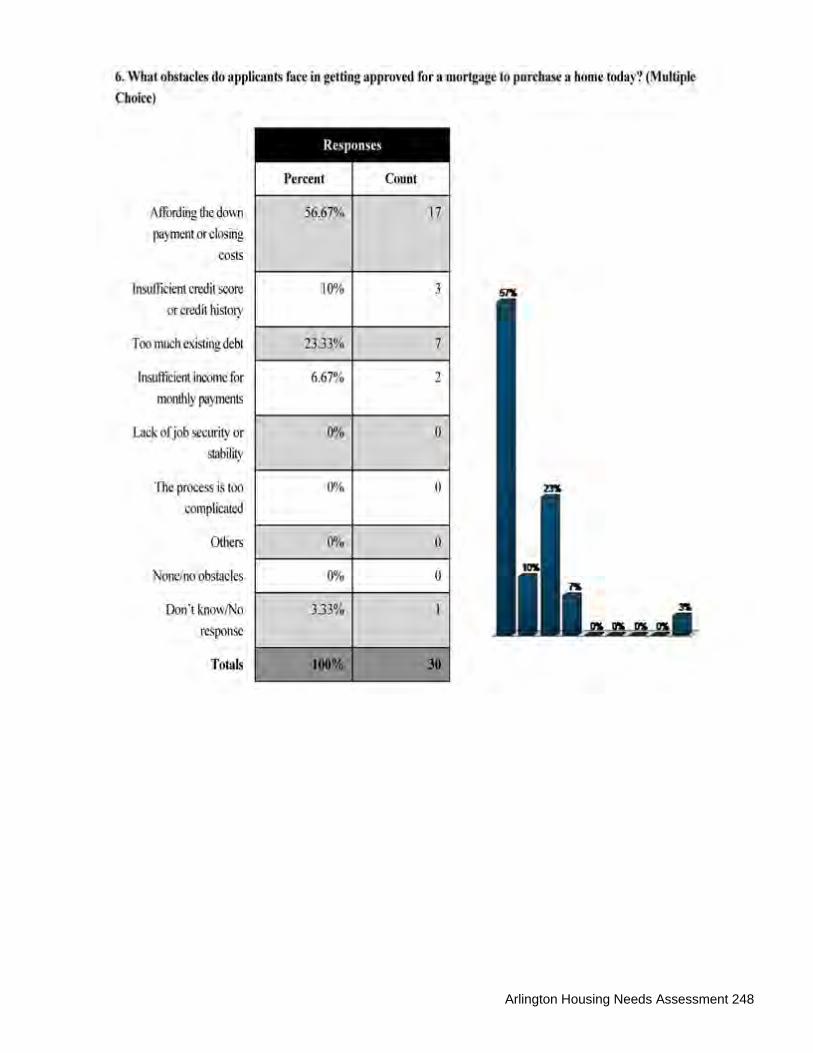
Arlington Housing Needs Assessment 248

Arlington Housing Needs Assessment 249
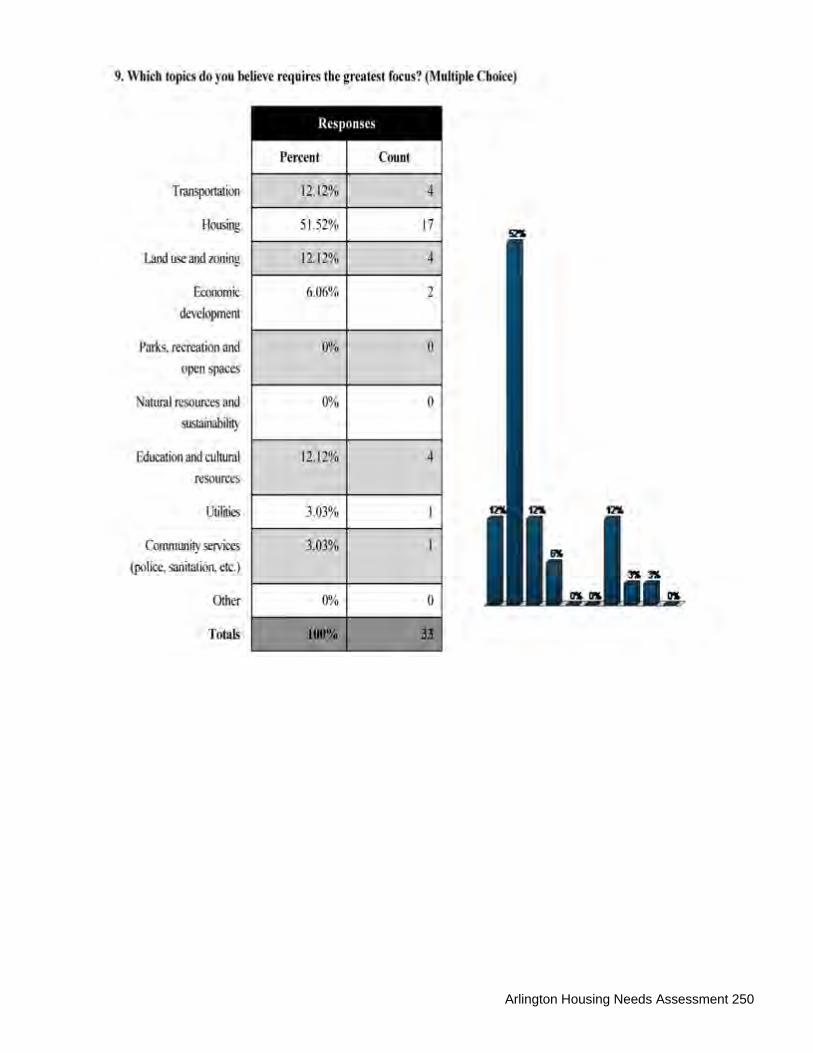
Arlington Housing Needs Assessment 250

Arlington Housing Needs Assessment 251

Arlington Housing Needs Assessment 252

Arlington Housing Needs Assessment 253

Arlington Housing Needs Assessment 254
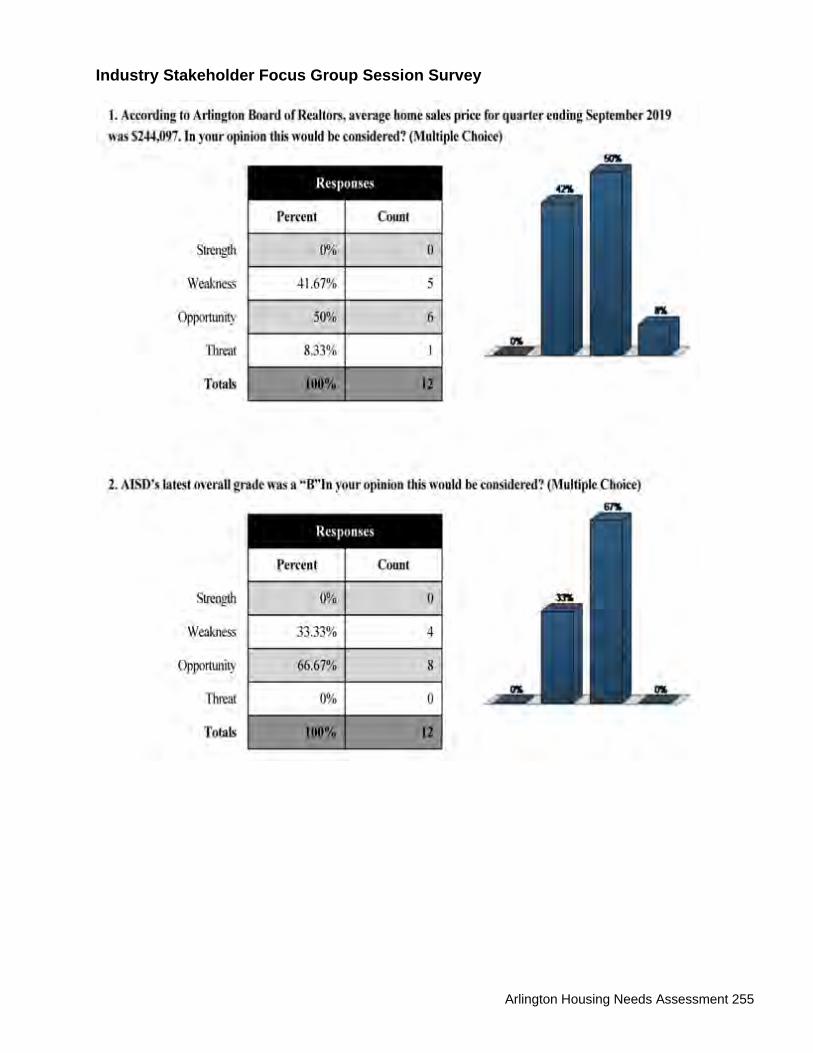
Arlington Housing Needs Assessment 255
Industry Stakeholder Focus Group Session Survey

Arlington Housing Needs Assessment 256

Arlington Housing Needs Assessment 257

Arlington Housing Needs Assessment 258

Arlington Housing Needs Assessment 259

Arlington Housing Needs Assessment 260

Arlington Housing Needs Assessment 261
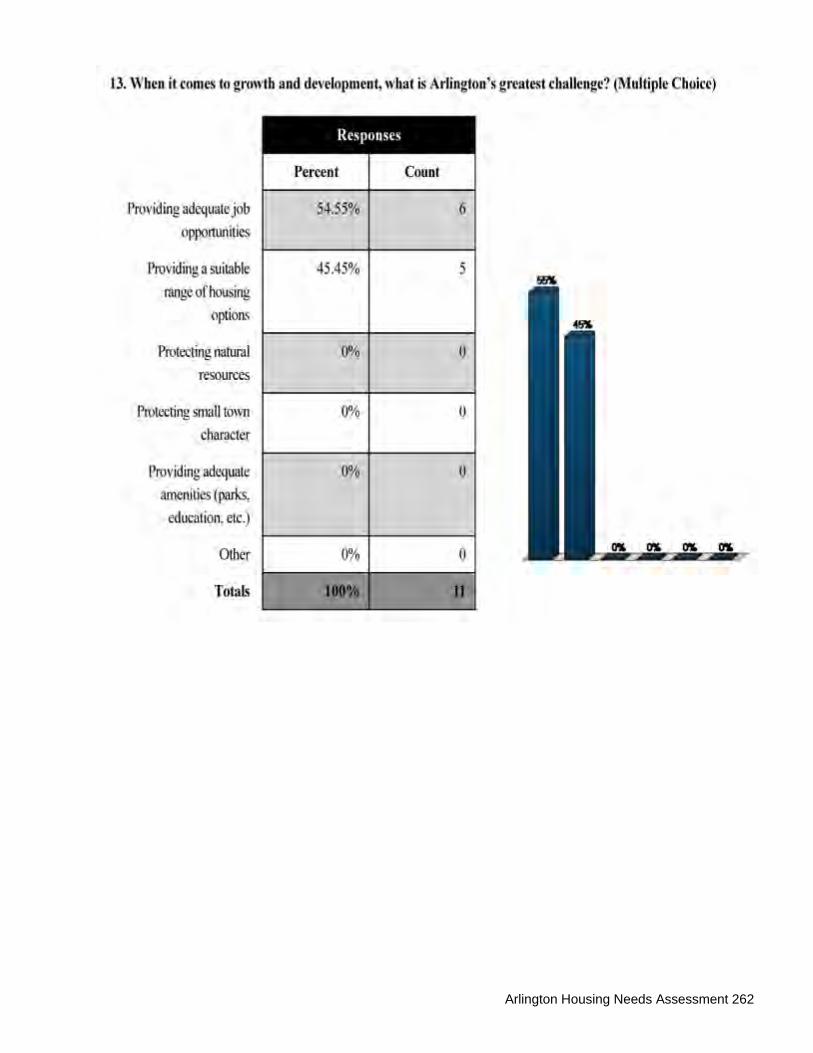
Arlington Housing Needs Assessment 262

Arlington Housing Needs Assessment 263

Arlington Housing Needs Assessment 264
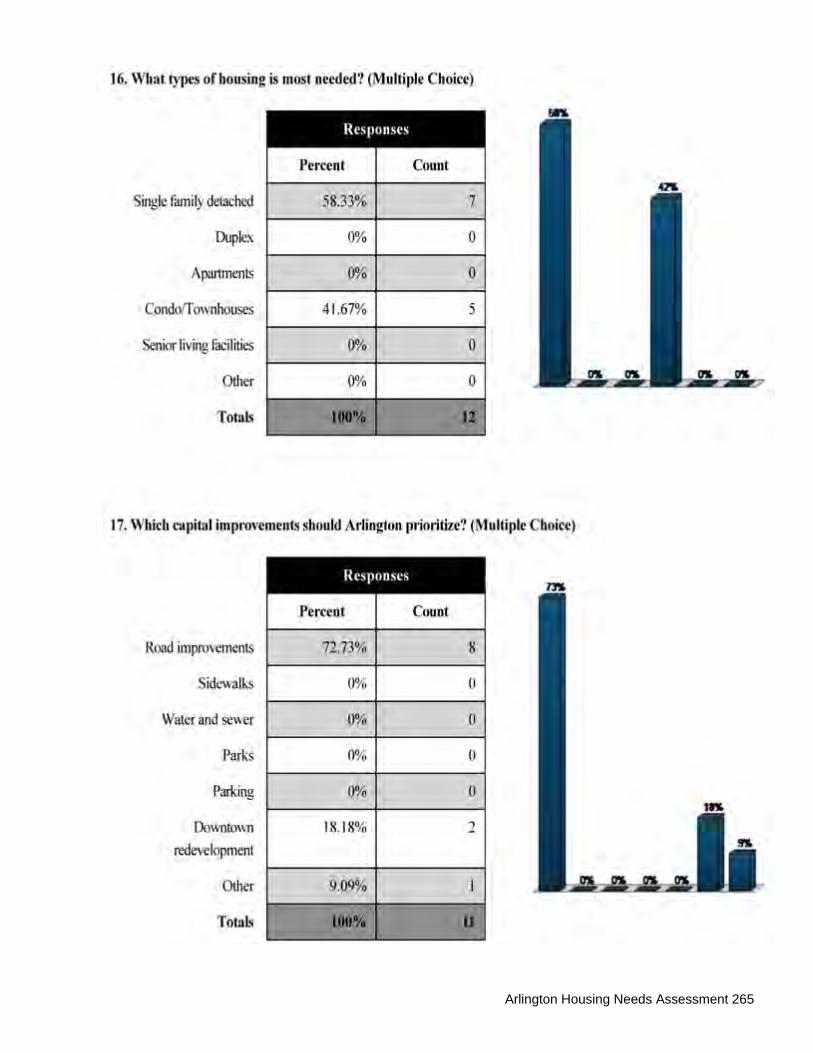
Arlington Housing Needs Assessment 265
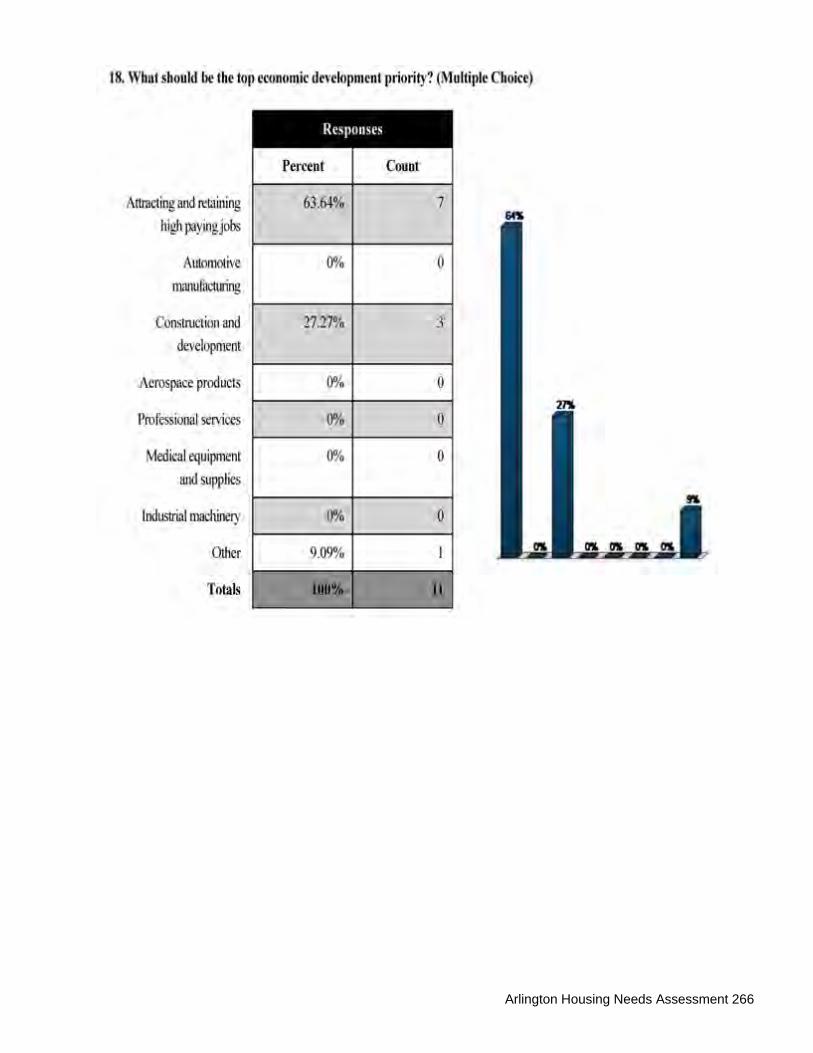
Arlington Housing Needs Assessment 266

Arlington Housing Needs Assessment 267

Arlington Housing Needs Assessment 268

Arlington Housing Needs Assessment 269
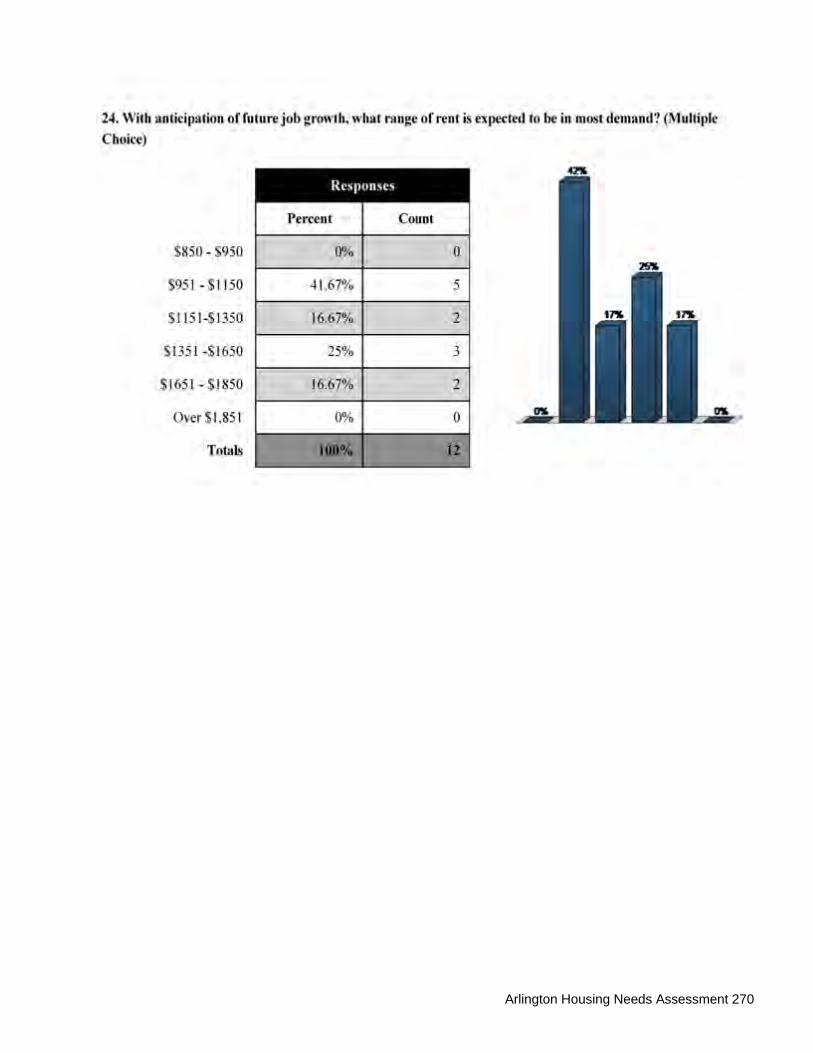
Arlington Housing Needs Assessment 270
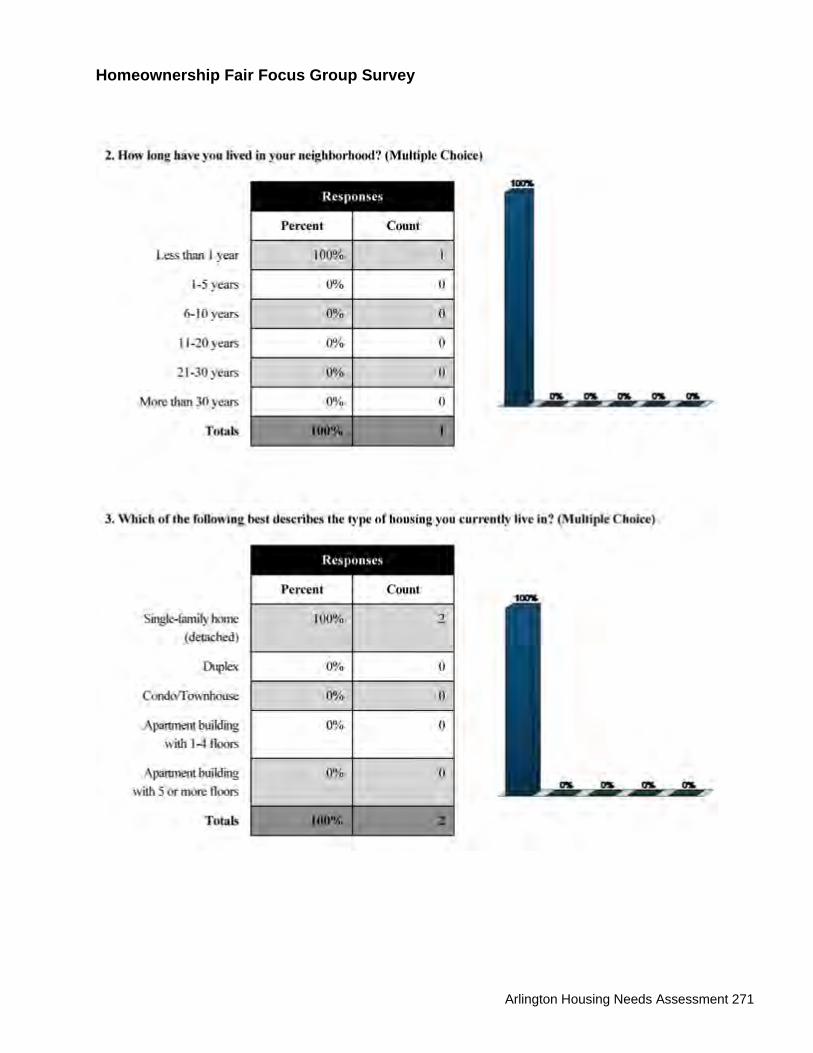
Arlington Housing Needs Assessment 271
Homeownership Fair Focus Group Survey
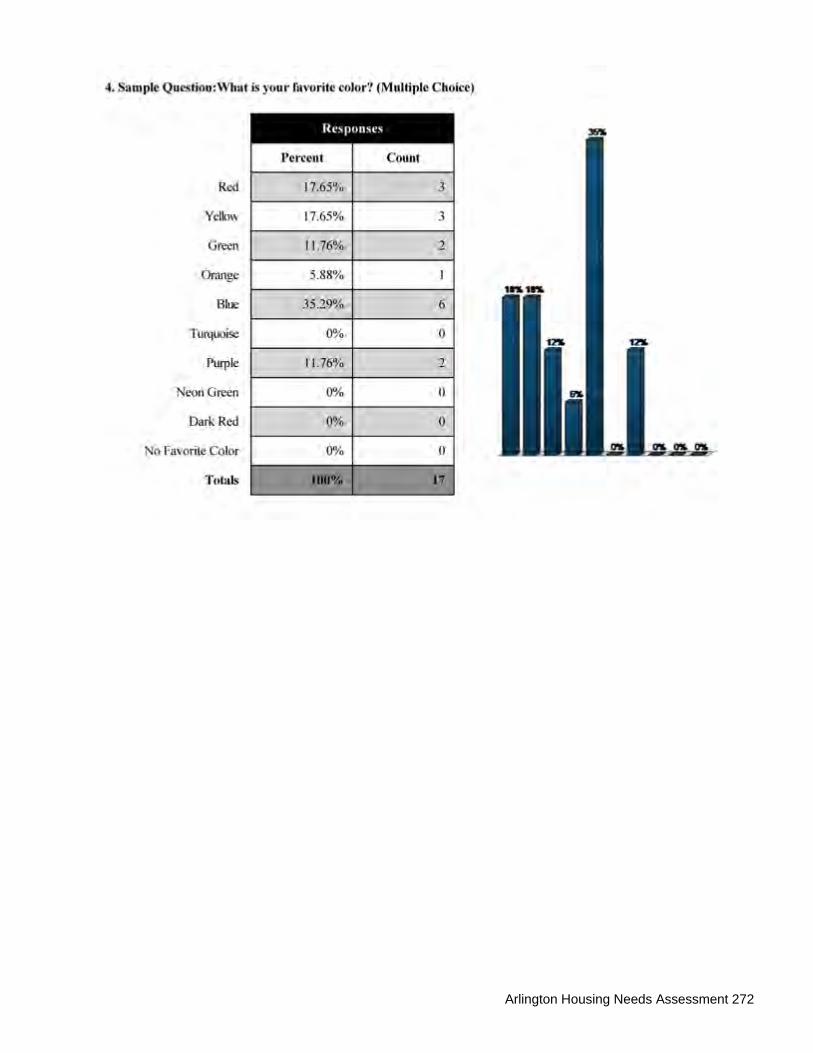
Arlington Housing Needs Assessment 272

Arlington Housing Needs Assessment 273

Arlington Housing Needs Assessment 274
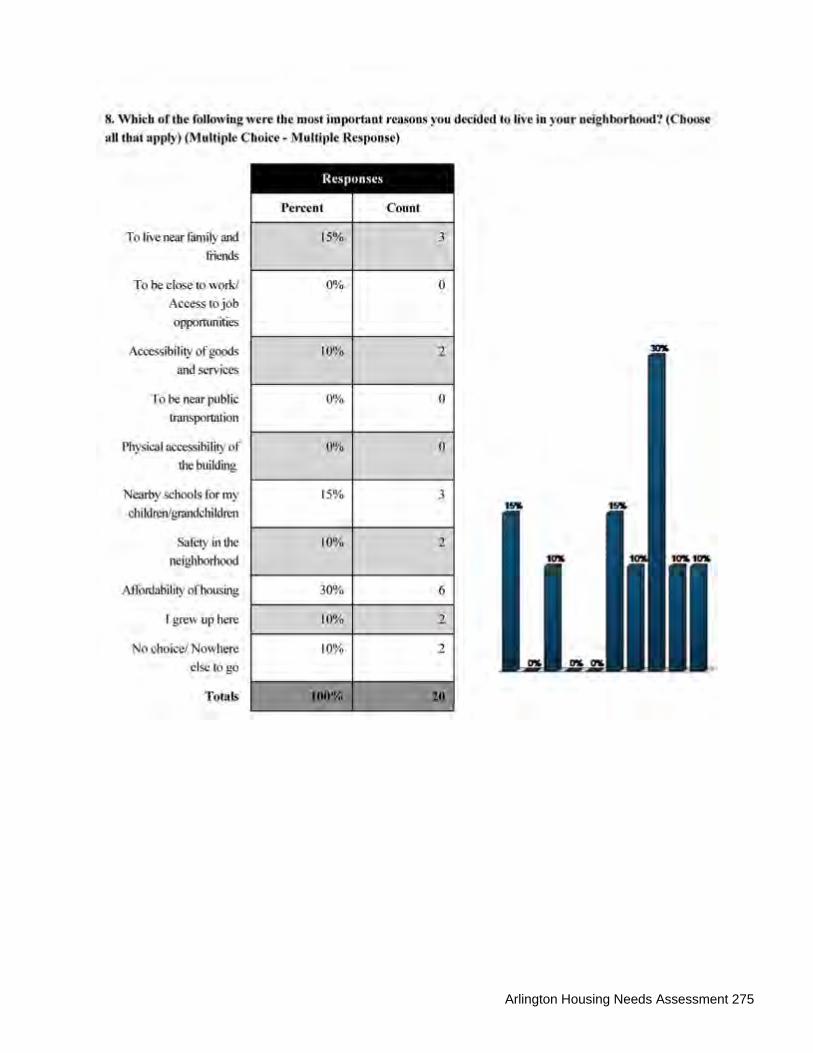
Arlington Housing Needs Assessment 275
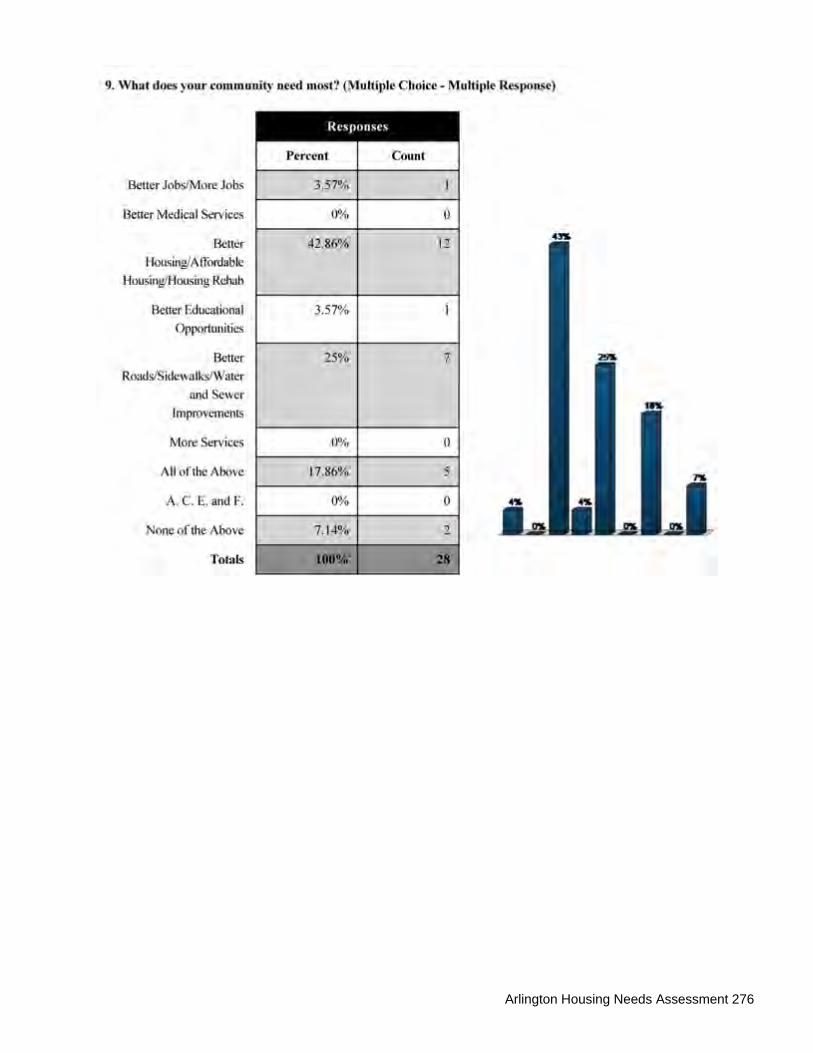
Arlington Housing Needs Assessment 276

Arlington Housing Needs Assessment 277

Arlington Housing Needs Assessment 278

Arlington Housing Needs Assessment 279

Arlington Housing Needs Assessment 280

Arlington Housing Needs Assessment 281

Arlington Housing Needs Assessment 282

Arlington Housing Needs Assessment 283

Arlington Housing Needs Assessment 284
The Housing Needs Assessment identifies future housing needs based on population,
economic, housing, and other trends that predict growth patterns over time. Each
jurisdiction is expected to evaluate the report to determine how and if the Projections,
Trends, Strategies and Solutions are then applied to specific geographies or areas within
the planning area. Determination of where and how those predictions will most likely occur
or should be encouraged to occur will be based on current and future conditions in
individual Jurisdictions. To help guide the implementation, JQUAD’s recommendation for
implementation includes the application of a classification scheme that examines specific
geographies in relationship to projections and trends, and current conditions of existing
housing, commercial corridor, downtowns, neighborhoods, and housing market.
Perceived direction of current change in an area is based socio-economic composition of
census data, market conditions, housing, neighborhood and commercial corridor conditions,
and other factors that create stress on planning area’s stability and can contribute to decline.
Within this matrix, each jurisdiction or sub-district planning area will be placed in one of the
12 cells based on these two factors. Some area currently has major deterioration but
undergoing some recent improvements in the form of renovation or redevelopment activities.
Similarly, some areas are in good to fair condition but experiencing stress from aging
infrastructure, current residents, and businesses, institutional and other investors unable to
maintain their properties. By understanding where the planning area conditions are currently
and where they are likely heading, a fundamental policy direction can be set to facilitate
reinvestment and revitalization and implementation of the Needs Assessment projections
and recommendations. Based on the twelve cells in the classification model, five area
classifications are included in the system. One or more of the five approaches or
classifications can be applied to the planning areas and used to guide implementation of the
Needs Assessment within specific planning area boundaries, or jurisdictions.
Basis for Application of Planning Area Projections and Recommendations - Understanding where sub-districts planning area in Arlington ranks on the sustainability
APPENDIX C: APPLICATION OF HOUSING NEEDS ASSESSMENT METHODOLOGY
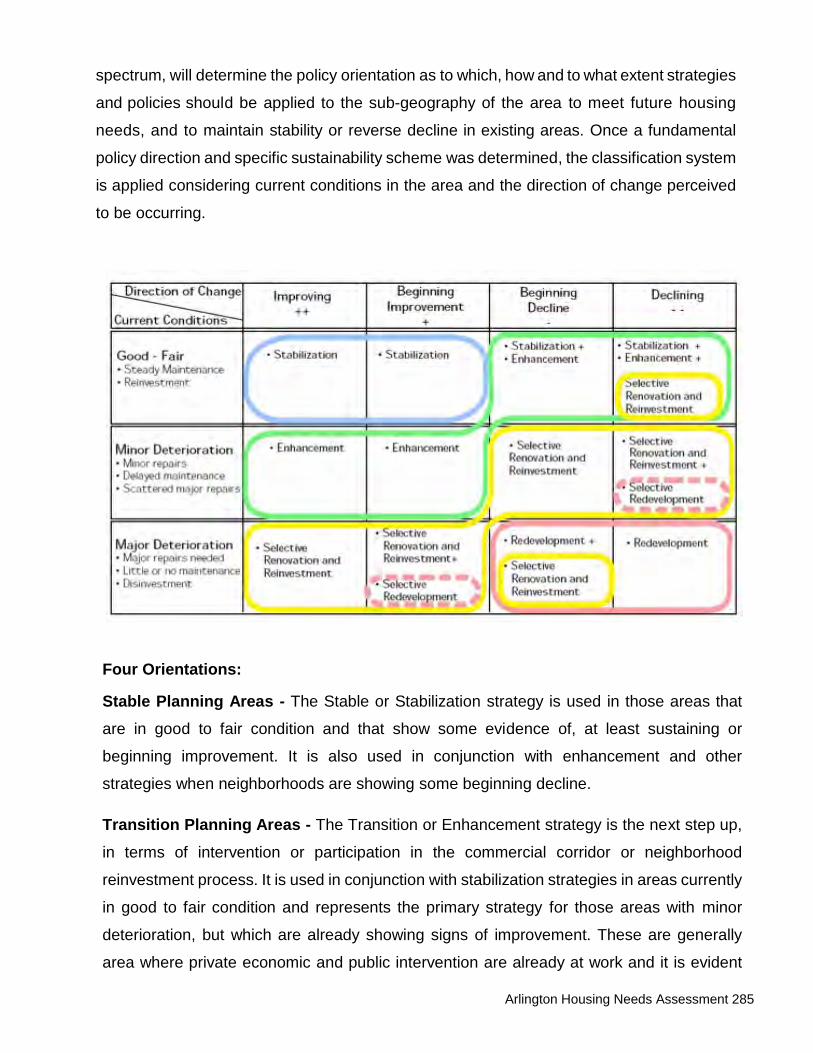
Arlington Housing Needs Assessment 285
spectrum, will determine the policy orientation as to which, how and to what extent strategies
and policies should be applied to the sub-geography of the area to meet future housing
needs, and to maintain stability or reverse decline in existing areas. Once a fundamental
policy direction and specific sustainability scheme was determined, the classification system
is applied considering current conditions in the area and the direction of change perceived
to be occurring.
Four Orientations:
Stable Planning Areas - The Stable or Stabilization strategy is used in those areas that
are in good to fair condition and that show some evidence of, at least sustaining or
beginning improvement. It is also used in conjunction with enhancement and other
strategies when neighborhoods are showing some beginning decline. Transition Planning Areas - The Transition or Enhancement strategy is the next step up,
in terms of intervention or participation in the commercial corridor or neighborhood
reinvestment process. It is used in conjunction with stabilization strategies in areas currently
in good to fair condition and represents the primary strategy for those areas with minor
deterioration, but which are already showing signs of improvement. These are generally
area where private economic and public intervention are already at work and it is evident
Arlington Housing Needs Assessment 286
that market forces are still at work. Public intervention or participation is used to facilitate,
compliment, and assist the revitalization process already underway.
Declining Planning Areas - The Declining or Renovation - Reinvestment strategy is
used in those planning areas where minor deterioration is prevalent and where decline is
underway; and in those areas where there is major deterioration and where improvement
has already started. The rationale for this strategy is that there needs to be a more active
level of intervention or participation in these neighborhoods to either turn them around, or in
those cases where there is sever deterioration, but some improvements, keep the process
going. In some cases, this strategy is combined with selective redevelopment where existing
conditions are such that renovation is too costly or where external pressures to change land
use patterns are too great.
Deterioration Planning Areas - The Deterioration or Renovation - Reinvestment strategy
is used where pockets of severe problems exist that are too expensive to renovate. Where
edges of target area are under pressure for land use changes that can threaten the stability
of the entire area, selective redevelopment can be used to accommodate the land use
change desired and to establish a more defined neighborhood boundary that can withstand
further pressure for de stabilizing changes. This planning model is then applied to the study
area geography to determine the key issues and opportunities and strategies and
recommendations to address these findings. Vision - The Housing Needs Assessment and resulting housing need projections creates
a unique perspective of how and what housing solutions best serve as opportunities for
residents, institutions, merchants, and other stakeholders to work together with City
Governments. Arlington’s vision is to successfully address future housing needs and create
sustained reinvestment. Implementation envisions all stakeholders working together across
individual interest to build consensus on how to address housing needs throughout
Arlington.
The planning area consists of both residential areas and commercial corridors in Arlington.
The vision embraces seven basic principles that guided the planning process and the
development of recommendations and strategies that evolved. The vision is to offer a range
of housing choices that appeal to all demographics, income levels and stages of life.
Arlington Housing Needs Assessment 287
The Arlington area offers a unique opportunity and attraction for persons seeking quality
housing, walkability, and live-work-play environments. In addition, the vision and needs
assessment supports revitalization and preservation of the existing housing,
neighborhoods, downtowns, and retail and commercial areas in four critical ways. First,
increased residential densities can help to create critical mass in development to support
local non-residential uses. Second, residential units in a downtown setting and in mixed use
developments help to create street level activity and visual characteristics expected in mixed
use cores. Third, existing blight will be replaced with new housing development and a
renewed sense of community and neighborhood. Fourth, housing will be affordable to a wide
range of incomes helping to form a community that does not ignore the need to ensure that
current area residents and new residents seeking housing can find housing of their choice.
The vision and needs assessment recognize that the Arlington Area is home to a
population with diverse incomes. Housing alternatives and products must provide
alternatives for persons of all incomes.
Goals and Objectives
1. To maintain neighborhood and commercial corridor stability and reverse trends
toward neighborhood decline with a focus on sustainability;
2. To encourage diversity of housing types and retail and commercial uses, priced to
meet the diverse needs of the community;
3. To encourage the sustained involvement of diverse interest and stakeholders in
the future development of community and neighborhoods;
4. To improve the living conditions of lower income and elderly residents;
5. To support job creation through economic development and businesses;
6. To create new housing that meets the diverse needs of the area demographics,
by responding with a mix of housing that reflects the way people live today;
7. To replace images of unsafe and obsolete area to a destination community;
8. Encourages creation of new housing development that meets needs identified.
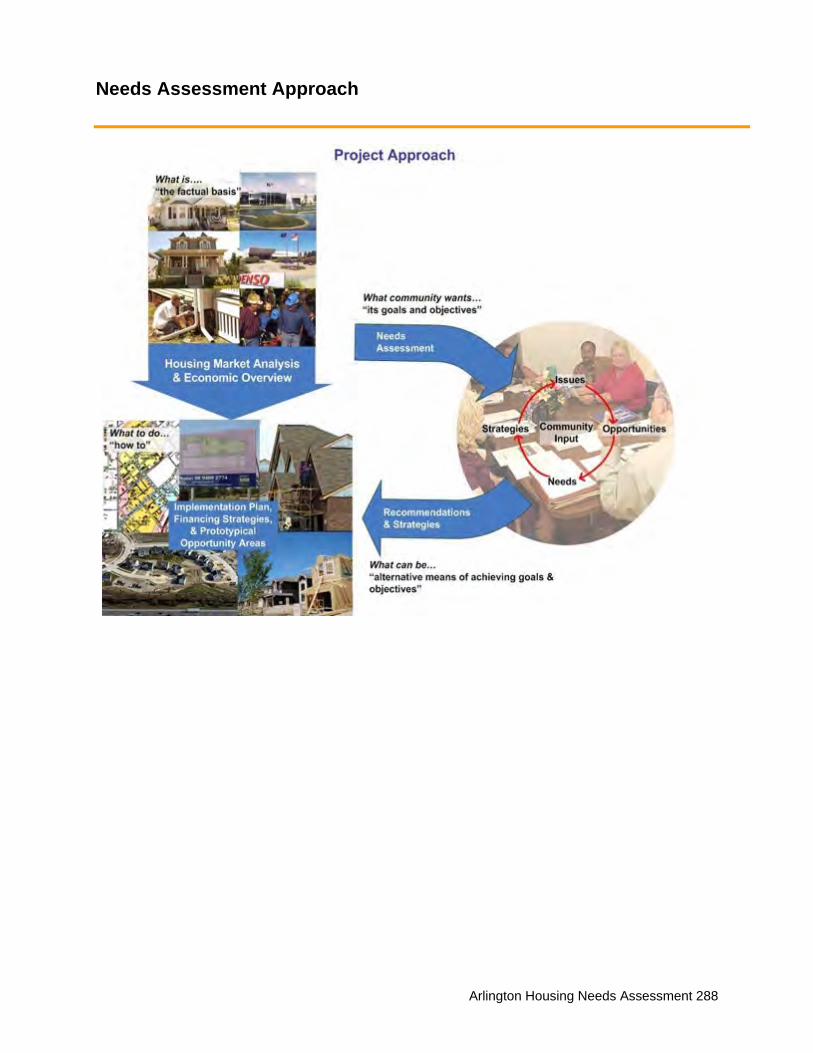
Arlington Housing Needs Assessment 288
Needs Assessment Approach

Arlington Housing Needs Assessment 289
Approach and Methodology
Our approach is effective as a planning and development tool with deliverables including
projection of housing needs, development opportunities and alternative housing
products, financing alternatives and resources, and policy and regulatory options that
encourage future housing development and help maintain neighborhood stability for
current and future residents and businesses. The approach includes three critical steps:
Our technical analysis utilized to assess the housing needs for the Arlington area provides
guidance in projecting the number and types of units needed; price points and affordability
based on market conditions and economic projections. Identifies opportunities, locations,
and best practices for achieving the goals and implementation. Community Engagement
Strategic Planning
Vision and Goals
Planning Context Market Assessment Inventory of Existing
Units
Key Issues and Opportunities
Development Opportunities and Alternative Products
Incorporation of Needs Assessment Results
Implementation Marketing Evaluation
Arlington Housing Needs Assessment 290
Community Engagement – During this phase, we gather input on the purpose,
approach, methodology and scope of the planning process, and sought broad community
support in establishing the vision and desired products and outcomes for the planning
and needs assessment. Strategic planning sessions were held to help identify issues,
priority needs and gather an understanding of the existing conditions.
Tools and Data Sources – Project Initiation, Work Plan Refinement, and Initial Data
Collection initiated the project and establish the factual basis within the planning area
and identify critical issues based on these facts. The team evaluated existing conditions
in Arlington and identified preliminary opportunities and options for addressing key
issues, shared vision and in response to the needs identified in stake holder forums and
surveys. Existing data and planning documents were utilized, supplemented with data
collected by the planning consultant.
Task - The assessment of local housing markets and needs and preferences of potential
homebuyers and renters included city market conditions and preferences and housing
needs and opportunities in anchor assets, downtowns, college campus housing,
undeveloped land, mixed use and upscale developments, and in support of industry and
economic development initiatives. This included an analysis of the housing market supply
and demand; housing and neighborhood conditions including age, location, pricing, and
absorption for new and existing housing units, land uses, public infrastructure,
transportation needs, and developable lots
Other factors considered included potentially available land for development, and
opportunities to support acquisition land strategy; demographic on housing, income,
employment, infrastructure, economic and workforce characteristics, property conditions,
development trends, public policy, and housing and financing products/programs available
to help meet residents’ existing and future needs. Results can be utilized in formulating
future development decisions and serve as a basis for creating housing policies,
recommendations for revitalization of existing neighborhoods.

Arlington Housing Needs Assessment 291
Key Issues and Opportunities – The Key Issues and Opportunities include alternative
approaches for solving problems and capitalizing on opportunities identified. Strategies
identified for achieving the housing needs and goals are primarily based on market
conditions, regulatory changes, reinvestment in infrastructure, and housing finance
strategies that achieve the price point and affordability goals established for the Arlington
Area. Housing policies, regulatory changes, and private public partnerships are
recommended for implementation with prototypical projects scenarios.

Arlington Housing Needs Assessment 292
Demographics
APPENDIX D: SECONDARY MARKET CITY COMPARISON TABLES

Arlington Housing Needs Assessment 293
Housing

Arlington Housing Needs Assessment 294

Arlington Housing Needs Assessment 295
Economic Characteristics
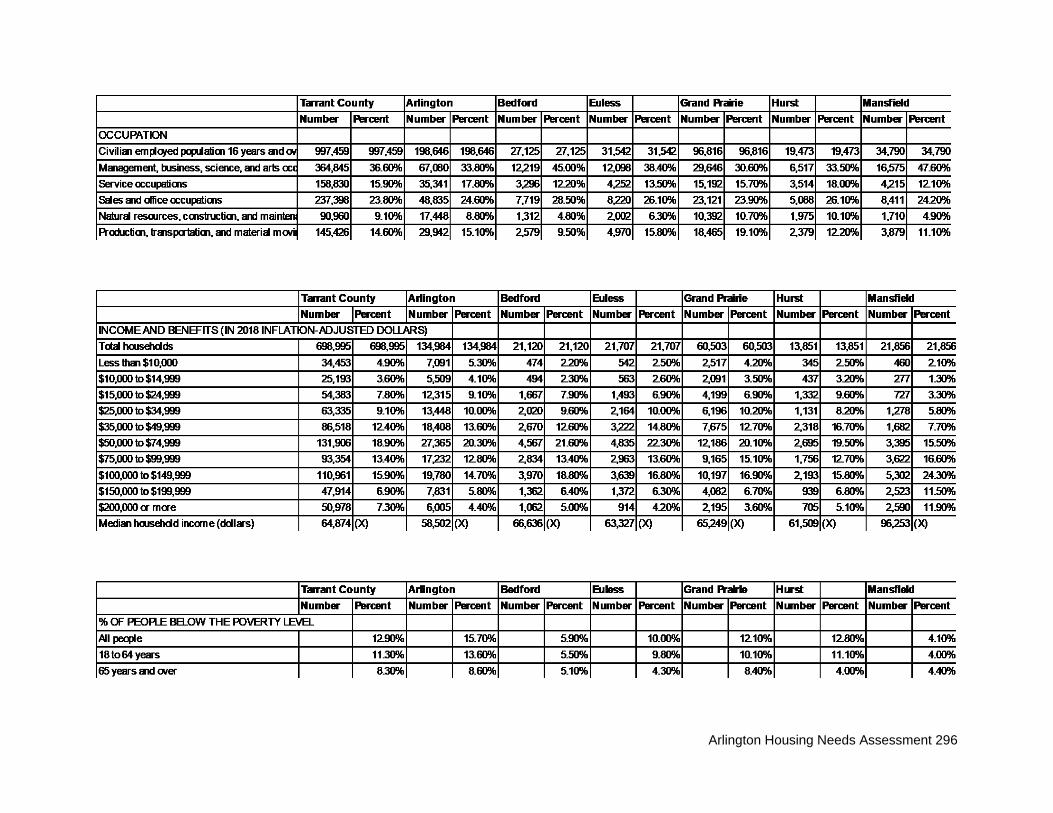
Arlington Housing Needs Assessment 296

Arlington Housing Needs Assessment 297
Social Characteristics

Arlington Housing Needs Assessment 298

Arlington Housing Needs Assessment 299
APPENDIX E: TRANSITIONAL NEIGHBORHOOD ANALYSIS
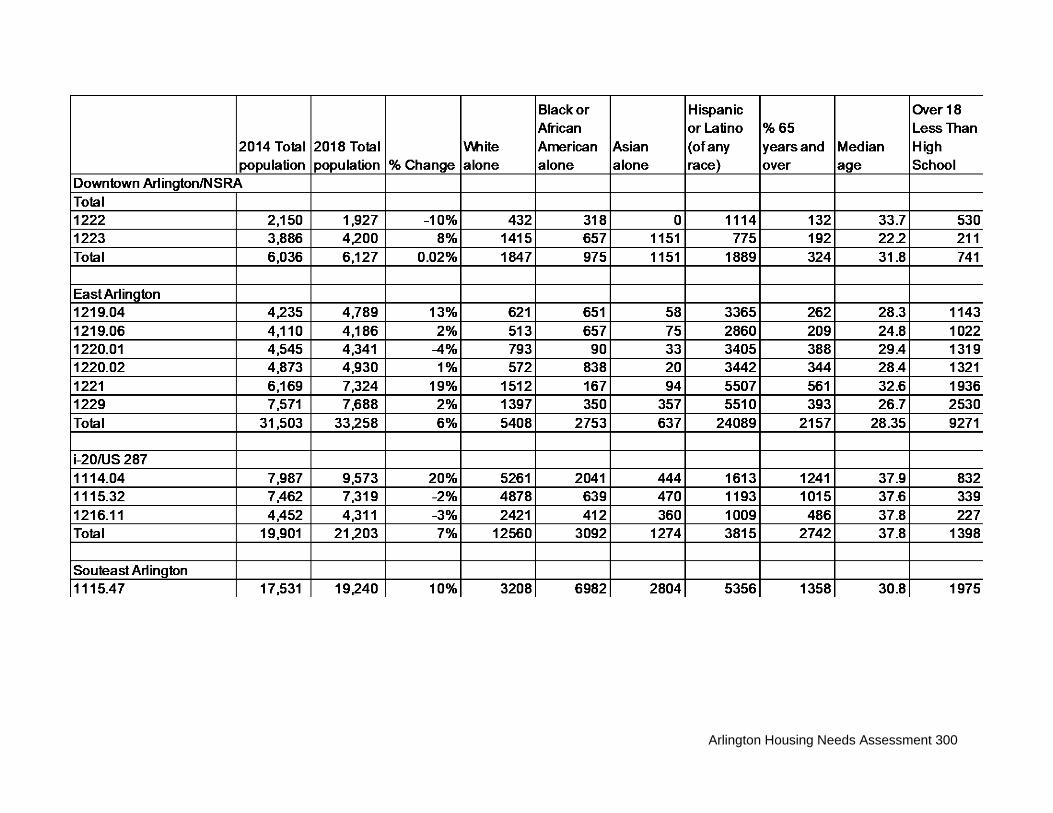
Arlington Housing Needs Assessment 300