supportive housing needs assessment for pennsylvania · pdf file ·...
TRANSCRIPT

Supportive Housing Needs Assessment
for Pennsylvania
Prepared for Regional Housing Legal Services
Based on data collected and evaluated by the Housing Alliance of Pennsylvania
Executive Director Elizabeth G. Hersh
Contributing research and drafting by Vanessa Kopp, candidate, Master of Social Work, University of Pennsylvania
January 2016

2
CONTENTS Purpose ................................................................................................................................................................................. 3
Introduction .......................................................................................................................................................................... 3
Permanent Supportive Housing Defined .............................................................................................................................. 4
Permanent Supportive Housing Viability .............................................................................................................................. 4
Methodology ......................................................................................................................................................................... 5
The Point in Time Count (PIT) ............................................................................................................................................... 7
Housing Inventory Count (HIC) ............................................................................................................................................. 7
Identifying Who Needs Supportive Housing ......................................................................................................................... 8
Quantifying the Need .......................................................................................................................................................... 10
Target Populations for PSH Based on 2015 PIT in the Top 4 COCs ..................................................................................... 10
Estimating Unit Goal 11
Conclusion ........................................................................................................................................................................... 12

3
PURPOSE The purpose of this SUPPORTIVE HOUSING NEEDS ASSESSMENT FOR PENNSYLVANIA is to provide a reliable estimate of the need for housing for the poorest and most vulnerable Pennsylvanians. It was prepared by the Housing Alliance of Pennsylvania for Regional Housing Legal Services (“RHLS”), which is a part of the Pennsylvania Legal Aid Network (PLAN), to use in planning how to allocate its resources. The Alliance was engaged by RHLS to look at the need for additional supportive housing to be developed for homeless individuals and families in Pennsylvania. It is not intended to be an assessment of the quality of the current supportive housing units being used to house homeless populations, nor the need to rehabilitate and or replace such units. This assessment relies on the collection and analysis of publicly available data provided by Pennsylvania’s Continuums of Care to both the state of Pennsylvania and the United States Department of Housing and Urban Development (HUD). INTRODUCTION Pennsylvania continues to experience a shortage of homes that are affordable, available and accessible to people with extremely low incomes. In fact, there is a shortage of 277,000 rental homes that are both affordable and available to people living on about $22,000 a year or less.1 This means that people are likely living in precarious housing situations such as cars, doubled up, “couch-surfing, or ” in dangerous or uninhabitable situations. Or they are making difficult choices between which necessities they can afford, sometimes described as “heat or eat.” Some, but not all, will experience homelessness. To develop actionable benchmarks that measure the need for affordable housing production and development, it is useful to measure the need for Permanent Supported Housing. This approach was pioneered in New York by the Corporation for Supported Housing (CSH)2. Their approach is largely replicated in this report prepared by the Housing Alliance of Pennsylvania. Based on the assessment of available data described and analyzed in this report, there is a need for 7,434 units3 of Permanent Supportive Housing (PSH) in the 4 regional Pennsylvania Continuums of Care that represent 55 of the state’s 67 counties and 70% of the documented homeless population.4
1 “Affordability and Availability of Rental Housing in the Third Federal Reserve District: 2015”, Federal Reserve Bank of Philadelphia 2 “Real Supportive Housing Need in New York State 2015,” CSH http://www.csh.org/wp-content/uploads/2015/10/Final_Real-SH-Need-in-NYS.pdf 3 The terms units and beds are used interchangeably in this report. HUD data tracking and reporting requirements makes differentiating for the purposes of this report more complicated and confusing than is needed for our purposes of estimating unit need. 4 Based on the Point in Time counts submitted by each Continuum of Care to HUD annually. The basis for this number and its source are discussed in greater detail later in the report.

4
PERMANENT SUPPORTIVE HOUSING DEFINED Permanent Supportive Housing is a program design that couples long-term subsidized housing, either tenant- or project-based, with flexible, voluntary supportive services. It is designed to provide the highest level of care to individuals and families so that they remain stably housed and build the necessary skills to live as independently as possible.5 Permanent Supportive Housing primarily benefits extremely low-income, chronically homeless individuals and families who have multiple barriers to housing stability. This includes people with significant behavioral health disabilities, addiction and/or dual diagnosis. In general, it would be safe to say that the targeted populations would be unable to live safely and stably without supported housing.
PERMANENT SUPPORTIVE HOUSING VIABILITY Permanent Supportive Housing (PSH) is proven to prevent and end homelessness for the most vulnerable people. Notably, between 2007 and 2013 HUD reported an increase of just over 50% in available PSH units.6 The annual Point in Time (PIT) Count7 for this same timeframe shows a decline in the number of individuals experiencing homelessness. Given that this timeframe includes the housing market crash and recession, this dramatic correlation suggests that Permanent Supportive Housing was effective in reducing homelessness. Permanent Supportive Housing not only aids in the prevention and elimination of homelessness, but offsets the cost for cities and states. The majority of people experiencing chronic homelessness have a serious mental illness, substance abuse disorder, physical disability, or a chronic disease either individually or on a co-occurring basis.8 A pattern of chronic homelessness paired with one or more of the previously listed conditions leads to frequent use of publically funded services such as emergency shelter, acute and emergency physical and behavioral health care, incarceration or criminal justice involvement, and frequent or ongoing use of social services.9 Studies conducted across the country in varying localities found that frequent and continued use of these services can cost cities and states tens of thousands of dollars per individual. Conversely, a North Carolina study found that Permanent Supportive Housing reduced public expenditures on street homelessness by as much as 75% in the first year.10 The Corporation for Supported Housing, the leading national expert on Permanent Supported Housing, asserts that “study after study has found supportive
5http://www.csh.org/toolkit/public-housing-agencies-toolkit/primer-on-homelessness-and-supportive-housing/supportive-housing-key-terms/ 6 https://www.hudexchange.info/resources/documents/ahar-2013-part1.pdf 7 https://www.hudexchange.info/resources/documents/ahar-2013-part1.pdf 8The Relationship between Community Investment in Permanent Supportive Housing and Chronic Homelessness: http://works.bepress.com/dennis_culhane/140/ 9 Same. 10 University of North Carolina, Department of Social Work (Feb. 14, 2014) Moore Place Permanent Supportive Housing Evaluation Study; Massachusetts Housing and Shelter Alliance (June 2014) Home and Healthy for Good

5
housing to be cost-effective, showing supportive housing costs to be almost the same or less than the costs of maintaining homelessness.11 A recent report found that moving homeless people into supportive housing avoids costs from public systems, like hospitalizations, jail, ambulance services, general relief, and other programs by 79%.12 An earlier seminal New York City cost study showed that homeless people with mental illness who became supportive tenants avoided public system costs of over $16,000 per year over others who remained in shelters. The city avoided enough expense to almost pay for the costs of operating supportive housing for each individual in the study.”13 In sum, the assessment of the need for Permanent Supportive Housing is useful and relevant as a conservative estimate of true housing need for the poorest and most-vulnerable people experiencing homelessness, which continues to be a pressing and costly problem for the Commonwealth and offers an effective programmatic solution. In fact:
− In 2015, 15,421 people were counted as experiencing homelessness, specifically both sheltered and unsheltered;14
− In 2014, 34,959 used the homeless system;15 − In 2015, 26,273 homeless children and youth received services from PA
school districts.16 PSH is proven and cost-effective. It represents a housing solution that, to the best of our knowledge, cannot be provided in other ways. In sum, the assessment of the need for Permanent Supported Housing is a reliable barometer of housing supply need for the poorest and most vulnerable people who will not be able to escape homelessness any other way.
METHODOLOGY To conduct this assessment, the Housing Alliance used the basic model employed by the Corporation for Supported Housing17 for the state of New York. The Alliance gathered and analyzed data from the most up-to-date, accurate and reliable sources available. In the interest of time, we did not convene an Advisory Board as CSH did, nor did we make individual outreach to Continuums of Care to get data above and beyond that which was published and reported to the State and HUD.
11Pulled from http://www.csh.org/wp-content/uploads/2011/12/ApproachesforEndingCA.pdf Footnote: See, for example, Laura Sadowski, Romina Kee, Tyler VanderWeele, et. al. “Effect of a Housing and Case Management Program on Emergency Department Visits and Hospitalizations among Chronically Ill Homeless Adults: A Randomized Trial.” J. Am. Med. Assoc. 2009; 301(17): 1771-78; Mary Larimer, et. al. “Health Care and Public Service Use and Costs Before and After Provision of Housing for Chronically Homeless Persons with Severe Alcohol Problems.” J. Am. Med. Assoc. 2009; 301 (13): 1349-57. 12 Same. Footnote: Daniel Flaming, Patrick Burns, Michael Matsunaga. “Where We Sleep: Costs When Homeless and Housed in Los Angeles County.” Economic Roundtable. 2009. 13 Same. Footnote: Dennis Culhane, et al., “Public Service Reductions Associated with Placement of Homeless Persons with Severe Mental Illness in Supportive Housing.” Housing Policy Debate. Vol. 13, Issue 1. Fannie Mae Foundation. 2002 (hereinafter “Public Service Reductions”). 14 https://www.hudexchange.info/resource/reportmanagement/published/CoC_PopSub_State_PA_2015.pdf 15 Charts of Pennsylvania’s Continuum of Care programs, People’s Emergency Center, Policy Brief developed by Joe Willard, Policy Director 16 2014-2015 Pennsylvania ECYEH State Evaluation Report, http://bit.ly/1l2N5vx 17 “Real Supportive Housing Need in New York State 2015,” CSH http://www.csh.org/wp-content/uploads/2015/10/Final_Real-SH-Need-in-NYS.pdf
6
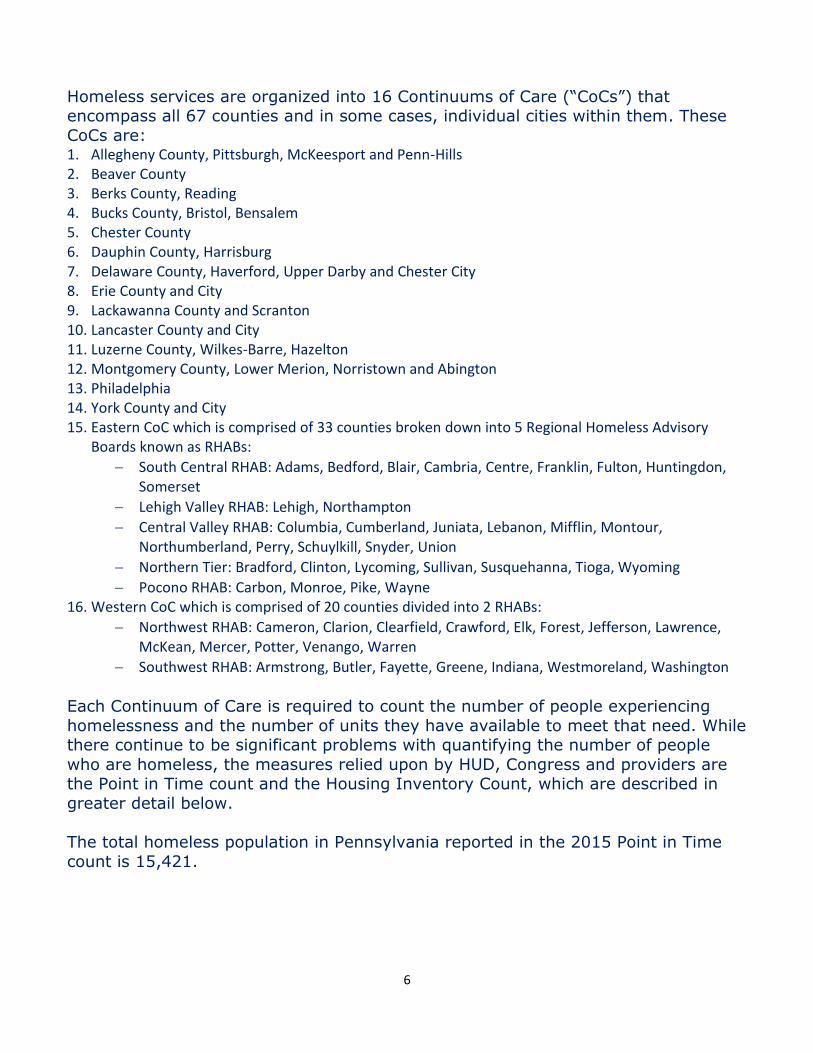
Homeless services are organized into 16 Continuums of Care (“CoCs”) that encompass all 67 counties and in some cases, individual cities within them. These CoCs are: 1. Allegheny County, Pittsburgh, McKeesport and Penn-Hills 2. Beaver County 3. Berks County, Reading 4. Bucks County, Bristol, Bensalem 5. Chester County 6. Dauphin County, Harrisburg 7. Delaware County, Haverford, Upper Darby and Chester City 8. Erie County and City 9. Lackawanna County and Scranton 10. Lancaster County and City 11. Luzerne County, Wilkes-Barre, Hazelton 12. Montgomery County, Lower Merion, Norristown and Abington 13. Philadelphia 14. York County and City 15. Eastern CoC which is comprised of 33 counties broken down into 5 Regional Homeless Advisory
Boards known as RHABs: � South Central RHAB: Adams, Bedford, Blair, Cambria, Centre, Franklin, Fulton, Huntingdon,
Somerset � Lehigh Valley RHAB: Lehigh, Northampton � Central Valley RHAB: Columbia, Cumberland, Juniata, Lebanon, Mifflin, Montour,
Northumberland, Perry, Schuylkill, Snyder, Union � Northern Tier: Bradford, Clinton, Lycoming, Sullivan, Susquehanna, Tioga, Wyoming � Pocono RHAB: Carbon, Monroe, Pike, Wayne
16. Western CoC which is comprised of 20 counties divided into 2 RHABs: � Northwest RHAB: Cameron, Clarion, Clearfield, Crawford, Elk, Forest, Jefferson, Lawrence,
McKean, Mercer, Potter, Venango, Warren � Southwest RHAB: Armstrong, Butler, Fayette, Greene, Indiana, Westmoreland, Washington
Each Continuum of Care is required to count the number of people experiencing homelessness and the number of units they have available to meet that need. While there continue to be significant problems with quantifying the number of people who are homeless, the measures relied upon by HUD, Congress and providers are the Point in Time count and the Housing Inventory Count, which are described in greater detail below. The total homeless population in Pennsylvania reported in the 2015 Point in Time count is 15,421.

7
THE POINT IN TIME COUNT (PIT) The PIT is an annual count of sheltered and unsheltered homeless persons on a single night during the last 10 days in January.18 Continuums of Care count and report to the state and HUD the number of people who are unsheltered, in emergency shelters, transitional housing and Safe Havens on that night.19 � Emergency Shelter is any facility whose primary purpose is to provide temporary or transitional lodging for a period of 90
days or less.”20 � Transitional Housing provides temporary residence of up to 24 months for people experiencing homelessness combined
with wrap-around services to help develop stability.21 � Safe Haven is a form of supportive housing that serves hard-to-reach homeless persons with severe mental illness who
come primarily from the streets and have been unable or unwilling to participate in housing or supportive services.22 The PIT DOES NOT include the number of people in Permanent Supported Housing or Rapid Re-Housing. � Rapid Re-Housing prioritizes moving a family or individual experiencing homelessness into permanent housing as quickly
as possible, ideally within 30 days of becoming homeless. It has 3 core components: housing identification, rent and move-in assistance (financial), and case management and services. 23
The PIT is considered to be the best source of data about the number of people experiencing chronic homelessness and street homelessness, the primary target populations for Permanent Supportive Housing. Yet it is considered by homeless family advocates and providers to fall short of accurately capturing family homelessness since families are less likely to end up on the street. It is also considered to have significant limitations in counting youth who are skilled at hiding and are underserved by the homeless system. It is useful longitudinally within a geographic area as long as the same methodology is used year after year. Local capacity for conducting the count may change. For example, as a CoC gets better at doing their PIT, the numbers reported may grow due to more thorough counting. But that count should, after an initial bump, become more reliable again as the same methodology is replicated in subsequent years. Weather conditions may also cause numbers to fluctuate. The PIT is used as the basis for funding and even with all its limitations is generally considered to be the most reliable count. It is relevant for the purposes of this assessment which focuses on the need for Permanent Supportive Housing. But given its limitation, it should be considered an undercount of true need. HOUSING INVENTORY COUNT (HIC) The HIC tallies the number of beds and units provided on the night designated for the count by program type, and includes beds dedicated to serve people who are homeless as well as those living in Permanent Supportive Housing. New for this
18 https://www.hudexchange.info/manage-a-program/coc-homeless-populations-and-subpopulations-reports/ 19 HUD Definition of a Point in Time count https://www.hudexchange.info/programs/hdx/guides/pit-hic/ 20 http://homeless.samhsa.gov/channel/transitional-housing-450.aspx 21 http://www.endhomelessness.org/library/entry/rapid-re-housing-a-history-and-core-components 22 https://www.hudexchange.info/resources/documents/SafeHavenFactSheet_CoCProgram.PDF 23 http://www.endhomelessness.org/page/-/files/2450_file_Rapid_Re_Housing_Guide_July_2009.pdf

8
year (2015), the report also includes data on beds dedicated to serve specific sub-populations.24 It provides a snapshot of all the beds and units provided by program type in a CoC including those in Emergency Shelter, Transitional Housing, Safe Haven, Rapid Rehousing and Permanent Supportive Housing during the last 10 days of January. The HIC provides the most comprehensive count of units and beds by CoC available, yet there may be inconsistent or absent information about actual availability and turnover rates. In the New York report conducted by CSH, they used their Advisory Board to reach out to the CoCs to ask for more detailed information about actual bed and unit turnover and availability. This more in-depth validation of the housing inventory is not included in the Pennsylvania report. Collectively, even with their limitations, the PIT and HIC paint the most accurate picture available of the need for Permanent Supportive Housing for vulnerable populations in the state. Based on 2015 data, the Continuums of Care with the highest prevalence of homelessness in the state are:
- Philadelphia - Eastern Pennsylvania - Pittsburgh/McKeesport/Penn Hills/Allegheny County - Western Pennsylvania
These 4 Continuums of Care account for 70% of the total PA homeless population or 10,834 people. The remaining 12 CoCs report a total of 4,587 homeless persons, less than half of the total shared between the other 4. IDENTIFYING WHO NEEDS SUPPORTIVE HOUSING The people experiencing homelessness for whom Permanent Supportive Housing is considered most appropriate and effective include Chronically Homeless Individuals and Families, Unaccompanied Youth, Homeless Veterans, and Homeless Individuals Living with Serious Mental Illness (SMI), Substance Abuse Disorders (SUD), or HIV/AIDS (or both or all). These groupings of people are described below. CHRONICALLY HOMELESS INDIVIDUALS According to HUD, chronic homelessness is defined as “individuals with a disability who have experienced homelessness continuously for one-year or more or who have experienced at least four episodes of homelessness in the last three years.25” CHRONICALLY HOMELESS FAMILIES Family includes, but is not limited to, any group of persons presenting for assistance together with or without children, regardless of marital status, actual or 24 https://www.hudexchange.info/manage-a-program/coc-housing-inventory-count-reports/ 25 This is according to the “final rule” passed by HUD in 2011. HUD recently issued an update to the “final rule” after feedback and suggestions from Continuums of Care. This updated definition does not apply to the data we will use as the updated definition does not go into effect until the year 2016.25This definition does not capture families. In an effort to reconcile that discrepancy, HUD has included a family definition (See Glossary).

9
perceived sexual orientation or gender identity, and irrespective of age, relationship, or whether or not a member of the household has a disability. A child who is temporarily away from the home because of placement in foster care is considered a member of the family. Studies show that most families participating in a Rapid Re-Housing model are likely to move out of homelessness quickly; however, some families face multiple and complex barriers to housing stability.26 In this circumstance, Permanent Supportive Housing can be a viable option to ensure long term stability for the entire family unit. However, as noted before, families are likely under-represented in the PIT.
HOMELESS UNACCOMPANIED YOUTH27 There are an estimated 50,000 youth experiencing street homelessness nationally. Communities report that a high, but unverifiable proportion are LGBTQ who are not welcome to remain with their families. The National Alliance to End Homelessness reports that definitive data simply does not exist to wholly capture the youth population.28 Due to this difficulty, the population may have greater need than represented in the PIT. Unaccompanied youth can benefit from supportive housing when services are consistent with age and development, especially those who come from families of generational poverty.29 HOMELESS VETERANS HUD and the U.S. Department of Veterans Affairs have developed programs such as HUD-VASH (Veterans Affairs Supportive Housing), which utilizes Permanent Supportive Housing for veterans to become stably housed. According to the National Alliance to End Homelessness, this program produces numerous positive outcomes such as income and employment stability, an increase in the number of days housed, and an increase in social networks. In fact, several Pennsylvania cities including Philadelphia and Lancaster have reached functional zero for veterans’ homelessness. HOMELESS INDIVIDUALS LIVING WITH SERIOUS MENTAL ILLNESS (SMI), SUBSTANCE ABUSE DISORDERS (SUD) AND/OR HIV/AIDS To count the population of individuals diagnosed with HIV/ AIDS, the PIT is highly reliant on self-report. Many individuals experiencing homelessness may not know their status or do not choose to disclose this information. There are barriers in each housing continuum that keep individuals with HIV/AIDS from gaining access to housing, such as a requirement to know one’s status and seek treatment.30 Given these circumstances, the numbers reported in the HUD Point in Time count may grossly underrepresent the actual need.
26 National Alliance to End Homelessness and Community Enterprise Partners Policy Brief http://bit.ly/1PdKCfU 27 Unaccompanied Youth Definition http://bit.ly/1OfYuTd 28 National Alliance to End Homelessness http://www.endhomelessness.org/pages/youth_solutions 29 National Alliance to End Homelessness http://www.endhomelessness.org/pages/youth_solutions 30 Real Supportive Housing Need in New York, CSH, http://www.csh.org/wp-content/uploads/2015/10/Final_Real-SH-Need-in-NYS.pdf

10
It should be noted that there are additional vulnerable populations that are not explicitly identified as subpopulations in the PIT. They may be included, but there is no way to track or verify that with the current reporting systems. These include returning citizens reentering from the justice system (jail, prison, parole, probation), victims of domestic violence, youth aging out of juvenile justice and/or foster care, and individuals living in nursing homes for lack of affordable and accessible units where they could live more independently with a lower level of care. They may be included in the populations listed above but are not identified or reported specifically through the PIT. QUANTIFYING THE NEED Of the 10,834 people reported as experiencing homelessness in the 4 top CoCs, the number of people who are likely to need Permanent Supported Housing is 8,260 based on the identification of the targeted homeless subpopulations. COUNT OF PSH TARGET POPULATIONS FOR THE 4 TOP COCS
Philadelphia Continuum of Care
Sub-Population Sheltered Unsheltered Total
Chronically Homeless
468 361 829
Severely Mentally Ill 1,110 319 1429
Chronic Substance Abuse
1339 413 1752
HIV/AIDS 159 41 200
Veterans 327 10 337
Unaccompanied Youth
244 55 299
Total 3647 1199 4846
Eastern Pennsylvania Continuum of Care
Sub-Population Sheltered Unsheltered Total
Chronically Homeless
87 77 164
Severely Mentally Ill 252 77 329
Chronic Substance Abuse
234 55 289
Veterans 104 46 150
HIV/AIDS 10 2 12
Unaccompanied Youth
127 38 165
Total 814 641 1109
Allegheny County, Pittsburgh, McKeesport and Penn Hills Continuum of Care
Sub-Population Sheltered Unsheltered Total
Chronically Homeless
138 16 154
Severely Mentally Ill 533 20 553
Chronic Substance Abuse
460 25 485
Veterans 207 9 216
HIV/AIDS 21 0 21
Unaccompanied Youth
95 4 99
Total 1454 74 1528
Western Pennsylvania Continuum of Care
Sub-Population Sheltered Unsheltered Total
Chronically Homeless
68 23 91

11
Severely Mentally Ill 241 30 271
Chronic Substance Abuse
202 12 214
Veterans 134 1 135
HIV/AIDS 5 0 5
Unaccompanied Youth
54 7 61
Total 704 73 777
ESTIMATING UNIT GOAL Having established the need for Permanent Supportive Housing, the next question to assess is the existing supply. The Housing Inventory Count listed below outlines the total beds counted as available to provide Permanent Supportive Housing in these selected continuums as reflected in the 2015 HIC.
2015 HOUSING INVENTORY COUNT FOR CONTINUUMS OF CARE WITH THE LARGEST HOMELESS POPULATIONS
Continuum of Care Total Year-Round Permanent Supported Housing Units
Philadelphia 4908
Eastern 1299
Pittsburgh/ McKeesport/ Penn Hills/ Allegheny 2136
Western 1056
While we know that those people in the PIT are not housed in these units, the unknown in the equation is the rate of turnover and vacancy in the existing supply of Permanent Supported Housing. We have no way of knowing how many units or beds may become available in a given year to meet the demand. When CSH did the analysis for New York, they called and asked each Continuum of Care what their vacancy and turnover rates were. Even then, their numbers were best estimates given that these numbers change, the location of units is spread out geographically so they can’t easily be verified, and the result is based on self-report by providers. So how do we provide an estimate of turnover and vacancy rates in the supply? Research provides some guidance. In its 2011 report, PERMANENT SUPPORTIVE HOUSING: AN OPERATING COST ANALYSIS,31 Enterprise Community Partners analyzed financial data for 10 affordable and 10 permanent supportive housing projects that had operated for at least two years, all financed by the 9% Low Income Housing Tax Credit. Their findings suggest 95% occupancy with minimal turnover. They found:
31 http://shnny.org/uploads/Permanent_Supportive_Housing.pdf Copyright © 2011, Enterprise Community Partners, Inc. All rights reserved.

12
x Vacancy loss is generally comparable between the two sets of properties (4 percent in affordable housing versus 3 percent in permanent supportive housing),with economic occupancies of 96 percent and 97 percent respectively;
x Time needed to turn over a permanent supportive housing unit averaged 30 days. In its study of APPROACHES FOR ENDING HOMELESSNESS IN CALIFORNIA, CSH asserted that “the average length of residency in supportive housing is the same as the average length of stay in any rental housing.32” Turning to one of the premier providers of Permanent Supportive Housing in Pennsylvania, Project HOME, Laura Weinbaum, Vice President for Public Affairs and Strategic Initiatives, reports the following: “As you can imagine, we VERY closely monitor turnover and vacancy at PH [Project HOME].” She provided “a forecast done for/with us by Dennis Culhane and Suzanne Wagner in 2012, which estimated 15% turnover in permanent supportive in its various forms, though I think we then scaled back to a more conservative 12% for our more detailed forecast with costs.” CONCLUSION GIVEN THE INPUT FROM THESE SOURCES, WE CONSERVATIVELY CONCLUDE THAT THERE IS A DEFENSIBLE AND DATA-BASED NEED FOR 7,434 UNITS OF PERMANENT SUPPORTIVE HOUSING IN THE 4 PENNSYLVANIA CONTINUUMS OF CARE WHICH COMPRISE 70% OF THE STATE’S HOMELESS POPULATION, AS REPORTED IN THE 2015 POINT IN TIME COUNT. This number does not include any assessment of the need to rehab or improve current supportive housing units. It does not include the affordable housing population which does not require supportive housing which is estimated at 277,000 extremely low-income Pennsylvanians who are cost-burdened. Given the likely undercount of families, people exiting the justice and foster care systems and nursing homes, it can safely be assumed that this number falls short of the supply of homes needed to end homelessness among the most vulnerable Pennsylvanians. We understand that RHLS, and possibly the PA Legal Aid Network (PLAN), are going to use this needs assessment in planning how to allocate its resources. We are confident in doing such planning that RHLS and PLAN can assume the need for the development of at least 7,434 additional supportive housing units just in the 4 Regional Continuums of Care identified. In fact, it would be a great service to the Commonwealth and a savings for taxpayers if they did.
### 32 http://www.csh.org/wp-content/uploads/2011/12/ApproachesforEndingCA.pdf - A study of California’s AB 2034 Program showed 81% of homeless people with serious mental illness and substance abuse disorders remained stably housed after one year. Martha Burt and Jacquelyn Anderson. “AB 2034 Program Experiences in Housing Homeless People with Serious Mental Illness.” Corporation for Supportive Housing. Jan. 2006 (hereinafter “AB 2034 Program”). Fifty percent of supportive housing tenants remain housed after 30 months, consistent with a typical tenancy. Department of Housing and Urban Development, “Predicting Staying in or Leaving Permanent Supportive Housing That Serves Homeless People with Serious Mental Illness.” University of Pennsylvania Center for Mental Health Policy and Services Research. March 2006.

12