arnold o. benz1 2 - home - springer · pdf filearnold o. benz1,2 published online: ... 2 page...
TRANSCRIPT

Living Rev. Sol. Phys. (2017) 14:2https://doi.org/10.1007/s41116-016-0004-3
REVIEW ARTICLE
Flare Observations
Arnold O. Benz1,2
Published online: 9 December 2016© The Author(s) 2016. This article is published with open access at Springerlink.com
Abstract Solar flares are observed at all wavelengths from decameter radio wavesto gamma-rays beyond 1 GeV. This review focuses on recent observations in EUV,soft and hard X-rays, white light, and radio waves. Space missions such as RHESSI,Yohkoh, TRACE, SOHO, and more recently Hinode and SDO have enlarged widelythe observational base. They have revealed a number of surprises: Coronal sourcesappear before the hard X-ray emission in chromospheric footpoints, major flare accel-eration sites appear to be independent of coronal mass ejections, electrons, and ionsmay be accelerated at different sites, there are at least 3 different magnetic topolo-gies, and basic characteristics vary from small to large flares. Recent progress alsoincludes improved insights into the flare energy partition, on the location(s) of energyrelease, tests of energy release scenarios and particle acceleration. The interplay ofobservations with theory is important to deduce the geometry and to disentangle thevarious processes involved. There is increasing evidence supporting magnetic recon-
This article is a revised version of https://doi.org/10.12942/lrsp-2008-1.Change summary Major revision, updated and expanded.Change details Significant new results from RHESSI and SDO are included. In particular, Sect. 3.4 on“Emissions from above the coronal source” was added (including two new figures) and Sect. 3.2 on“Coronal hard X-ray sources” was expanded. New observations of flares in white light are reported(replaced Fig. 25 with a movie), as well as recent multi-wavelength observations in radio waves andgamma-rays combined with hard X-rays. Four references were removed and 49 new references added.
Electronic supplementary material The online version of this article (doi:10.1007/s41116-016-0004-3)contains supplementary material, which is available to authorized users.
B Arnold O. [email protected]
1 Institute for Astronomy, ETH, 8092 Zurich, Switzerland
2 Institute of 4D Technologies, FHNW, 5210 Windisch, Switzerland
123

2 Page 2 of 59 Arnold O. Benz
nection as the basic cause. While this process has become generally accepted as thetrigger, it is still controversial how it converts a considerable fraction of the energyinto non-thermal particles. Flare-like processes may be responsible for large-scalerestructuring of the magnetic field in the corona as well as for its heating. Large flaresinfluence interplanetary space and substantially affect the Earth’s ionosphere. Flarescenarios have slowly converged over the past decades, but every new observation stillreveals major unexpected results, demonstrating that solar flares, after 150 years sincetheir discovery, remain a complex problem of astrophysics including major unsolvedquestions.
Keywords Reconnection · X-ray emission · Flare radio emission · Particleacceleration · Magnetic energy release
Contents
1 Introduction . . . . . . . . . . . . . . . . . . . . . . . . . . . . . . . . . . . . . . . . . . . . . 31.1 Detection and definition . . . . . . . . . . . . . . . . . . . . . . . . . . . . . . . . . . . . . 31.2 Brief history of flare observations . . . . . . . . . . . . . . . . . . . . . . . . . . . . . . . . 31.3 The phases of flares . . . . . . . . . . . . . . . . . . . . . . . . . . . . . . . . . . . . . . . 41.4 The big picture . . . . . . . . . . . . . . . . . . . . . . . . . . . . . . . . . . . . . . . . . 51.5 Organization of review . . . . . . . . . . . . . . . . . . . . . . . . . . . . . . . . . . . . . 7
2 Energy release in a coupled solar atmosphere . . . . . . . . . . . . . . . . . . . . . . . . . . . . 82.1 Flares and photospheric field configuration . . . . . . . . . . . . . . . . . . . . . . . . . . . 82.2 Geometry of hard X-ray emissions . . . . . . . . . . . . . . . . . . . . . . . . . . . . . . . 102.3 Return current . . . . . . . . . . . . . . . . . . . . . . . . . . . . . . . . . . . . . . . . . . 142.4 Neupert effect . . . . . . . . . . . . . . . . . . . . . . . . . . . . . . . . . . . . . . . . . . 152.5 Standard flare scenario . . . . . . . . . . . . . . . . . . . . . . . . . . . . . . . . . . . . . 152.6 Evaporation of chromospheric material . . . . . . . . . . . . . . . . . . . . . . . . . . . . . 162.7 Deviations from standard flare scenario . . . . . . . . . . . . . . . . . . . . . . . . . . . . . 19
3 Flare geometry . . . . . . . . . . . . . . . . . . . . . . . . . . . . . . . . . . . . . . . . . . . . 213.1 Geometry of the coronal magnetic field . . . . . . . . . . . . . . . . . . . . . . . . . . . . . 213.2 Coronal hard X-ray sources . . . . . . . . . . . . . . . . . . . . . . . . . . . . . . . . . . . 233.3 Intermediate thin–thick target coronal sources . . . . . . . . . . . . . . . . . . . . . . . . . 243.4 Emissions from above the coronal X-ray source . . . . . . . . . . . . . . . . . . . . . . . . 253.5 Particle acceleration site . . . . . . . . . . . . . . . . . . . . . . . . . . . . . . . . . . . . . 273.6 Energetic ions . . . . . . . . . . . . . . . . . . . . . . . . . . . . . . . . . . . . . . . . . . 283.7 Thermal flare . . . . . . . . . . . . . . . . . . . . . . . . . . . . . . . . . . . . . . . . . . 29
4 Energy budget . . . . . . . . . . . . . . . . . . . . . . . . . . . . . . . . . . . . . . . . . . . . 324.1 Non-thermal electron energy . . . . . . . . . . . . . . . . . . . . . . . . . . . . . . . . . . 334.2 Thermal energy . . . . . . . . . . . . . . . . . . . . . . . . . . . . . . . . . . . . . . . . . 344.3 Energy in waves . . . . . . . . . . . . . . . . . . . . . . . . . . . . . . . . . . . . . . . . . 354.4 Other energies . . . . . . . . . . . . . . . . . . . . . . . . . . . . . . . . . . . . . . . . . . 364.5 Energy input into the corona . . . . . . . . . . . . . . . . . . . . . . . . . . . . . . . . . . 37
5 Signatures of energy release . . . . . . . . . . . . . . . . . . . . . . . . . . . . . . . . . . . . . 395.1 Coronal hard X-ray signatures . . . . . . . . . . . . . . . . . . . . . . . . . . . . . . . . . 395.2 Soft-hard-soft behavior in hard X-rays . . . . . . . . . . . . . . . . . . . . . . . . . . . . . 415.3 Radio emissions from the acceleration region . . . . . . . . . . . . . . . . . . . . . . . . . 42
6 Acceleration processes . . . . . . . . . . . . . . . . . . . . . . . . . . . . . . . . . . . . . . . . 456.1 Electron acceleration theories . . . . . . . . . . . . . . . . . . . . . . . . . . . . . . . . . . 456.2 Comparing theories with observations . . . . . . . . . . . . . . . . . . . . . . . . . . . . . 46
7 Conclusions . . . . . . . . . . . . . . . . . . . . . . . . . . . . . . . . . . . . . . . . . . . . . 47References . . . . . . . . . . . . . . . . . . . . . . . . . . . . . . . . . . . . . . . . . . . . . . . . 49
123

Flare Observations Page 3 of 59 2
1 Introduction
1.1 Detection and definition
Since September 1, 1859, when R. C. Carrington and R. Hodgson observed the firstflare in the continuum of white light, these localized, minute-long brightenings onthe Sun have remained an enigma. Local flaring of the Sun has been reported atall wavelengths accessible from the ground and from space. Thus the word “flare”is used in solar physics today in a rather ill-defined way, describing a syndrome ofapparently related processes at various wavelengths. The problem is even more acutein other languages, such as German and French, denoting flares with the equivalentto “eruption”, which may be confused with coronal mass ejections (CMEs) that oftenhappen simultaneously at the time of large flares. The general use of the term “flare”today often alludes to an “impulsive release of magnetic energy by reconnection”.However, one has to bear in mind that such a definition represents a specific, althoughwidely accepted, interpretation of observations. It may be used as a guide for novices todistinguish flares from other plasma physical phenomena in the solar atmosphere alsoassociated with brightenings, such as the expulsion of magnetic flux or dissipation ofshock waves. Nevertheless, it is better to define the flare phenomenon observationallyas a brightening of any emission across the electromagnetic spectrum occurring at atime scale of minutes to hours. Most manifestations seem to be secondary responses tothe original energy release process, converting magnetic energy into particle energy,heat, waves, and motion.
1.2 Brief history of flare observations
A few years after Carrington and Hodgson, the Sun was studied extensively in thehydrogen Hα line originating in the chromosphere, and the reports of flares becamemuch more frequent, but also bewilderingly complex. Variations of source size, ejec-tions of plasma blobs into interplanetary space, and large-scale chromospheric waves(Moreton 1964) were noted. Meter wave radio emissions, detected serendipitously in1942 during military radar operations, revealed the presence of non-thermal electronsin the corona (Hey 1983). During a radio burst, the solar irradiance in radio waves mayincrease by several orders of magnitude. At about the same time, S. E. Forbush noticedground-level cosmic ray enhancements associated with major solar flares. These dis-coveries could only mean that the flare phenomena are not confined to thermal plasma,but include high-energy particles and involve the corona. In the late 1950s it becamepossible to observe the Sun in hard X-rays (�10 keV) by balloons and rockets. Petersonand Winckler (1959) discovered the first hard X-ray emission during a flare in 1958.Later, the enhancements observed in centimeter1 radio and hard X-ray emissions haveled to the surprising suggestion that the radiating energetic particles may contain a size-
1 The literature often uses the term ‘microwaves’ for frequencies in the range 1–30 GHz, in particularin connection with gyrosynchrotron emission. In the lower wavelength part, microwaves overlap with thedecimeter wavelength range. We will thus use strictly the decimal wavelength notation in this review toavoid confusion.
123

2 Page 4 of 59 Arnold O. Benz
Fig. 1 Still from a movie: SoftX-rays (red), hard X-rays (blue)and gamma-rays (purple)observed by the RHESSIsatellite are overlaid on anoptical Hα image. The moviestarts in white light zooming intoan active region. The color thenchanges to the Hα line ofhydrogen, emitted in thechromosphere. Its brighteningindicates the start of the flare.Visualization by RHESSIscientists
able fraction of the initial flare energy release (Neupert 1968). Hard X-rays are causedby the bremsstrahlung of colliding electrons. The photon distribution in energy exhibitsa non-thermal shape, close to a power-law. Some of the broadband radio emissionsfrom about 1 GHz to beyond 100 GHz result from the gyration of mildly relativisticelectrons in the magnetic field (termed gyrosynchrotron emission). In 1972 the γ -rayline emission of heavy nuclei was discovered, excited by MeV protons (Chupp et al.1973). Finally, thermal millimeter, EUV, and soft X-ray (�10 keV) emissions haveshown that the flare energy heats the plasma of coronal loops to temperatures from1.5 MK to beyond 30 MK. Within minutes, some active-region loops become brilliantsoft X-ray emitters, outshining the rest of the corona. Such temperatures and the accel-eration of non-thermal particles (implying low collision rates) suggest that the flareis originally a coronal phenomenon. As a consequence, the discovery observations inthe white light and later in Hα came to seem like secondary phenomena. However,this view could be questioned, based on the relatively large energy emitted in whitelight (e.g., Emslie et al. 2012). This review will show that present observations getmuch closer to the heart of flares, but still miss the primary process. On the other hand,this review will also demonstrate that flares are not purely coronal. They couple tothe chromosphere in a substantial way and must be understood as processes in whichcorona and chromosphere form an interactive system (as exemplified in Fig. 1).
1.3 The phases of flares
The timing of the different emissions of the same flare is presented schematically inFig. 2. In the preflare phase the coronal plasma in the flare region slowly heats upand is visible in soft X-rays and EUV. It must be added, however, that non-thermalemissions sometimes occur and are observed at locations different from later phases.Large numbers of energetic electrons (up to 1038) and, in some events, ions as well(with similar total energy) are accelerated in the impulsive phase, when most of theenergy is released. The appearance of hard X-ray footpoint sources at chromosphericaltitude is a characteristic of this phase (Hoyng et al. 1981). Some high-energy particlesare trapped and produce intensive emissions in the radio band. The thermal soft X-ray
123

Flare Observations Page 5 of 59 2
Fig. 2 A schematic profile ofthe flare intensity at severalwavelengths. The various phasesindicated at the top vary greatlyin duration. In a large event, thepreflare phase typically lasts afew minutes, the impulsivephase 3–10 min, the flash phase5–20 min, and the decay one toseveral hours. Image reproducedwith permission from Benz(2002), copyright by Kluwer
and Hα emissions finally reach their maxima after the impulsive phase, when energyis more gently released, manifest in decimetric pulsations, and further distributed.The rapid increase in Hα intensity and line width has been termed the flash phase. Itcoincides largely with the impulsive phase, although Hα may peak later. In the decayphase, the coronal plasma returns nearly to its original state, except in the high corona(>1.2 R�, where R� is the photospheric radius), where magnetic reconfiguration,plasma ejections and shock waves continue to accelerate particles, causing meter waveradio bursts and interplanetary particle events. Figure 2 illustrates the various phases.
1.4 The big picture
The flare observations may be ordered in a scenario or a sequence of processes inwhich the flare energy is released in the corona by reconnecting magnetic fields. Theprocess heats the plasma in the reconnection region to temperatures of tens of millionsof degrees Kelvin (MK), but also efficiently accelerates electrons to super-thermalenergies peaking below some 20 keV and extending sometimes to several tens ofMeV. Reconnection is not unique to flares and must take place also in the lower solaratmosphere and in the interior of the Sun. The impulsiveness of flares indicates aslow build up of magnetic energy followed by a “dam breaking” event. In plasmas
123
2 Page 6 of 59 Arnold O. Benz
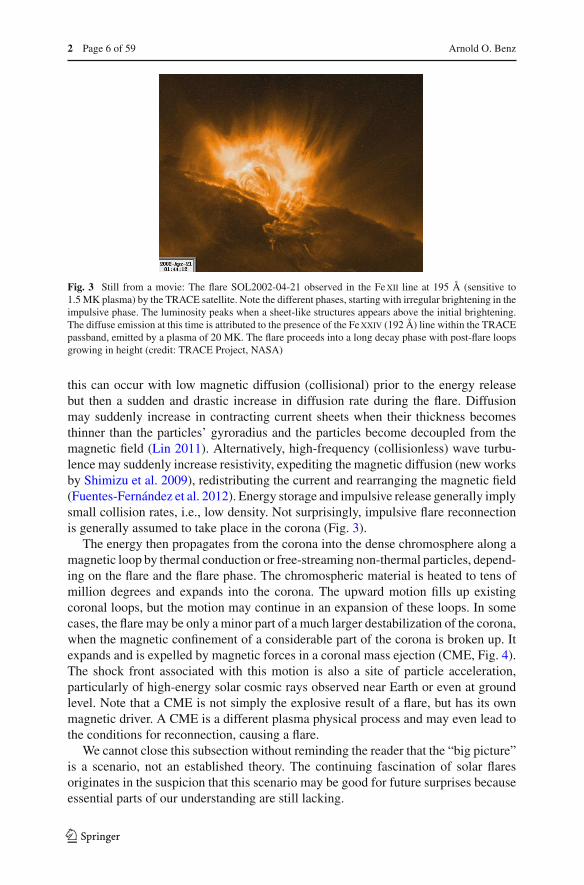
Fig. 3 Still from a movie: The flare SOL2002-04-21 observed in the Fexii line at 195 Å (sensitive to1.5 MK plasma) by the TRACE satellite. Note the different phases, starting with irregular brightening in theimpulsive phase. The luminosity peaks when a sheet-like structures appears above the initial brightening.The diffuse emission at this time is attributed to the presence of the Fexxiv (192 Å) line within the TRACEpassband, emitted by a plasma of 20 MK. The flare proceeds into a long decay phase with post-flare loopsgrowing in height (credit: TRACE Project, NASA)
this can occur with low magnetic diffusion (collisional) prior to the energy releasebut then a sudden and drastic increase in diffusion rate during the flare. Diffusionmay suddenly increase in contracting current sheets when their thickness becomesthinner than the particles’ gyroradius and the particles become decoupled from themagnetic field (Lin 2011). Alternatively, high-frequency (collisionless) wave turbu-lence may suddenly increase resistivity, expediting the magnetic diffusion (new worksby Shimizu et al. 2009), redistributing the current and rearranging the magnetic field(Fuentes-Fernández et al. 2012). Energy storage and impulsive release generally implysmall collision rates, i.e., low density. Not surprisingly, impulsive flare reconnectionis generally assumed to take place in the corona (Fig. 3).
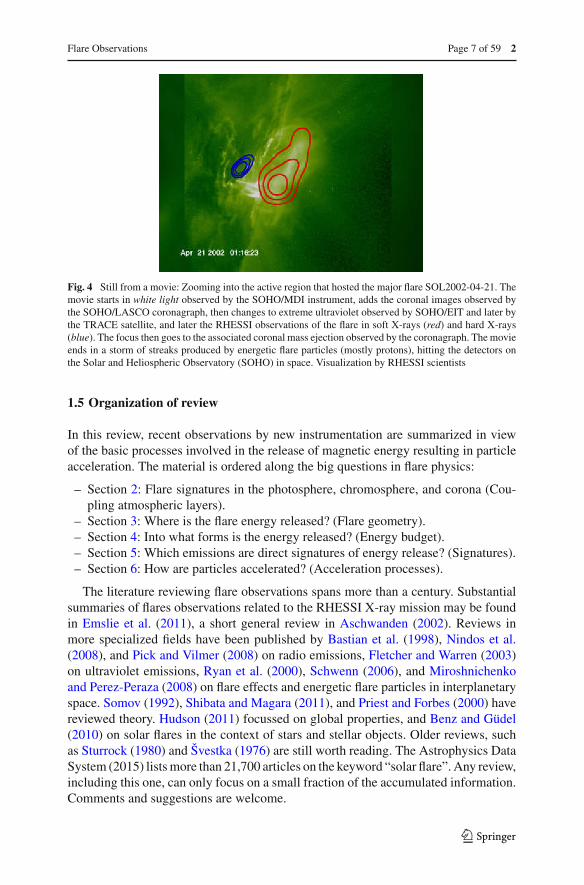
The energy then propagates from the corona into the dense chromosphere along amagnetic loop by thermal conduction or free-streaming non-thermal particles, depend-ing on the flare and the flare phase. The chromospheric material is heated to tens ofmillion degrees and expands into the corona. The upward motion fills up existingcoronal loops, but the motion may continue in an expansion of these loops. In somecases, the flare may be only a minor part of a much larger destabilization of the corona,when the magnetic confinement of a considerable part of the corona is broken up. Itexpands and is expelled by magnetic forces in a coronal mass ejection (CME, Fig. 4).The shock front associated with this motion is also a site of particle acceleration,particularly of high-energy solar cosmic rays observed near Earth or even at groundlevel. Note that a CME is not simply the explosive result of a flare, but has its ownmagnetic driver. A CME is a different plasma physical process and may even lead tothe conditions for reconnection, causing a flare.
We cannot close this subsection without reminding the reader that the “big picture”is a scenario, not an established theory. The continuing fascination of solar flaresoriginates in the suspicion that this scenario may be good for future surprises becauseessential parts of our understanding are still lacking.
123
Flare Observations Page 7 of 59 2
Fig. 4 Still from a movie: Zooming into the active region that hosted the major flare SOL2002-04-21. Themovie starts in white light observed by the SOHO/MDI instrument, adds the coronal images observed bythe SOHO/LASCO coronagraph, then changes to extreme ultraviolet observed by SOHO/EIT and later bythe TRACE satellite, and later the RHESSI observations of the flare in soft X-rays (red) and hard X-rays(blue). The focus then goes to the associated coronal mass ejection observed by the coronagraph. The movieends in a storm of streaks produced by energetic flare particles (mostly protons), hitting the detectors onthe Solar and Heliospheric Observatory (SOHO) in space. Visualization by RHESSI scientists
1.5 Organization of review
In this review, recent observations by new instrumentation are summarized in viewof the basic processes involved in the release of magnetic energy resulting in particleacceleration. The material is ordered along the big questions in flare physics:
– Section 2: Flare signatures in the photosphere, chromosphere, and corona (Cou-pling atmospheric layers).
– Section 3: Where is the flare energy released? (Flare geometry).– Section 4: Into what forms is the energy released? (Energy budget).– Section 5: Which emissions are direct signatures of energy release? (Signatures).– Section 6: How are particles accelerated? (Acceleration processes).
The literature reviewing flare observations spans more than a century. Substantialsummaries of flares observations related to the RHESSI X-ray mission may be foundin Emslie et al. (2011), a short general review in Aschwanden (2002). Reviews inmore specialized fields have been published by Bastian et al. (1998), Nindos et al.(2008), and Pick and Vilmer (2008) on radio emissions, Fletcher and Warren (2003)on ultraviolet emissions, Ryan et al. (2000), Schwenn (2006), and Miroshnichenkoand Perez-Peraza (2008) on flare effects and energetic flare particles in interplanetaryspace. Somov (1992), Shibata and Magara (2011), and Priest and Forbes (2000) havereviewed theory. Hudson (2011) focussed on global properties, and Benz and Güdel(2010) on solar flares in the context of stars and stellar objects. Older reviews, suchas Sturrock (1980) and Švestka (1976) are still worth reading. The Astrophysics DataSystem (2015) lists more than 21,700 articles on the keyword “solar flare”. Any review,including this one, can only focus on a small fraction of the accumulated information.Comments and suggestions are welcome.
123

2 Page 8 of 59 Arnold O. Benz
Fig. 5 Still from a movie: Left white-light image of a sunspot taken with SOT on board the Hinodesatellite. The resolution is 2′′. Visualization by Hinode scientists. Right vector magnetogram showing inred the direction of the magnetic field and its strength (length of the bar). The movie shows the evolution inthe photospheric fields that has led to an X-class flare in the lower part of the active region. Movie courtesyof NAOJ/NINS
2 Energy release in a coupled solar atmosphere
2.1 Flares and photospheric field configuration
Flares can occur everywhere on the Sun, in active regions, sunspots and penumbrae, onthe boundaries of the magnetic network of the quiet Sun, and even in the network inte-rior (Krucker et al. 1997b; Benz and Krucker 1998; Berghmans et al. 1998). Regular(large) flares, however, have preferred locations. They occur in active regions show-ing a complex geometry of the 3D magnetic field as revealed in photospheric vectormagnetograms (Régnier and Canfield 2006, see Fig. 5). Major flares occur in activeregions that exhibit a δ configuration, defined as showing umbrae with mixed magneticpolarity. Flares of the largest size (X-class) are associated with arcades of loops span-ning a line of zero line-of-sight magnetic field on the surface. Hagyard et al. (1990)have shown that the magnetic field in flaring locations is strongly sheared (Fig. 6).Magnetic shear alone, however, is not a sufficient condition. An additional require-ment for large flares is the emergence of new magnetic flux from below (Choudharyet al. 1998). Vector magnetograms often show narrow channels of strong horizontalfield components near the neutral line at the site of large flares (Zirin and Wang 1993).Such fields may already be sheared when emerging and are still moving when theyappear in the photosphere (Georgoulis and LaBonte 2006).
Large-scale shear in the magnetic field can also build up through the slow motion offoot points stretching the length of a loop. This evolution can progress through stablefield configurations. Large-scale sheared fields in active regions store huge amountsof free magnetic energy. The emerging flux may then provide the trigger mechanismfor impulsive energy release. The energy is unleashed above the photosphere, eitherin the chromosphere or corona (Moore et al. 2001). The build-up of the unstableconfiguration for large flares is often well observable in photospheric magnetic fields.Wang et al. (2004) find an increase of the photospheric magnetic field strength duringthe flare, consistent with the scenario of magnetic flux emerging into the corona. In
123

Flare Observations Page 9 of 59 2
Fig. 6 Map of the line-of-sight magnetic field strength measured in a photospheric line by the MSFCmagnetograph. Solid curves denote positive field, dashed curves the negative field, and the dotted curve theneutral line. Circles indicate where the transverse field deviates between 70◦ and 80◦ from the potentialfield (perpendicular to the neutral line), and filled squares indicate deviations >80◦. A large flare (X3 class)occurred several hours later at the location of the largest shear. Image reproduced with permission fromHagyard et al. (1990), copyright by AAS
all of the 15 X-class flares studied by Sudol and Harvey (2005) there was an abrupt,significant, and persistent change in the photospheric magnetic field. A frequent flaresite is the separatrix between different magnetic loop systems (Démoulin et al. 1997)forming a current sheet, or in a cusp-shaped coronal structure (Longcope 2005). Thereis also evidence for flares being related to helical magnetic fields (Low 1996; Pevtsovet al. 1996).
Photospheric observations clearly support the scenario that flare energy originatesfrom free magnetic energy in excess of the potential value (defined by the photosphericboundary) or, equivalently, from electric currents in the corona. For a rapid release, thecurrents must be concentrated into small regions (e.g., Priest and Forbes 2000). Suchcurrents may be inferred observationally in regions with a tangential discontinuity ofthe magnetic field direction in the system of rising loops near the base of the corona(Solanki et al. 2003; Musset et al. 2015).
The flare energy resides in the magnetic field that originated in the interior and isconvected to the surface. Not much can be observed of the flare processes until theenergy appears in the form of accelerated particles and extremely hot plasma. In thenext section we switch from the origin and build-up to the first observable signatureafter the primary energy release.
123

2 Page 10 of 59 Arnold O. Benz
Fig. 7 X-ray spectrum of a flare observed by the RHESSI satellite. The soft part is fitted with a thermalcomponent (green) having a temperature of 16.7 MK, and the high-energy part with a power law havingtwo breaks at 12 keV (possibly due to the acceleration process if real) and at 50 keV, of which the origin isunknown. Image courtesy of Paolo Grigis, for details see Grigis and Benz (2004)
2.2 Geometry of hard X-ray emissions
An electron that hits another particle in a Coulomb collision emits bremsstrahlung.In fully ionized plasma, this is the physical process also known as free-free radiationof thermal electrons, produced by free electrons scattering off ions without beingcaptured. The change in direction and momentum may cause a particle with somekeV energy or greater to emit X-ray photons. Bremsstrahlung (X-ray emissions) ofthermal and non-thermal electron populations are shown in Fig. 7.
The cross-section of a single electron for producing an X-ray photon of a certainenergy can be described by the quantum-mechanical Bethe-Heitler formalism. The
123

Flare Observations Page 11 of 59 2
instantaneous emissivity of an electron propagating in a plasma is known as the “thintarget approximation”. It does not account for the resulting particle energy change tobe considered in further collisions. If the target is deep enough, the incident particleslows down to thermal speed. The total radiation is therefore the integral in timeover all emissions starting at the entry into the target until the particle energy isthermalized. If other deceleration processes than Coulomb collisions can be excluded,this is the “collisionally thick target” situation (Brown 1971). The thick-target X-rayspectrum of an electron beam is flatter (usually called harder) than that producedin any thin target it may traverse before, as it includes emission of the deceleratingelectrons. In an ideal situation including a power-law distribution of electron energies,the power-law index of thin target emission is smaller by 2 than the thick targetspectrum.
The emission of hard X-rays with a non-thermal energy distribution was first locatedby Hoyng et al. (1981) at footpoints of coronal loops. Based on stereoscopic observa-tions, Kane (1983) reported that 95% of the �150 keV X-ray emission in impulsiveflares originates at altitudes �2500 km, that is at the level of the chromosphere. Brownet al. (1983) concluded that this upper limit in altitude satisfies the collisional thick-target model in which precipitating electrons lose their energy in the dense, cold target.The emission presumably originates from flare-accelerated electrons precipitating intothe chromosphere. They follow the field line until they reach a density high enoughfor collisions and emit bremsstrahlung while scattering and slowing down. Footpointsources are also occasionally found on Hα flare ribbons some 30,000 km apart, tracingthe base of a magnetic arcade (Masuda et al. 2001). The connecting loops are observedin thermal soft X-ray emission, indicating that the density has greatly increased. Den-sities of more than 1011 cm−3 are frequently reported (e.g., Švestka 1976; Tsunetaet al. 1997) and agree with the concept of “chromospheric evaporation”. Evaporationis actually a misnomer and refers to the expansion and possible explosion of chro-mospheric material heated by precipitating particles. Up-streaming plasma filling upa coronal loop has been observed in blue shifted lines (Antonucci et al. 1982; Mariskaet al. 1993).
Flare footpoints are usually observed to move, indicating propagation of the energyrelease site (Krucker et al. 2003). Reconnection in a cusp above the flare ribbonspredicts that footpoints move apart. Contrary to expectation, parallel motion alongthe flare arcade has also been reported by Grigis and Benz (2005a) and Bogachevet al. (2005) (see movie in Fig. 8). Stochastic jumps in the time evolution are frequent(Fletcher et al. 2004; Krucker et al. 2005a). These hard X-ray observations suggeststhat most of the flare energy at a given site is released in an initial burst. The footpointsmove apart perpendicular to the flare ribbon. It is well observed in Hα, but appearsto be the result of a more gentle energy release in a later flare phase (Švestka 1976;Martin 1989).
Hard X-rays have been noted to correlate in time with Hα kernels (Vorpahl 1972;Wülser and Marti 1989), indicating that the flare energy reaches the dense part of thechromosphere within less than 10 s. Hard X-ray footpoints coincide spatially with Hα
kernels (Radziszewski et al. 2007, see Fig. 9).Hard X-ray footpoints and soft X-ray flare loops are consistent with the standard
flare scenario of energy release in the corona, energy transport to the chromosphere and
123

2 Page 12 of 59 Arnold O. Benz
400 420 440 460 480 500X (arcseconds)
-280
-260
-240
-220
-200
-180
Y(a
rcse
cond
s)
Fig. 8 Still from a movie: Hard X-ray footpoints (with error bars) observed with the RHESSI satelliteduring the flare SOL2002-11-09. Simultaneous footpoints are connected by a line colored sequentially withtime. The footpoint information is overlaid on a SOHO/EIT image at 195 Å, indicating enhanced density inthe corona. The movie shows two simultaneous footpoints connected by a vertical half-circle. The flux ateach footpoint is indicated by the size of the purple circle at logarithmic scale (see Grigis and Benz 2005a).Movie courtesy of Paolo Grigis
Fig. 9 Still from a movie: LeftRHESSI flare observations ofsoft X-rays (red 8–12 keV) andhard X-rays (blue 20–50 keV)overlaid on an Hα background.Note the high-energy footpointsmoving on the Hα flare ribbons,which moves apart in the verylate phase. Visualization byRHESSI scientists
chromospheric evaporation, but where is the energy released? First hints came from athird hard X-ray source above the soft X-ray loop (Masuda et al. 1994). The coronalX-ray emission contains a thermal part, dominating at low energies, and a weak non-thermal part above about 8–10 keV. The non-thermal spectrum of the coronal source isusually soft (Mariska and McTiernan 1999; Petrosian et al. 2002), consistent with the
123

Flare Observations Page 13 of 59 2
Fig. 10 Reconstructed(CLEAN) image ofSOL2006-07-13T14 in hardX-rays observed by the RHESSIsatellite. The curved lineindicates the limb of thephotosphere. The displayedenergy range 12–50 keV isdominated by the low energies,where the coronal source (right)prevails. Two footpoints (left)are clearly visible on the disk.Image courtesy of MarinaBattaglia, for details seeBattaglia and Benz (2008)
idea of a thin target (Datlowe and Lin 1973). Thus, the accelerated electrons lose onlya small fraction of their energy and continue to propagate towards the chromosphere.In the chromosphere they meet a thick target, yielding a harder spectrum (Brown 1971;Hudson 1972). An example showing two footpoints and a coronal source is shownin Fig. 10. In exceptional cases, only the fastest electrons reach the chromosphere(Veronig and Brown 2004). The coronal source often appears before the main flarehard X-ray increase, but is well correlated in time and spectrum with the footpoints(Emslie et al. 2003). These observations suggest strong coupling between corona andchromosphere during flares.
The altitude of coronal hard X-ray sources, some 6000–25,000 km, is compatiblewith observed time delays of hard X-ray peaks emitted at the footpoints (Aschwan-den et al. 1995). Low energy photons are emitted later compared to higher energyphotons. Delay-time observations scale with the observed lengths of the soft X-rayloop (Aschwanden et al. 1996), consistent with the interpretation of longer propaga-tion times of lower energy electrons. If only time-of-flight effects are assumed, thepropagation path would put the acceleration above the loop-top hard X-ray source.The assumption of simultaneous injection puts strong constraints on the timescalesinvolved on the acceleration process (Brown et al. 1998).
The difference in the spectrum of coronal source and footpoints can be taken as atest for the geometry. Measurements by Petrosian et al. (2002) show that the power-law indices differ by about 1 on the average, contrary to expectations. A possibleinterpretation for a value less than 2 may be a mixture of thick and thin target emissions,overlapping in the observed resolution element. On the other hand, an analysis basedon RHESSI data demonstrates the existence of index differences larger than 2 in 3out of 9 events (Battaglia and Benz 2007). This discrepancy requires a more completephysical scenario than ballistic particle motion and will be discussed in the followingsection.
123
2 Page 14 of 59 Arnold O. Benz
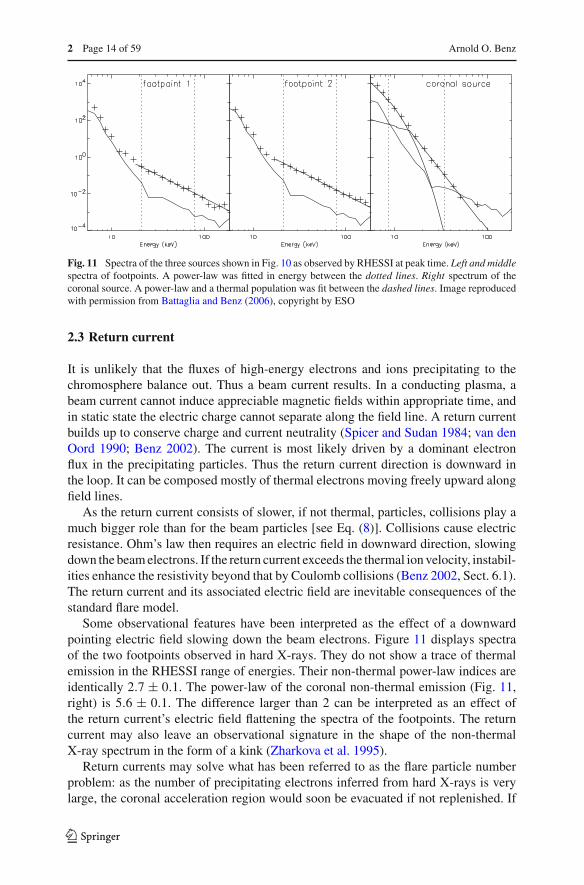
Fig. 11 Spectra of the three sources shown in Fig. 10 as observed by RHESSI at peak time. Left and middlespectra of footpoints. A power-law was fitted in energy between the dotted lines. Right spectrum of thecoronal source. A power-law and a thermal population was fit between the dashed lines. Image reproducedwith permission from Battaglia and Benz (2006), copyright by ESO
2.3 Return current
It is unlikely that the fluxes of high-energy electrons and ions precipitating to thechromosphere balance out. Thus a beam current results. In a conducting plasma, abeam current cannot induce appreciable magnetic fields within appropriate time, andin static state the electric charge cannot separate along the field line. A return currentbuilds up to conserve charge and current neutrality (Spicer and Sudan 1984; van denOord 1990; Benz 2002). The current is most likely driven by a dominant electronflux in the precipitating particles. Thus the return current direction is downward inthe loop. It can be composed mostly of thermal electrons moving freely upward alongfield lines.
As the return current consists of slower, if not thermal, particles, collisions play amuch bigger role than for the beam particles [see Eq. (8)]. Collisions cause electricresistance. Ohm’s law then requires an electric field in downward direction, slowingdown the beam electrons. If the return current exceeds the thermal ion velocity, instabil-ities enhance the resistivity beyond that by Coulomb collisions (Benz 2002, Sect. 6.1).The return current and its associated electric field are inevitable consequences of thestandard flare model.
Some observational features have been interpreted as the effect of a downwardpointing electric field slowing down the beam electrons. Figure 11 displays spectraof the two footpoints observed in hard X-rays. They do not show a trace of thermalemission in the RHESSI range of energies. Their non-thermal power-law indices areidentically 2.7 ± 0.1. The power-law of the coronal non-thermal emission (Fig. 11,right) is 5.6 ± 0.1. The difference larger than 2 can be interpreted as an effect ofthe return current’s electric field flattening the spectra of the footpoints. The returncurrent may also leave an observational signature in the shape of the non-thermalX-ray spectrum in the form of a kink (Zharkova et al. 1995).
Return currents may solve what has been referred to as the flare particle numberproblem: as the number of precipitating electrons inferred from hard X-rays is verylarge, the coronal acceleration region would soon be evacuated if not replenished. If
123

Flare Observations Page 15 of 59 2
only electrons escape from the acceleration region, the return current keeps the electrondensity constant. If also ions escape, the acceleration region is evacuated. This maybe avoided by a pressure driven flow of neutral plasma. None of the observationalsignatures, however, for both neutral flow and return current are fully established, andtheir existence still needs corroboration.
2.4 Neupert effect
Neupert (1968) noted that in the rise phase of the soft X-rays their flux correspondsto the time integral of the centimeter radio flux since the start of the flare. As thecentimeter flare emission is emitted by relativistic electrons, it is not surprising that thesame correlation was later also found between the soft X-ray flux and the cumulativetime integral of the hard X-ray flux, i.e.,
FSXR(t) ∝∫ t
t0FHXR(t ′) dt ′ , (1)
or, equivalently, d
dtFSXR(t) ∝ FHXR(t) . (2)
This empirical relationship is called the “Neupert effect”. An example is presentedin Fig. 12. Already Neupert (1968) suggested that there may be a direct causal relationbetween the energetic electrons and the thermal plasma: the soft X-rays originate from aplasma heated chiefly by the accumulated energy deposited through flare acceleratedelectrons. It must be remarked here that Eq. (1) is an approximation and disagreesoccasionally with observations, for example when cooling (by conduction or radiation)is significant.
2.5 Standard flare scenario
The assumption of a strict causal relation between soft X-ray emission and hard X-raysignatures of energetic electrons has led to a simple scenario. It postulates that flareenergy release consists of accelerating particles. The acceleration process is not part ofthe scenario. Energetic particles then precipitate to the chromosphere, where they heatthe plasma to the high temperatures observed in soft X-rays. The hot plasma expandsalong the loop into the corona, a process termed “evaporation”. This simple scenariocan explain several phenomena observed in flares:
– Correlation of soft X-ray flux with cumulative hard X-ray flux (Neupert effect)– Hard X-rays (>25 keV) often originate from sources at the footpoints of the loop
emitting soft X-rays.– The coronal hard X-ray source, where reconnection releases energy, is occasionally
observed to be above the soft X-ray loop, into which energy was release beforeand which is still emitting soft X-rays (Masuda et al. 1994).
– The energy in accelerated electrons tends to be larger than the thermal energycontained in the soft X-ray source (see discussion in Sect. 4).
123

2 Page 16 of 59 Arnold O. Benz
Fig. 12 The time derivative (middle) of the soft X-ray flux (top, observation by the GOES satellite)correlates in 80% of the flares with the hard X-ray flux (bottom, observation of HXRBS on the SMMsatellite). This is an example of what is called the Neupert effect. Image reproduced with permission fromDennis and Zarro (1993), copyright by Springer
– The hard X-ray spectrum of non-thermal electrons in the coronal source is con-siderably softer than in the footpoints, suggesting that the latter is a thick target.In thick targets an electron loses all its kinetic energy, and its bremsstrahlungemission is the result of all collisions until the particle comes to full stop.
– The emission measure of the soft X-ray source greatly increases during the impul-sive phase, indicating that chromospheric material is evaporating during thisperiod. Evaporation has been observed directly, first in blue-shifted lines of hotmaterial, later also in soft X-ray images (see following section).
Henceforth we refer to this scenario as the standard scenario (Fig. 13). It shouldbe noted that it is not a quantitative theory, but a an attempt to order some, but not allobservations. The cusp on top suggests that the magnetic reconnection may open upthe coronal loop, which happens only for some large flares.
2.6 Evaporation of chromospheric material
When energetic electrons (and possibly ions) precipitate from the coronal accelera-tion site and lose their energy in the dense underlying chromosphere via Coulombcollisions, the plasma responds dynamically. Note that the same may result also from
123

Flare Observations Page 17 of 59 2
Fig. 13 A schematic drawing of the standard flare scenario assuming energy release at high altitudes
heat conduction, when thermal particles transport the energy released in the corona.The temperature in the chromosphere increases and the resulting pressure exceeds theambient chromospheric pressure. If the overpressure builds up sufficiently fast, theheated plasma expands explosively along the magnetic field in both directions. Theexpansion of this plasma into the corona was first reported by Doschek et al. (1980)and Feldman et al. (1980). It was thoroughly studied in blue-shifted lines of Caxixby Antonucci et al. (1982), who found plasma at a temperature of 20 MK, movingwith 300 to 400 km s−1 and filling up the loop (Fig. 14). More recent observationsusing Hinode/EUV suggest a temperature-dependent upflow velocity of ≈8–18T kms−1 in the temperature range of T = 2–16 × 106 K (Milligan and Dennis 2009).Chromospheric evaporation was reviewed by Milligan (2015).
The evaporated hot plasma appears to be the source of most of the soft X-rayemission (Neupert 1968; Silva et al. 1997). Thus, the soft X-ray emitting plasma accu-mulates a significant fraction of the energy in the precipitating non-thermal electrons.Consequentially, the soft X-ray emission is proportional to the integrated precedinghard X-ray flux. As already noted by Neupert (1968), this may explain the effectnamed after him. Note that the scenario assumes that the observed soft X-ray plasmais not heated by the primary flare energy release, but is a secondary product when flareenergy is transported to the chromosphere. This is an important point to remember intheories assuming that the coronal plasma is heated by flares.
The evaporation scenario predicts a linear relation between instantaneous energydeposition rate by the electron beam and time derivative of the cumulative energy inthe thermal plasma, thus a linear relation between hard X-ray flux and derivative of thesoft X-ray flux (Fig. 12). This is not always the case (Dennis and Zarro 1993). Thereare several reasons for this: (i) the spectral index of the hard X-rays changes with timein most flares (Sect. 5.2), (ii) the flare energy may be preferentially transported by
123
2 Page 18 of 59 Arnold O. Benz
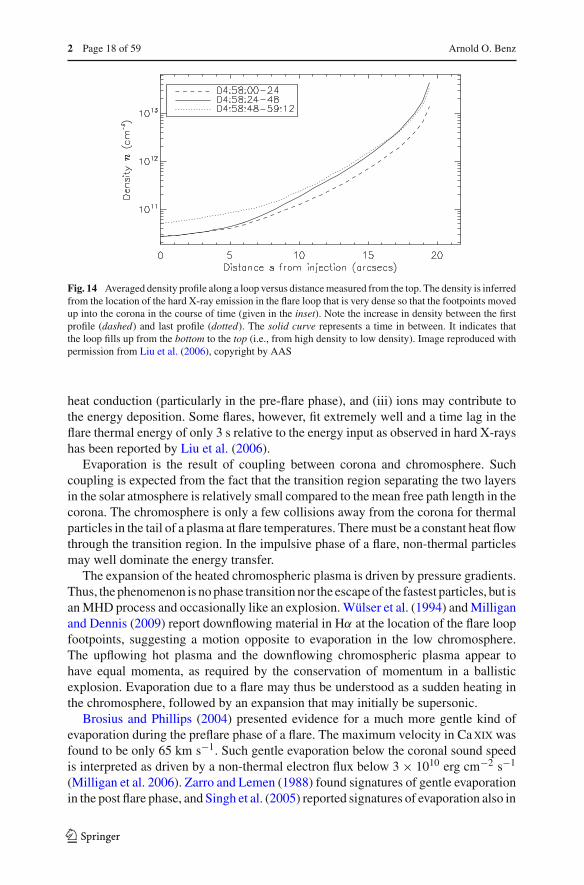
Fig. 14 Averaged density profile along a loop versus distance measured from the top. The density is inferredfrom the location of the hard X-ray emission in the flare loop that is very dense so that the footpoints movedup into the corona in the course of time (given in the inset). Note the increase in density between the firstprofile (dashed) and last profile (dotted). The solid curve represents a time in between. It indicates thatthe loop fills up from the bottom to the top (i.e., from high density to low density). Image reproduced withpermission from Liu et al. (2006), copyright by AAS
heat conduction (particularly in the pre-flare phase), and (iii) ions may contribute tothe energy deposition. Some flares, however, fit extremely well and a time lag in theflare thermal energy of only 3 s relative to the energy input as observed in hard X-rayshas been reported by Liu et al. (2006).
Evaporation is the result of coupling between corona and chromosphere. Suchcoupling is expected from the fact that the transition region separating the two layersin the solar atmosphere is relatively small compared to the mean free path length in thecorona. The chromosphere is only a few collisions away from the corona for thermalparticles in the tail of a plasma at flare temperatures. There must be a constant heat flowthrough the transition region. In the impulsive phase of a flare, non-thermal particlesmay well dominate the energy transfer.
The expansion of the heated chromospheric plasma is driven by pressure gradients.Thus, the phenomenon is no phase transition nor the escape of the fastest particles, but isan MHD process and occasionally like an explosion. Wülser et al. (1994) and Milliganand Dennis (2009) report downflowing material in Hα at the location of the flare loopfootpoints, suggesting a motion opposite to evaporation in the low chromosphere.The upflowing hot plasma and the downflowing chromospheric plasma appear tohave equal momenta, as required by the conservation of momentum in a ballisticexplosion. Evaporation due to a flare may thus be understood as a sudden heating inthe chromosphere, followed by an expansion that may initially be supersonic.
Brosius and Phillips (2004) presented evidence for a much more gentle kind ofevaporation during the preflare phase of a flare. The maximum velocity in Caxix wasfound to be only 65 km s−1. Such gentle evaporation below the coronal sound speedis interpreted as driven by a non-thermal electron flux below 3 × 10¹⁰ erg cm−2 s−1
(Milligan et al. 2006). Zarro and Lemen (1988) found signatures of gentle evaporationin the post flare phase, and Singh et al. (2005) reported signatures of evaporation also in
123

Flare Observations Page 19 of 59 2
a non-flaring state of a loop, suggesting thermal conduction of a hot coronal loop as thedriver. These observations confirm that the evaporative response of the chromospheredepends sensitively on the flux of incident electrons. Fisher and Hawley (1990) havestudied evaporation due to thermal energy input into the corona. Evaporation resultingfrom non-thermal particle precipitation has been simulated by several groups (Sterlinget al. 1993; Hori et al. 1998; Reeves et al. 2007). In general, the results of thesesimulations agree with observed flare emissions quite well, indicating that the standardscenario of solar flares is energetically consistent with observations.
2.7 Deviations from standard flare scenario
A variant of the standard scenario has been proposed for flares without footpoints(Veronig et al. 2002; Veronig and Brown 2004). The flare loop has been found sodense that accelerated electrons have collisions already in the corona and lose a largefraction of their energy to the flare loop (Fig. 15). A preceding flare at the same locationmay have produced the high density of the loop (Strong et al. 1984; Bone et al. 2007).
There are other indications, that the standard scenario is not sufficient. In abouthalf of the hard X-ray events, the Neupert behavior is violated in terms of relativetiming between soft and hard X-ray emissions (Dennis and Zarro 1993; McTiernanet al. 1999; Veronig et al. 2002). This is particularly obvious in flares with soft X-rayspreceding the hard X-ray emission. Such preheating is well known and cannot beexplained by lacking hard X-ray sensitivity (e.g., Benz et al. 1983; Jiang et al. 2006).Soft X-ray brightenings at footpoints with durations less than a minute have beenreported by McTiernan et al. (1993) and Hudson et al. (1994), indicating impulsiveheating to some 10 MK or more. However, it has been noted by several authors thatthe plasma in the coronal source at the top is generally hotter than at the footpoints ofthe loop.
An alternative to the standard scenario is that the soft X-ray emitting plasma is notheated exclusively by high-energy electrons (e.g., Acton et al. 1992; Dennis and Zarro1993). A likely amendment to the standard scenario is that some coronal particles getso little energy during flare energy release that they have frequent enough collisions toapproximately retain their Maxwellian velocity distribution. Thus their energizationcorresponds to heating. In a preflare, the heat of the coronal source may reach thechromosphere by thermal conduction. Depending on the rate of the energy release,particles may gain sufficient energy that collisions become infrequent [Eq. (8)]. Theseparticles then are accelerated further, get a non-thermal velocity distribution, and mayeventually leave the energy release region in the flare phase.
The standard scenario requires a dense beam of electrons to propagate from theacceleration region to the footpoints. There are observations that cast doubts on thisbeaming: (i) The required beam density is very high and may be unstable (Krucker et al.2011). (ii) The hard X-ray emission of the beam is isotropic, contrary to expectations(Dickson and Kontar 2013). (iii) The hard X-ray source is observed at very low height,lower than expected for the energy deposition of a beam (Martínez Oliveros et al. 2012).To avoid the problems with the beam model, Fletcher and Hudson (2008) proposeda different scenario, where the energy released through reconnection is transported
123

2 Page 20 of 59 Arnold O. Benz
Fig. 15 RHESSI observations at 6–12 keV (colors) and 25–50 keV (contours) of a coronal flare. The high-energy photons have a non-thermal origin and originate near the loop-top without pronounced footpoints.Image reproduced with permission from Veronig and Brown (2004), copyright by AAS
123

Flare Observations Page 21 of 59 2
by Alfvén waves, which accelerate electrons near the chromospheric footpoints. Thesimple fact that alternative scenarios are still seriously discussed may remind the gentlereader to mistrust any scenario.
3 Flare geometry
3.1 Geometry of the coronal magnetic field
While there is nearly unanimous agreement that sheared or anti-parallel magnetic fieldsprovide the flare energy released in an impulsive reconnection, the geometry of thesemagnetic fields in the corona at large scale is not clear. The prevalent view is depictedin Figs. 13 and 16 (left), as well as illustrated by a coronagraph image in Fig. 16(right). The scenario has evolved over the past four decades and is generally creditedto Carmichael (1964), Sturrock (1966), Hirayama (1974), and Kopp and Pneuman(1976). So it also named CSHKP scenario after these scientists. It is basically a two-dimensional geometry and an oversimplification in most cases. Its major assumptionis a magnetic loop that is pinched at its legs. The loop may be extremely large ormoving outward, so that its legs consist of oppositely directed (anti-parallel) fields.As a result of reconnection, the top of the loop is ejected as a plasmoid. The bestevidence for this geometry are vertical cusp-shaped structures seen in soft X-raysafter the flare (Tsuneta et al. 1997; Shibata 1999; Sui et al. 2006). The cusp growswith time, and higher loops have a higher temperature (Hori et al. 1997), as predicted bycontinuous reconnection. The observational evidence also includes horizontal inflowsof cold material from the side and two sources of hot plasma that move away fromthe X-point upward and downward. The observations of the former has been reportedfor a single event by Yokoyama et al. (2001) and Chen et al. (2004). Hot sourcesbeing ejected are more frequently observed in soft X-ray (Shibata et al. 1995). Theyhave been noticed to be associated with drifting pulsating structures in decimetricradio emission (Khan et al. 2002) indicating the presence of non-thermal electrons.The reported association with hard X-rays and centimeter radio emission (caused bythe synchrotron emission of mildly relativistic electrons) suggests that the plasmoidsalso include highly energetic particles (Hudson et al. 2001). There is also occasionalevidence for the downward reconnection outflow in addition to the observed upwardmotion of the soft X-ray source (McKenzie and Hudson 1999; Sui et al. 2004). Finally,the existence of two ribbons marking the footpoints of an arcade of loops in Hα,EUV, and X-ray emissions (Fig. 8) is long-standing evidence for the one-loop model,stretched into a third dimension. It should be noted that these elements specific to theCSHKP scenario are rarely observed, and this kind of flare may occur less frequentlythan expected from its popularity.
In another also widely proposed geometry, two non-parallel loops meet and recon-nect. There are several possibilities or the cause of such interaction. Merging magneticdipoles (Sweet 1958), collision of an newly emerging loop with a pre-existing loop,proposed by Heyvaerts et al. (1977), or the breakthrough of the emerging loop throughthe corona (Antiochos 1998). In such a scenario the geometry is closed, i.e., no mag-netic field line leads from the energy release site to interplanetary space. Ejecta leaving
123

2 Page 22 of 59 Arnold O. Benz
Fig. 16 Left a schematic drawing of the one-loop flare model. Right observation of an apparent X-pointbehind a coronal mass ejection observed by LASCO/SOHO in white light (copyright by NASA)
the Sun are still possible, but not as necessary ingredient of the model. Thus, the two-loop model is often proposed for non-eruptive “compact flares”. The model predictsthe existence of 4 footpoints. The number of footpoints in hard X-rays rarely exceedstwo. However, radio observations have been presented that complement the number ofX-ray footpoints, resulting in the frequent detection of three or more footpoints (Kundu1984; Hanaoka 1996, 1997). Nishio et al. (1997) find that the two loop considerablydiffer in size and that the smaller loop usually dominates the X-ray emission. There isalso evidence from recent pre-flare EUV observations for multiple-loop interactions(Sui et al. 2006).
One-loop flare models of the CSHKP type predict the presence of plasmoids ininterplanetary space, suggesting a detached bubble (i.e., magnetic field lines that closewithin the solar wind). Such plasmoids are characterized by the lack of suprathermalelectrons (few times thermal) because their field lines are disconnected from the Sun.They have indeed been reported (Gosling et al. 1995). More frequently observed arecounter-streaming suprathermal electrons, indicating that the field line is closed, i.e.,still connected to the Sun on both sides (Crooker et al. 2004). According to theseauthors, such features in the electron distribution are frequently observed in magneticclouds associated with CMEs. Nevertheless, they are not associated with the greatnumber of smaller flares.
Furthermore, there is a well-known association of nearly every large flare withtype III radio bursts at meter wavelengths, produced by electron beams escaping fromthe Sun on open field lines connected to interplanetary space. Benz et al. (2005) reportthat 33% of all RHESSI hard X-ray flares larger than C5 in GOES class are associatedwith such bursts. This suggests that in a third of all flares at least one of the four endsof reconnecting field lines is open. As type III bursts represent only a small fractionof the flare energy, this may not hold for the major flare energy release site, but onlyto subsites. We note, furthermore, that type III bursts very often occur also in theabsence of reported X-ray flares (Kane et al. 1974). The energy release by an openand a closed field line, termed interchange reconnection, has been proposed sometime ago (Heyvaerts et al. 1977; Fisk et al. 1999) and applied more recently to in situobservations in a CME (Crooker and Webb 2006).
In conclusion, there is good evidence for both the one-loop and two-loop scenariosfor the geometry of the coronal magnetic field in solar flares. There is no reason to
123

Flare Observations Page 23 of 59 2
assume that they exclude each other. The combination of both in the same flare atdifferent stages, hybrids of a closed loop reconnecting with an erupting loop, andother scenarios are also conceivable. Thus we do not state a standard geometry for thepreflare coronal magnetic field configuration. The magnetic topologies of one loop,interchange and two loop are generally classified as dipolar, tripolar, and quadrupolar,respectively. In addition, 2D and 3D versions can be distinguished (Aschwanden 2002),and various nullpoint geometries have been proposed (Priest and Forbes 2000).
3.2 Coronal hard X-ray sources
In the standard flare scenario, where the flare energy is released in the corona andnon-thermal particles are accelerated in the corona, coronal X-ray emission showinga non-thermal photon energy distribution must attract special attention. It is generallyassumed that its emission is near or in the acceleration region. This section thusconcentrates on flare-related X-ray emissions from well above the chromosphericfootpoints.
The ordinary corona has a low density that is not favorable of hard X-ray emission.However, such radiation was discovered as soon as it became technically feasible.Frost and Dennis (1971) reported an extremely energetic event from active regionbehind the limb. Its origin must have been at an altitude of about 45,000 km abovethe photosphere. The presence of non-thermal electrons in coronal sources has beeninferred by the first observers based on the high energy of the detected photons,exceeding 200 keV and in some cases up to 800 keV (Krucker et al. 2008b). Coronalhard X-ray observations have been studied essentially event-by-event beyond the limb(e.g., Hudson 1978; Kane 1983) until it became possible to image hard X-rays thanksto the RHESSI satellite (Lin et al. 2002). Krucker et al. (2008a) have reviewed theRHESSI results concerning the coronal X-ray sources of flares.
Occasional emission of bremsstrahlung photons by non-thermal electrons in thecorona may not be surprising, the observed intensity is. It is so high because of a highdensity of the background plasma. Estimates of the loop-top density from soft X-raysand EUV lines are typically around 1010 and can reach up to a few times 1012 cm−3
(Tsuneta et al. 1997; Feldman et al. 1994; Veronig and Brown 2004; Liu et al. 2006;Battaglia and Benz 2006). The reported temperatures are several ten millions of degree(Lin et al. 1981), producing a pressure up to 5 × 10³erg cm−3. The pressure balancewith the magnetic field would require a field strength up to 350 G. The longevity ofsuch structures is enigmatic. What is the origin of this thermal loop-top source?
Thermal loop-top sources have first been interpreted in terms of chromosphericevaporation. Thus one may expect them to follow the Neupert behavior where thesoft X-rays are proportional to the hard X-ray flux integrated over prehistory. It isthen incomprehensible that thermal coronal sources appear before the start of the hardX-ray emission. In fact, the most prominent feature in the preflare phase (if any) is theearly appearance of a thermal source at the loop-top. The material content (emissionmeasure) in these sources greatly exceeds the normal value in the active region corona.Thus it must have evaporated from the chromosphere, although not necessarily fromthe same footpoints.
123

2 Page 24 of 59 Arnold O. Benz
A characteristic of the thermal source is the temperature distribution with loopheight. The highest looptops usually show Fexxiv emission, suggesting a temperatureof some 20 MK, while at the same time lower-laying loops show emission in the Fexiand Fexii lines characteristic for temperatures between 1–3 MK (Warren et al. 1999).The thermal emission must not be confused with the thermal X-ray emission fromgiant arches observed in the post-flare phase (Švestka 1984).
Masuda et al. (1994) have reported hard X-ray emission from above the ther-mal X-ray loop. Historically, this has raised great interest as it seemed to confirmthe scenario of reconnection in a current sheet in a vertical cusp-shaped structurefar above the soft X-ray loops. However, this seems to be rather exceptional. Inmore recent studies, the large majority of non-thermal sources are nearly cospatialwith the thermal source (Krucker et al. 2008a). However, the non-thermal sourceis often seen a few arcseconds higher, at the location where later the thermal loopappears (e.g., Tomczak 2001; Krucker et al. 2007). This is consistent with the stan-dard model where the sites of reconnection and acceleration acceleration are movingupward.
Stereoscopic observations by two spacecraft (Kane 1983) and recent RHESSI obser-vations find that the non-thermal emission from the corona and the footpoints correlatein time. Even the soft-hard-soft behavior (Sect. 5.2) was detected in the coronal source(Battaglia and Benz 2007). The coronal hard X-ray emission is not always stationary.Upward motions have been reported with velocities of about 1000 km s−1 followingthe direction of a preceding CME (Hudson et al. 2001; Sui et al. 2004; Liu et al.2008).
The coronal source has been observed to emit hard X-rays even in the pre-flarephase before footpoints appear. Astonishingly, non-thermal emission at centimeterwavelengths, suggesting the presence of relativistic electrons, has also been reportedin such sources (Asai et al. 2006).
3.3 Intermediate thin–thick target coronal sources
The observation of coronal sources suggests a model that consists of four basic ele-ments: a particle accelerator above the top of a magnetic loop (consistently imaginedat the peak of a cusp), a coronal source visible in SXR and HXR, collision-less propa-gation of particles along the magnetic loop and HXR-footpoints in the chromosphere.Wheatland and Melrose (1995) developed a simple model that has been used andinvestigated further (e.g., Metcalf and Alexander 1999; Fletcher and Martens 1998).The thermal coronal source acts as an intermediate thin–thick target on electronsdepending on energy (thick target for lower energetic electrons, thin target on higherenergies). This model is known as intermediate thin–thick target, or ITTT model.It features a dense coronal source into which a beam of electrons with a power-lawenergy distribution is injected. Some high-energy electrons then leave the dense regionand precipitate down to the chromosphere. The coronal region acts as a thick targeton particles with energy lower than a critical energy Ec and as thin target on elec-trons with energy > Ec. This results in a characteristic hard X-ray spectrum showinga broken power-law as well as soft X-ray emission due to collisional heating of the
123

Flare Observations Page 25 of 59 2
coronal region. The altered electron beam reaches the chromosphere, causing thicktarget emission in the footpoints of the magnetic loop. Battaglia and Benz (2007) havetested the ITTT model in a series of flares using RHESSI data. The results indicatethat such a simple model cannot account for all of the observed relations betweenthe non-thermal spectra of coronal and footpoint sources. Including non-collisionalenergy loss of the electrons in the flare loop due to an electric field can solve most ofthe inconsistencies.
The simple ITTT model shows that the standard flare geometry is partially consistentwith current observations. The remaining inconsistencies concern the coronal source.Its non-thermal component was found less bright than the footpoints would predictaccording the ITTT model (Battaglia and Benz 2008). A possible remedy is a fillingfactor smaller than unity for the thermal source and acceleration in the gaps. Jianget al. (2006) argue that thermal conductivity in the coronal source is reduced by waveturbulence to interpret the soft X-ray emission. Turbulence could also scatter non-thermal particles or even accelerate them.
Coronal sources were intensively observed recently (review by Krucker et al.2008a), but it is proper to conclude that they are not understood.
3.4 Emissions from above the coronal X-ray source
The standard model (Fig. 13) predicts that magnetic reconnection takes place above theloop emitting thermal X-rays. Relatively little is known about that region apart fromthe previously mentioned rare above-the-loop-top emissions in hard X-rays. Soft X-rays were reported by Sui and Holman (2003), Sui et al. (2004), and Liu et al. (2008)to extend far beyond the coronal source. In a flare where the loop’s chromosphericfootpoints were occulted, thus reducing the dynamic range of the image, variouswavelengths show double sources. Nonthermal photons at higher energies were foundbetween the low-energy sources (Fig. 17). In an event observed also by the SUMERspectrometer on SOHO, Wang et al. (2007) reported material flowing away from thecoronal source.
Radio emission from the region above the loops may be more frequent, but lit-tle imaging information is available. Outward moving radio sources at meter wavesare often associated with CMEs (e.g., Pick et al. 2005). At decimeter waves station-ary bursts above the flaring region have been observed by Benz et al. (2002). Theircentroid positions outline cusp-like structures in decimetric spike events (Battagliaand Benz 2009) and radial structures in the case of pulsations (Benz et al. 2011).Figure 18 shows that the centroid positions of a decimetric pulsation follow aheight dependance typical for emission at the local plasma frequency, indicatingdeceasing density. Surprisingly, the suggested structure is strongly non-radial in thiscase.
Hard and soft X-rays and radio emissions above the flare loop suggest activity athigher altitude, such as an upward rising current sheet. They do not necessarily provethe standard model as at is not possible to estimate the energy released in these sources.It is clear, however, that the region above the flare loop sometimes takes part in theevent.
123

2 Page 26 of 59 Arnold O. Benz
Fig. 17 RHESSI observations of the flare SOL2002-04-30 with soft X-ray emissions that extend beyondthe loop top. The footpoints are occulted by the solar limb. In the lowest energy band (9–10 keV, red) twocontours are shown representing 17 and 80% of the maximum brightness. Image reproduced by permissionfrom Liu et al. (2008), copyright by AAS
Fig. 18 The flare SOL2006-12-05 occurred at the solar limb. The averaged centroid positions of radioemission observed by the Nançay Radioheliograph and indicated in MHz are shown on a GOES/SXIimage. The contours show RHESSI observations at 18–25 keV (red, coronal source, mostly thermal), and25–50 keV (blue, non-thermal, footpoint source). Image reproduced by permission from Benz et al. (2011),copyright by Springer
123

Flare Observations Page 27 of 59 2
3.5 Particle acceleration site
Observations of the region above the flare loop cannot locate compellingly the energyrelease and acceleration region. Accelerated particles precipitate from the accelerationsite or are temporarily trapped. On their way spiraling along the magnetic field, theyradiate various radio emissions at frequencies depending on the local plasma. As thecorona is transparent to radio emission above the plasma frequency, the acceleratedparticles may outline the geometry of the environment of acceleration and/or the actualsite of acceleration.
Gyrosynchrotron radiation is emitted incoherently by relativistic electrons over thewhole loop (review by Bastian et al. 1998, Fig. 19). The spectrum at high frequencies isclose to a power-law, shaped by the initial power-law energy distribution of acceleratedelectrons. The loop-top radio spectrum falls off far more steeply at high frequenciesthan does the footpoint spectrum. Thus the centimeter radio emission confirms thedifferences between loop-top and footpoints found in X-ray sources. In addition togyrosynchrotron emission, Wang et al. (1994) and Silva et al. (1996) report thermalloop-top radio emission at a temperature of about 30 MK, in rough agreement withthe hot thermal component of the coronal soft X-ray source. These imaging resultsconfirm previous interpretations of thermal flare radiation at centimeter wavelengths,known as “post-burst increase” and “gradual rise and fall” bursts with correlated softX-ray emission (Kundu 1965).
The most intense flare radio emission at meter and decimeter wavelengths originatesnot from single particles, but from waves in the plasma, i.e., from coherent radiationprocesses. Fast-drift radio bursts, or type III bursts, were among the first types ofmeter wave emissions discovered in the 1940s, and they represent the most frequentincidents of known particle acceleration by the Sun (more than 5000 in an activeyear). The drift of the radiation to lower frequencies with time was interpreted byWild (1950) as the signature of an electron beam propagating upward through thecorona at a speed of 0.2–0.6c. Later, occasional reverse-drift bursts were discovered(downward-directed beams). The number of electrons in type III driving beams issmall and difficult to observe in X-rays. A tentative detection was reported by Kruckeret al. (2008c). Summaries of earlier type III observations can be found in Krüger(1979), Suzuki and Dulk (1985), and Pick and van den Oord (1990).
Imaging observations have shown that the type III sources are often not single,but emerge simultaneously into different directions (Fig. 21). Paesold et al. (2001)found double type III sources to diverge from a common source of narrowband spikesaround 300 MHz. Figure 21 shows a three-dimensional reconstruction assuming anexponential (constant temperature) model for the density. The spikes observed tobe close to the point of divergence suggest the location of the acceleration at analtitude around 90,000 km. Krucker et al. (1995, 1997a) located spike sources atabout 5 × 10⁵ km altitude. Klein et al. (1997) found evidence for acceleration oftype III electron beams at the height of one solar radius.
Spikes at meter waves have been found to be associated in some cases with impulsiveelectron events in the interplanetary medium (Fig. 20; Benz et al. 2001). The low energycut-off of the interplanetary electron distribution defines an upper limit of the densityin the acceleration region (Lin et al. 1996). The derived electron density is of the order
123

2 Page 28 of 59 Arnold O. Benz
Fig. 19 Still from a movie: Thermal emission and a flare observed with the Nobeyama interferometer at17 GHz. The event has the classic signatures of an event associated with a coronal mass ejection: motion isseen first in the prominence material, then the flare goes off, leaving long-duration soft-X-ray emitting loopsaround for several hours. Note that the prominence material is at a temperature of less than 10,000 degreesK (shown at top), whereas the flare loops come from material at 10 MK: both cool and hot material show upat this radio frequency. The left panel shows total brightness, and the right panel shows circularly-polarizedradio emission. Polarization is only detected during the early phase of the flare, when very energetic non-thermal electrons fill up the loop and emit intense synchrotron radiation. Image courtesy of Stephen White
of 3 × 108 cm−3, consistent with the density in the source of metric spikes, assumingsecond harmonic plasma emission. The difference between acceleration height inhard X-rays, particle events and coherent radio waves suggests different accelerationprocesses.
3.6 Energetic ions
Gamma-ray lines between 0.8 and 20 MeV are emitted by atomic nuclei excited byimpinging ions. Not all flares have gamma-ray lines (Vilmer et al. 2011), yet thereis a good correlation between ions accelerated beyond 30 MeV and electrons havingenergy above 300 keV (Shih et al. 2009).
The neutron-capture line at 2.223 MeV (forming deuterium) is usually the strongestof the many lines (Fig. 22). Protons and other nuclei accelerated from about 10to �100 MeV per nucleon collide with the nuclei in the dense chromosphere andproduce neutrons. Neutrons thermalize and are captured by an ambient proton toform deuterium (Ramaty and Kozlovsky 1974; Hua and Lingenfelter 1987). Thusimages in the 2.223 MeV line indicate the site of high-energy ion precipitation.Comparison of imaged and spatially integrated fluences observed by the RHESSIsatellite show that in all cases most of the emission was confined to compact sourceswithin the active region (Hurford et al. 2006). In some events double footpoints
123

Flare Observations Page 29 of 59 2
time in UT08:24:30 08:24:40 08:24:50
freq
uenc
y in
MH
z
394
383
371
360
349
337
326
314
303
292
280
269
258
246
235
394
383
371
360
349
337
326
314
303
292
280
269
258
246
235
Fig. 20 Spectrogram of type III radio bursts (drifting structures in the upper right) and meter wave typeof narrowband spikes (center) that occurred on March 19, 1980
were observed. Thus the flare associated gamma-rays are produced by ions accel-erated in the flare process and not by a large-scale shock driven by a coronal massejection.
Surprisingly, RHESSI found that the footpoints of the 2.223 MeV line—indicating ion precipitation—and the footpoints of the non-thermal continuumemission—produced by precipitating electrons—do not always coincide (Fig. 23).The discrepancy demonstrates that protons and electrons are accelerated differ-ently, or originate, as proposed by Emslie et al. (2004), in large and small loops,respectively.
3.7 Thermal flare
Most of the flare energy is thermalized in the solar atmosphere, some of which is heatedto high temperatures. This part is visible in soft X-rays (Fig. 24) and centimeter-waveradiation. Flare loop cooling has been investigated by many authors. In the absence of
123

2 Page 30 of 59 Arnold O. Benz
Fig. 21 Reconstructed trajectories of two radio events involving type III bursts and spikes, both of the kindoften observed at meter wavelength. Upper right positions with error bars observed by the Nancay RadioHeliograph at three frequencies. The symbols represent the observed frequencies: cross sign for 327.0 MHz,open square for 236.6 MHz, and open triangle for 164.0 MHz. Bottom left Position of the radio emissionson the Sun. The small square indicates the size of the image presented in the upper right image. Upperleft projection of the sources on the meridian plane relative to Earth (as seen by an observer West of thesource). Lower right the radio sources projected on the equatorial plane, showing the view of an observerNorth of the Sun). In both graphs the trajectories have been 3-dimensionally spline interpolated to outlinethe trajectory. Image reproduced by permission from Paesold et al. (2001), copyright by ESO
further energy release the plasma cools by thermal conduction to the chromosphereand by radiating X-rays. Radiative cooling and conduction losses have been found tobalance approximately (e.g., Jiang et al. 2006). At high temperature and low density,conductive cooling dominates; radiative cooling is more efficient in the opposite case(Cargill et al. 1995). If conductive cooling leads to evaporation of chromosphericmaterial, the cooling time becomes longer as the energy remains in the loop. In the latephase, radiative cooling usually dominates, but considerable heat input is frequentlyobserved (e.g., Milligan et al. 2005). Note that thermal conduction implies a multi-thermal plasma, observational evidence of which has been presented by Aschwanden(2007).
123

Flare Observations Page 31 of 59 2
Fig. 22 RHESSI gamma-ray spectrum from 0.3 to 10 MeV integrated over the duration of the flareSOL2002-07-23. The lines show the different components of the model used to fit the spectrum. Imagereproduced by permission from Lin et al. (2003), copyright by AAS
Fig. 23 Location of the gamma-ray sources of the flare SOL2003-10-23 observed by the RHESSI satel-lite. The contours at 50, 70, and 90% of the peak value show in blue the deuterium recombinationline at 2.223 MeV and red the electron bremsstrahlung at 200–300 keV. The centroid positions of thebremsstrahlung emission at different times are indicated by plus signs. The FWHM angular resolution is35′′, given at bottom left. The RHESSI data are overlaid on the negative of a TRACE 195 Å image dominatedby the emission of Fexii. Image reproduced by permission from Hurford et al. (2006), copyright by AAS
123

2 Page 32 of 59 Arnold O. Benz
Fig. 24 Still from a movie:Hinode soft X-ray imagesobserved on April 30, 2007. Itshows an active region duringtwo hours. Some small flares ormicroflares occurred; the largestwas of class B2.6. Imagecourtesy of Antonia Savcheva
4 Energy budget
Magnetohydrodynamic models suggest that reconnection releases magnetic energyinto ohmic heating and fluid motion in the ratio 40:60 (textbook by Priest and Forbes2000, p. 133). Using 3-dimensional simulations Birn et al. (2009) specified thispartition in relation to the magnetic field strength. Ohmic heating is the result ofresistivity in a current loop. At the level of kinetic plasma theory, the resistivity maybe greatly enhanced by collisionless wave turbulence. Thus ohmic heating may amountto stochastically accelerating particles, possibly leading to a non-thermal energy dis-tribution. The motion of the reconnection jet may involve waves and shocks, both arealso capable of acceleration. Thus a flare releases energy initially into the forms ofnon-thermal particles, heat, waves, and motion. Non-local transport by the energet-ically dominant suprathermal particles changes the course of the processes and theenergy partition. The energy release may in reality be very different from the MHDprediction.
In the past, the reported partition of energy in flares into the various forms has oftenchanged with new instrumentation. The increase in total solar irradiance provides agood measure of the thermalized flare energy (Milligan et al. 2014). Woods et al. (2004)determined the total flare irradiance to exceed the soft X-ray emission (<27 nm) by afactor of 200 in two well observed, large flares. The total irradiance enhancement isdominated by white light and infra-red emission (77%). UV and soft X-ray emissions<200 nm amount to 23%.
The origin of white-light flare emission is not clear. It was found to correlate excel-lently in time with hard X-rays (Matthews et al. 2003; Metcalf et al. 2003; Hudsonet al. 2006) (Fig. 25). Recent imaging data indicate that white light and hard X-rays(40 keV) also coincide in space within less than an arcsecond (Krucker et al. 2011;Martínez Oliveros et al. 2012). According to these authors, the source region of the
123

Flare Observations Page 33 of 59 2
Fig. 25 Still from a movie: Awhite-light flare near the solarlimb. The RHESSI hard X-ray(30–50 keV, blue) contours areoverlaid on a white-lightdifference (background and red)image observed by HMI/SDO.Note spatial coincidence of hardX-ray and white-lightbrightenings. Image courtesy ofSäm Krucker, for details seeMartínez Oliveros et al. (2012)
white light is in the low chromosphere. Jess et al. (2008) point out that white lightflares are not different from others, and that possibly all flares may be observed inwhite light with sufficient sensitivity.
Not included in the total irradiance is the energy that leaves the corona in coronalmass ejections. Emslie et al. (2012) report on 38 large eruptive flares. The kineticenergy of the CME exceeds the non-thermal electrons’ energy of the associated flareby about an order of magnitude. However, taking into account the flare energy radiatedat wavelengths other than X-rays, in particular in white light, brings the flare energyup to nearly the CME energy within a factor of a few (Table 1).
4.1 Non-thermal electron energy
Particles accelerated to a non-themal energy distribution are a primary form of flareenergy. The energy, Ekin, of these electrons is
Ekin =∫ εmax
εmin
F(ε)ε dε, (3)
123

2 Page 34 of 59 Arnold O. Benz
Table 1 Energy budgets as reported by Saint-Hilaire and Benz (2005) for two M-class flares (a) and byEmslie et al. (2005) for two X-class flares (b)
Energy mode 2002/11/10 2002/08/22 2002/04/21 2002/07/23
M2.6 (a) [erg] M7.8 (a) [erg] X1.7 (b) [erg] X5.1 (b) [erg]
Non-thermal electrons 1.9 × 1030 6.5 × 1030 2.0 × 1031 3.2 × 1031
Non-thermal ions <4.0 × 1031 7.9 × 1031
Thermal hot plasma 1.4 × 1030 2.6 × 1030 1.2 × 1031 1.0 × 1031
Total radiated 1.6 × 1032 1.6 × 1032
Kinetic CME 2.0 × 1032 1.0 × 1032
Gravitational CME 5.0 × 1030 1.6 × 1031
Non-thermal CME 3.2 × 1031 <1030
The non-thermal electron energy strongly depends on the low-energy turn-over of the electron distribution,which may be masked by thermal radiation. Thus the non-thermal electron energy is a lower limit. The totalradiated energy includes the contributions of soft X-rays, UV, and optical emissions
where ε is the electron energy and F is the electron distribution per energy unit. Ifthe accelerated electrons have a power-law distribution with a spectral index of δ,the emitted bremsstrahlung by a thick target is also approximately a power-law inphoton energy with index γ = δ − 1. As δ > 2 in all observations, the integralin Eq. (3) depends strongly on the low-energy cut-off εmin. It is difficult to observeas the emission of the non-thermal electrons is usually outshone by the emission ofthe thermal plasma below about 10 keV. Only with the 1 keV spectral resolution ofRHESSI, it has become possible to reconstruct the electrons’ energy distribution at lowenergies (<20 keV). Structure in the reconstructed electron distribution was reportedby Kontar et al. (2002, 2005), indicating that spectral features may indeed be observed.It suggested that the inversion of photon spectra into electron energy distributions ispossible (Piana et al. 2003). However, several effects distort the photon spectrumaround 10 keV, in particular reflection of X-rays at the chromosphere, termed albedoeffect (Kontar et al. 2006; Kašparová et al. 2007), free-bound emission and pulsepile-up in the detectors. Thus the low-energy turn-overs of the electron distributionmeasured and reported to be at 20–40 keV or below by Saint-Hilaire and Benz (2005)and between 15–50 keV by Sui et al. (2007) may be upper limits, underestimating theenergy of accelerated electrons.
4.2 Thermal energy
Electron energy distributions can be inferred from X-ray spectra with high spectralresolution, e.g., Fig. 7. The quasi-thermal part, observed mostly in coronal sources,reaches temperatures of several ten MK. For simplicity, it is often modeled with asingle temperature, sometimes with an additional much hotter, but smaller secondcomponent. In reality, the distribution of the emission measure with temperature (called
123
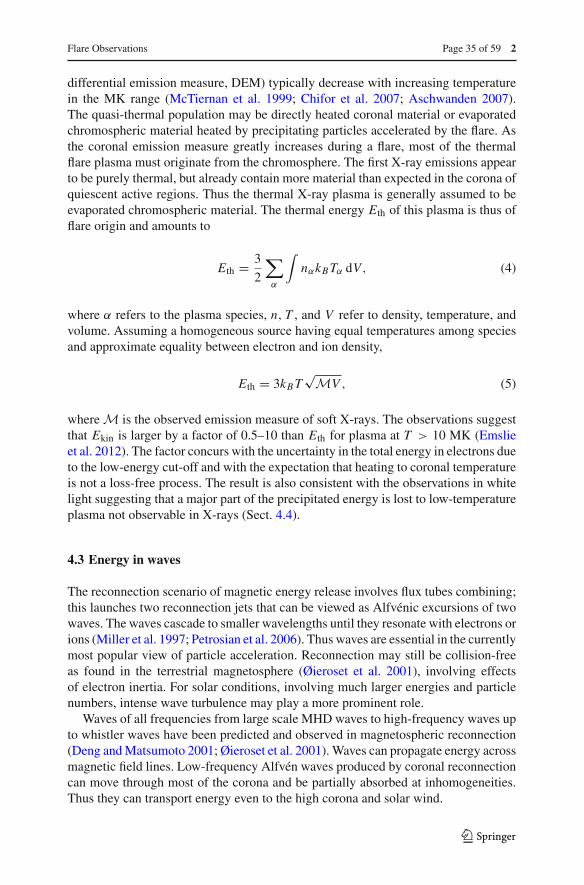
Flare Observations Page 35 of 59 2
differential emission measure, DEM) typically decrease with increasing temperaturein the MK range (McTiernan et al. 1999; Chifor et al. 2007; Aschwanden 2007).The quasi-thermal population may be directly heated coronal material or evaporatedchromospheric material heated by precipitating particles accelerated by the flare. Asthe coronal emission measure greatly increases during a flare, most of the thermalflare plasma must originate from the chromosphere. The first X-ray emissions appearto be purely thermal, but already contain more material than expected in the corona ofquiescent active regions. Thus the thermal X-ray plasma is generally assumed to beevaporated chromospheric material. The thermal energy Eth of this plasma is thus offlare origin and amounts to
Eth = 3
2
∑α
∫nαkBTα dV, (4)
where α refers to the plasma species, n, T , and V refer to density, temperature, andvolume. Assuming a homogeneous source having equal temperatures among speciesand approximate equality between electron and ion density,
Eth = 3kBT√MV , (5)
where M is the observed emission measure of soft X-rays. The observations suggestthat Ekin is larger by a factor of 0.5–10 than Eth for plasma at T > 10 MK (Emslieet al. 2012). The factor concurs with the uncertainty in the total energy in electrons dueto the low-energy cut-off and with the expectation that heating to coronal temperatureis not a loss-free process. The result is also consistent with the observations in whitelight suggesting that a major part of the precipitated energy is lost to low-temperatureplasma not observable in X-rays (Sect. 4.4).
4.3 Energy in waves
The reconnection scenario of magnetic energy release involves flux tubes combining;this launches two reconnection jets that can be viewed as Alfvénic excursions of twowaves. The waves cascade to smaller wavelengths until they resonate with electrons orions (Miller et al. 1997; Petrosian et al. 2006). Thus waves are essential in the currentlymost popular view of particle acceleration. Reconnection may still be collision-freeas found in the terrestrial magnetosphere (Øieroset et al. 2001), involving effectsof electron inertia. For solar conditions, involving much larger energies and particlenumbers, intense wave turbulence may play a more prominent role.
Waves of all frequencies from large scale MHD waves to high-frequency waves upto whistler waves have been predicted and observed in magnetospheric reconnection(Deng and Matsumoto 2001; Øieroset et al. 2001). Waves can propagate energy acrossmagnetic field lines. Low-frequency Alfvén waves produced by coronal reconnectioncan move through most of the corona and be partially absorbed at inhomogeneities.Thus they can transport energy even to the high corona and solar wind.
123

2 Page 36 of 59 Arnold O. Benz
MHD waves related to flares have been inferred from pulsating radio bursts(Roberts et al. 1983) and were more recently reported in high-temperature EUVemission (Aschwanden et al. 1999) and in X-rays (Foullon et al. 2005; Nakariakovet al. 2006). Schrijver et al. (2002) have shown that most larger flares (classes Mand X) trigger low-frequency loop oscillations. However, the energy deposited inthese oscillations is typically six orders of magnitude smaller compared to the flareenergy release (Terradas et al. 2007). Furthermore, the oscillations are observed todamp within a few oscillation periods. From the existing observations it is not clearhow far the energy of these oscillations propagates into the corona. Nevertheless, itis obvious that the observed oscillations do not significantly contribute to coronalheating.
Recent acceleration models are based on wave damping (Sect. 6). The relativelysmall energy in observed MHD waves originating from flares is in striking contrast toexpectation from the assumed role they are proposed to play in acceleration.
4.4 Other energies
The energy in the non-thermal ions is less known than for electrons. Ramaty et al.(1995) have argued that the fraction of the available flare energy that is containedin accelerated ions above 1 MeV is similar to that of electrons above 20 keV. Thisconclusion is supported by the observations that the derived non-thermal energy inprotons is occasionally comparable within an order of magnitude to the non-thermalenergy in electrons (e.g., Cliver et al. 1994; Miller et al. 1997). On the other hand,there are flares with no signature of accelerated ions within the observational limits.Unfortunately, the total energy content of accelerated ions is difficult to assess, sincethere are few diagnostics for ions below 1 MeV. The above observations, however,leave doubtful whether the energy in non-thermal electrons and ions add up to theenergy of flares observed in total irradiance (see Table 1).
The possibility remains that some energy propagates from the release site to thechromosphere by means of low energy (non-thermal) particles below the currentthreshold for X-ray detection or by heat conduction (i.e., thermal particles). Thisis supported by the observation that in a quarter of the events there is clear evidencefor the presence of an additional energy transport mechanism other than non-thermalelectron beams (Veronig et al. 2002, 2005). Furthermore, the relative contribution toenergy transport by non-thermal electrons is found to decrease with the flare impor-tance and in the late phase of flares.
Other forms of energy must also be considered. The reconnection process releasesbipolar outflows that may be observed as ejections. Magnetic field and plasma areexpelled from the X-point where oppositely directed field lines meet. Reconnectionjets may not propagate far and are distinct from CMEs. Saint-Hilaire and Benz (2002)observed a stopped ejection in a flare having an initial kinetic energy of motion ofsome 1029 erg, about the same as the thermal energy in the soft X-ray plasma, andinterpreted it as a reconnection jet (Fig. 26). The thermal energy that such ejectionscontain was found even an order of magnitude larger, but it was not possible to estimatewhat fraction of it originated in the flare.
123

Flare Observations Page 37 of 59 2
Fig. 26 Still from a movie: Anoverview in Fexii EUV emissionobserved by EIT/SOHO, laterzooming into the observationsby TRACE, both showingthermal coronal emission of aplasma at about 1.5 MK. The12–25 keV hard X-ray emissionobserved by RHESSI is shownin red and yellow colors. Imagecourtesy of Pascal Saint-Hilaire
The reconnection outflows also carry magnetic energy. The motion amounts to aPoynting flux that transports magnetic energy (Fletcher and Hudson 2008; Birn et al.2009). The mode is Alfvénic, thus the energy can be transported without loss and isreleased where the density or magnetic field are inhomogeneous, resulting in heatingand/or acceleration.
If the expansion of the heated flare plasma from chromospheric density to theobserved value of the thermal X-ray source were adiabatic, the temperature woulddrop by many orders of magnitude. This is not observed, the expansion appears tobe basically isothermal (McTiernan et al. 1993; Graham and Cauzzi 2015). Thus thethermal plasma of the coronal source contains also the work done by the expansion(enthalpy: Benz and Krucker 2002; Bradshaw and Cargill 2010; Cargill et al. 2012).This expansion in volume by a factor of 103 or more at constant temperature, con-sumes energy that is not accounted for in the thermal energy measurement of X-rays.The expansion energy is released when the material cools and rains back to the chro-mosphere. A fraction is finally radiated away at temperatures below coronal. Theuncertainties in these estimates make it difficult to assess the energy partition of flaresand their contribution to coronal heating.
4.5 Energy input into the corona
The predominant heating of the stationary corona is a long-standing debate and isnot the issue here. Occasional large flares occurring in active regions during solarmaximum are unlikely candidates because their energy is not sufficient for heatingand because of their intermittency (Hudson 1991). Hannah et al. (2011) arrived at thesame conclusion from the statistics of active region microflares observed by RHESSI.The existence of tiny flares in active region loops unobservable by current instruments
123

2 Page 38 of 59 Arnold O. Benz
Fig. 27 Time profile ofquiet-region microflare observedin Fexi/x, and Fexii lines at17.1 nm and 19.5 nm byEIT/SOHO. Top paneltemperature averaged over thearea of the event; second panelthe emission measure; thirdpanel radio flux observed by theVLA at 6 and 3.6 cm wavelengthat the location of the 6 cm peak;bottom panel same at thelocation of the 3.6 cm peak(after Krucker and Benz 2000)
(Parker 1988) is an unproven hypothesis, although the evidence is increasing (e.g.,Viall and Klimchuk 2015). We note that the theoretical concept of nanoflares is basedon the reconnection of twisted magnetic field lines in loops, thus appealing to a scenariodifferent from the standard flare cartoon.
In the quiet Sun the question of flare heating is different. It has come up by obser-vations of extremely small brightenings in low-energy soft X-rays in the quiet corona(Krucker et al. 1997b). Their energies are up to three orders of magnitude smaller thanthe smallest RHESSI flares in active regions. Some of the larger events have been foundto correlate with centimeter radio emission. Similar events have also been reported inhigh-temperature EUV lines (Benz and Krucker 1998; Berghmans et al. 1998; Krucker
123

Flare Observations Page 39 of 59 2
and Benz 1998). Figure 27 shows the time profiles of two radio sources at the oppo-site ends of a small Fexii loop. In one of them (third panel), the radio source has anegative slope (3.8 cm flux larger than 2 cm flux), indicating gyrosynchrotron emis-sion. The radio peaks occur before the temperature maximum and emission measurepeak of the thermal EUV emission, following the Neupert relation between thermaland non-thermal flare emissions. The other source (fourth panel) has an increasingspectrum, indicating optically thick thermal radio emission, coincident with the EUVemission. The events were soon realized to be at least similar to regular flares and thusalso termed “nanoflares”. The most relevant difference to regular flares is the orderof magnitude lower ratio of synchrotron emission to soft X-rays compared to regularflares (Krucker and Benz 2000). To avoid confusion with Parker’s theoretical conceptof nanoflares, we will use here the term “quiet-region microflares”.
The pertinent question is how much the observed flare-like events contribute to theheating of the corona. The largest quiet-region microflares reported contain energiesof a few 1026 erg (Krucker and Benz 1998). This number refers to the thermal energyin the soft X-ray plasma and is identical to the largest individual flare-like quiet-region events inferred from Fexi/x, and Fexii lines. Quiet-region microflares differfrom coronal bright points, locations in the quiet corona where continuous flaringduring many hours is observed. The smallest flares reported given by the TRACEinstrumental limit is a few 1023 erg (Parnell and Jupp 2000). The rate of events largerthan few 1024 erg and lasting about 15 min each, estimated over the whole Sun is300 per second (Krucker and Benz 1998). Benz and Krucker (2002) have estimatedthat the total energy measured in quiet-region microflares in the energy range from5 × 1024 erg to 5 × 1026 erg observable by EIT/SOHO amounts to about 12% of theenergy radiated by the corona in the area in which the quiet-region microflares wereobserved.
This review of flare observations emphasizes that the thermal energy measured atpeak soft X-ray or EUV emission is not equivalent to the total flare energy input intothe corona. Most of the thermal flare plasma is just the reaction of the chromosphere ona coronal phenomenon. We may thus end this short subchapter by the conclusion thatthe hypothesis of coronal heating by flares needs more accurate measurements. Flareheating cannot be quantitatively assessed from observations of one energy receivingchannel alone as long as the energy partition of regular flares into waves, direct heating,motion, and particle acceleration is unclear.
5 Signatures of energy release
As explained in Sect. 3, the location of energy release is not well known. Even lessunderstood is its process. Some observational evidence restricting the possible mech-anisms is presented in the following.
5.1 Coronal hard X-ray signatures
The coronal hard X-ray source is a thin or thick target for accelerated electrons, butnot necessarily identical to the acceleration region. The relation between coronal hard
123
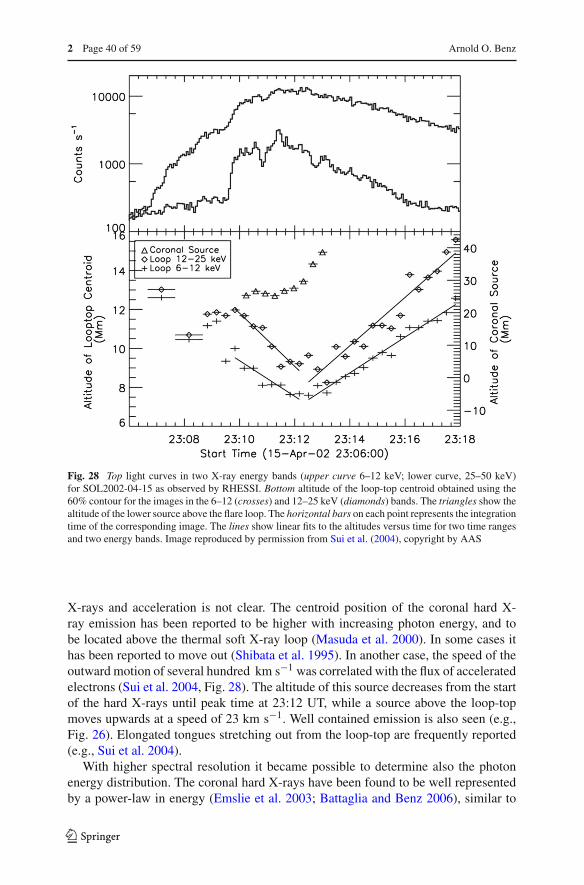
2 Page 40 of 59 Arnold O. Benz
Fig. 28 Top light curves in two X-ray energy bands (upper curve 6–12 keV; lower curve, 25–50 keV)for SOL2002-04-15 as observed by RHESSI. Bottom altitude of the loop-top centroid obtained using the60% contour for the images in the 6–12 (crosses) and 12–25 keV (diamonds) bands. The triangles show thealtitude of the lower source above the flare loop. The horizontal bars on each point represents the integrationtime of the corresponding image. The lines show linear fits to the altitudes versus time for two time rangesand two energy bands. Image reproduced by permission from Sui et al. (2004), copyright by AAS
X-rays and acceleration is not clear. The centroid position of the coronal hard X-ray emission has been reported to be higher with increasing photon energy, and tobe located above the thermal soft X-ray loop (Masuda et al. 2000). In some cases ithas been reported to move out (Shibata et al. 1995). In another case, the speed of theoutward motion of several hundred km s−1 was correlated with the flux of acceleratedelectrons (Sui et al. 2004, Fig. 28). The altitude of this source decreases from the startof the hard X-rays until peak time at 23:12 UT, while a source above the loop-topmoves upwards at a speed of 23 km s−1. Well contained emission is also seen (e.g.,Fig. 26). Elongated tongues stretching out from the loop-top are frequently reported(e.g., Sui et al. 2004).
With higher spectral resolution it became possible to determine also the photonenergy distribution. The coronal hard X-rays have been found to be well representedby a power-law in energy (Emslie et al. 2003; Battaglia and Benz 2006), similar to
123
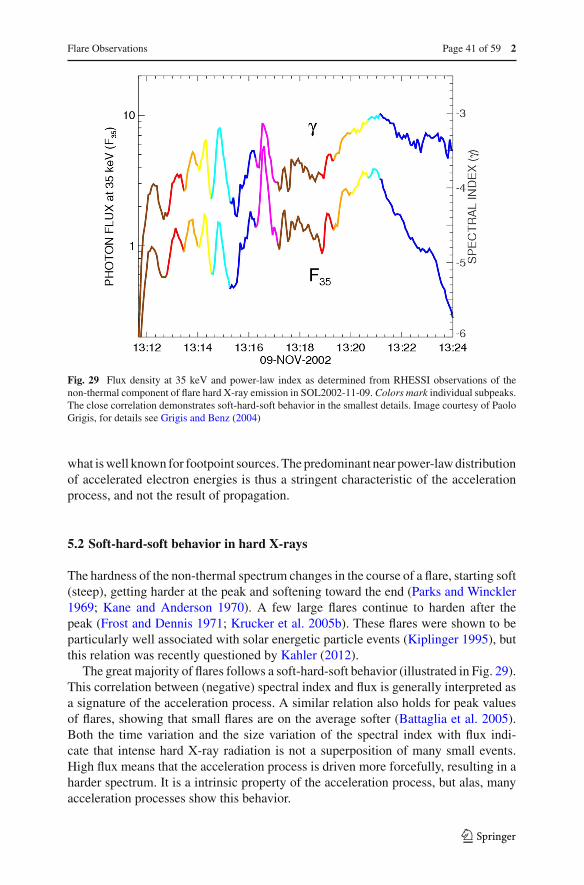
Flare Observations Page 41 of 59 2
Fig. 29 Flux density at 35 keV and power-law index as determined from RHESSI observations of thenon-thermal component of flare hard X-ray emission in SOL2002-11-09. Colors mark individual subpeaks.The close correlation demonstrates soft-hard-soft behavior in the smallest details. Image courtesy of PaoloGrigis, for details see Grigis and Benz (2004)
what is well known for footpoint sources. The predominant near power-law distributionof accelerated electron energies is thus a stringent characteristic of the accelerationprocess, and not the result of propagation.
5.2 Soft-hard-soft behavior in hard X-rays
The hardness of the non-thermal spectrum changes in the course of a flare, starting soft(steep), getting harder at the peak and softening toward the end (Parks and Winckler1969; Kane and Anderson 1970). A few large flares continue to harden after thepeak (Frost and Dennis 1971; Krucker et al. 2005b). These flares were shown to beparticularly well associated with solar energetic particle events (Kiplinger 1995), butthis relation was recently questioned by Kahler (2012).
The great majority of flares follows a soft-hard-soft behavior (illustrated in Fig. 29).This correlation between (negative) spectral index and flux is generally interpreted asa signature of the acceleration process. A similar relation also holds for peak valuesof flares, showing that small flares are on the average softer (Battaglia et al. 2005).Both the time variation and the size variation of the spectral index with flux indi-cate that intense hard X-ray radiation is not a superposition of many small events.High flux means that the acceleration process is driven more forcefully, resulting in aharder spectrum. It is a intrinsic property of the acceleration process, but alas, manyacceleration processes show this behavior.
123

2 Page 42 of 59 Arnold O. Benz
The soft-hard-soft property becomes relevant if it is possible to express the relationbetween flux and spectral index in a quantitative way that can be compared to models.Grigis and Benz (2004, 2005b) found a power-law relation between the photon spectralindex γ and the flux density F(E0) measured at a given energy E0 for SOL2002-11-09(Fig. 29),
γ = AF(E0)−α , (6)
where A is constant that varies from flare to flare, and α is 0.121 ± 0.009 in the flare risephase and 0.172±0.012 in the decay phase for E0 = 35 keV (Grigis and Benz 2004).In this quantitative form, the soft-hard-soft behavior becomes a stringent condition forelectron acceleration theories.
5.3 Radio emissions from the acceleration region
There are several flare-related processes that emit radio waves. The large variety ofradio emissions may be grasped from Fig. 30. Their emission processes must bedistinguished as they refer to widely different physical mechanisms. Only few of theradio emissions in Fig. 30, if any, come directly from the acceleration region. Mostflare radio emissions, except thermal radiations at millimeter and submillimeter waves(post-burst increases and gradual rise and fall), are interpreted to be caused by non-thermal electrons. Non-thermal emissions come in two kinds: incoherent and coherent.In incoherent emissions, such as the synchrotron process, non-thermal electrons radiateindividually. When a wave organizes electrons to emit in phase, the emission becomescoherent. On some cases, radio emission results from coupling two plasma waves(textbooks by Melrose 1980; Benz 2002). Coherent emissions are emitted at the localplasma frequency, upper hybrid frequency, electron gyrofrequency, or their harmonicsand carry information on the plasma parameters in the source. As the plasma frequencyexceeds the electron gyrofrequency by more than an order of magnitude in most ofthe corona, the plasma frequency is the lowest frequency observable from outside thesolar atmosphere. If the flare energy is released at electron densities between 108 and1011 cm−3, as generally believed, the corresponding emission is at short meter wavesand, predominantly, in the decimeter region.
The study of the spatial distribution of the synchrotron emission by mildly relativis-tic electrons (gyrosynchrotron) has a long history. Both loop-top sources and doublesources located close to the conjugate magnetic footpoints were reported (Marsh andHurford 1982; Kundu et al. 1982; Kawabata et al. 1983). The comparison with theoret-ical simulations of the gyrosynchrotron brightness distribution along model magneticloops (see Bastian et al. 1998, for a review) strongly suggests that the distribution ofmildly relativistic electrons along an extended flaring loop must be highly inhomoge-neous: accelerated electrons are concentrated in the upper part of the loop (Nindos et al.2000; Melnikov et al. 2002). Some of the centimeter loop-top emissions were observedin the late phase of flares (e.g., Karlický 2004). They are not related to the main energyrelease, but possibly to high-energy X-rays detected late in flares (Krucker, personalcommunication) and possibly the end stage of the spectral hardening observed innon-thermal X-rays (see Sect. 5.2). The investigation of the acceleration region using
123

Flare Observations Page 43 of 59 2
Fig. 30 Radio spectrogram observed by the Phoenix-2 spectro-polarimeter operated by ETH Zurich. Atlow frequencies (top of image), the radio emission is dominated by type III bursts and U bursts emittedby escaping electron beams and trapped electron beams. The brightest feature is a type V event, possiblycaused by electrons left behind by unstable beams. At high frequencies (bottom of image) the synchrotronemission of mildly relativistic electrons (gyrosynchrotron) dominates, correlating well with hard X-rays.In the middle of the frequency range at about 800–2000 MHz, narrowband spikes of the decimetric typecan be seen. Image adapted from Benz (2004)
gyrosynchrotron emission has greatly profited from combination with hard X-rays. Itmay result in the measurement of the magnetic field in loop-tops in future work.
Benz et al. (2007) found some coherent radio emission in all flares larger than C5class, except near the limb where absorption seems to play a role. While there is goodassociation between coherent radio emission and X-rays, correlation in details of thetime profile is less frequent. Thus coherent emissions cannot expected to be reliabletracers of the main flare energy release in general. Emissions at higher frequencies,such as decimetric narrowband spikes, pulsations, and stationary type IV events appearto be more directly related to the acceleration process. The association but loosecorrelation between HXR and coherent radio emission may be interpreted by multiplereconnection sites connected by common field lines, along which accelerated particlesmay propagate and serve as a trigger for distant accelerations. Thus coherent radioemissions may be interesting diagnostics in for large-scale flare dynamics.
Correlation of coherent radio emissions with hard X-rays (or gyrosynchrotron emis-sion) has been reported for spikes and pulsations (Slottje 1978; Benz and Kane 1986;Aschwanden et al. 1990; Kliem et al. 2000; Dabrowski and Benz 2009). If these coher-ent radiations are emitted at the second harmonic of the plasma frequency—the usualassumption—the density of the source region is in the range from 109 cm−3 to a fewtimes 1010 cm−3. This range is a possible indication for the density in the accelerationregion. Although initially interpreted as loss-cone emissions of trapped particles near
123

2 Page 44 of 59 Arnold O. Benz
footpoints, they have been found at high altitudes (Benz et al. 2002; Khan et al. 2002;Kundu et al. 2006). As the emission mechanism of spikes and pulsations is not wellunderstood, the origin of the radiating high-frequency waves is not known.
Best candidates for direct emission from an acceleration region are small clustersof narrowband spikes around 300 MHz, reported to correlate in detail with electronbeam emission (type III radio bursts). About 10% of all meter wave type III groups areaccompanied with spikes near but slightly above the start frequency (Benz et al. 1982).The spikes are concentrated in the spectrogram on the extrapolation of the type IIIbursts to higher frequency. More precisely, as suggested by Fig. 21, metric spikes arelocated on the extension of type III trajectories, supporting a model of energy releasein or close to the spike sources (Benz et al. 1996). If this is the case, radio observationscan approximately locate the acceleration region for the type III electrons and measurethe electron density of the acceleration region (Sect. 3).
Type IV emissions occur late relative to the hard X-ray peak and appear to beconnected to some late-phase acceleration (e.g., Švestka et al. 1982; Klein et al. 1983).They may be related to delayed electron releases of interplanetary electron events inthe corona (Klein et al. 2005).
Some radio emissions (like type III and V) are due to electrons escaping from theacceleration region. Hard X-ray flares are associated with meter-wave type III burstsin 33% of all cases, and in 4% of them type III bursts are the exclusive radio emission.Type III emission is caused by electron beams becoming unstable towards growingelectrostatic plasma waves at the local plasma frequency. These waves are convertedinto radio waves slightly above the plasma frequency ωp,
ωp =√
4πe2neme
, (7)
or its harmonic, where ne is the electron density, e the elementary charge, and me
the electron mass. Type III emission thus occurs at a frequency that varies with thelocal density. Observed at many different frequencies, it can be used to trace the pathof the electron beam in the corona. Different beams following different trajectoriesdiverging from the acceleration region have been used to locate the acceleration region(Fig. 21). The distance from this region to the start of type III emission depends on theenergy spectrum of accelerated electrons (Benz 2002, p. 32). Future interferometersobserving at many frequencies will refine this method.
A major constraint by radio emission on particle acceleration is the fact, that in 15%of larger flares (>C5.0 class) there is no coherent radiation except some electron beamemission at very high altitude (Benz et al. 2007). The flare capability to accelerate elec-trons without emitting coherent radio waves is, therefore, an observable criterion forthe validity of acceleration models. The frequent lack of direct radio emission fromthe acceleration region suggests that the acceleration is “gentle”, excluding signifi-cant deviations from a distribution monotonically decreasing with velocity, such as amonoenergetic beam, which would emit observable Type III emission. The deviationsonly build up after the non-thermal electrons have traveled some distance and thefaster particles have outpaced the slower particles, or after a loss-cone results from
123

Flare Observations Page 45 of 59 2
magnetic trapping. Gentle acceleration favors acceleration by diffusion in velocityspace as predicted by stochastic acceleration (Sect. 6).
Another constraint suggested by radio waves is the rarity of shock emission fromthe termination of the reconnection outflows. Termination shocks are expected fromthe standard scenario (Fig. 2). Observational indications were presented by Aurasset al. (2002) and Mann et al. (2006), but seem to be rare.
6 Acceleration processes
A remarkable fraction of the total flare energy released first appears as kinetic particleenergy in non-thermal electrons and sometimes ions (Sect. 5). White-light observa-tions (Sect. 4) suggest that substantial energy is transported to the chromosphere andphotosphere in addition to the particles that are observed in X-rays and gamma-rays(Lin and Hudson 1976). The acceleration process thus is a major issue in flare physicsand constitutes the core of the flare enigma. We will briefly review here the majoringredients of the current theories and then present the observational evidence.
The transfer of magnetic energy to kinetic particle energy has been observationallyseparated into two phases. In the impulsive flare phase, the concept is “bulk ener-gization”, involving an increase of the electron energy by more than two orders ofmagnitude starting from the coronal thermal energy (some 0.1 keV) within less than1 s as derived from hard X-ray observations (Kiplinger et al. 1984). The other class ofacceleration occurs in a secondary phase, possibly as a result of the first phase suchas shock wave initiated by a flare or an associated coronal mass ejection. The secondphase may be less efficient in particle acceleration, but is more important for solarenergetic particles in interplanetary space.
We will concentrate here on bulk energization, in which the whole particle popu-lation gains energy and remains close to a Maxwellian distribution and/or developsa non-thermal tail. The acceleration of a particle to an energy Ekin must occur fasterthan the collision time τcoll(Ekin) for energy loss. The energy loss time for an electronwith velocity v is
τcoll(Ekin) = 3.1 × 10⁻²⁰ v3
ne= 0.31
( v
1010 cm s−1
)3(
1011 cm−3
ne
)[s], (8)
where ne is the electron density. Equation (8) yields a collision time requiring accel-eration within less than 1 s. Note that densities up to some 1012 cm−3 are reportedfor coronal sources (Sect. 3.2). Equation (8) excludes efficient particle acceleration athigh densities if the process takes a finite time.
6.1 Electron acceleration theories
The free mobility of charged particles in dilute plasma and the difference in inertiabetween electrons and ions make it likely that electrons are accelerated in every majorimpulsive process in the corona. Releasable (free) magnetic energy requires the pres-ence of an electric current and an associated electric field before the flare-like process.
123

2 Page 46 of 59 Arnold O. Benz
Waves of various types from MHD to collisionless are expected to be excited by theflare and are also capable to accelerate particles in resonance. From a plasma-physicspoint of view, acceleration is not surprising; what is controversial is, however, whichprocess dominates.
The conversion of magnetic energy into accelerated particles can be accomplishedby several processes. It is likely that more than one occurs during a flare and itssecondary effects. The most widely discussed can be grouped into three types (e.g.,Melrose 1990; Benz 2002):
– stochastic acceleration (e.g., resonant acceleration by waves),– electric field parallel to the magnetic field,– perpendicular and parallel shocks (first and second order Fermi acceleration).
The preferred but not generally accepted acceleration model for solar flares isstochastic acceleration by the magnetic field component of low-frequency waves(Miller et al. 1997; Schlickeiser and Miller 1998; Petrosian et al. 2006). Particlesnear Cerenkov resonance (v ≈ ω/k‖) are mirrored by the waves. The process isknown as “transit-time damping” of waves. It acts as a diffusion process of the parti-cle distribution f (p) in momentum space, described by the Fokker–Planck equation
∂ f (p)
∂t=
⎛⎝1
2
∑i, j
∂
∂pi∂p jDi j −
∑i
∂
∂piFi
⎞⎠ f (p) . (9)
The diffusion coefficients Di j and Fi contain the physics: the action of acceleratingwaves and decelerating Coulomb collisions (Fig. 31).
6.2 Comparing theories with observations
Flare particle acceleration may occur in connection with magnetic reconnection inlow density plasma. The details are still obscure. Current flare observations contain awealth of information that limits the scenarios for particle acceleration. Concerningthe three types mentioned in the previous section, observations exclude more than theyconfirm. In particular:
– High-frequency waves near the plasma frequency (such as Langmuir waves) canbe excluded as drivers for stochastic acceleration. They would couple into radiodecimeter waves and be present in every flare. On the other hand, accelerationby transit-time damping is compatible with the frequent lack of radio emissionbecause the frequency of the postulated turbulence is far below the plasma fre-quency and does not cause radio emission.
– The number of electrons that can be accelerated in current sheets is limited by thetotal current, and observed large values are difficult to match with a classic currentsheet (Holman 1985; Litvinenko 1996).
– Large-scale, stationary electric fields would cause major distortions in velocityspace, susceptible to velocity-space instabilities and beam driven high-frequencywaves observable as radio waves. Such radio emission should correlate well withhard X-ray emission. Such a tight correlation is not seen in every flare.
123

Flare Observations Page 47 of 59 2
1 10 100Energy (keV)
100
102
104
106
108
1010
Ele
ctro
n di
strib
utio
n (c
m-3ke
V-1)
δ=2
δ=3.5
δ=5
δ=7
Fig. 31 Still from a movie: The particle distribution versus energy in time (blue in the movie) as describedby Eq. (9). A tail develops out of the thermal distribution (red). The solution becomes stationary after about1 s when acceleration balances particle escape out of the acceleration region. The spectral index resultingfrom fitting a power-law in the region limited by dashed red lines is also shown. Image courtesy of PaoloGrigis, for details see Grigis and Benz (2006)
– Shock acceleration plays an important role in interplanetary space, which is notthe issue here. More directly related to flares are shocks possibly produced bythe reconnection process. Radio signatures of such shocks have been reported byAurass et al. (2002); Mann et al. (2006), but are still disputed and, if confirmed,extremely rare. Nevertheless, slow shocks have been predicted at the interfacebetween inflow and outflow regions of reconnection, as well as fast shocks at thebow of the reconnection outflows. High energies could be readily be achieved(100 MeV ions in <1 s, Ellison and Ramaty 1985; Tsuneta and Naito 1998).
The transit-time damping scenario is consistent with present observations, althoughthere is no direct evidence for it. Thus it must be considered as an unproven hypothesis.In fact, there are other viable scenarios such as low-frequency fluctuating electric fieldsparallel to the magnetic field. Such fields may originate from low-frequency and high-amplitude turbulence, such as kinetic Alfvén waves. They accelerate and decelerateelectrons, leading to a net diffusion in energy space (Arzner and Vlahos 2004).
7 Conclusions
Flares may be considered to result from the loss of equilibrium in magnetic configura-tions. Although reconnection is a general phenomenon, it occurs in an impulsive wayonly in the corona, where collisions are rare and thus the plasma is highly conductive.
123

2 Page 48 of 59 Arnold O. Benz
Regular flares must be considered as extreme phenomena of the continuous dynamicsof the corona. Radio noise storms (type I bursts) and meter wave type III bursts hint atactivity in the high corona that is not yet accessible to other wavelengths and is proneto surprises.
Therefore, flares should not be considered exceptional catastrophes that occur rarelyand mostly during solar maximum. Flare-like brightenings, known as “quiet-regionmicroflares” or nanoflares, occur in the quiet corona at a rate of at least a few thousandper second. Is the corona heated by flares? Impulsive processes in the coronal plasmacan suddenly change the resistivity to an anomalous value that is orders of magnitudehigher than normal. They may thus release the energy stored in the magnetic field andbe the cause of the corona. We cannot answer this question yet as long as we do notunderstand how much energy flares deposit into the corona in the various possibleways and how this energy is distributed. Furthermore, the corona below 20,000 kmabove the photosphere, including the transition region, is not well explored in flareresearch. It is also the place where most of the coronal heating occurs. It may beadded here that the heating of the chromosphere is partly related to the corona and toreconnection, but is even more demanding.
Regular flares are not two of a kind, and each flare has individual features. For thisreason, it is not surprising that observations at various wavelengths do not correlate ina simple manner as predicted by a standard scenario. The fact, that every flare appearsto be different, must be taken as evidence that coronal dynamics has many degreesof freedom. Nevertheless, recent observations in X-rays and EUV allow identifyingthe magnetic topologies, confirming the general scenario of reconnection. They haveshown that various groups of flares exist and have greatly contributed to our evergrowing understanding of coronal phenomena.
Flares consist of a series of processes, starting with energy build-up in the corona andending by restructuring the magnetic configuration and releasing magnetic energy. Theprocesses include reconnection, instabilities, anomalous resistivity, efficient particleacceleration, particle propagation, coronal and chromospheric heating, evaporation,mass loss, high-frequency waves and MHD oscillations, as well as various emissionmechanisms. All these processes are important issues in astrophysics and worth study-ing for their own. They all have seen significant progress in the past decades and willbe addressed by the new observing facilities planned and in construction. The lowcorona will soon become accessible to white-light imaging and high-temperature lineobservations. Flare research will also profit from observations from close to the Sunand from imaging decimetric radio emissions. New instrumentation in imaging UVspectroscopy (IRIS) and submillimeter waves (ALMA) are expected to yield newinsights in the near future. A major impact can be expected from simultaneous imag-ing observations in practically all wavelengths. They will greatly contribute to thegrowing physical understanding of solar flares in the near future.
Acknowledgements I thank Paolo Grigis, Hugh Hudson, and two anonymous referees for critical andconstructive readings of the manuscript. The flare work at ETH Zurich was supported by the Swiss NationalScience Foundation (Grant Nr. 200020-113556). This review has made use of NASA’s Astrophysical DataSystem Bibliographic Services.
123
Flare Observations Page 49 of 59 2
Open Access This article is distributed under the terms of the Creative Commons Attribution 4.0 Interna-tional License (http://creativecommons.org/licenses/by/4.0/), which permits unrestricted use, distribution,and reproduction in any medium, provided you give appropriate credit to the original author(s) and thesource, provide a link to the Creative Commons license, and indicate if changes were made.
References
Acton LW, Feldman U, Bruner ME, Doschek GA, Hirayama T, Hudson HS, Lemen JR, Ogawara Y, StrongKT, Tsuneta S (1992) The morphology of 20 × 106 K plasma in large non-impulsive solar flares. PublAstron Soc Jpn 44:L71–L75
Antiochos SK (1998) The magnetic topology of solar eruptions. Astrophys J Lett 502:L181–L184. doi:10.1086/311507. arXiv:astro-ph/9806030
Antonucci E, Gabriel AH, Acton LW, Leibacher JW, Culhane JL, Rapley CG, Doyle JG, Machado ME,Orwig LE (1982) Impulsive phase of flares in soft X-ray emission. Solar Phys 78:107–123. doi:10.1007/BF00151147
Arzner K, Vlahos L (2004) Particle acceleration in multiple dissipation regions. Astrophys J Lett 605:L69–L72. doi:10.1086/392506. arXiv:astro-ph/0402605
Asai A, Nakajima H, Shimojo M, White SM, Hudson HS, Lin RP (2006) Preflare nonthermal emissionobserved in microwaves and hard X-rays. Publ Astron Soc Jpn 58:L1–L5. doi:10.1093/pasj/58.1.L1
Aschwanden MJ (2002) Particle acceleration and kinematics in solar flares: a synthesis of recent observationsand theoretical concepts (invited review). Space Sci Rev 101:1–227. doi:10.1023/A:1019712124366
Aschwanden MJ (2007) RHESSI timing studies: multithermal delays. Astrophys J 661:1242–1259. doi:10.1086/516814
Aschwanden MJ, Benz AO, Kane SR (1990) Correlation of solar radio pulsations with hard X-ray emission.Astron Astrophys 229:206–215
Aschwanden MJ, Schwartz RA, Alt DM (1995) Electron time-of-flight differences in solar flares. AstrophysJ 447:923. doi:10.1086/175930
Aschwanden MJ, Kosugi T, Hudson HS, Wills MJ, Schwartz RA (1996) The scaling law between electrontime-of-flight distances and loop lengths in solar flares. Astrophys J 470:1198. doi:10.1086/177943
Aschwanden MJ, Fletcher L, Schrijver CJ, Alexander D (1999) Coronal loop oscillations observed with thetransition region and coronal explorer. Astrophys J 520:880–894. doi:10.1086/307502
Aurass H, Vršnak B, Mann G (2002) Shock-excited radio burst from reconnection outflow jet? AstronAstrophys 384:273–281. doi:10.1051/0004-6361:20011735
Bastian TS, Benz AO, Gary DE (1998) Radio emission from solar flares. Annu Rev Astron Astrophys36:131–188. doi:10.1146/annurev.astro.36.1.131
Battaglia M, Benz AO (2006) Relations between concurrent hard X-ray sources in solar flares. AstronAstrophys 456:751–760. doi:10.1051/0004-6361:20065233. arXiv:astro-ph/0606353
Battaglia M, Benz AO (2007) Exploring the connection between coronal and footpoint sources in a thin–thick target solar flare model. Astron Astrophys 466:713–716. doi:10.1051/0004-6361:20077144.arXiv:astro-ph/0702309
Battaglia M, Benz AO (2008) Observational evidence for return currents in solar flare loops. Astron Astro-phys 487:337–344. doi:10.1051/0004-6361:200809418. arXiv:0806.1701
Battaglia M, Benz AO (2009) Do solar decimetric spikes originate in coronal X-ray sources? Astron Astro-phys 499:L33–L36. doi:10.1051/0004-6361/200912143. arXiv:0904.4146
Battaglia M, Grigis PC, Benz AO (2005) Size dependence of solar X-ray flare properties. Astron Astrophys439:737–747. doi:10.1051/0004-6361:20053027. arXiv:astro-ph/0505154
Benz AO (2002) Plasma astrophysics: kinetic processes in solar and stellar coronae, astrophysics and spacescience library, vol 279, 2nd edn. Kluwer, Dordrecht. doi:10.1007/0-306-47719-X
Benz AO (2004) Decimeter burst emission and particle acceleration. In: Gary DE, Keller CU (eds) Solar andspace weather radiophysics: current status and future developments, astrophysics and space sciencelibrary, vol 314. Kluwer Academic Publishers, Dordrecht, pp 203–222. doi:10.1007/1-4020-2814-8_10
Benz AO, Güdel M (2010) Physical processes in magnetically driven flares on the sun, stars, and youngstellar objects. Annu Rev Astron Astrophys 48:241–287. doi:10.1146/annurev-astro-082708-101757
Benz AO, Kane SR (1986) Electron acceleration in flares inferred from radio and hard X-ray emissions.Solar Phys 104:179–185. doi:10.1007/BF00159960
123

2 Page 50 of 59 Arnold O. Benz
Benz AO, Krucker S (1998) Heating events in the quiet solar corona. Solar Phys 182:349–363. doi:10.1023/A:1005046620684
Benz AO, Krucker S (2002) Energy distribution of microevents in the quiet solar corona. Astrophys J568:413–421. doi:10.1086/338807. arXiv:astro-ph/0109027
Benz AO, Zlobec P, Jaeggi M (1982) Fine structure near the starting frequency of solar type III radio bursts.Astron Astrophys 109:305–313
Benz AO, Barrow CH, Dennis BR, Pick M, Raoult A, Simnett G (1983) X-ray and radio emissions in theearly stages of solar flares. Solar Phys 83:267–283. doi:10.1007/BF00148280
Benz AO, Csillaghy A, Aschwanden MJ (1996) Metric spikes and electron acceleration in the solar corona.Astron Astrophys 309:291–300
Benz AO, Lin RP, Sheiner OA, Krucker S, Fainberg J (2001) The source regions of impulsive solar electronevents. Solar Phys 203:131–144. doi:10.1023/A:1012725610185
Benz AO, Saint-Hilaire P, Vilmer N (2002) Location of narrowband spikes in solar flares. Astron Astrophys383:678–684. doi:10.1051/0004-6361:20011774. arXiv:astro-ph/0112442
Benz AO, Grigis PC, Csillaghy A, Saint-Hilaire P (2005) Survey on solar X-ray flares and associatedcoherent radio emissions. Solar Phys 226:121–142. doi:10.1007/s11207-005-5254-5
Benz AO, Brajša R, Magdalenic J (2007) Are there radio-quiet solar flares? Solar Phys 240:263–270. doi:10.1007/s11207-007-0365-9. arXiv:astro-ph/0701570
Benz AO, Battaglia M, Vilmer N (2011) Location of decimetric pulsations in solar flares. Solar Phys273:363–375. doi:10.1007/s11207-011-9760-3. arXiv:1103.5353
Berghmans D, Clette F, Moses D (1998) Quiet sun EUV transient brightenings and turbulence. A panoramicview by EIT on board SOHO. Astron Astrophys 336:1039–1055
Birn J, Fletcher L, Hesse M, Neukirch T (2009) Energy release and transfer in solar flares: simulations ofthree-dimensional reconnection. Astrophys J 695:1151–1162. doi:10.1088/0004-637X/695/2/1151
Bogachev SA, Somov BV, Kosugi T, Sakao T (2005) The motions of the hard X-ray sources in solar flares:images and statistics. Astrophys J 630:561–572. doi:10.1086/431918
Bone L, Brown JC, Fletcher L, Veronig A, White S (2007) Birth and evolution of a dense coronal loop in acomplex flare region. Astron Astrophys 466:339–346. doi:10.1051/0004-6361:20065129
Bradshaw SJ, Cargill PJ (2010) A new enthalpy-based approach to the transition region in an impulsivelyheated corona. Astrophys J Lett 710:L39–L43. doi:10.1088/2041-8205/710/1/L39
Brosius JW, Phillips KJH (2004) Extreme-ultraviolet and X-ray spectroscopy of a solar flare loop observedat high time resolution: a case study in chromospheric evaporation. Astrophys J 613:580–591. doi:10.1086/422873
Brown JC (1971) The deduction of energy spectra of non-thermal electrons in flares from the observeddynamic spectra of hard X-ray bursts. Solar Phys 18:489. doi:10.1007/BF00149070
Brown JC, Carlaw VA, Cromwell D, Kane SR (1983) A comparison of the thick-target model with stereo dataon the height structure of solar hard X-ray bursts. Solar Phys 88:281–295. doi:10.1007/BF00196193
Brown JC, Conway AJ, Aschwanden MJ (1998) The electron injection function and energy-dependentdelays in thick-target hard X-rays. Astrophys J 509:911–917. doi:10.1086/306522
Cargill PJ, Mariska JT, Antiochos SK (1995) Cooling of solar flares plasmas. 1: theoretical considerations.Astrophys J 439:1034–1043. doi:10.1086/175240
Cargill PJ, Bradshaw SJ, Klimchuk JA (2012) Enthalpy-based thermal evolution of loops. II. Improvementsto the model. Astrophys J 752:161. doi:10.1088/0004-637X/752/2/161. arXiv:1204.5960
Carmichael H (1964) A process for flares. In: Hess WN (ed) The physics of solar flares, NASA scientificand technical information division, vol SP-50. NASA special publications, Washington, pp 451–456
Chen PF, Shibata K, Brooks DH, Isobe H (2004) A reexamination of the evidence for reconnection inflow.Astrophys J Lett 602:L61–L64. doi:10.1086/382479
Chifor C, Del Zanna G, Mason HE, Sylwester J, Sylwester B, Phillips KJH (2007) A benchmark study forCHIANTI based on RESIK solar flare spectra. Astron Astrophys 462:323–330. doi:10.1051/0004-6361:20066261
Choudhary DP, Ambastha A, Ai G (1998) Emerging Flux and X-class flares in NOAA 6555. Solar Phys179:133–140. doi:10.1023/A:1005063609450
Chupp EL, Forrest DJ, Higbie PR, Suri AN, Tsai C, Dunphy PP (1973) Solar gamma ray lines observedduring the solar activity of August 2 to August 11, 1972. Nature 241:333. doi:10.1038/241333a0
Cliver EW, Crosby NB, Dennis BR (1994) Are solar gamma-ray-line flares different from other large flares?Astrophys J 426:767–773. doi:10.1086/174113
123

Flare Observations Page 51 of 59 2
Crooker NU, Webb DF (2006) Remote sensing of the solar site of interchange reconnection associated withthe May 1997 magnetic cloud. J Geophys Res 111:A08108. doi:10.1029/2006JA011649
Crooker NU, Forsyth R, Rees A, Gosling JT, Kahler SW (2004) Counterstreaming electrons in magneticclouds near 5 AU. J Geophys Res 109:A06110. doi:10.1029/2004JA010426
Dabrowski BP, Benz AO (2009) Correlation between decimetric radio emission and hard X-rays in solarflares. Astron Astrophys 504:565–573. doi:10.1051/0004-6361/200811108
Datlowe DW, Lin RP (1973) Evidence for thin-target X-ray emission in a small solar flare on 26 February1972. Solar Phys 32:459. doi:10.1007/BF00154958
Démoulin P, Bagalá LG, Mandrini CH, Hénoux JC, Rovira MG (1997) Quasi-separatrix layers in solarflares. II. Observed magnetic configurations. Astron Astrophys 325:305–317
Deng XH, Matsumoto H (2001) Rapid magnetic reconnection in the Earth’s magnetosphere mediated bywhistler waves. Nature 410:557–560
Dennis BR, Zarro DM (1993) The Neupert effect: What can it tell us about the impulsive and gradual phasesof solar flares? Solar Phys 146:177–190. doi:10.1007/BF00662178
Dickson ECM, Kontar EP (2013) Measurements of electron anisotropy in solar flares using albedo withRHESSI X-ray data. Solar Phys 284:405–425. doi:10.1007/s11207-012-0178-3. arXiv:1210.4757
Doschek GA, Feldman U, Kreplin RW, Cohen L (1980) High-resolution X-ray spectra of solar flares. III.General spectral properties of X1–X5 type flares. Astrophys J 239:725–737. doi:10.1086/158158
Ellison DC, Ramaty R (1985) Shock acceleration of electrons and ions in solar flares. Astrophys J 298:400–408. doi:10.1086/163623
Emslie AG, Kontar EP, Krucker S, Lin RP (2003) RHESSI hard X-ray imaging spectroscopy of the largegamma-ray flare of 2002 July 23. Astrophys J Lett 595:L107–L110. doi:10.1086/378931
Emslie AG, Kucharek H, Dennis BR, Gopalswamy N, Holman GD, Share GH, Vourlidas A, Forbes TG,Gallagher PT, Mason GM, Metcalf TR, Mewaldt RA, Murphy RJ, Schwartz RA, Zurbuchen TH(2004) Energy partition in two solar flare/CME events. J Geophys Res 109:A10104. doi:10.1029/2004JA010571
Emslie AG, Dennis BR, Holman GD, Hudson HS (2005) Refinements to flare energy estimates: a followupto ‘Energy partition in two solar flare/CME events’ by A.G. Emslie et al. J Geophys Res 110:A11103.doi:10.1029/2005JA011305
Emslie AG, Dennis BR, Hudson H, Lin RP (eds) (2011) High-energy aspects of solar flares: a RHESSI-inspired monograph. Space Science Reviews, vol 159. Springer, Berlin. doi:10.1007/s11214-011-9815-7
Emslie AG, Dennis BR, Shih AY, Chamberlin PC, Mewaldt RA, Moore CS, Share GH, Vourlidas A, WelschBT (2012) Global energetics of thirty-eight large solar eruptive events. Astrophys J 759:71. doi:10.1088/0004-637X/759/1/71. arXiv:1209.2654
Feldman U, Doschek GA, Kreplin RW, Mariska JT (1980) High-resolution X-ray spectra of solar flares.IV. General spectral properties of M type flares. Astrophys J 241:1175–1185. doi:10.1086/158434
Feldman U, Hiei E, Phillips KJH, Brown CM, Lang J (1994) Very impulsive solar flares observed with theYOHKOH spacecraft. Astrophys J 421:843–850. doi:10.1086/173696
Fisher GH, Hawley SL (1990) An equation for the evolution of solar and stellar flare loops. Astrophys J357:243–258. doi:10.1086/168911
Fisk LA, Schwadron NA, Zurbuchen TH (1999) Acceleration of the fast solar wind by the emergence ofnew magnetic flux. J Geophys Res 104(A9):19765–19772. doi:10.1029/1999JA900256
Fletcher L, Hudson HS (2008) Impulsive phase flare energy transport by large-scale Alfvén waves and theelectron acceleration problem. Astrophys J 675:1645–1655. doi:10.1086/527044. arXiv:0712.3452
Fletcher L, Martens PCH (1998) A model for hard X-ray emission from the top of flaring loops. AstrophysJ 505:418–431. doi:10.1086/306137
Fletcher L, Warren HP (2003) The energy release process in solar flares; constraints from TRACE obser-vations. In: Klein KL (ed) Energy conversion and particle acceleration in the solar corona. Lecturenotes in physics, vol 612. Springer, Berlin, pp 58–79
Fletcher L, Pollock JA, Potts HE (2004) Tracking of TRACE ultraviolet flare footpoints. Solar Phys 222:279–298. doi:10.1023/B:SOLA.0000043580.89730.4d
Foullon C, Verwichte E, Nakariakov VM, Fletcher L (2005) X-ray quasi-periodic pulsations in solarflares as magnetohydrodynamic oscillations. Astron Astrophys 440:L59–L62. doi:10.1051/0004-6361:200500169
Frost KJ, Dennis BR (1971) Evidence from hard X-rays for two-stage particle acceleration in a solar flare.Astrophys J 165:655. doi:10.1086/150932
123
2 Page 52 of 59 Arnold O. Benz
Fuentes-Fernández J, Parnell CE, Priest ER (2012) The onset of impulsive bursty reconnection at a two-dimensional current layer. Phys Plasmas 19(7):072901. doi:10.1063/1.4729334. arXiv:1205.2120
Georgoulis MK, LaBonte BJ (2006) Reconstruction of an inductive velocity field vector from Dopplermotions and a pair of solar vector magnetograms. Astrophys J 636:475–495. doi:10.1086/497978.arXiv:astro-ph/0511447
Gosling JT, Birn J, Hesse M (1995) Three-dimensional magnetic reconnection and the magnetic topologyof coronal mass ejection events. Geophys Res Lett 22:869–872. doi:10.1029/95GL00270
Graham DR, Cauzzi G (2015) Temporal evolution of multiple evaporating ribbon sources in a solar flare.Astrophys J Lett 807:L22. doi:10.1088/2041-8205/807/2/L22. arxiv:1506.03465
Grigis PC, Benz AO (2004) The spectral evolution of impulsive solar X-ray flares. Astron Astrophys426:1093–1101. doi:10.1051/0004-6361:20041367. arXiv:astro-ph/0407431
Grigis PC, Benz AO (2005a) The evolution of reconnection along an arcade of magnetic loops. AstrophysJ Lett 625:L143–L146. doi:10.1086/431147. arXiv:astro-ph/0504436
Grigis PC, Benz AO (2005b) The spectral evolution of impulsive solar X-ray flares. II. Comparisonof observations with models. Astron Astrophys 434:1173–1181. doi:10.1051/0004-6361:20042265.arXiv:astro-ph/0501431
Grigis PC, Benz AO (2006) Electron acceleration in solar flares: theory of spectral evolution. AstronAstrophys 458:641–651. doi:10.1051/0004-6361:20065809. arXiv:astro-ph/0606339
Hagyard MJ, Venkatakrishnan P, Smith JB Jr (1990) Nonpotential magnetic fields at sites of gamma-rayflares. Astrophys J Suppl Ser 73:159–163. doi:10.1086/191447
Hanaoka Y (1996) Flares and plasma flow caused by interacting coronal loops. Solar Phys 165:275–301.doi:10.1007/BF00149715
Hanaoka Y (1997) Double-loop configuration of solar flares. Solar Phys 173:319–346. doi:10.1023/A:1004953003558
Hannah IG, Hudson HS, Battaglia M, Christe S, Kašparová J, Krucker S, Kundu MR, Veronig A (2011)Microflares and the statistics of X-ray flares. Space Sci Rev 159:263–300. doi:10.1007/s11214-010-9705-4. arXiv:1108.6203
Hey JS (1983) The radio universe, 3rd edn. Pergamon Press, OxfordHeyvaerts J, Priest ER, Rust DM (1977) An emerging flux model for the solar flare phenomenon. Astrophys
J 216:123–137. doi:10.1086/155453Hirayama T (1974) Theoretical model of flares and prominences. I: evaporating flare model. Solar Phys
34:323–338. doi:10.1007/BF00153671Holman GD (1985) Acceleration of runaway electrons and Joule heating in solar flares. Astrophys J 293:584–
594. doi:10.1086/163263Hori K, Yokoyama T, Kosugi T, Shibata K (1997) Pseudo-two-dimensional hydrodynamic modeling of
solar flare loops. Astrophys J 489:426–441. doi:10.1086/304754Hori K, Yokoyama T, Kosugi T, Shibata K (1998) Single and multiple solar flare loops: hydrodynamics and
Ca XIX resonance line emission. Astrophys J 500:492–510. doi:10.1086/305725Hoyng P, Duijveman A, Machado ME, Rust DM, Švestka Z, Boelee A, de Jager C, Frost KT, Lafleur H,
Simnett GM, van Beek HF, Woodgate BE (1981) Origin and location of the hard X-ray emission in atwo-ribbon flare. Astrophys J Lett 246:L155. doi:10.1086/183574
Hua XM, Lingenfelter RE (1987) Solar flare neutron and accelerated ion angular distributions. AstrophysJ 323:779–794. doi:10.1086/165871
Hudson HS (1972) Thick-target processes and white-light flares. Solar Phys 24:414. doi:10.1007/BF00153384
Hudson HS (1978) A purely coronal hard X-ray event. Astrophys J 224:235–240. doi:10.1086/156370Hudson HS (1991) Solar flares, microflares, nanoflares, and coronal heating. Solar Phys 133:357–369.
doi:10.1007/BF00149894Hudson HS (2011) Global properties of solar flares. Space Sci Rev 158:5–41. doi:10.1007/s11214-010-
9721-4. arXiv:1108.3490Hudson HS, Strong KT, Dennis BR, Zarro D, Inda M, Kosugi T, Sakao T (1994) Impulsive behavior in
solar soft X-radiation. Astrophys J Lett 422:L25–L27. doi:10.1086/187203Hudson HS, Kosugi T, Nitta NV, Shimojo M (2001) Hard X-radiation from a fast coronal ejection. Astrophys
J Lett 561:L211–L214. doi:10.1086/324760Hudson HS, Wolfson CJ, Metcalf TR (2006) White-light flares: a TRACE/RHESSI overview. Solar Phys
234:79–93. doi:10.1007/s11207-006-0056-y
123

Flare Observations Page 53 of 59 2
Hurford GJ, Krucker S, Lin RP, Schwartz RA, Share GH, Smith DM (2006) Gamma-ray imaging of the2003 October/November solar flares. Astrophys J Lett 644:L93–L96. doi:10.1086/505329
Jess DB, Mathioudakis M, Crockett PJ, Keenan FP (2008) Do all flares have white-light emission? AstrophysJ Lett 688:L119. doi:10.1086/595588. arXiv:0810.1443
Jiang YW, Liu S, Liu W, Petrosian V (2006) Evolution of the loop-top source of solar flares: heating andcooling processes. Astrophys J 638:1140–1153. doi:10.1086/498863. arxiv:astro-ph/0508532
Kahler SW (2012) Solar energetic particle events and the Kiplinger effect. Astrophys J 747:66. doi:10.1088/0004-637X/747/1/66
Kane SR (1983) Spatial structure of high energy photon sources in solar flares. Solar Phys 86:355–365.doi:10.1007/BF00157209
Kane SR, Anderson KA (1970) Spectral characteristics of impulsive solar-flare X-rays > 10 KeV. AstrophysJ 162:1003. doi:10.1086/150732
Kane SR, Kreplin RW, Martres MJ, Pick M, Soru-Escaut I (1974) Acceleration of electrons in absence ofdetectable optical flares deduced from type III radio bursts, Hα activity and soft X-ray emission. SolarPhys 38:483–497. doi:10.1007/BF00155083
Karlický M (2004) Loop-top gyro-synchrotron source in post-maximum phase of the August 24, 2002 flare.New Astron 9:383–389. doi:10.1016/j.newast.2004.01.002
Kašparová J, Kontar EP, Brown JC (2007) Hard X-ray spectra and positions of solar flares observed byRHESSI: photospheric albedo, directivity and electron spectra. Astron Astrophys 466:705–712. doi:10.1051/0004-6361:20066689. arXiv:astro-ph/0701871
Kawabata KA, Ogawa H, Suzuki I (1983) A flare model deduced from HINOTORI and millimeter waveinterferometer observations. Solar Phys 86:247–251. doi:10.1007/BF00157197
Khan JI, Vilmer N, Saint-Hilaire P, Benz AO (2002) The solar coronal origin of a slowly drifting decimetric-metric pulsation structure. Astron Astrophys 388:363–372. doi:10.1051/0004-6361:20020385
Kiplinger AL (1995) Comparative studies of hard X-ray spectral evolution in solar flares with high-energyproton events observed at earth. Astrophys J 453:973. doi:10.1086/176457
Kiplinger AL, Dennis BR, Frost KJ, Orwig LE (1984) Fast variations in high-energy X-rays from solarflares and their constraints on nonthermal models. Astrophys J Lett 287:L105–L108. doi:10.1086/184408
Klein KL, Aurass H, Soru-Escaut I, Kalman B (1997) Electron acceleration sites in a large-scale coronalstructure. Astron Astrophys 320:612–619
Klein KL, Krucker S, Trottet G, Hoang S (2005) Coronal phenomena at the release of solar energeticelectron events. Astron Astrophys 431:1047–1060. doi:10.1051/0004-6361:20041258
Klein L, Pick M, Trottet G, Vilmer N, Anderson K, Kane S (1983) Association between gradual hard X-rayemission and metric continua during large flares. Solar Phys 84:295–310. doi:10.1007/BF00157463
Kliem B, Karlický M, Benz AO (2000) Solar flare radio pulsations as a signature of dynamic magneticreconnection. Astron Astrophys 360:715–728 arXiv:astro-ph/0006324
Kontar EP, Brown JC, McArthur GK (2002) Nonuniform target ionization and fitting thick target electroninjection spectra to RHESSI data. Solar Phys 210:419–429. doi:10.1023/A:1022494318540
Kontar EP, Emslie AG, Piana M, Massone AM, Brown JC (2005) Determination of electron flux spectrain a solar flare with an augmented regularization method: application to RHESSI data. Solar Phys226:317–325. doi:10.1007/s11207-005-7150-4. arXiv:astro-ph/0409691
Kontar EP, MacKinnon AL, Schwartz RA, Brown JC (2006) Compton backscattered and primary X-raysfrom solar flares: angle dependent Green’s function correction for photospheric albedo. Astron Astro-phys 446:1157–1163. doi:10.1051/0004-6361:20053672. arXiv:astro-ph/0510167
Kopp RA, Pneuman GW (1976) Magnetic reconnection in the corona and the loop prominence phenomenon.Solar Phys 50:85–98. doi:10.1007/BF00206193
Krucker S, Benz AO (1998) Energy distribution of heating processes in the quiet solar corona. AstrophysJ Lett 501:L213–L216. doi:10.1086/311474
Krucker S, Benz AO (2000) Are heating events in the quiet solar corona small flares? Multiwave-length observations of individual events. Solar Phys 191:341–358. doi:10.1023/A:1005255608792.arXiv:astro-ph/9912501
Krucker S, Aschwanden MJ, Bastian TS, Benz AO (1995) First VLA observation of a solar narrowband,millisecond spike event. Astron Astrophys 302:551
Krucker S, Benz AO, Aschwanden MJ (1997a) YOHKOH observation of the source regions of solar nar-rowband, millisecond spike events. Astron Astrophys 317:569–579
123

2 Page 54 of 59 Arnold O. Benz
Krucker S, Benz AO, Bastian TS, Acton LW (1997b) X-ray network flares of the quiet sun. Astrophys J488:499. doi:10.1086/304686
Krucker S, Hurford GJ, Lin RP (2003) Hard X-ray source motions in the 2002 July 23 gamma-ray flare.Astrophys J Lett 595:L103–L106. doi:10.1086/378840
Krucker S, Fivian MD, Lin RP (2005) Hard X-ray footpoint motions in solar flares: comparing magneticreconnection models with observations. Adv Space Res 35:1707–1711. doi:10.1016/j.asr.2005.05.054
Krucker S, Hurford GJ, Lin RP (2005b) RHESSI X-ray and gamma-ray observations of the January 20,2005 event. Eos Trans AGU 86:SH21A-01, fall Meet. Suppl
Krucker S, Hannah IG, Lin RP (2007) RHESSI and Hinode X-ray observations of a partially occulted solarflare. Astrophys J Lett 671:L193–L196. doi:10.1086/525019
Krucker S, Battaglia M, Cargill PJ, Fletcher L, Hudson HS, MacKinnon AL, Masuda S, Sui L, TomczakM, Veronig AL, Vlahos L, White SM (2008a) Hard X-ray emission from the solar corona. AstronAstrophys Rev 16:155–208. doi:10.1007/s00159-008-0014-9
Krucker S, Hurford GJ, MacKinnon AL, Shih AY, Lin RP (2008b) Coronal γ -ray bremsstrahlung fromsolar flare-accelerated electrons. Astrophys J Lett 678:L63–L66. doi:10.1086/588381
Krucker S, Saint-Hilaire P, Christe S, White SM, Chavier AD, Bale SD, Lin RP (2008c) Coronal hard X-rayemission associated with radio type III bursts. Astrophys J 681:644–649. doi:10.1086/588549
Krucker S, Hudson HS, Jeffrey NLS, Battaglia M, Kontar EP, Benz AO, Csillaghy A, Lin RP (2011) High-resolution imaging of solar flare ribbons and its implication on the thick-target beam model. AstrophysJ 739:96. doi:10.1088/0004-637X/739/2/96
Krüger A (1979) Introduction to solar radio astronomy and radio physics. In: Geophysics and astrophysicsmonographs, vol 16. Reidel, Dordrecht. doi:10.1007/978-94-009-9402-7
Kundu MR (1965) Solar radio astronomy. Interscience Publication, New YorkKundu MR (1984) Relative positions of microwave and hard X-ray burst sources. Adv Space Res 4:157–162.
doi:10.1016/0273-1177(84)90175-3Kundu MR, Schmahl EJ, Velusamy T (1982) Magnetic structure of a flaring region producing impulsive
microwave and hard X-ray bursts. Astrophys J 253:963–974. doi:10.1086/159694Kundu MR, White SM, Garaimov VI, Subramanian P, Ananthakrishnan S, Janardhan P (2006) The morphol-
ogy of decimetric emission from solar flares: GMRT observations. Solar Phys 236:369–387. doi:10.1007/s11207-006-0059-8
Lin RP (2011) Energy release and particle acceleration in flares: summary and future prospects. Space SciRev 159:421–445. doi:10.1007/s11214-011-9801-0. arXiv:1110.1805
Lin RP, Hudson HS (1976) Non-thermal processes in large solar flares. Solar Phys 50:153–178. doi:10.1007/BF00206199
Lin RP, Schwartz RA, Pelling RM, Hurley KC (1981) A new component of hard X-rays in solar flares.Astrophys J Lett 251:L109–L114. doi:10.1086/183704
Lin RP, Larson D, McFadden J, Carlson CW, Ergun RE, Anderson KA, Ashford S, McCarthy M, ParksGK, Rème H, Bosqued JM, d’Uston C, Sanderson TR, Wenzel KP (1996) Observation of an impulsivesolar electron event extending down to ∼0.5 keV energy. Geophys Res Lett 23:1211–1214. doi:10.1029/96GL00710
Lin RP, Dennis BR, Hurford GJ, Smith DM, Zehnder A, Harvey PR, Curtis DW, Pankow D, Turin P, BesterM, Csillaghy A, Lewis M, Madden N, van Beek HF, Appleby M, Raudorf T, McTiernan J, RamatyR, Schmahl E, Schwartz R, Krucker S, Abiad R, Quinn T, Berg P, Hashii M, Sterling R, Jackson R,Pratt R, Campbell RD, Malone D, Landis D, Barrington-Leigh CP, Slassi-Sennou S, Cork C, Clark D,Amato D, Orwig L, Boyle R, Banks IS, Shirey K, Tolbert AK, Zarro D, Snow F, Thomsen K, HenneckR, McHedlishvili A, Ming P, Fivian M, Jordan J, Wanner R, Crubb J, Preble J, Matranga M, BenzAO, Hudson HS, Canfield RC, Holman GD, Crannell C, Kosugi T, Emslie AG, Vilmer N, Brown JC,Johns-Krull CM, Aschwanden MJ, Metcalf TR, Conway A (2002) The Reuven Ramaty high-energysolar spectroscopic imager (RHESSI). Solar Phys 210:3–32. doi:10.1023/A:1022428818870
Lin RP, Krucker S, Hurford GJ, Smith DM, Hudson HS, Holman GD, Schwartz RA, Dennis BR, ShareGH, Murphy RJ, Emslie AG, Johns-Krull CM, Vilmer N (2003) RHESSI observations of particleacceleration and energy release in an intense solar gamma-ray line flare. Astrophys J Lett 595:L69–L76. doi:10.1086/378932
Litvinenko YE (1996) Particle acceleration in reconnecting current sheets with a nonzero magnetic field.Astrophys J 462:997. doi:10.1086/177213
Liu W, Liu S, Jiang YW, Petrosian V (2006) RHESSI observation of chromospheric evaporation. AstrophysJ 649:1124–1139. doi:10.1086/506268. arXiv:astro-ph/0603510
123

Flare Observations Page 55 of 59 2
Liu W, Petrosian V, Dennis BR, Jiang YW (2008) Double coronal hard and soft X-ray source observedby RHESSI: evidence for magnetic reconnection and particle acceleration in solar flares. Astrophys J676:704–716. doi:10.1086/527538. arXiv:0709.1963
Longcope DW (2005) Topological methods for the analysis of solar magnetic fields. Living Rev Solar Phys2:lrsp-2005-7. doi:10.12942/lrsp-2005-7. http://www.livingreviews.org/lrsp-2005-7
Low BC (1996) Solar activity and the corona. Solar Phys 167:217–265. doi:10.1007/BF00146338Mann G, Aurass H, Warmuth A (2006) Electron acceleration by the reconnection outflow shock during
solar flares. Astron Astrophys 454:969–974. doi:10.1051/0004-6361:20064990Mariska JT, McTiernan JM (1999) Hard and soft X-ray observations of occulted and nonocculted solar limb
flares. Astrophys J 514:484–492. doi:10.1086/306927Mariska JT, Doschek GA, Bentley RD (1993) Flare plasma dynamics observed with the YOHKOH Bragg
crystal spectrometer. I. Properties of the Ca XIX resonance line. Astrophys J 419:418. doi:10.1086/173494
Marsh KA, Hurford GJ (1982) High spatial resolution solar microwave observations. Annu Rev AstronAstrophys 20:497–516. doi:10.1146/annurev.aa.20.090182.002433
Martin SF (1989) Mass motions associated with solar flares. Solar Phys 121:215–238. doi:10.1007/BF00161697
Martínez Oliveros JC, Hudson HS, Hurford GJ, Krucker S, Lin RP, Lindsey C, Couvidat S, Schou J,Thompson WT (2012) The height of a white-light flare and its hard X-ray sources. Astrophys J Lett753:L26. doi:10.1088/2041-8205/753/2/L26. arXiv:1206.0497
Masuda S, Kosugi T, Hara H, Tsuneta S, Ogawara Y (1994) A loop-top hard X-ray source in a compactsolar flare as evidence for magnetic reconnection. Nature 371:495–497. doi:10.1038/371495a0
Masuda S, Sato J, Kosugi T, Sakao T (2000) Spectral characteristics of above-the-looptop hard X-ray source.Adv Space Res 26:493–496. doi:10.1016/S0273-1177(99)01101-1
Masuda S, Kosugi T, Hudson HS (2001) A hard X-ray two-ribbon flare observed with Yohkoh/HXT. SolarPhys 204:55–67. doi:10.1023/A:1014230629731
Matthews SA, van Driel-Gesztelyi L, Hudson HS, Nitta NV (2003) A catalogue of white-light flares observedby Yohkoh. Astron Astrophys 409:1107–1125. doi:10.1051/0004-6361:20031187
McKenzie DE, Hudson HS (1999) X-ray observations of motions and structure above a solar flare arcade.Astrophys J Lett 519:L93–L96. doi:10.1086/312110
McTiernan JM, Kane SR, Loran JM, Lemen JR, Acton LW, Hara H, Tsuneta S, Kosugi T (1993) Temperatureand density structure of the 1991 November 2 flare observed by the YOHKOH soft X-ray telescopeand hard X-ray telescope. Astrophys J Lett 416:L91. doi:10.1086/187078
McTiernan JM, Fisher GH, Li P (1999) The solar flare soft X-ray differential emission measure and theNeupert effect at different temperatures. Astrophys J 514:472–483. doi:10.1086/306924
Melnikov VF, Shibasaki K, Reznikova VE (2002) Loop-top nonthermal microwave source in extended solarflaring loops. Astrophys J Lett 580:L185–L188. doi:10.1086/345587
Melrose DB (1980) Plasma astrophysics: nonthermal processes in diffuse magnetized plasmas, vol 2. Gordonand Breach, New York
Melrose DB (1990) Particle acceleration processes in the solar corona. Aust J Phys 43:703–752. doi:10.1071/PH900703
Metcalf TR, Alexander D (1999) Coronal trapping of energetic flare particles: Yohkoh/HXT observations.Astrophys J 522:1108–1116. doi:10.1086/307679
Metcalf TR, Alexander D, Hudson HS, Longcope DW (2003) TRACE and Yohkoh observations of awhite-light flare. Astrophys J 595:483–492. doi:10.1086/377217
Miller JA, Cargill PJ, Emslie AG, Holman GD, Dennis BR, LaRosa TN, Winglee RM, Benka SG, TsunetaS (1997) Critical issues for understanding particle acceleration in impulsive solar flares. J GeophysRes 102:14631–14660. doi:10.1029/97JA00976
Milligan RO (2015) Extreme ultra-violet spectroscopy of the lower solar atmosphere during solar flares(invited review). Solar Phys 290:3399–3423. doi:10.1007/s11207-015-0748-2. arXiv:1501.04829
Milligan RO, Dennis BR (2009) Velocity characteristics of evaporated plasma using Hinode/EUV imagingspectrometer. Astrophys J 699:968–975. doi:10.1088/0004-637X/699/2/968. arXiv:0905.1669
Milligan RO, Gallagher PT, Mathioudakis M, Keenan FP, Bloomfield DS (2005) Plasma diagnostics ofactive-region evolution and implications for coronal heating. Mon Not R Astron Soc 363:259–267.doi:10.1111/j.1365-2966.2005.09446.x. arXiv:astro-ph/0509219
123

2 Page 56 of 59 Arnold O. Benz
Milligan RO, Gallagher PT, Mathioudakis M, Keenan FP (2006) Observational evidence of gentle chro-mospheric evaporation during the impulsive phase of a solar flare. Astrophys J Lett 642:L169–L171.doi:10.1086/504592. arXiv:astro-ph/0603652
Milligan RO, Kerr GS, Dennis BR, Hudson HS, Fletcher L, Allred JC, Chamberlin PC, Ireland J, Math-ioudakis M, Keenan FP (2014) The radiated energy budget of chromospheric plasma in a major solarflare deduced from multi-wavelength observations. Astrophys J 793:70. doi:10.1088/0004-637x/793/2/70. arXiv:1406.7657
Miroshnichenko LI, Perez-Peraza JA (2008) Astrophysical aspects in the studies of solar cosmic rays. IntJ Mod Phys A 23:1–141. doi:10.1142/S0217751X08037312
Moore RL, Sterling AC, Hudson HS, Lemen JR (2001) Onset of the magnetic explosion in solar flares andcoronal mass ejections. Astrophys J 552:833–848. doi:10.1086/320559
Moreton GF (1964) Hα shock wave and winking filaments with the flare of 20 September 1963. Astron J69:145. doi:10.1086/109375
Musset S, Vilmer N, Bommier V (2015) Hard X-ray emitting energetic electrons and photospheric electriccurrents. Astron Astrophys 580:A106. doi:10.1051/0004-6361/201424378. arXiv:1506.02724
Nakariakov VM, Foullon C, Verwichte E, Young NP (2006) Quasi-periodic modulation of solar and stellarflaring emission by magnetohydrodynamic oscillations in a nearby loop. Astron Astrophys 452:343–346. doi:10.1051/0004-6361:20054608
Neupert WM (1968) Comparison of solar X-ray line emission with microwave emission during flares.Astrophys J Lett 153:L59. doi:10.1086/180220
Nindos A, White SM, Kundu MR, Gary DE (2000) Observations and models of a flaring loop. AstrophysJ 533:1053–1062. doi:10.1086/308705
Nindos A, Aurass H, Klein KL, Trottet G (2008) Radio emission of flares and coronal mass ejections.Invited review. Solar Phys 253:3–41. doi:10.1007/s11207-008-9258-9
Nishio M, Yaji K, Kosugi T, Nakajima H, Sakurai T (1997) Magnetic field configuration in impulsive solarflares inferred from coaligned microwave/X-ray images. Astrophys J 489:976. doi:10.1086/304793
Øieroset M, Phan TD, Fujimoto M, Lin RP, Lepping RP (2001) In situ detection of collisionless reconnectionin the Earth’s magnetotail. Nature 412:414–417. doi:10.1038/35086520
Paesold G, Benz AO, Klein KL, Vilmer N (2001) Spatial analysis of solar type III events associated withnarrow band spikes at metric wavelengths. Astron Astrophys 371:333–342. doi:10.1051/0004-6361:20010358. arXiv:astro-ph/0103491
Parker EN (1988) Nanoflares and the solar X-ray corona. Astrophys J 330:474–479. doi:10.1086/166485Parks GK, Winckler JR (1969) Sixteen-second periodic pulsations observed in the correlated microwave
and energetic X-ray emission from a solar flare. Astrophys J Lett 155:L117. doi:10.1086/180315Parnell CE, Jupp PE (2000) Statistical analysis of the energy distribution of nanoflares in the quiet sun.
Astrophys J 529:554–569. doi:10.1086/308271Peterson LE, Winckler JR (1959) Gamma-ray burst from a solar flare. J Geophys Res 64:697. doi:10.1029/
JZ064i007p00697Petrosian V, Donaghy TQ, McTiernan JM (2002) Loop top hard X-ray emission in solar flares: images and
statistics. Astrophys J 569:459–473. doi:10.1086/339240. arXiv:astro-ph/0112363Petrosian V, Yan H, Lazarian A (2006) Damping of magnetohydrodynamic turbulence in solar flares.
Astrophys J 644:603–612. doi:10.1086/503378. arxiv:astro-ph/0508567Pevtsov AA, Canfield RC, Zirin H (1996) Reconnection and helicity in a solar flare. Astrophys J 473:533.
doi:10.1086/178164Piana M, Massone AM, Kontar EP, Emslie AG, Brown JC, Schwartz RA (2003) Regularized electron flux
spectra in the 2002 July 23 solar flare. Astrophys J Lett 595:L127–L130. doi:10.1086/378171Pick M, van den Oord GHJ (1990) Observations of beam propagation. Solar Phys 130:83–99. doi:10.1007/
BF00156781Pick M, Vilmer N (2008) Sixty-five years of solar radioastronomy: flares, coronal mass ejections and Sun
Earth connection. Astron Astrophys Rev 16:1–153. doi:10.1007/s00159-008-0013-xPick M, Malherbe JM, Kerdraon A, Maia DJF (2005) On the disk Hα and radio observations of the 2003
October 28 flare and coronal mass ejection event. Astrophys J Lett 631:L97–L100. doi:10.1086/497137
Priest ER, Forbes T (2000) Magnetic reconnection: MHD theory and applications. Cambridge UniversityPress, Cambridge
Radziszewski K, Rudawy P, Phillips KJH (2007) High time resolution observations of solar Hα flares. I.Astron Astrophys 461:303–313. doi:10.1051/0004-6361:20053460
123

Flare Observations Page 57 of 59 2
Ramaty R, Kozlovsky B (1974) Deuterium, tritium, and helium-3 production in solar flares. Astrophys J193:729–740. doi:10.1086/153212
Ramaty R, Mandzhavidze N, Kozlovsky B, Murphy RJ (1995) Solar atmopheric abundances and energycontent in flare accelerated ions from gamma-ray spectroscopy. Astrophys J Lett 455:L193. doi:10.1086/309841
Reeves KK, Warren HP, Forbes TG (2007) Theoretical predictions of X-ray and extreme-UV flare emissionsusing a loss-of-equilibrium model of solar eruptions. Astrophys J 668:1210–1220. doi:10.1086/521291
Régnier S, Canfield RC (2006) Evolution of magnetic fields and energetics of flares in active region 8210.Astron Astrophys 451:319–330. doi:10.1051/0004-6361:20054171
Roberts B, Edwin PM, Benz AO (1983) Fast pulsations in the solar corona. Nature 305:688–690. doi:10.1038/305688a0
Ryan JM, Lockwood JA, Debrunner H (2000) Solar energetic particles. Space Sci Rev 93:35–53Saint-Hilaire P, Benz AO (2002) Energy budget and imaging spectroscopy of a compact flare. Solar Phys
210:287–306. doi:10.1023/A:1022478300679. arXiv:astro-ph/0210023Saint-Hilaire P, Benz AO (2005) Thermal and non-thermal energies of solar flares. Astron Astrophys
435:743–752. doi:10.1051/0004-6361:20041918Schlickeiser R, Miller JA (1998) Quasi-linear theory of cosmic-ray transport and acceleration: the role of
oblique magnetohydrodynamic waves and transit-time damping. Astrophys J 492:352. doi:10.1086/305023
Schrijver CJ, Aschwanden MJ, Title AM (2002) Transverse oscillations in coronal loops observed withTRACE—I. An overview of events, movies, and a discussion of common properties and requiredconditions. Solar Phys 206:69–98. doi:10.1023/A:1014957715396
Schwenn R (2006) Space weather: the solar perspective. Living Rev Solar Phys 3:lrsp-2006-2. doi:10.12942/lrsp-2006-2. http://www.livingreviews.org/lrsp-2006-2
Shibata K (1999) Evidence of magnetic reconnection in solar flares and a unified model of flares. AstrophysSpace Sci 264:129–144. doi:10.1007/978-94-011-4780-4_95
Shibata K, Magara T (2011) Solar flares: magnetohydrodynamic processes. Living Rev Solar Phys 8:lrsp-2011-6. doi:10.12942/lrsp-2011-6. http://www.livingreviews.org/lrsp-2011-6
Shibata K, Masuda S, Shimojo M, Hara H, Yokoyama T, Tsuneta S, Kosugi T, Ogawara Y (1995) Hot-plasma ejections associated with compact-loop solar flares. Astrophys J 451:L83–L85. doi:10.1086/309688
Shih AY, Lin RP, Smith DM (2009) RHESSI observations of the proportional acceleration of relativistic>0.3 MeV Electrons and >30 MeV protons in solar flares. Astrophys J lett 698:L152–L157. doi:10.1088/0004-637X/698/2/L152
Shimizu T, Kondo K, Ugai M, Shibata K (2009) Magnetohydrodynamics study of three-dimensional fastmagnetic reconnection for intermittent snake-like downflows in solar flares. Astrophys J 707:420–427.doi:10.1088/0004-637X/707/1/420
Silva AVR, White SM, Lin RP, de Pater I, Shibasaki K, Hudson HS, Kundu MR (1996) First images of asolar flare at millimeter wavelengths. Astrophys J Lett 458:L49. doi:10.1086/309918
Silva AVR, Wang H, Gary DE, Nitta N, Zirin H (1997) Imaging the chromospheric evaporation of the 1994June 30 solar flare. Astrophys J 481:978. doi:10.1086/304076
Singh J, Sakurai T, Ichimoto K, Suzuki I, Hagino M (2005) Spectroscopic studies of solar corona VII.Formation of a coronal loop by evaporation. Solar Phys 226:201–221. doi:10.1007/s11207-005-7415-y
Slottje C (1978) Millisecond microwave spikes in a solar flare. Nature 275:520. doi:10.1038/275520a0Solanki SK, Lagg A, Woch J, Krupp N, Collados M (2003) Three-dimensional magnetic field topology in
a region of solar coronal heating. Nature 425:692–695. doi:10.1038/nature02035Somov BV (1992) Physical processes in solar flares, astrophysics and space science library, vol 172. Kluwer,
DordrechtSpicer DS, Sudan RN (1984) Beam-return current systems in solar flares. Astrophys J 280:448–456. doi:10.
1086/162011Sterling AC, Shibata K, Mariska JT (1993) Solar chromospheric and transition region response to energy
deposition in the middle and upper chromosphere. Astrophys J 407:778–789. doi:10.1086/172559Strong KT, Benz AO, Dennis BR, Poland AI, Leibacher JW, Mewe R, Schrijver J, Simnett G, Smith JB
Jr, Sylwester J (1984) A multiwavelength study of a double impulsive flare. Solar Phys 91:325–344.doi:10.1007/BF00146303
123
2 Page 58 of 59 Arnold O. Benz
Sturrock PA (1966) Model of the high-energy phase of solar flares. Nature 211:695–697. doi:10.1038/211695a0
Sturrock PA (ed) (1980) Solar flares: a monograph from SKYLAB solar workshop II. Colorado AssociatedUniversity Press, Boulder
Sudol JJ, Harvey JW (2005) Longitudinal magnetic field changes accompanying solar flares. Astrophys J635:647–658. doi:10.1086/497361
Sui L, Holman GD (2003) Evidence for the formation of a large-scale current sheet in a solar flare. AstrophysJ Lett 596:L251–L254. doi:10.1086/379343
Sui L, Holman GD, Dennis BR (2004) Evidence for magnetic reconnection in three homologous solar flaresobserved by RHESSI. Astrophys J 612:546–556. doi:10.1086/422515
Sui L, Holman GD, Dennis BR (2006) Enigma of a flare involving multiple-loop interactions: Emerging,colliding loops or magnetic breakout? Astrophys J 646:605–614. doi:10.1086/504885
Sui L, Holman GD, Dennis BR (2007) Nonthermal X-ray spectral flattening toward low energies in earlyimpulsive flares. Astrophys J 670:862–871. doi:10.1086/522198
Suzuki S, Dulk GA (1985) Bursts of Type III and Type V. In: McLean DJ, Labrum NR (eds) Solarradiophysics: studies of emission from the sun at metre wavelengths. Cambridge University Press,Cambridge, pp 289–332
Švestka Z (1976) Solar flares, geophysics and astrophysics monographs, vol 8. Reidel, DordrechtŠvestka Z (1984) Revivals of a coronal arch. Solar Phys 94:171–192Švestka Z, Stewart RT, Hoyng P, van Tend W, Acton LW, Gabriel AH, Rapley CG, Boelee A, Bruner EC,
de Jager C, Lafleur H, Nelson G, Simnett GM, van Beek HF, Wagner WJ (1982) Observations of apost-flare radio burst in X-rays. Solar Phys 75:305–329. doi:10.1007/BF00153479
Sweet PA (1958) The neutral point theory of solar flares. In: Lehnert B (ed) Electromagnetic phenomenain cosmical physics, IAU symposium, vol 6. Cambridge University Press, Cambridge, pp 123–134
Terradas J, Andries J, Goossens M (2007) Coronal loop oscillations: energy considerations and initial valueproblem. Astron Astrophys 469:1135–1143. doi:10.1051/0004-6361:20077404
Tomczak M (2001) The analysis of hard X-ray radiation of flares with occulted footpoints. Astron Astrophys366:294–305. doi:10.1051/0004-6361:20000204
Tsuneta S, Naito T (1998) Fermi acceleration at the fast shock in a solar flare and the impulsive loop-tophard X-ray source. Astrophys J Lett 495:L67–L71. doi:10.1086/311207. arXiv:astro-ph/9801109
Tsuneta S, Masuda S, Kosugi T, Sato J (1997) Hot and superhot plasmas above an impulsive flare loop.Astrophys J 478:787. doi:10.1086/303812
van den Oord GHJ (1990) The electrodynamics of beam/return current systems in the solar corona. AstronAstrophys 234:496–518
Veronig A, Vršnak B, Dennis BR, Temmer M, Hanslmeier A, Magdalenic J (2002) Investigation of theNeupert effect in solar flares. I. Statistical properties and the evaporation model. Astron Astrophys392:699–712. doi:10.1051/0004-6361:20020947. arXiv:astro-ph/0207217
Veronig AM, Brown JC (2004) A coronal thick-target interpretation of two hard X-ray loop events. AstrophysJ Lett 603:L117–L120. doi:10.1086/383199
Veronig AM, Brown JC, Dennis BR, Schwartz RA, Sui L, Tolbert AK (2005) Physics of the Neupert effect:estimates of the effects of source energy, mass transport, and geometry using RHESSI and GOES data.Astrophys J 621:482–497. doi:10.1086/427274
Viall NM, Klimchuk JA (2015) The transition region response to a coronal nanoflare: forward modelingand observations in SDO/AIA. Astrophys J 799:58. doi:10.1088/0004-637X/799/1/58
Vilmer N, MacKinnon AL, Hurford GJ (2011) Properties of energetic ions in the solar atmospherefrom γ -ray and neutron observations. Space Sci Rev 159:167–224. doi:10.1007/s11214-010-9728-x.arXiv:1110.2432
Vorpahl JA (1972) X-radiation (E>10 keV), Hα and microwave emission during the impulsive phase ofsolar flares. Solar Phys 26:397. doi:10.1007/BF00165282
Wang H, Gary DE, Lim J, Schwartz RA (1994) Miocrowave spectral imaging, Hα and hard X-ray obser-vations of a solar limb flare. Astrophys J 433:379–388. doi:10.1086/174652
Wang H, Qiu J, Jing J, Spirock TJ, Yurchyshyn V, Abramenko V, Ji H, Goode PR (2004) Evidence of rapidflux emergence associated with the M8.7 Flare on 2002 July 26. Astrophys J 605:931–937. doi:10.1086/382527
Wang T, Sui L, Qiu J (2007) Direct observation of high-speed plasma outflows produced by mag-netic reconnection in solar impulsive events. Astrophys J Lett 661:L207–L210. doi:10.1086/519004.arXiv:0709.2329
123
Flare Observations Page 59 of 59 2
Warren HP, Bookbinder JA, Forbes TG, Golub L, Hudson HS, Reeves K, Warshall A (1999) TRACEand Yohkoh observations of high-temperature plasma in a two-ribbon limb flare. Astrophys J Lett527:L121–L124. doi:10.1086/312410
Wheatland MS, Melrose DB (1995) Interpreting YOHKOH hard and soft X-ray flare observations. SolarPhys 158:283–299
Wild JP (1950) Observations of the spectrum of high-intensity solar radiation at metre wavelengths. III.Isolated bursts. Aust J Sci Res A 3:541
Woods TN, Eparvier FG, Fontenla J, Harder J, Kopp G, McClintock WE, Rottman G, Smiley B, SnowM (2004) Solar irradiance variability during the October 2003 solar storm period. Geophys Res Lett31:L10802. doi:10.1029/2004GL019571
Wülser JP, Marti H (1989) High time resolution observations of Hα line profiles during the impulsive phaseof a solar flare. Astrophys J 341:1088–1096. doi:10.1086/167567
Wülser JP, Canfield RC, Acton LW, Culhane JL, Phillips A, Fludra A, Sakao T, Masuda S, Kosugi T, TsunetaS (1994) Multispectral observations of chromospheric evaporation in the 1991 November 15 X-classsolar flare. Astrophys J 424:459–465. doi:10.1086/173903
Yokoyama T, Akita K, Morimoto T, Inoue K, Newmark J (2001) Clear evidence of reconnection inflow ofa solar flare. Astrophys J 546:L69–L72. doi:10.1086/318053
Zarro DM, Lemen JR (1988) Conduction-driven chromospheric evaporation in a solar flare. Astrophys J329:456–463. doi:10.1086/166391
Zharkova VV, Brown JC, Syniavskii DV (1995) Electron beam dynamics and hard X-ray bremsstrahlungpolarization in a flaring loop with return current and converging magnetic field. Astron Astrophys304:284
Zirin H, Wang H (1993) Narrow lanes of transverse magnetic field in sunspots. Nature 363:426–428. doi:10.1038/363426a0
123