articles genome sequence of the brown norway rat yields insights into mammalian...
TRANSCRIPT
Genome sequence of the BrownNorway rat yields insights intomammalian evolutionRat Genome Sequencing Project Consortium*
*Lists of participants and affiliations appear at the end of the paper
...........................................................................................................................................................................................................................
The laboratory rat (Rattus norvegicus) is an indispensable tool in experimental medicine and drug development, having madeinestimable contributions to human health. We report here the genome sequence of the Brown Norway (BN) rat strain. Thesequence represents a high-quality ‘draft’ covering over 90% of the genome. The BN rat sequence is the third complete mammaliangenome to be deciphered, and three-way comparisons with the human and mouse genomes resolve details of mammalianevolution. This first comprehensive analysis includes genes and proteins and their relation to human disease, repeated sequences,comparative genome-wide studies of mammalian orthologous chromosomal regions and rearrangement breakpoints, reconstruc-tion of ancestral karyotypes and the events leading to existing species, rates of variation, and lineage-specific and lineage-independent evolutionary events such as expansion of gene families, orthology relations and protein evolution.
Darwin believed that “natural selection will always act very slowly,often only at long intervals of time”1. The consequences of evolutionover timescales of approximately 1,000 millions of years (Myr) and75 Myr were investigated in publications comparing the humanwith invertebrate and mouse genomes, respectively2,3. Here wedescribe changes in mammalian genomes that occurred in a shortertime interval, approximately 12–24 Myr (refs 4, 5) since the com-mon ancestor of rat and mouse.
The comparison of these genomes has produced a number ofinsights:
†The rat genome (2.75 gigabases, Gb) is smaller than the human(2.9 Gb) but appears larger than the mouse (initially 2.5 Gb (ref. 3)but given as 2.6 Gb in NCBI build 32, see http://www.ncbi.nlm.nih.gov/genome/seq/NCBIContigInfo.html).
†The rat, mouse and human genomes encode similar numbers ofgenes. The majority have persisted without deletion or duplicationsince the last common ancestor. Intronic structures are wellconserved.
† Some genes found in rat, but not mouse, arose through expansionof gene families. These include genes producing pheromones, orinvolved in immunity, chemosensation, detoxification orproteolysis.
†Almost all human genes known to be associated with disease haveorthologues in the rat genome but their rates of synonymoussubstitution are significantly different from the remaining genes.
†About 3% of the rat genome is in large segmental duplications, afraction intermediate between mouse (1–2%) and human (5–6%).These occur predominantly in pericentromeric regions. Recentexpansions of major gene families are due to these genomicduplications.
†The eutherian core of the rat genome—that is, bases that alignorthologously to mouse and human—comprises a billion nucleo-tides (,40% of the euchromatic rat genome) and contains the vastmajority of exons and known regulatory elements (1–2% of thegenome). A portion of this core constituting 5–6% of the genomeappears to be under selective constraint in rodents and primates,while the remainder appears to be evolving neutrally.
†Approximately 30% of the rat genome aligns only with mouse, aconsiderable portion of which is rodent-specific repeats. Of thenon-aligning portion, at least half is rat-specific repeats.
†More genomic changes occurred in the rodent lineages than the
primate: (1) These rodent genomic changes include approximately250 large rearrangements between a hypothetical murid ancestorand human, approximately 50 from the murid ancestor to rat, andabout the same from the murid ancestor to mouse. (2) A threefold-higher rate of base substitution in neutral DNA is found along therodent lineage when compared with the human lineage, with therate on the rat branch 5–10% higher than along the mouse branch.(3) Microdeletions occur at an approximately twofold-higher ratethan microinsertions in both rat and mouse branches.†A strong correlation exists between local rates of microinsertionsand microdeletions, transposable element insertion, and nucleotidesubstitutions since divergence of rat and mouse, even though theseevents occurred independently in the two lineages.
Background
History of the ratThe rat, hated and loved at once, is both scourge and servant tomankind. The “Devil’s Lapdog” is the first sign in the Chinesezodiac and traditionally carries the Hindu god Ganesh6. Rats are areservoir of pathogens, known to carry over 70 diseases. They areinvolved in the transmission of infectious diseases to man, includingcholera, bubonic plague, typhus, leptospirosis, cowpox and hanta-virus infections. The rat remains a major pest, contributing tofamine with other rodents by eating around one-fifth of the world’sfood harvest.
Paradoxically, the rat’s contribution to human health cannot beoverestimated, from testing new drugs, to understanding essentialnutrients, to increasing knowledge of the pathobiology of humandisease. In many parts of the world the rat remains a source ofmeat.
The laboratory rat (R. norvegicus) originated in central Asia andits success at spreading throughout the world can be directlyattributed to its relationship with humans7. J. Berkenhout, inhis 1769 treatise Outline of the Natural History of Great Britain,mistakenly took it to be from Norway and used R. norvegicusBerkenhout in the first formal Linnaean description of the species.Whereas the black rat (Rattus rattus) was part of the Europeanlandscape from at least the third century AD and is the speciesassociated with the spread of bubonic plague, R. norvegicus probablyoriginated in northern China and migrated to Europe somewhere
articles
NATURE | VOL 428 | 1 APRIL 2004 | www.nature.com/nature 493© 2004 Nature Publishing Group
around the eighteenth century8. They may have entered Europeafter an earthquake in 1727 by swimming the Volga river.
The rat in researchR. norvegicus was the first mammalian species to be domesticatedfor scientific research, with work dating to before 1828 (ref. 9). Thefirst recorded breeding colony for rats was established in 1856(ref. 9). Rat genetics had a surprisingly early start. The first studiesby Crampe from 1877 to 1885 focused on the inheritance of coatcolour10. Following the rediscovery of Mendel’s laws at the turn ofthe century, Bateson used these concepts in 1903 to demonstratethat rat coat colour is a mendelian trait10. The first inbred ratstrain, PA, was established by King in 1909, the same year thatsystematic inbreeding began for the mouse10. Despite this, themouse became the dominant model for mammalian geneticists,while the rat became the model of choice for physiologists, nutri-tionists and other biomedical researchers. Nevertheless, there areover 234 inbred strains of R. norvegicus developed by selectivebreeding, which ‘fixes’ natural disease alleles in particular strainsor colonies11.
Over the past century, the role of the rat in medicine hastransformed from carrier of contagious diseases to indispensabletool in experimental medicine and drug development. Currentexamples of use of the rat in human medical research includesurgery12, transplantation13–15, cancer16,17, diabetes18,19, psychiatricdisorders20 including behavioural intervention21 and addiction22,neural regeneration23,24, wound25,26 and bone healing27, spacemotion sickness28, and cardiovascular disease29–31. In drug develop-ment, the rat is routinely employed both to demonstrate therapeuticefficacy15,32,33 and to assess toxicity of novel therapeutic compoundsbefore human clinical trials34–37.
The Rat Genome ProjectOver the past decade, investigators and funding agencies haveparticipated in rat genomics to develop valuable resources. Beforethe launch of the Rat Genome Sequencing Project (RGSP), therewas much debate about the overall value of the rat genome sequenceand its contribution to the utility of the rat as a model organism.The debate was fuelled by the naive belief that the rat and mousewere so similar morphologically and evolutionarily that the ratsequence would be redundant. Nevertheless, an effort spearheadedby two NIH agencies (NHGRI and NHLBI) culminated in theformation of the RGSP Consortium (RGSPC).
The RGSP was to generate a draft sequence of the rat genome,and, unlike the comparable human and mouse projects, errorswould not ultimately be corrected in a finished sequence38. Conse-quently, the draft quality was critical. Although it was expected tohave gaps and areas of inaccuracy, the overall sequence quality hadto be high enough to support detailed analyses.
The BN rat was selected as a sequencing target by the researchcommunity. An inbred animal (BN/SsNHsd) was obtained bythe Medical College of Wisconsin (MCW) from Harlan SpragueDawley. Microsatellite studies indicated heterozygosity, so over 13generations of additional inbreeding were performed at the MCW,resulting in BN/SsNHsd/Mcwi animals. Most of the sequence datawere from two females, with a small amount of whole genomeshotgun (WGS) and flow-sorted Y chromosome sequencing froma male. The Y chromosome is not included in the currentassembly.
A network of centres generated data and resources, led by theBaylor College of Medicine Human Genome Sequencing Center(BCM-HGSC) and including Celera Genomics, the Genome Thera-peutics Corporation, the British Columbia Cancer Agency GenomeSciences Centre, The Institute for Genomic Research, the Universityof Utah, the Medical College of Wisconsin, The Children’s Hospitalof Oakland Research Institute, and the Max Delbruck Center forMolecular Medicine, Berlin. After assembly of the genome at the
BCM-HGSC, analysis was performed by an international team,representing over 20 groups in six countries and relying largely ongene and protein predictions produced by Ensembl.
Determination of the genome sequence
Atlas and the ‘combined’ sequencing strategyDespite progress in assembling draft sequences2,3,39–44 the questionof which method produces the highest-quality products is unre-solved. A significant issue is the choice between logistically simplerWGS approaches versus more complex strategies employing bac-terial artificial chromosome (BAC) clones45–48. In the Public HumanGenome Project2 a BAC by BAC hierarchical approach was used andprovided advantages in assembling difficult parts of the genome.The draft mouse sequence was a pure WGS approach using theARACHNE assembler3,49,50 but underrepresented duplicatedregions owing to ‘collapses’ in the assembly3,51–53. This limitationof the mouse draft sequence was tolerable owing to the planned fulluse of BAC clones in constructing the final finished sequence.
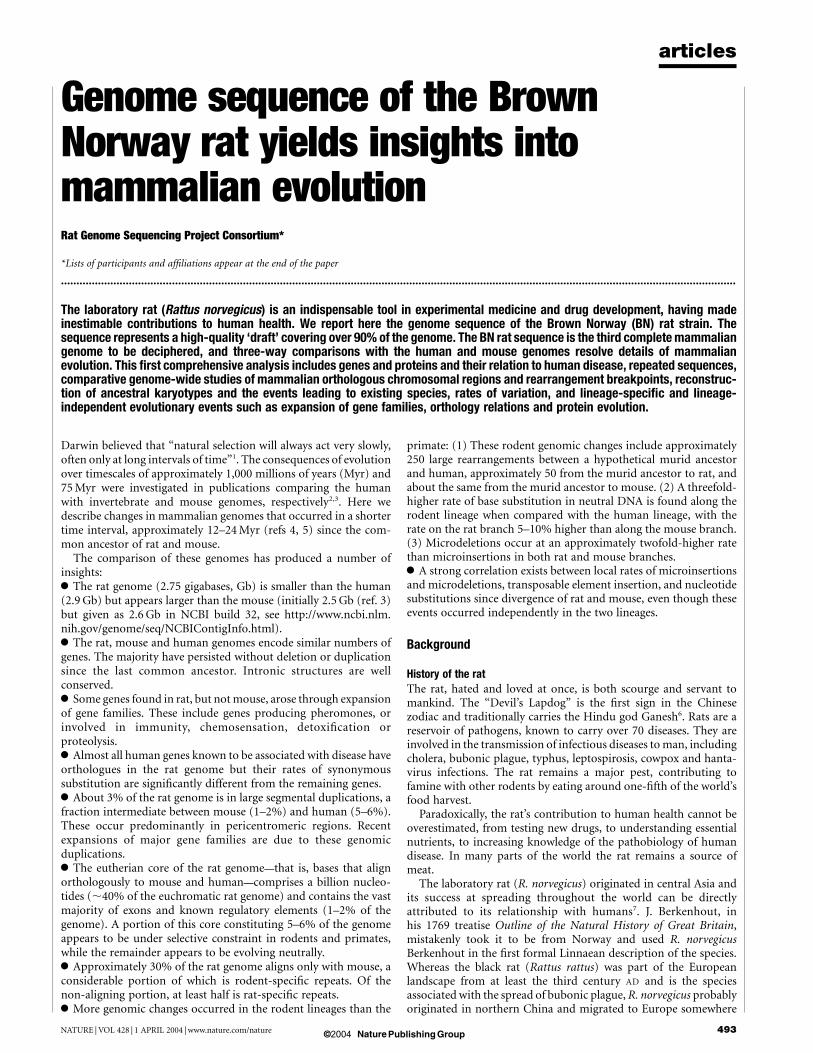
The RGSPC opted to develop a ‘combined’ approach using bothWGS and BAC sequencing (Fig. 1). In the combined approach,WGS data are progressively melded with light sequence coverage ofindividual BACs (BAC skims) to yield intermediate products called‘enriched BACs’ (eBACs). eBACs covering the whole genome arethen joined into longer structures (bactigs). Bactigs are joined toform larger structures: superbactigs, then ultrabactigs. During thisprocess other data are introduced, including BAC end sequences,DNA fingerprints and other long-range information (genetic mar-kers, syntenic information), but the process is constrained by eBACstructures.
To execute the combined strategy we developed the Atlas softwarepackage54 (Fig. 1). The Atlas suite includes a ‘BAC-Fisher’ com-ponent that performs the functions needed to generate eBACs.WGS genome coverage was generated ahead of complete BACcoverage, so a BAC-Fisher web server was established at theBCM-HGSC to enable users to access the combined BAC andWGS reads as each BAC was processed (see Methods for dataaccess). Each eBAC is assembled with high stringency to representthe local sequence accurately, and so provide a valuable intermedi-ate product that assists all users of the genome data. Additional Atlasmodules joined eBACs and linked bactigs to give the completeassembly (Fig. 1). Overall, the combined approach takes advantageof the strengths of both previous methods, with few of thedisadvantages.
Sequence and genome dataOver 44 million DNA sequence reads were generated (Table 1;Methods). Following removal of low-quality reads and vectorcontaminants, 36 million reads were used for Atlas assembly,which retained 34 million reads. This was 7£ sequence coveragewith 60% provided by WGS and 40% from BACs. Slightly differentestimates came from considering the entire ‘trimmed’ length of thesequence data (7.3£), or only the portion of Phred20 quality orhigher (6.9£).
The sequence data were end-reads from clones either deriveddirectly from the genome (insert sizes of ,10 kb, 10 kb, 50 kb and.150 kb) or from small insert plasmids subcloned from BACs.Overall, these provided 42-fold clone coverage, with 32-fold cover-age having both paired ends represented. Approximately equalcontributions of clone coverage were from the different categories.
Over 21,000 BACs were used for BAC skims (1.6£ coverage) withan average sequence depth of 1.8£, giving an overall 2.8£ genomicsequence coverage from BACs. This was slightly more than themost efficient procedure would require (,1.2£ each), because thegenome size was not known at the project start.
Simultaneous with sequencing, 199,782 clones from theCHORI-230 BAC library55 were fingerprinted by restriction enzyme
articles
NATURE | VOL 428 | 1 APRIL 2004 | www.nature.com/nature494 © 2004 Nature Publishing Group
digestion, representing 12-fold genomic coverage56 (Methods).These were assembled into a ‘fingerprint contig (FPC)’ map (acontig is a set of overlapping segments of DNA) containing 11,274FPCs. BAC selection for sequence skimming was based on overlapsbetween BACs using FPC mapping56 (M.K. and C.F., unpublishedwork), ongoing BAC end sequencing (S.Z., unpublished work), andBAC sequence skimming57. This strategy led to the sequence of atiling path of BAC clones, covering the whole genome. In additionto the FPC map, a yeast artificial chromosome (YAC)-based physicalmap was constructed. 5,803 BAC and P1-derived artificial chromo-some (PAC) clones from RPCI-32 and RPCI-31 libraries55, respect-ively, were anchored to 51,323 YAC clones originating from twotenfold-coverage YAC libraries58,225 assembled into 605 contigs56.This map was subsequently integrated with the FPC map and thesequence assembly, reducing the total number of map contigs to 376(minimum length of contig containing the ‘typical’ nucleotide,N 50 ¼ 172 clones, 4.4 Mb; 358 anchored to the sequence assembly;Supplementary Information).
The combined strategy enabled development of resources such asthe FPC map, BAC end sequences, and BAC skim sequences inparallel, rather than sequentially. In addition to allowing ongoing
quality checking, this permitted the data-gathering phase of theproject to be completed in less than two years.
Atlas assemblyStatistics for the Rnor3.1 assembly are in Table 2. Contigs withineBACs were ordered and oriented using read-pair information.Read-pair information was also used to add WGS reads to eBACs,even when sequence overlaps could not be reliably detected owing torepeated sequences. BAC skim reads with repeats were included inthe assembly of eBACs because they clearly originated within BACinsert sequences. Over 19,000 eBACs were eventually generated.
More than 98% of eBACs were successfully merged to formbactigs (Fig. 1). Bactigs were subsequently reassembled to process allreads from overlapping BACs simultaneously, and then ordered andoriented with respect to each other using FPC map and BAC endsequence read-pair information. These superbactig and ultrabactigstructures (see below) were aligned with chromosomes usingexternal information, such as positions of genetic markers. Ultra-bactigs represented the largest sequence units used to buildchromosomes.
The current release of the rat genome assembly, version Rnor3.1,
a b
Figure 1 The new ‘combined’ sequence strategy and Atlas software. a, Formation of
‘eBACs’. The RGSP strategy combined the advantages of both BAC and WGS sequence
data54. Modest sequence coverage (,1.8-fold) from a BAC is used as ‘bait’ to ‘catch’
WGS reads from the same region of the genome. These reads, and their mate pairs, are
assembled using Phrap to form an eBAC. This stringent local assembly retains 95% of the
‘catch’. b, Creation of higher-order structures. Multiple eBACs are assembled into bactigs
based on sequence overlaps. The bactigs are joined into superbactigs by large clone
mate-pair information (at least two links), extended into ultrabactigs using additional
information (single links, FPC contigs, synteny, markers), and ultimately aligned to
genome mapping data (radiation hybrid and physical maps) to form the complete
assembly.
Table 1 Clones and reads used in the RGSP
Insert size* (kb) Source or vector Reads (millions) Bases (billions) Sequence coverage† Clone coverage‡
All§ Used Paired Assembled Trimmed $Phred20 Trimmed $Phred20...................................................................................................................................................................................................................................................................................................................................................................
2–4 Plasmid 9.6 8.6 7.4 7.9 4.8 4.5 1.8 1.6 3.704.5–7.5 Plasmid 4.5 4.3 3.6 3.6 2.4 2.3 0.87 0.82 2.9610 Plasmid 8.4 7.2 6.4 6.4 4.1 3.8 1.5 1.4 11.6350 Plasmid 1.7 1.3 1.0 1.1 0.69 0.65 0.25 0.24 9.47150–250 BAC 0.32 0.31 0.26 0.26 0.18 0.16 0.07 0.06 9.26
Total WGS 24.5 21.7 18.7 19.2 12.1 11.3 4.4 4.1 37.02–5 BAC skims 19.6 14.6 13.2 14.5 8.0 7.7 2.9 2.8 4.8kTotal 44.1 36.3 31.9 33.7 20.2 19.0 7.3 6.9 41.8...................................................................................................................................................................................................................................................................................................................................................................
*Grouped in ranges of sizes for individual libraries tracked to specific multiples of 0.5 kb.†Total bases in used reads divided by sampled genome size including all cloned and sequenced euchromatic or heterochromatic regions.‡Estimated as sum of insert sizes divided by sampled genome size.§WGS reads available on the NCBI Trace Archive as of 21 March 2003; BAC skim reads attempted at BCM-HGSC as of 12 May 2003; BAC end reads obtained directly from TIGR.kRefers to coverage from 2–5 kb subclones from BACs. The BACs that were skimmed amounted to 1.58 £ clone coverage.
articles
NATURE | VOL 428 | 1 APRIL 2004 | www.nature.com/nature 495© 2004 Nature Publishing Group
was generated using the data in Table 1. Earlier releases (Rnor2.0/2.1, Methods) were used for a substantial part of the annotationand analysis of genes and proteins, whereas the current releaseprovided the genome description. Rnor3.1 has 128,000 contigs,with N 50 length 38 kb—larger than the expected genomic extent of amammalian gene. These sequence contigs were linked into 783superbactigs that were anchored to the radiation hybrid map59.These larger units had N 50 length 5.4 Mb. Another 134 smallersuperbactigs (N50 length 1.2 Mb) could not be anchored, presum-ably because they fell into gaps between markers or because theywere in repeated regions that could not be unambiguously placed.From placement on the radiation hybrid map, adjacent superbactigswere further linked to maximize continuity of sequence if appro-priate read-pair mates existed or FPC suggested links. This reducedlinked superbactigs to 419 pieces with 71 singletons. 291 ultra-bactigs with N 50 length of nearly 19 Mb were placed on chromo-somes. Orthology information with mouse and human sequenceswas also used to resolve conflicts and suggest placement of sequenceunits. Most of the 128 unplaced units were either singletons or smallsuperbactigs that consisted of few clones. Thus, nearly the entiregenome was represented in less than 300 large sequence units.
Quality assessmentThirteen megabases of high-quality finished rat sequence fromBACs were available for comparison with Rnor3.1 (Methods).This analysis showed that the majority of draft bases from withincontigs were high quality (1.32 mismatches per 10 kb). This isessentially the accepted accuracy standard for finished sequence (1.0errors per 10 kb)60, so the overwhelming majority of contig bases arehighly accurate. The highest frequency of mismatches occurred atthe ends of contigs. We calculate the average size of these lower-accuracy regions to be 750 base pairs (bp) and they amount to lessthan 0.9% of the genome. These regions arise from misassembly ofterminal reads due to repeated sequences.
Few mismatches were found within contigs. Six were foundwithin contigs when compared with the 13 Mb of finished sequence,or one case per 2.2 Mb. All were insertions or deletions and mayrepresent polymorphisms. Thus, at the fine structure level, the bulkof sequences that make up contigs is nearly the quality of finishedsequence.
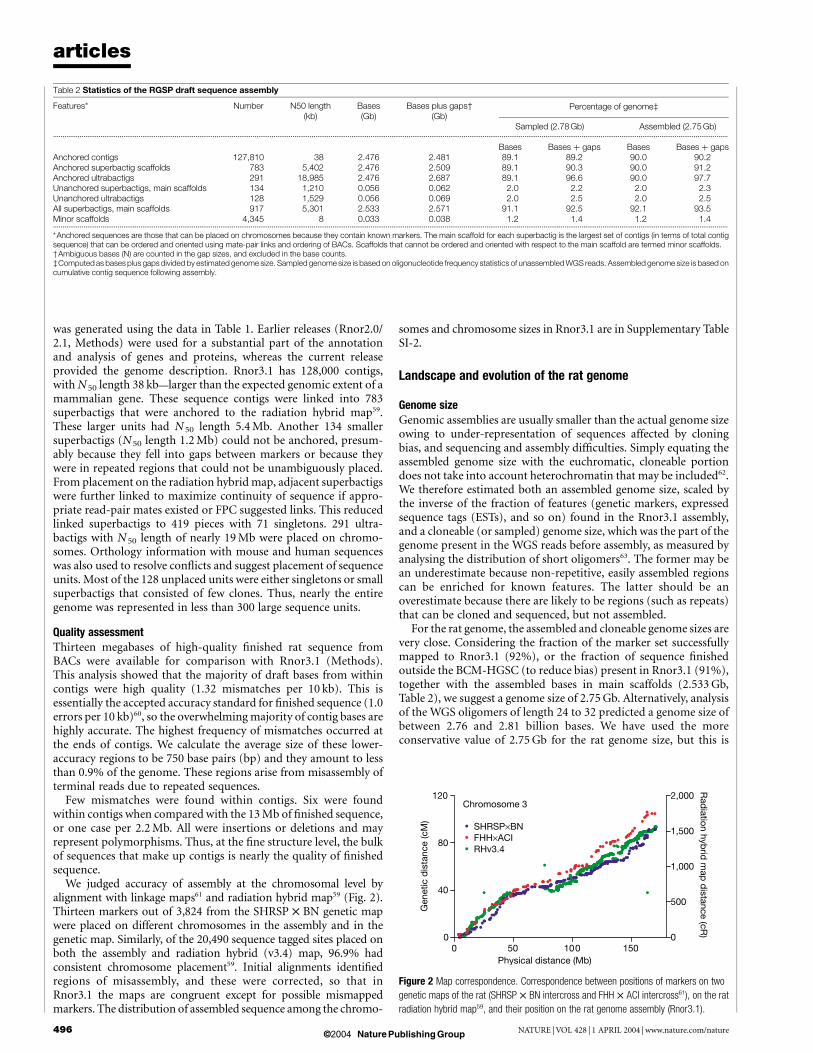
We judged accuracy of assembly at the chromosomal level byalignment with linkage maps61 and radiation hybrid map59 (Fig. 2).Thirteen markers out of 3,824 from the SHRSP £ BN genetic mapwere placed on different chromosomes in the assembly and in thegenetic map. Similarly, of the 20,490 sequence tagged sites placed onboth the assembly and radiation hybrid (v3.4) map, 96.9% hadconsistent chromosome placement59. Initial alignments identifiedregions of misassembly, and these were corrected, so that inRnor3.1 the maps are congruent except for possible mismappedmarkers. The distribution of assembled sequence among the chromo-
somes and chromosome sizes in Rnor3.1 are in Supplementary TableSI-2.
Landscape and evolution of the rat genome
Genome sizeGenomic assemblies are usually smaller than the actual genome sizeowing to under-representation of sequences affected by cloningbias, and sequencing and assembly difficulties. Simply equating theassembled genome size with the euchromatic, cloneable portiondoes not take into account heterochromatin that may be included62.We therefore estimated both an assembled genome size, scaled bythe inverse of the fraction of features (genetic markers, expressedsequence tags (ESTs), and so on) found in the Rnor3.1 assembly,and a cloneable (or sampled) genome size, which was the part of thegenome present in the WGS reads before assembly, as measured byanalysing the distribution of short oligomers63. The former may bean underestimate because non-repetitive, easily assembled regionscan be enriched for known features. The latter should be anoverestimate because there are likely to be regions (such as repeats)that can be cloned and sequenced, but not assembled.
For the rat genome, the assembled and cloneable genome sizes arevery close. Considering the fraction of the marker set successfullymapped to Rnor3.1 (92%), or the fraction of sequence finishedoutside the BCM-HGSC (to reduce bias) present in Rnor3.1 (91%),together with the assembled bases in main scaffolds (2.533 Gb,Table 2), we suggest a genome size of 2.75 Gb. Alternatively, analysisof the WGS oligomers of length 24 to 32 predicted a genome size ofbetween 2.76 and 2.81 billion bases. We have used the moreconservative value of 2.75 Gb for the rat genome size, but this is
Table 2 Statistics of the RGSP draft sequence assembly
Features* Number N50 length(kb)
Bases(Gb)
Bases plus gaps†(Gb)
Percentage of genome‡
Sampled (2.78 Gb) Assembled (2.75 Gb)...................................................................................................................................................................................................................................................................................................................................................................
Bases Bases þ gaps Bases Bases þ gapsAnchored contigs 127,810 38 2.476 2.481 89.1 89.2 90.0 90.2Anchored superbactig scaffolds 783 5,402 2.476 2.509 89.1 90.3 90.0 91.2Anchored ultrabactigs 291 18,985 2.476 2.687 89.1 96.6 90.0 97.7Unanchored superbactigs, main scaffolds 134 1,210 0.056 0.062 2.0 2.2 2.0 2.3Unanchored ultrabactigs 128 1,529 0.056 0.069 2.0 2.5 2.0 2.5All superbactigs, main scaffolds 917 5,301 2.533 2.571 91.1 92.5 92.1 93.5Minor scaffolds 4,345 8 0.033 0.038 1.2 1.4 1.2 1.4...................................................................................................................................................................................................................................................................................................................................................................
*Anchored sequences are those that can be placed on chromosomes because they contain known markers. The main scaffold for each superbactig is the largest set of contigs (in terms of total contigsequence) that can be ordered and oriented using mate-pair links and ordering of BACs. Scaffolds that cannot be ordered and oriented with respect to the main scaffold are termed minor scaffolds.†Ambiguous bases (N) are counted in the gap sizes, and excluded in the base counts.‡Computed as bases plus gaps divided by estimated genome size. Sampled genome size is based on oligonucleotide frequency statistics of unassembled WGS reads. Assembled genome size is based oncumulative contig sequence following assembly.
Figure 2 Map correspondence. Correspondence between positions of markers on two
genetic maps of the rat (SHRSP £ BN intercross and FHH £ ACI intercross61), on the rat
radiation hybrid map59, and their position on the rat genome assembly (Rnor3.1).
articles
NATURE | VOL 428 | 1 APRIL 2004 | www.nature.com/nature496 © 2004 Nature Publishing Group
still considerably higher (150 Mb) than the 2.6 Gb currentlyreported for the mouse draft genome sequence. A fraction of thesize differences in these rodent genomes results from the differentrepeat content (see below); however, it is also recognized thatsegmental duplications may be under-represented in the mouseWGS draft sequence for technical reasons3,51.
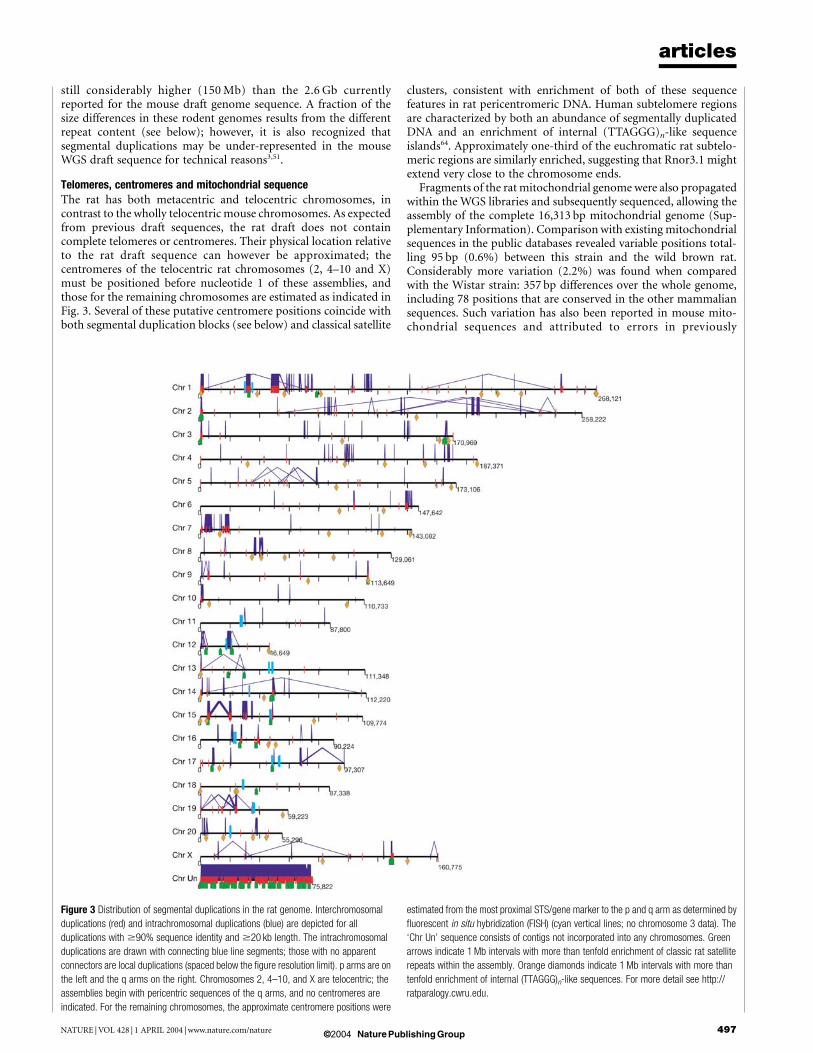
Telomeres, centromeres and mitochondrial sequenceThe rat has both metacentric and telocentric chromosomes, incontrast to the wholly telocentric mouse chromosomes. As expectedfrom previous draft sequences, the rat draft does not containcomplete telomeres or centromeres. Their physical location relativeto the rat draft sequence can however be approximated; thecentromeres of the telocentric rat chromosomes (2, 4–10 and X)must be positioned before nucleotide 1 of these assemblies, andthose for the remaining chromosomes are estimated as indicated inFig. 3. Several of these putative centromere positions coincide withboth segmental duplication blocks (see below) and classical satellite
clusters, consistent with enrichment of both of these sequencefeatures in rat pericentromeric DNA. Human subtelomere regionsare characterized by both an abundance of segmentally duplicatedDNA and an enrichment of internal (TTAGGG)n-like sequenceislands64. Approximately one-third of the euchromatic rat subtelo-meric regions are similarly enriched, suggesting that Rnor3.1 mightextend very close to the chromosome ends.
Fragments of the rat mitochondrial genome were also propagatedwithin the WGS libraries and subsequently sequenced, allowing theassembly of the complete 16,313 bp mitochondrial genome (Sup-plementary Information). Comparison with existing mitochondrialsequences in the public databases revealed variable positions total-ling 95 bp (0.6%) between this strain and the wild brown rat.Considerably more variation (2.2%) was found when comparedwith the Wistar strain: 357 bp differences over the whole genome,including 78 positions that are conserved in the other mammaliansequences. Such variation has also been reported in mouse mito-chondrial sequences and attributed to errors in previously
Figure 3 Distribution of segmental duplications in the rat genome. Interchromosomal
duplications (red) and intrachromosomal duplications (blue) are depicted for all
duplications with $90% sequence identity and $20 kb length. The intrachromosomal
duplications are drawn with connecting blue line segments; those with no apparent
connectors are local duplications (spaced below the figure resolution limit). p arms are on
the left and the q arms on the right. Chromosomes 2, 4–10, and X are telocentric; the
assemblies begin with pericentric sequences of the q arms, and no centromeres are
indicated. For the remaining chromosomes, the approximate centromere positions were
estimated from the most proximal STS/gene marker to the p and q arm as determined by
fluorescent in situ hybridization (FISH) (cyan vertical lines; no chromosome 3 data). The
‘Chr Un’ sequence consists of contigs not incorporated into any chromosomes. Green
arrows indicate 1 Mb intervals with more than tenfold enrichment of classic rat satellite
repeats within the assembly. Orange diamonds indicate 1 Mb intervals with more than
tenfold enrichment of internal (TTAGGG)n-like sequences. For more detail see http://
ratparalogy.cwru.edu.
articles
NATURE | VOL 428 | 1 APRIL 2004 | www.nature.com/nature 497© 2004 Nature Publishing Group
sequenced genomes65. The current sequence is very accurate, and wetherefore favour the BN sequence as a reference for the ratmitochondrial genome.
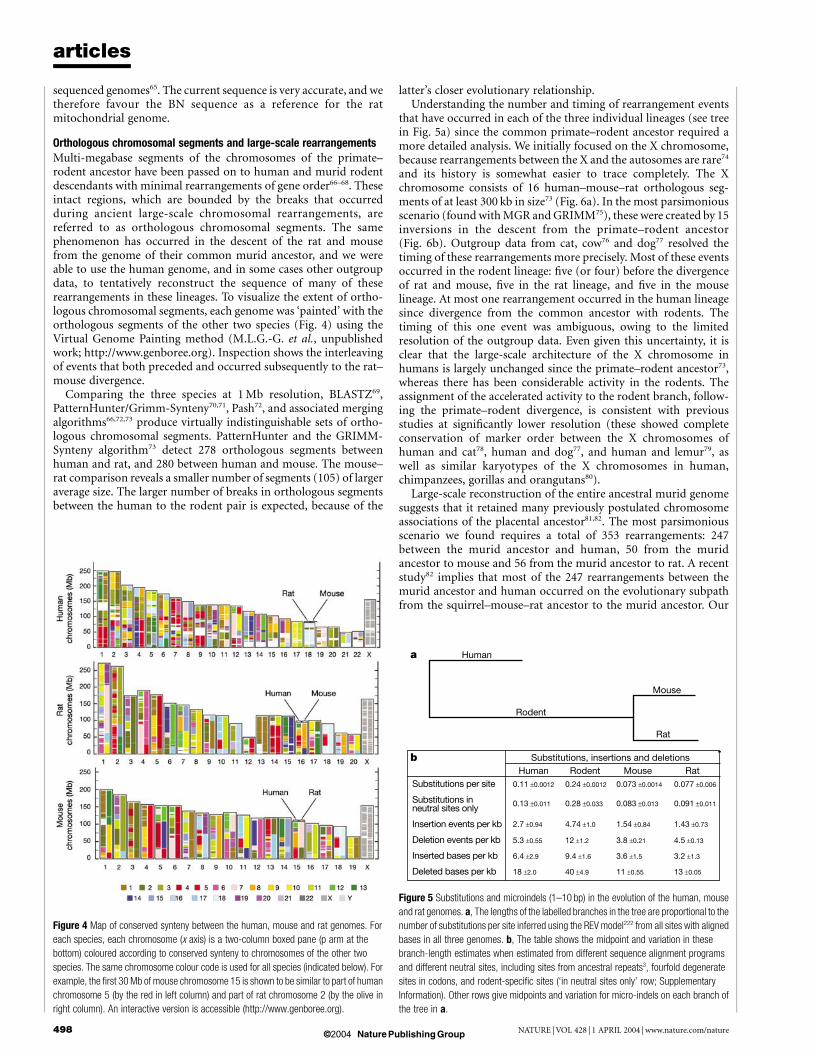
Orthologous chromosomal segments and large-scale rearrangementsMulti-megabase segments of the chromosomes of the primate–rodent ancestor have been passed on to human and murid rodentdescendants with minimal rearrangements of gene order66–68. Theseintact regions, which are bounded by the breaks that occurredduring ancient large-scale chromosomal rearrangements, arereferred to as orthologous chromosomal segments. The samephenomenon has occurred in the descent of the rat and mousefrom the genome of their common murid ancestor, and we wereable to use the human genome, and in some cases other outgroupdata, to tentatively reconstruct the sequence of many of theserearrangements in these lineages. To visualize the extent of ortho-logous chromosomal segments, each genome was ‘painted’ with theorthologous segments of the other two species (Fig. 4) using theVirtual Genome Painting method (M.L.G.-G. et al., unpublishedwork; http://www.genboree.org). Inspection shows the interleavingof events that both preceded and occurred subsequently to the rat–mouse divergence.
Comparing the three species at 1 Mb resolution, BLASTZ69,PatternHunter/Grimm-Synteny70,71, Pash72, and associated mergingalgorithms66,72,73 produce virtually indistinguishable sets of ortho-logous chromosomal segments. PatternHunter and the GRIMM-Synteny algorithm73 detect 278 orthologous segments betweenhuman and rat, and 280 between human and mouse. The mouse–rat comparison reveals a smaller number of segments (105) of largeraverage size. The larger number of breaks in orthologous segmentsbetween the human to the rodent pair is expected, because of the
latter’s closer evolutionary relationship.Understanding the number and timing of rearrangement events
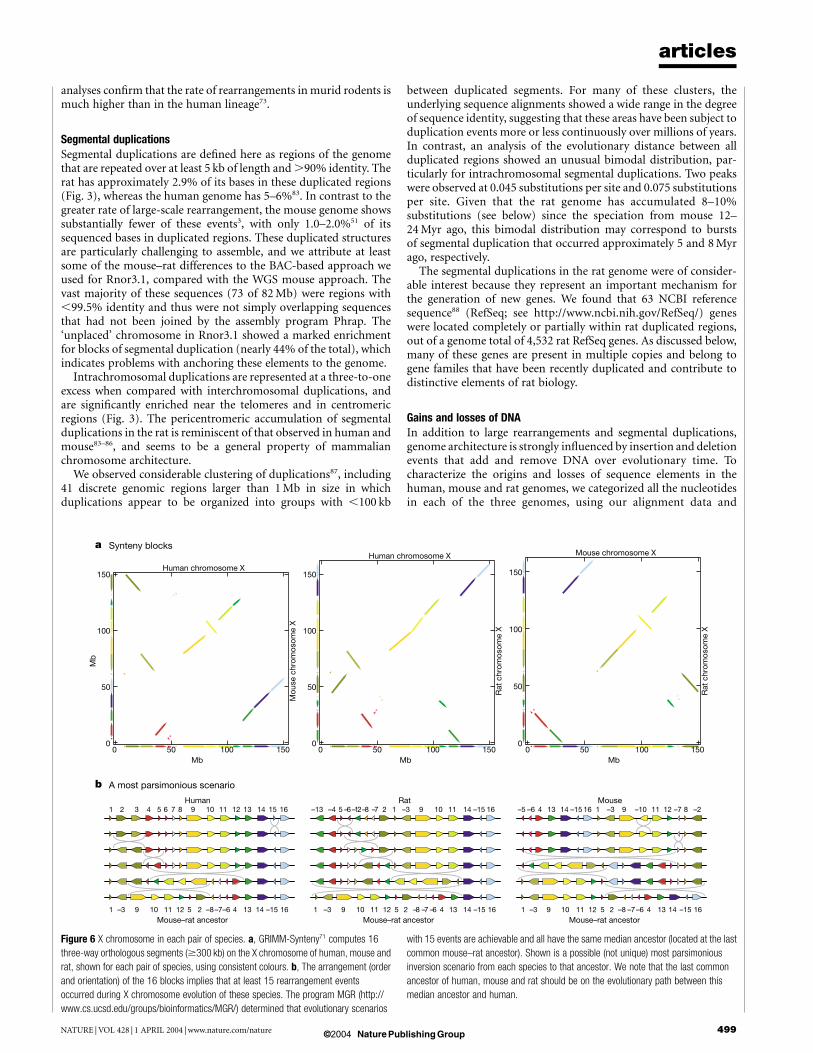
that have occurred in each of the three individual lineages (see treein Fig. 5a) since the common primate–rodent ancestor required amore detailed analysis. We initially focused on the X chromosome,because rearrangements between the X and the autosomes are rare74
and its history is somewhat easier to trace completely. The Xchromosome consists of 16 human–mouse–rat orthologous seg-ments of at least 300 kb in size73 (Fig. 6a). In the most parsimoniousscenario (found with MGR and GRIMM75), these were created by 15inversions in the descent from the primate–rodent ancestor(Fig. 6b). Outgroup data from cat, cow76 and dog77 resolved thetiming of these rearrangements more precisely. Most of these eventsoccurred in the rodent lineage: five (or four) before the divergenceof rat and mouse, five in the rat lineage, and five in the mouselineage. At most one rearrangement occurred in the human lineagesince divergence from the common ancestor with rodents. Thetiming of this one event was ambiguous, owing to the limitedresolution of the outgroup data. Even given this uncertainty, it isclear that the large-scale architecture of the X chromosome inhumans is largely unchanged since the primate–rodent ancestor73,whereas there has been considerable activity in the rodents. Theassignment of the accelerated activity to the rodent branch, follow-ing the primate–rodent divergence, is consistent with previousstudies at significantly lower resolution (these showed completeconservation of marker order between the X chromosomes ofhuman and cat78, human and dog77, and human and lemur79, aswell as similar karyotypes of the X chromosomes in human,chimpanzees, gorillas and orangutans80).
Large-scale reconstruction of the entire ancestral murid genomesuggests that it retained many previously postulated chromosomeassociations of the placental ancestor81,82. The most parsimoniousscenario we found requires a total of 353 rearrangements: 247between the murid ancestor and human, 50 from the muridancestor to mouse and 56 from the murid ancestor to rat. A recentstudy82 implies that most of the 247 rearrangements between themurid ancestor and human occurred on the evolutionary subpathfrom the squirrel–mouse–rat ancestor to the murid ancestor. Our
Figure 4 Map of conserved synteny between the human, mouse and rat genomes. For
each species, each chromosome (x axis) is a two-column boxed pane (p arm at the
bottom) coloured according to conserved synteny to chromosomes of the other two
species. The same chromosome colour code is used for all species (indicated below). For
example, the first 30 Mb of mouse chromosome 15 is shown to be similar to part of human
chromosome 5 (by the red in left column) and part of rat chromosome 2 (by the olive in
right column). An interactive version is accessible (http://www.genboree.org).
Figure 5 Substitutions and microindels (1–10 bp) in the evolution of the human, mouse
and rat genomes. a, The lengths of the labelled branches in the tree are proportional to the
number of substitutions per site inferred using the REV model222 from all sites with aligned
bases in all three genomes. b, The table shows the midpoint and variation in these
branch-length estimates when estimated from different sequence alignment programs
and different neutral sites, including sites from ancestral repeats3, fourfold degenerate
sites in codons, and rodent-specific sites (‘in neutral sites only’ row; Supplementary
Information). Other rows give midpoints and variation for micro-indels on each branch of
the tree in a.
articles
NATURE | VOL 428 | 1 APRIL 2004 | www.nature.com/nature498 © 2004 Nature Publishing Group
analyses confirm that the rate of rearrangements in murid rodents ismuch higher than in the human lineage73.
Segmental duplicationsSegmental duplications are defined here as regions of the genomethat are repeated over at least 5 kb of length and .90% identity. Therat has approximately 2.9% of its bases in these duplicated regions(Fig. 3), whereas the human genome has 5–6%83. In contrast to thegreater rate of large-scale rearrangement, the mouse genome showssubstantially fewer of these events3, with only 1.0–2.0%51 of itssequenced bases in duplicated regions. These duplicated structuresare particularly challenging to assemble, and we attribute at leastsome of the mouse–rat differences to the BAC-based approach weused for Rnor3.1, compared with the WGS mouse approach. Thevast majority of these sequences (73 of 82 Mb) were regions with,99.5% identity and thus were not simply overlapping sequencesthat had not been joined by the assembly program Phrap. The‘unplaced’ chromosome in Rnor3.1 showed a marked enrichmentfor blocks of segmental duplication (nearly 44% of the total), whichindicates problems with anchoring these elements to the genome.
Intrachromosomal duplications are represented at a three-to-oneexcess when compared with interchromosomal duplications, andare significantly enriched near the telomeres and in centromericregions (Fig. 3). The pericentromeric accumulation of segmentalduplications in the rat is reminiscent of that observed in human andmouse83–86, and seems to be a general property of mammalianchromosome architecture.
We observed considerable clustering of duplications87, including41 discrete genomic regions larger than 1 Mb in size in whichduplications appear to be organized into groups with ,100 kb
between duplicated segments. For many of these clusters, theunderlying sequence alignments showed a wide range in the degreeof sequence identity, suggesting that these areas have been subject toduplication events more or less continuously over millions of years.In contrast, an analysis of the evolutionary distance between allduplicated regions showed an unusual bimodal distribution, par-ticularly for intrachromosomal segmental duplications. Two peakswere observed at 0.045 substitutions per site and 0.075 substitutionsper site. Given that the rat genome has accumulated 8–10%substitutions (see below) since the speciation from mouse 12–24 Myr ago, this bimodal distribution may correspond to burstsof segmental duplication that occurred approximately 5 and 8 Myrago, respectively.
The segmental duplications in the rat genome were of consider-able interest because they represent an important mechanism forthe generation of new genes. We found that 63 NCBI referencesequence88 (RefSeq; see http://www.ncbi.nih.gov/RefSeq/) geneswere located completely or partially within rat duplicated regions,out of a genome total of 4,532 rat RefSeq genes. As discussed below,many of these genes are present in multiple copies and belong togene familes that have been recently duplicated and contribute todistinctive elements of rat biology.
Gains and losses of DNAIn addition to large rearrangements and segmental duplications,genome architecture is strongly influenced by insertion and deletionevents that add and remove DNA over evolutionary time. Tocharacterize the origins and losses of sequence elements in thehuman, mouse and rat genomes, we categorized all the nucleotidesin each of the three genomes, using our alignment data and
Figure 6 X chromosome in each pair of species. a, GRIMM-Synteny71 computes 16
three-way orthologous segments ($300 kb) on the X chromosome of human, mouse and
rat, shown for each pair of species, using consistent colours. b, The arrangement (order
and orientation) of the 16 blocks implies that at least 15 rearrangement events
occurred during X chromosome evolution of these species. The program MGR (http://
www.cs.ucsd.edu/groups/bioinformatics/MGR/) determined that evolutionary scenarios
with 15 events are achievable and all have the same median ancestor (located at the last
common mouse–rat ancestor). Shown is a possible (not unique) most parsimonious
inversion scenario from each species to that ancestor. We note that the last common
ancestor of human, mouse and rat should be on the evolutionary path between this
median ancestor and human.
articles
NATURE | VOL 428 | 1 APRIL 2004 | www.nature.com/nature 499© 2004 Nature Publishing Group
RepeatMasker annotations of the insertions of repetitive elements(Fig. 7). The rodent repeat database used by RepeatMasker wasgreatly expanded by analysing the rat and mouse genomes89, but it isclear that not all repeats are being recognized, especially the olderones. Thus, these estimates of the amount of rodent repeatsrepresent lower bounds.
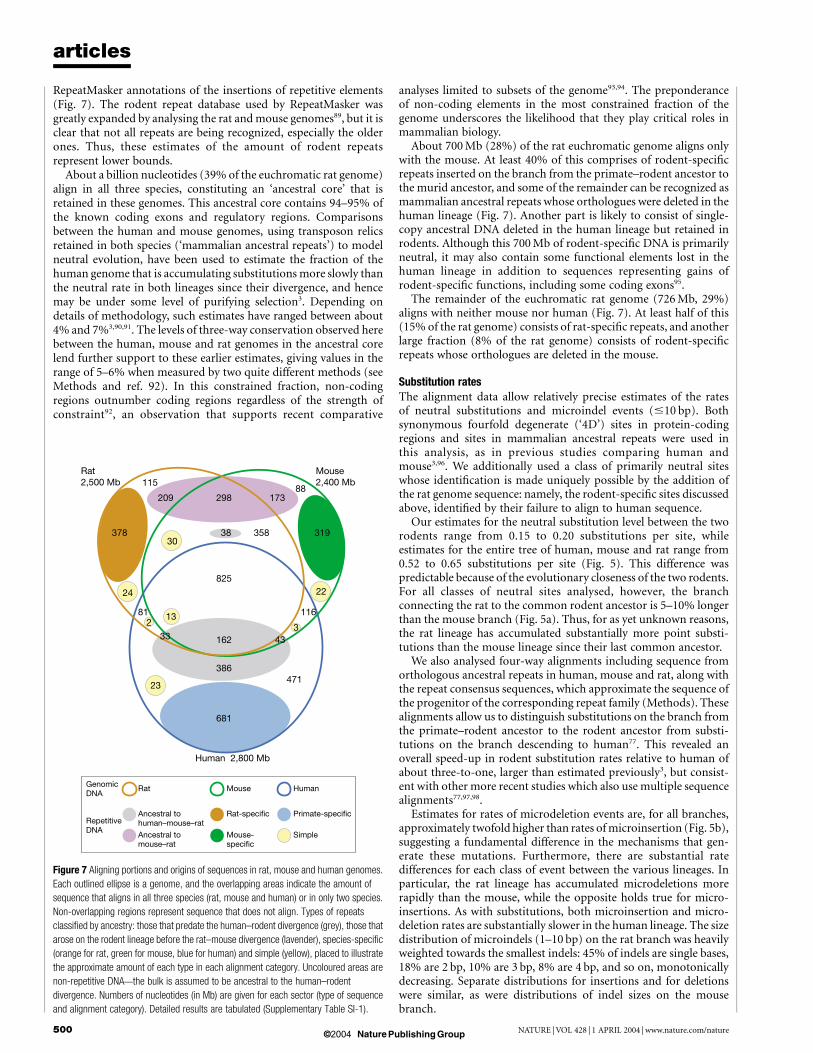
About a billion nucleotides (39% of the euchromatic rat genome)align in all three species, constituting an ‘ancestral core’ that isretained in these genomes. This ancestral core contains 94–95% ofthe known coding exons and regulatory regions. Comparisonsbetween the human and mouse genomes, using transposon relicsretained in both species (‘mammalian ancestral repeats’) to modelneutral evolution, have been used to estimate the fraction of thehuman genome that is accumulating substitutions more slowly thanthe neutral rate in both lineages since their divergence, and hencemay be under some level of purifying selection3. Depending ondetails of methodology, such estimates have ranged between about4% and 7%3,90,91. The levels of three-way conservation observed herebetween the human, mouse and rat genomes in the ancestral corelend further support to these earlier estimates, giving values in therange of 5–6% when measured by two quite different methods (seeMethods and ref. 92). In this constrained fraction, non-codingregions outnumber coding regions regardless of the strength ofconstraint92, an observation that supports recent comparative
analyses limited to subsets of the genome93,94. The preponderanceof non-coding elements in the most constrained fraction of thegenome underscores the likelihood that they play critical roles inmammalian biology.
About 700 Mb (28%) of the rat euchromatic genome aligns onlywith the mouse. At least 40% of this comprises of rodent-specificrepeats inserted on the branch from the primate–rodent ancestor tothe murid ancestor, and some of the remainder can be recognized asmammalian ancestral repeats whose orthologues were deleted in thehuman lineage (Fig. 7). Another part is likely to consist of single-copy ancestral DNA deleted in the human lineage but retained inrodents. Although this 700 Mb of rodent-specific DNA is primarilyneutral, it may also contain some functional elements lost in thehuman lineage in addition to sequences representing gains ofrodent-specific functions, including some coding exons95.
The remainder of the euchromatic rat genome (726 Mb, 29%)aligns with neither mouse nor human (Fig. 7). At least half of this(15% of the rat genome) consists of rat-specific repeats, and anotherlarge fraction (8% of the rat genome) consists of rodent-specificrepeats whose orthologues are deleted in the mouse.
Substitution ratesThe alignment data allow relatively precise estimates of the ratesof neutral substitutions and microindel events (#10 bp). Bothsynonymous fourfold degenerate (‘4D’) sites in protein-codingregions and sites in mammalian ancestral repeats were used inthis analysis, as in previous studies comparing human andmouse3,96. We additionally used a class of primarily neutral siteswhose identification is made uniquely possible by the addition ofthe rat genome sequence: namely, the rodent-specific sites discussedabove, identified by their failure to align to human sequence.
Our estimates for the neutral substitution level between the tworodents range from 0.15 to 0.20 substitutions per site, whileestimates for the entire tree of human, mouse and rat range from0.52 to 0.65 substitutions per site (Fig. 5). This difference waspredictable because of the evolutionary closeness of the two rodents.For all classes of neutral sites analysed, however, the branchconnecting the rat to the common rodent ancestor is 5–10% longerthan the mouse branch (Fig. 5a). Thus, for as yet unknown reasons,the rat lineage has accumulated substantially more point substi-tutions than the mouse lineage since their last common ancestor.
We also analysed four-way alignments including sequence fromorthologous ancestral repeats in human, mouse and rat, along withthe repeat consensus sequences, which approximate the sequence ofthe progenitor of the corresponding repeat family (Methods). Thesealignments allow us to distinguish substitutions on the branch fromthe primate–rodent ancestor to the rodent ancestor from substi-tutions on the branch descending to human77. This revealed anoverall speed-up in rodent substitution rates relative to human ofabout three-to-one, larger than estimated previously3, but consist-ent with other more recent studies which also use multiple sequencealignments77,97,98.
Estimates for rates of microdeletion events are, for all branches,approximately twofold higher than rates of microinsertion (Fig. 5b),suggesting a fundamental difference in the mechanisms that gen-erate these mutations. Furthermore, there are substantial ratedifferences for each class of event between the various lineages. Inparticular, the rat lineage has accumulated microdeletions morerapidly than the mouse, while the opposite holds true for micro-insertions. As with substitutions, both microinsertion and micro-deletion rates are substantially slower in the human lineage. The sizedistribution of microindels (1–10 bp) on the rat branch was heavilyweighted towards the smallest indels: 45% of indels are single bases,18% are 2 bp, 10% are 3 bp, 8% are 4 bp, and so on, monotonicallydecreasing. Separate distributions for insertions and for deletionswere similar, as were distributions of indel sizes on the mousebranch.
Figure 7 Aligning portions and origins of sequences in rat, mouse and human genomes.
Each outlined ellipse is a genome, and the overlapping areas indicate the amount of
sequence that aligns in all three species (rat, mouse and human) or in only two species.
Non-overlapping regions represent sequence that does not align. Types of repeats
classified by ancestry: those that predate the human–rodent divergence (grey), those that
arose on the rodent lineage before the rat–mouse divergence (lavender), species-specific
(orange for rat, green for mouse, blue for human) and simple (yellow), placed to illustrate
the approximate amount of each type in each alignment category. Uncoloured areas are
non-repetitive DNA—the bulk is assumed to be ancestral to the human–rodent
divergence. Numbers of nucleotides (in Mb) are given for each sector (type of sequence
and alignment category). Detailed results are tabulated (Supplementary Table SI-1).
articles
NATURE | VOL 428 | 1 APRIL 2004 | www.nature.com/nature500 © 2004 Nature Publishing Group
Male mutation biasAs mouse and rat are similar in generation time and number ofgermline cell divisions99,100, we investigated a potential sex bias indifferent types of observed genome changes. We compared substi-tution and indel rates between the X chromosome and autosomes inancestral repeat sites (,5 Mb and ,100 Mb in total for X andautosomes, respectively101). We discovered that in rodents, smallindels (,50 bp) are male-biased, with a male-to-female rate ratio of,2.3. This is in contrast to a recent study in primates, based on asubstantially smaller data set, that indicates no sex bias in smallindels102. Our male-to-female nucleotide substitution rate ratio inrodents is ,1.9, confirming earlier reports103,104. When substitutionrates are compared for all sites aligned between mouse and rat(,78 Mb and ,1,691 Mb, respectively), we again observe anapproximately twofold excess of small indels and nucleotide sub-stitutions originating in males compared with females101. Interest-ingly, the ratio in the number of cell divisions between the male andfemale germlines is also about two99,100, suggesting that thesesubstitutions may arise from mutations that occur primarily duringDNA replication.
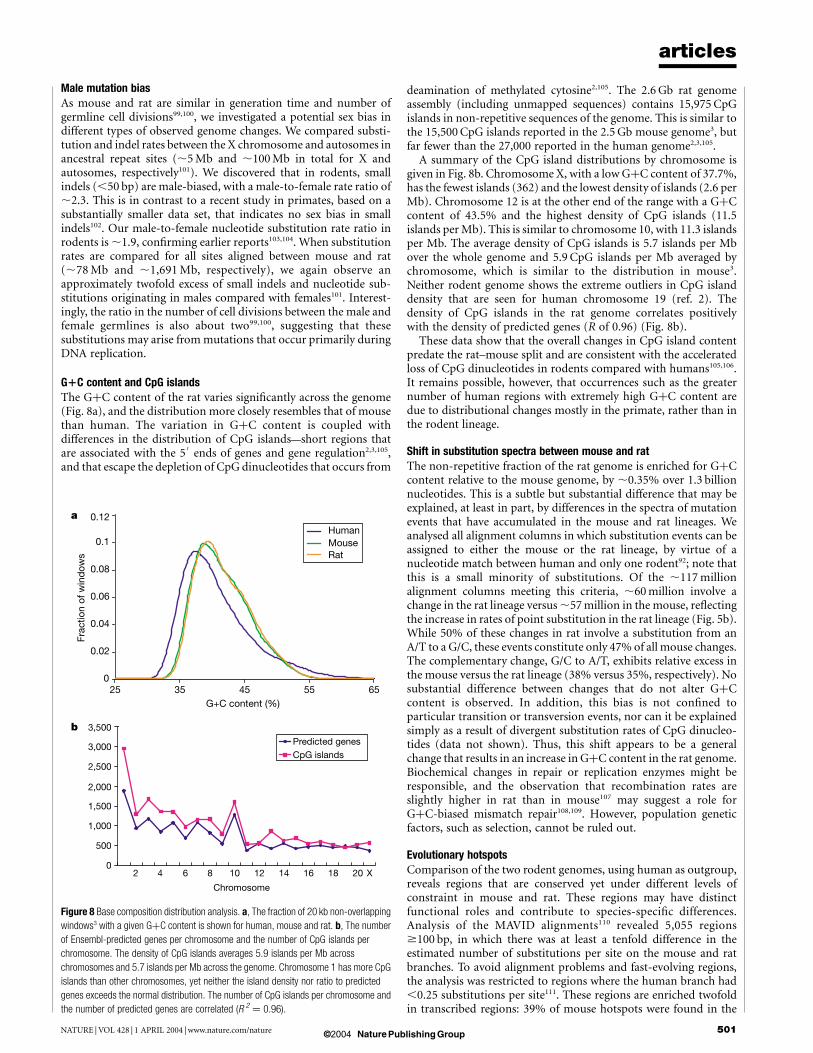
G1C content and CpG islandsThe GþC content of the rat varies significantly across the genome(Fig. 8a), and the distribution more closely resembles that of mousethan human. The variation in GþC content is coupled withdifferences in the distribution of CpG islands—short regions thatare associated with the 5
0ends of genes and gene regulation2,3,105,
and that escape the depletion of CpG dinucleotides that occurs from
deamination of methylated cytosine2,105. The 2.6 Gb rat genomeassembly (including unmapped sequences) contains 15,975 CpGislands in non-repetitive sequences of the genome. This is similar tothe 15,500 CpG islands reported in the 2.5 Gb mouse genome3, butfar fewer than the 27,000 reported in the human genome2,3,105.
A summary of the CpG island distributions by chromosome isgiven in Fig. 8b. Chromosome X, with a low GþC content of 37.7%,has the fewest islands (362) and the lowest density of islands (2.6 perMb). Chromosome 12 is at the other end of the range with a GþCcontent of 43.5% and the highest density of CpG islands (11.5islands per Mb). This is similar to chromosome 10, with 11.3 islandsper Mb. The average density of CpG islands is 5.7 islands per Mbover the whole genome and 5.9 CpG islands per Mb averaged bychromosome, which is similar to the distribution in mouse3.Neither rodent genome shows the extreme outliers in CpG islanddensity that are seen for human chromosome 19 (ref. 2). Thedensity of CpG islands in the rat genome correlates positivelywith the density of predicted genes (R of 0.96) (Fig. 8b).
These data show that the overall changes in CpG island contentpredate the rat–mouse split and are consistent with the acceleratedloss of CpG dinucleotides in rodents compared with humans105,106.It remains possible, however, that occurrences such as the greaternumber of human regions with extremely high GþC content aredue to distributional changes mostly in the primate, rather than inthe rodent lineage.
Shift in substitution spectra between mouse and ratThe non-repetitive fraction of the rat genome is enriched for GþCcontent relative to the mouse genome, by ,0.35% over 1.3 billionnucleotides. This is a subtle but substantial difference that may beexplained, at least in part, by differences in the spectra of mutationevents that have accumulated in the mouse and rat lineages. Weanalysed all alignment columns in which substitution events can beassigned to either the mouse or the rat lineage, by virtue of anucleotide match between human and only one rodent92; note thatthis is a small minority of substitutions. Of the ,117 millionalignment columns meeting this criteria, ,60 million involve achange in the rat lineage versus ,57 million in the mouse, reflectingthe increase in rates of point substitution in the rat lineage (Fig. 5b).While 50% of these changes in rat involve a substitution from anA/T to a G/C, these events constitute only 47% of all mouse changes.The complementary change, G/C to A/T, exhibits relative excess inthe mouse versus the rat lineage (38% versus 35%, respectively). Nosubstantial difference between changes that do not alter GþCcontent is observed. In addition, this bias is not confined toparticular transition or transversion events, nor can it be explainedsimply as a result of divergent substitution rates of CpG dinucleo-tides (data not shown). Thus, this shift appears to be a generalchange that results in an increase in GþC content in the rat genome.Biochemical changes in repair or replication enzymes might beresponsible, and the observation that recombination rates areslightly higher in rat than in mouse107 may suggest a role forGþC-biased mismatch repair108,109. However, population geneticfactors, such as selection, cannot be ruled out.
Evolutionary hotspotsComparison of the two rodent genomes, using human as outgroup,reveals regions that are conserved yet under different levels ofconstraint in mouse and rat. These regions may have distinctfunctional roles and contribute to species-specific differences.Analysis of the MAVID alignments110 revealed 5,055 regions$100 bp, in which there was at least a tenfold difference in theestimated number of substitutions per site on the mouse and ratbranches. To avoid alignment problems and fast-evolving regions,the analysis was restricted to regions where the human branch had,0.25 substitutions per site111. These regions are enriched twofoldin transcribed regions: 39% of mouse hotspots were found in the
Figure 8 Base composition distribution analysis. a, The fraction of 20 kb non-overlapping
windows3 with a given GþC content is shown for human, mouse and rat. b, The number
of Ensembl-predicted genes per chromosome and the number of CpG islands per
chromosome. The density of CpG islands averages 5.9 islands per Mb across
chromosomes and 5.7 islands per Mb across the genome. Chromosome 1 has more CpG
islands than other chromosomes, yet neither the island density nor ratio to predicted
genes exceeds the normal distribution. The number of CpG islands per chromosome and
the number of predicted genes are correlated (R 2 ¼ 0.96).
articles
NATURE | VOL 428 | 1 APRIL 2004 | www.nature.com/nature 501© 2004 Nature Publishing Group
18% of the mouse genome covered by RefSeq genes; and 17% of therat hotspots were found in the 8% of the rat genome covered byRefSeq genes. Similar numbers are observed when examiningcoding exon and EST regions (not shown). Half of all hotspots inthe mouse genome lie totally in non-coding regions. Many hotspotsare several hundred bases long, with average length 190 ^ 86 bp.Future work aimed at identifying the genomic differences thatcontribute to phenotypic evolution may benefit from analysessuch as these, which will become more powerful as the repertoireof mammalian genome sequences expands.
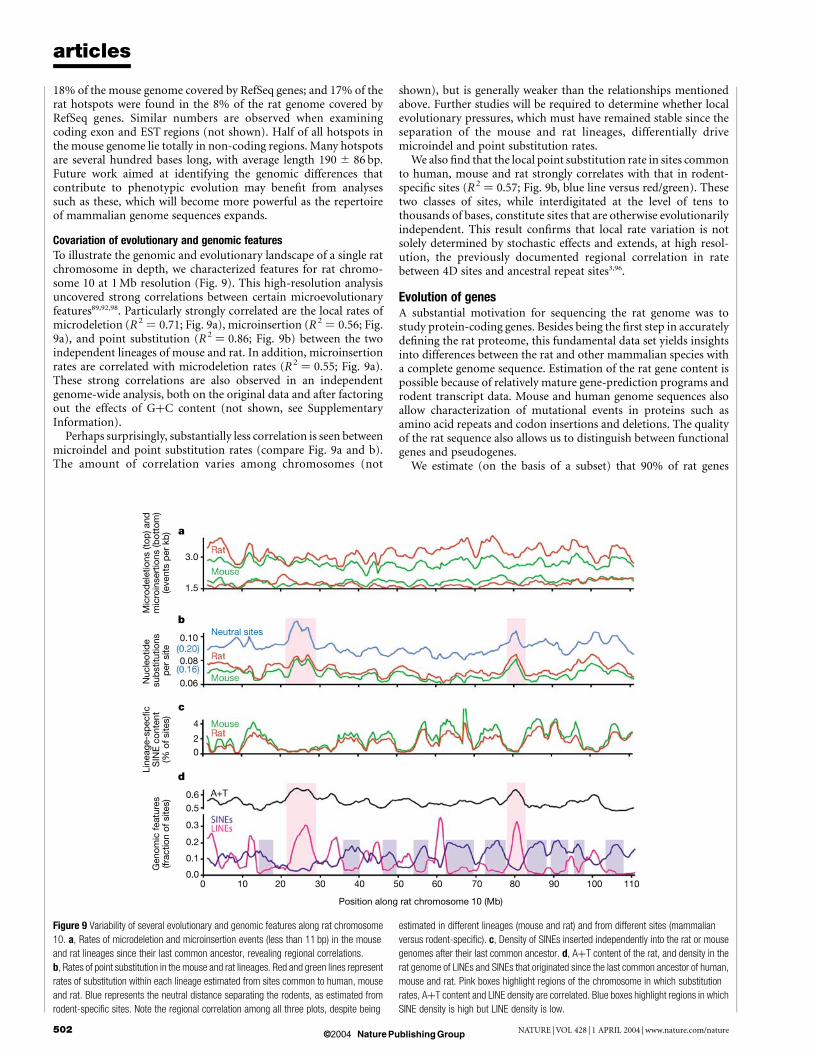
Covariation of evolutionary and genomic featuresTo illustrate the genomic and evolutionary landscape of a single ratchromosome in depth, we characterized features for rat chromo-some 10 at 1 Mb resolution (Fig. 9). This high-resolution analysisuncovered strong correlations between certain microevolutionaryfeatures89,92,98. Particularly strongly correlated are the local rates ofmicrodeletion (R2 ¼ 0.71; Fig. 9a), microinsertion (R2 ¼ 0.56; Fig.9a), and point substitution (R2 ¼ 0.86; Fig. 9b) between the twoindependent lineages of mouse and rat. In addition, microinsertionrates are correlated with microdeletion rates (R2 ¼ 0.55; Fig. 9a).These strong correlations are also observed in an independentgenome-wide analysis, both on the original data and after factoringout the effects of GþC content (not shown, see SupplementaryInformation).
Perhaps surprisingly, substantially less correlation is seen betweenmicroindel and point substitution rates (compare Fig. 9a and b).The amount of correlation varies among chromosomes (not
shown), but is generally weaker than the relationships mentionedabove. Further studies will be required to determine whether localevolutionary pressures, which must have remained stable since theseparation of the mouse and rat lineages, differentially drivemicroindel and point substitution rates.
We also find that the local point substitution rate in sites commonto human, mouse and rat strongly correlates with that in rodent-specific sites (R2 ¼ 0.57; Fig. 9b, blue line versus red/green). Thesetwo classes of sites, while interdigitated at the level of tens tothousands of bases, constitute sites that are otherwise evolutionarilyindependent. This result confirms that local rate variation is notsolely determined by stochastic effects and extends, at high resol-ution, the previously documented regional correlation in ratebetween 4D sites and ancestral repeat sites3,96.
Evolution of genesA substantial motivation for sequencing the rat genome was tostudy protein-coding genes. Besides being the first step in accuratelydefining the rat proteome, this fundamental data set yields insightsinto differences between the rat and other mammalian species witha complete genome sequence. Estimation of the rat gene content ispossible because of relatively mature gene-prediction programs androdent transcript data. Mouse and human genome sequences alsoallow characterization of mutational events in proteins such asamino acid repeats and codon insertions and deletions. The qualityof the rat sequence also allows us to distinguish between functionalgenes and pseudogenes.
We estimate (on the basis of a subset) that 90% of rat genes
Figure 9 Variability of several evolutionary and genomic features along rat chromosome
10. a, Rates of microdeletion and microinsertion events (less than 11 bp) in the mouse
and rat lineages since their last common ancestor, revealing regional correlations.
b, Rates of point substitution in the mouse and rat lineages. Red and green lines represent
rates of substitution within each lineage estimated from sites common to human, mouse
and rat. Blue represents the neutral distance separating the rodents, as estimated from
rodent-specific sites. Note the regional correlation among all three plots, despite being
estimated in different lineages (mouse and rat) and from different sites (mammalian
versus rodent-specific). c, Density of SINEs inserted independently into the rat or mouse
genomes after their last common ancestor. d, AþT content of the rat, and density in the
rat genome of LINEs and SINEs that originated since the last common ancestor of human,
mouse and rat. Pink boxes highlight regions of the chromosome in which substitution
rates, AþT content and LINE density are correlated. Blue boxes highlight regions in which
SINE density is high but LINE density is low.
articles
NATURE | VOL 428 | 1 APRIL 2004 | www.nature.com/nature502 © 2004 Nature Publishing Group
possess strict orthologues in both mouse and human genomes. Ourstudies also identified genes arising from recent duplication eventsoccurring only in rat, and not in mouse or human. These genescontribute characteristic features of rat-specific biology, includingaspects of reproduction, immunity and toxin metabolism. Bycontrast, almost all human ‘disease genes’ have rat orthologues.This emphasizes the importance of the rat as a model organism inexperimental science.
Construction of gene set and determination of orthologyThe Ensembl gene prediction pipeline112 predicted 20,973 geneswith 28,516 transcripts and 205,623 exons (Methods). These genescontain an average of 9.7 exons, with a median exon number of6.0. At least 20% of the genes are alternatively spliced, with anaverage of 1.3 transcripts predicted per gene. Of the 17% single exontranscripts, 1,355 contain frameshifts relative to the predictedprotein and 1,176 are probably processed pseudogenes. Of the28,516 transcripts, 48% have both 5
0and 3
0untranslated regions
(UTRs) predicted and 60% have at least one UTR predicted.These gene predictions considered homology to other sequences,
including 26,949 rodent proteins, 4,861 non-rodent, vertebrateproteins, 7,121 rat complementary DNAs from RefSeq and EMBL,and 31,545 mouse cDNAs from Riken, RefSeq and EMBL. Themajority (61%) of transcripts are supported by rodent transcriptevidence. When combined with additional private EST data, thefraction of genes supported by transcript evidence could beincreased to 72%113.
A number of other ab initio (GENSCAN114, GENEID115), simi-larity-based (FGENESHþþ; ref. 116) and comparative (SGP117,SLAM118, TWINSCAN1119–121) gene-prediction programs were usedto analyse the rat genome. The number of genes predicted by theseprograms ranged from 24,500 to 47,000, suggesting coding densitiesranging from 1.2% to 2.2%. The coding fraction of RefSeq genescovered by these predictions ranged from 82% to 98%. Suchcomparative ab initio programs using the rat genome were success-fully used to identify and experimentally verify genes missed byother methods in rat121 and human122. The predictions of theseprograms can be accessed through the UCSC genome browser andEnsembl websites.
RefSeq genes (20,091 human, 11,342 mouse and 4,488 rat)mapped onto genome assemblies with BLAT123 and the UCSCbrowser revealed that the number of coding exons per gene andaverage exon length were similar in the three species. Differenceswere observed in intron length, with an average of 5,338 bp inhuman, 4,212 bp in mouse and 5,002 bp in rat. These differenceswere also found in a smaller collection of 6,352 confidently mappedorthologous intron triads (see ‘Conservation of intronic splicesignals’ section below): average intron lengths in this collectionwere 4,240 bp in human, 3,565 bp in mouse and 3,638 bp in rat.
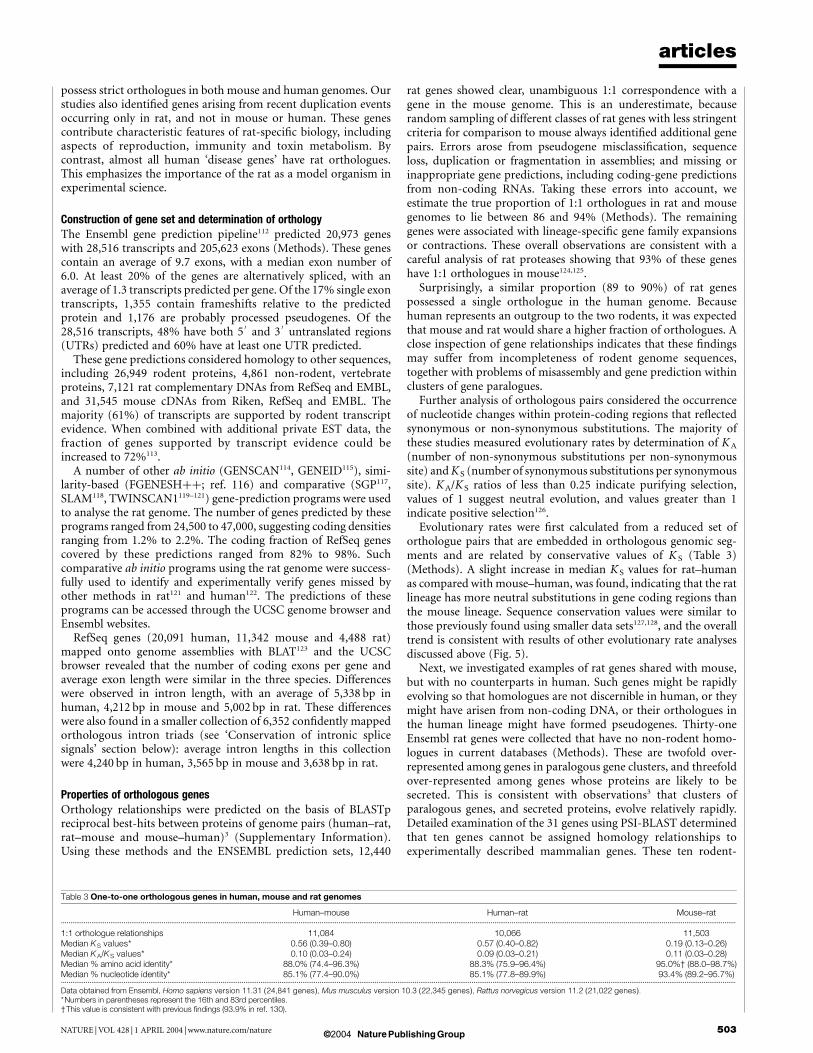
Properties of orthologous genesOrthology relationships were predicted on the basis of BLASTpreciprocal best-hits between proteins of genome pairs (human–rat,rat–mouse and mouse–human)3 (Supplementary Information).Using these methods and the ENSEMBL prediction sets, 12,440
rat genes showed clear, unambiguous 1:1 correspondence with agene in the mouse genome. This is an underestimate, becauserandom sampling of different classes of rat genes with less stringentcriteria for comparison to mouse always identified additional genepairs. Errors arose from pseudogene misclassification, sequenceloss, duplication or fragmentation in assemblies; and missing orinappropriate gene predictions, including coding-gene predictionsfrom non-coding RNAs. Taking these errors into account, weestimate the true proportion of 1:1 orthologues in rat and mousegenomes to lie between 86 and 94% (Methods). The remaininggenes were associated with lineage-specific gene family expansionsor contractions. These overall observations are consistent with acareful analysis of rat proteases showing that 93% of these geneshave 1:1 orthologues in mouse124,125.
Surprisingly, a similar proportion (89 to 90%) of rat genespossessed a single orthologue in the human genome. Becausehuman represents an outgroup to the two rodents, it was expectedthat mouse and rat would share a higher fraction of orthologues. Aclose inspection of gene relationships indicates that these findingsmay suffer from incompleteness of rodent genome sequences,together with problems of misassembly and gene prediction withinclusters of gene paralogues.
Further analysis of orthologous pairs considered the occurrenceof nucleotide changes within protein-coding regions that reflectedsynonymous or non-synonymous substitutions. The majority ofthese studies measured evolutionary rates by determination of KA
(number of non-synonymous substitutions per non-synonymoussite) and KS (number of synonymous substitutions per synonymoussite). KA/KS ratios of less than 0.25 indicate purifying selection,values of 1 suggest neutral evolution, and values greater than 1indicate positive selection126.
Evolutionary rates were first calculated from a reduced set oforthologue pairs that are embedded in orthologous genomic seg-ments and are related by conservative values of K S (Table 3)(Methods). A slight increase in median K S values for rat–humanas compared with mouse–human, was found, indicating that the ratlineage has more neutral substitutions in gene coding regions thanthe mouse lineage. Sequence conservation values were similar tothose previously found using smaller data sets127,128, and the overalltrend is consistent with results of other evolutionary rate analysesdiscussed above (Fig. 5).
Next, we investigated examples of rat genes shared with mouse,but with no counterparts in human. Such genes might be rapidlyevolving so that homologues are not discernible in human, or theymight have arisen from non-coding DNA, or their orthologues inthe human lineage might have formed pseudogenes. Thirty-oneEnsembl rat genes were collected that have no non-rodent homo-logues in current databases (Methods). These are twofold over-represented among genes in paralogous gene clusters, and threefoldover-represented among genes whose proteins are likely to besecreted. This is consistent with observations3 that clusters ofparalogous genes, and secreted proteins, evolve relatively rapidly.Detailed examination of the 31 genes using PSI-BLAST determinedthat ten genes cannot be assigned homology relationships toexperimentally described mammalian genes. These ten rodent-
Table 3 One-to-one orthologous genes in human, mouse and rat genomes
Human–mouse Human–rat Mouse–rat...................................................................................................................................................................................................................................................................................................................................................................
1:1 orthologue relationships 11,084 10,066 11,503Median KS values* 0.56 (0.39–0.80) 0.57 (0.40–0.82) 0.19 (0.13–0.26)Median KA/KS values* 0.10 (0.03–0.24) 0.09 (0.03–0.21) 0.11 (0.03–0.28)Median % amino acid identity* 88.0% (74.4–96.3%) 88.3% (75.9–96.4%) 95.0%† (88.0–98.7%)Median % nucleotide identity* 85.1% (77.4–90.0%) 85.1% (77.8–89.9%) 93.4% (89.2–95.7%)...................................................................................................................................................................................................................................................................................................................................................................
Data obtained from Ensembl, Homo sapiens version 11.31 (24,841 genes), Mus musculus version 10.3 (22,345 genes), Rattus norvegicus version 11.2 (21,022 genes).*Numbers in parentheses represent the 16th and 83rd percentiles.†This value is consistent with previous findings (93.9% in ref. 130).
articles
NATURE | VOL 428 | 1 APRIL 2004 | www.nature.com/nature 503© 2004 Nature Publishing Group
specific genes may have evolved particularly rapidly, or have non-coding DNA homologues, or be erroneous predictions.
The paucity of rodent-specific genes indicates that de novoinvention of complete genes in rodents is rare. This is not unex-pected, because the majority of eukaryotic protein-coding genes aremodular structures containing coding and non-coding exons, spli-cing signals and regulatory sequences, and the chances of indepen-dent evolution and successful assembly of these elements into afunctional gene are small, given the relatively short evolutionarytime available since the mouse–rat split. However, individualrodent-specific exons may arise more frequently, particularly ifthe exon is alternatively spliced129. Applying a K A/K S ratiotest130,131 to sequences that align only between rat and mouse, weidentified 2,302 potential novel rodent-specific exons, with ESTsupport, in BLASTZ alignments of rat and mouse sequences. Noneof these individual exons matched human transcripts, but approxi-mately half (1,116) appear to be present in alternative splice formsfound in rodents. We speculate that these exons contain the fewsuccessful lineage-specific survivors of the constant process of geneevolution, by birth and death of individual exons.
Indels and repeats in protein-coding sequencesIn contrast to small indels occurring in the bulk of the genome(above), indels within protein-coding regions are probably lethal, ordeleterious and so are rapidly removed from the population bypurifying selection. Indel rates within rat coding sequences were 50-fold lower than in bulk genomic DNA132. The whole genome excessof deletions compared with insertions (Fig. 5b) was also evident incoding sequences. The magnitude was less, with a genome-widedeletion-to-insertion ratio of 3.1:1 reducing to 1.7:1 in the rat. Inmouse this value reduced from 2.5:1 to 1.1:1 (ref. 132). These datasuggest that deletions are ,16% more likely than insertions to beremoved from coding sequences by selection.
Owing to the triplet nature of the genetic code, indels of multiplesof three nucleotides in length (3n indels) are less likely to bedeleterious. Direct comparison of 3n indel rates between bulkDNA (0.77 indels per kb for mouse, 0.83 indels per kb for rat)and coding sequence (0.087 indels per kb for mouse and 0.084indel per kb for rat) showed that 3n indels were ninefold under-represented in coding sequences. At least 44% of indels wereduplicative insertion or deletion of a tandemly duplicated sequence,collectively termed sequence slippage132. Sequence slippage con-tributed approximately equally to observed insertions and del-etions. The overall excess of deletions could be attributedspecifically to an excess of non-slippage deletion over non-slippageinsertion in both mouse and rat lineages132. Of the slippage indels,13% were in the context of trinucleotide repeats (n . 2, excludingthe inserted or deleted sequence) which are known to be particularlyprone to sequence slippage and encode homopolymeric amino acidtracts133,134.
To gain better understanding of dynamic changes in the length ofhomopolymeric amino acid tracts on gene evolution and diseasesusceptibility, we searched for other characteristics of amino acidrepeat variation by analysing all size-five or longer amino acidrepeats in a data set of 7,039 rat, mouse and human orthologousprotein sequences135. Most species-specific amino acid repeats (80–90%) were found in indel regions, and regions encoding species-specific repeats were more likely to contain tandem trinucleotiderepeats than those encoding conserved repeats. This was consistentwith the involvement of slippage in the generation of novel repeatsin proteins and extended previous observations for glutaminerepeats in a more limited human–mouse data set136.
The percentage of proteins containing amino acid repeats was13.7% in rat, 14.9% in mouse and 17.6% in human135. The mostfrequently occurring tandem amino acid repeats were glutamic acid,proline, alanine, leucine, serine, glycine, glutamine and lysine.Using the same threshold size cut-off, tandem trinucleotide repeats
were significantly more abundant in human than in rodent codingsequences, in striking contrast to the frequencies observed in bulkgenomic sequences (29 trinucleotide repeats per Mb in rat, 32repeats per Mb in mouse and 13 repeats per Mb in human, seediscussion of the general simple repeat structure below). Theconservation of human repeats was higher in mouse (52%) thanin rat (46.5%), suggesting a higher rate of repeat loss in the ratlineage than the mouse lineage.
Functional consequences of these in-frame changes in rat, mouseand human were investigated132 through clustering of proteinsbased on annotation of function and cellular localization112, andmapping indels onto protein structural and sequence features. Therate that indels accumulated in secreted (3.9 £ 1024 indels peramino acid) and nuclear (4.0 £ 1024) proteins is approximatelytwice that of cytoplasmic (2.4 £ 1024) and mitochondrial(1.4 £ 1024) proteins. Likewise, ligand-binding proteins acquireindels (3.1 £ 1024) at a higher rate than enzymes (2.1 £ 1024)132.These trends exactly mirror those observed for amino acid substi-tution rates3, suggesting tight coupling of selective constraintsbetween indels and substitutions. Transcription regulators showedthe highest rate of indels (4.3 £ 1024), a finding that may relate tothe over-representation of homopolymorphic amino acid tracts inthese proteins135.
Known protein domains exhibited 3.3-fold fewer indels thanexpected by chance, again paralleling nucleotide substitution ratedifferences between domains and non-domain sequences3. Ofthe protein-sequence and structural categories considered (trans-membrane, protein domain, signal peptide, coiled coil and lowcomplexity), the transmembrane regions were the most refractoryto accumulating indels, exhibiting a sixfold reduction comparedwith that expected by chance. Low-complexity regions were 3.1-foldenriched, reflecting their relatively unstructured nature and enrich-ment in indel-prone trinucleotide repeats. Mapping of indels ontogroups of known structures revealed that indels are 21% more likelyto be tolerated in loop regions than the structural core of theprotein132.
We observed that indel frequency and amino acid repeat occur-rence both correlated positively with the G þ C coding sequencecontent of the local sequence environment132,135. This may beexplained in part by the correlation of polymerase slippage-pronetrinucleotide repeat sequences and G þ C content135. There is also apositive correlation between CpG dinucleotide frequency and cod-ing sequence insertions, but not deletions. This effect diminishesrapidly with increasing distance from the site of the insertion132.
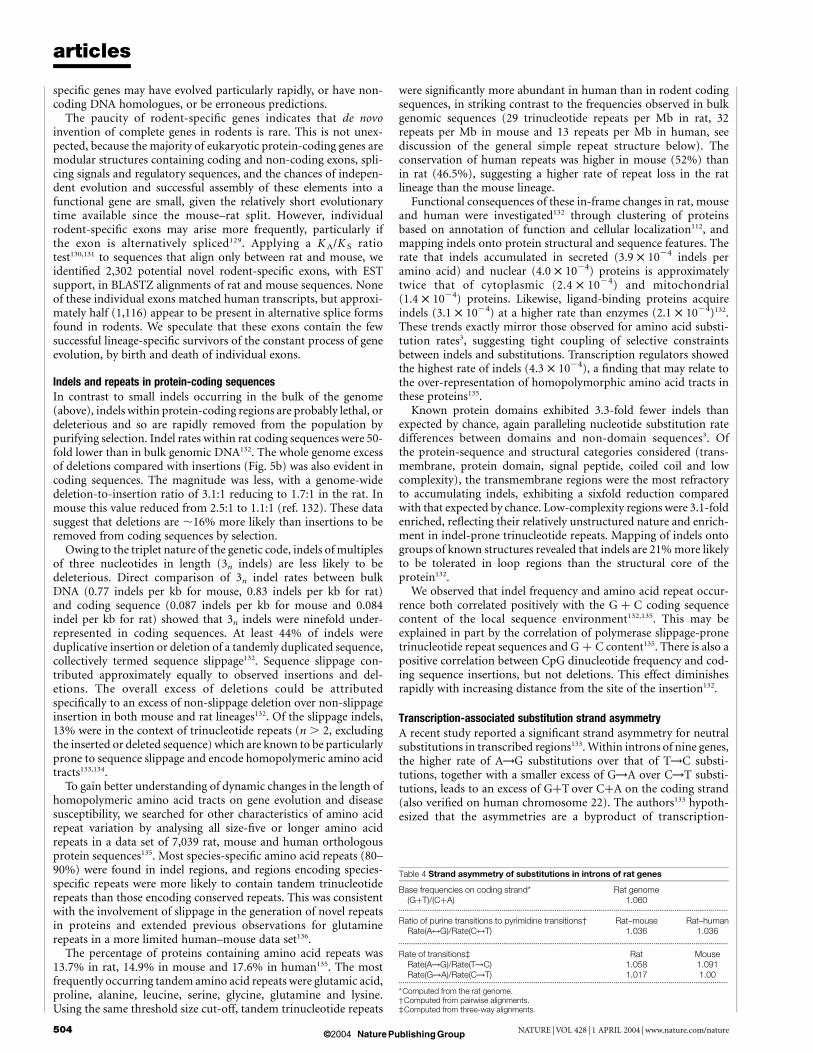
Transcription-associated substitution strand asymmetryA recent study reported a significant strand asymmetry for neutralsubstitutions in transcribed regions133. Within introns of nine genes,the higher rate of A!G substitutions over that of T!C substi-tutions, together with a smaller excess of G!A over C!T substi-tutions, leads to an excess of GþT over CþA on the coding strand(also verified on human chromosome 22). The authors133 hypoth-esized that the asymmetries are a byproduct of transcription-
Table 4 Strand asymmetry of substitutions in introns of rat genes
Base frequencies on coding strand* Rat genome(GþT)/(CþA) 1.060
.............................................................................................................................................................................
Ratio of purine transitions to pyrimidine transitions† Rat–mouse Rat–humanRate(A$G)/Rate(C$T) 1.036 1.036
.............................................................................................................................................................................
Rate of transitions‡ Rat MouseRate(A!G)/Rate(T!C) 1.058 1.091Rate(G!A)/Rate(C!T) 1.017 1.00
.............................................................................................................................................................................
*Computed from the rat genome.†Computed from pairwise alignments.‡Computed from three-way alignments.
articles
NATURE | VOL 428 | 1 APRIL 2004 | www.nature.com/nature504 © 2004 Nature Publishing Group
coupled repair in germline cells. Examining the three-way align-ments of rat, mouse and human, we verified that the strandasymmetries for neutral substitutions exist in introns across thegenome (Table 4).
Under the assumption of independence of sequence positions,large sample normal approximations to the binomial distributionallow us to test whether the fraction of GþT exceeds 0.5, andwhether the rate at the numerator exceeds the rate at the denomi-nator for each of the ratios in Table 4. With the large amount of dataprovided by pooling introns genome-wide, the tests are all highlysignificant (P values , 1024), except for the rate of G!Ain mouse, which does not significantly exceed that of C!T(P value ¼ 0.6369). These asymmetries are also seen if the studyis limited to ancestral repeat sites, excludes ancestral repeat sites,excludes CpG dinucleotides, is limited to positions flanked by sitesthat are identical in the aligned sequences (in the case of obser-vations 2 and 3 in Table 4), or considers introns of RefSeq genes forhuman or mouse. Thus it appears that strand asymmetry ofsubstitution events within transcribed regions of the genome is arobust genome-wide phenomenon.
Conservation of intronic splice signalsUsing 6,352 human–mouse–rat orthologous introns from 976 genes(Methods), we examined the dynamics of evolution of consensussplice signals in mammalian genes. We found that intron class137 isextremely well conserved: we did not observe any U2 to U12 intronconversion, or vice versa, nor within U12 introns did we find anyswitching between the major AT–AC and GT–AG subtypes,although such events are documented at larger evolutionary dis-tances137. In contrast, conversions between canonical GT–AG andnon-canonical GC–AG subtypes of U2 introns are not uncommon.Only ,70% of GC–AG introns are conserved between human andmouse/rat, and only 90% are conserved between mouse and rat.Using human as the outgroup, we detected nine GT to GC conver-sions after divergence of mouse and rat (from 6,282 introns thatwere likely to have been GT–AG before human and rodents split),and two GC to GT conversions (from 34 GC–AG introns thatprobably predated the human and rodent split). These results givesome indication of the degree to which mutation from T to C istolerated in donor sites. The GC donor site appears to be bettertolerated in introns with very strong donor sites, because in theseintrons the proportion of GC donor sites is ,11%, much higherthan the 0.7% overall frequency of GC donor sites in U2 introns.Although we found a variety of other non-canonical configurationsin U2 introns, very few are conserved, which suggests thatmost correspond to transient, evolutionarily unstable states,pseudogenes, or mis-annotations.
Gene duplicationsDuplication of genomic segments represents a frequent and robustmechanism for generating new genes138. Because there were nocompelling data showing rat-specific genes arising directly fromnon-coding sequences, we examined gene duplications to measuretheir potential contribution to rat-specific biology. A previous studyshowed that gene clusters in mouse without counterparts in humanare subject to rapid, adaptive evolution3,139. We used two methods toidentify recent gene duplications: methods that directly identifiedparalogous clusters, and methods that analysed genomic segmentalduplications (see above).
Using the first approach, we found 784 rat paralogue clusterscontaining 3,089 genes (Methods). This was lower than in mouse(910 clusters/3,784 genes), but the difference probably reflects thelarger number of gene predictions from the mouse assembly.
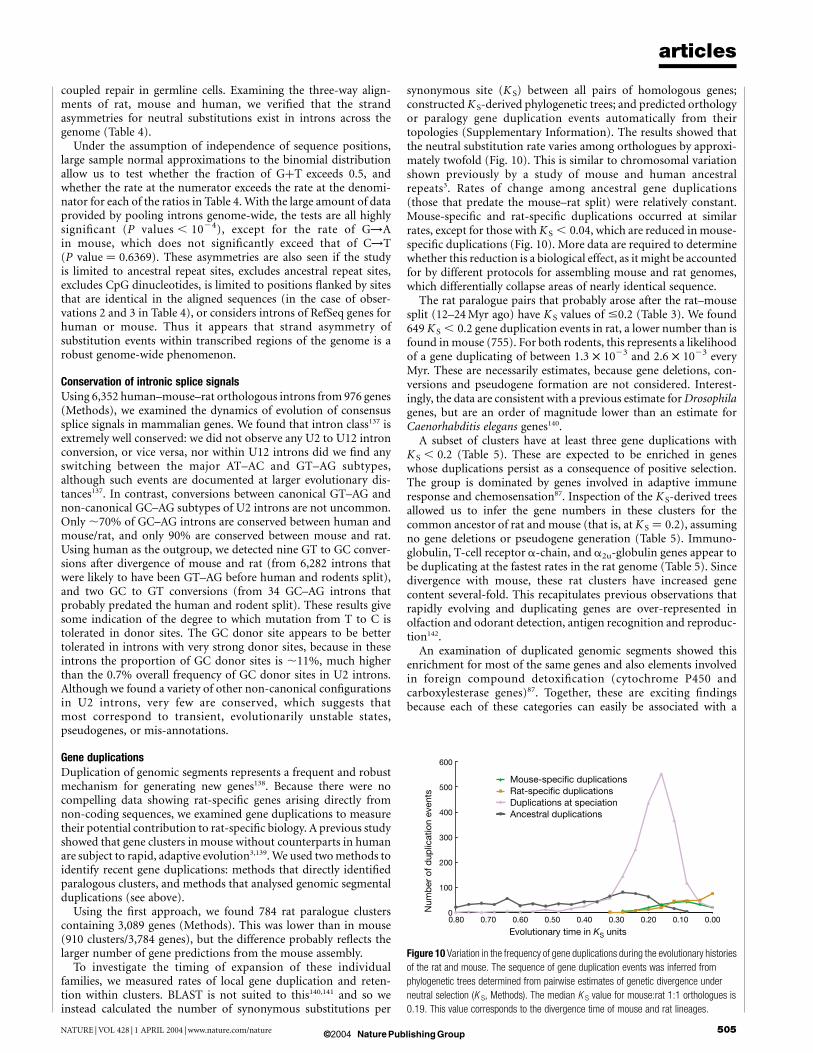
To investigate the timing of expansion of these individualfamilies, we measured rates of local gene duplication and reten-tion within clusters. BLAST is not suited to this140,141 and so weinstead calculated the number of synonymous substitutions per
synonymous site (K S) between all pairs of homologous genes;constructed K S-derived phylogenetic trees; and predicted orthologyor paralogy gene duplication events automatically from theirtopologies (Supplementary Information). The results showed thatthe neutral substitution rate varies among orthologues by approxi-mately twofold (Fig. 10). This is similar to chromosomal variationshown previously by a study of mouse and human ancestralrepeats3. Rates of change among ancestral gene duplications(those that predate the mouse–rat split) were relatively constant.Mouse-specific and rat-specific duplications occurred at similarrates, except for those with K S , 0.04, which are reduced in mouse-specific duplications (Fig. 10). More data are required to determinewhether this reduction is a biological effect, as it might be accountedfor by different protocols for assembling mouse and rat genomes,which differentially collapse areas of nearly identical sequence.
The rat paralogue pairs that probably arose after the rat–mousesplit (12–24 Myr ago) have K S values of #0.2 (Table 3). We found649 K S , 0.2 gene duplication events in rat, a lower number than isfound in mouse (755). For both rodents, this represents a likelihoodof a gene duplicating of between 1.3 £ 1023 and 2.6 £ 1023 everyMyr. These are necessarily estimates, because gene deletions, con-versions and pseudogene formation are not considered. Interest-ingly, the data are consistent with a previous estimate for Drosophilagenes, but are an order of magnitude lower than an estimate forCaenorhabditis elegans genes140.
A subset of clusters have at least three gene duplications withK S , 0.2 (Table 5). These are expected to be enriched in geneswhose duplications persist as a consequence of positive selection.The group is dominated by genes involved in adaptive immuneresponse and chemosensation87. Inspection of the K S-derived treesallowed us to infer the gene numbers in these clusters for thecommon ancestor of rat and mouse (that is, at K S ¼ 0.2), assumingno gene deletions or pseudogene generation (Table 5). Immuno-globulin, T-cell receptor a-chain, and a2u-globulin genes appear tobe duplicating at the fastest rates in the rat genome (Table 5). Sincedivergence with mouse, these rat clusters have increased genecontent several-fold. This recapitulates previous observations thatrapidly evolving and duplicating genes are over-represented inolfaction and odorant detection, antigen recognition and reproduc-tion142.
An examination of duplicated genomic segments showed thisenrichment for most of the same genes and also elements involvedin foreign compound detoxification (cytochrome P450 andcarboxylesterase genes)87. Together, these are exciting findingsbecause each of these categories can easily be associated with a
Figure 10 Variation in the frequency of gene duplications during the evolutionary histories
of the rat and mouse. The sequence of gene duplication events was inferred from
phylogenetic trees determined from pairwise estimates of genetic divergence under
neutral selection (K S, Methods). The median K S value for mouse:rat 1:1 orthologues is
0.19. This value corresponds to the divergence time of mouse and rat lineages.
articles
NATURE | VOL 428 | 1 APRIL 2004 | www.nature.com/nature 505© 2004 Nature Publishing Group
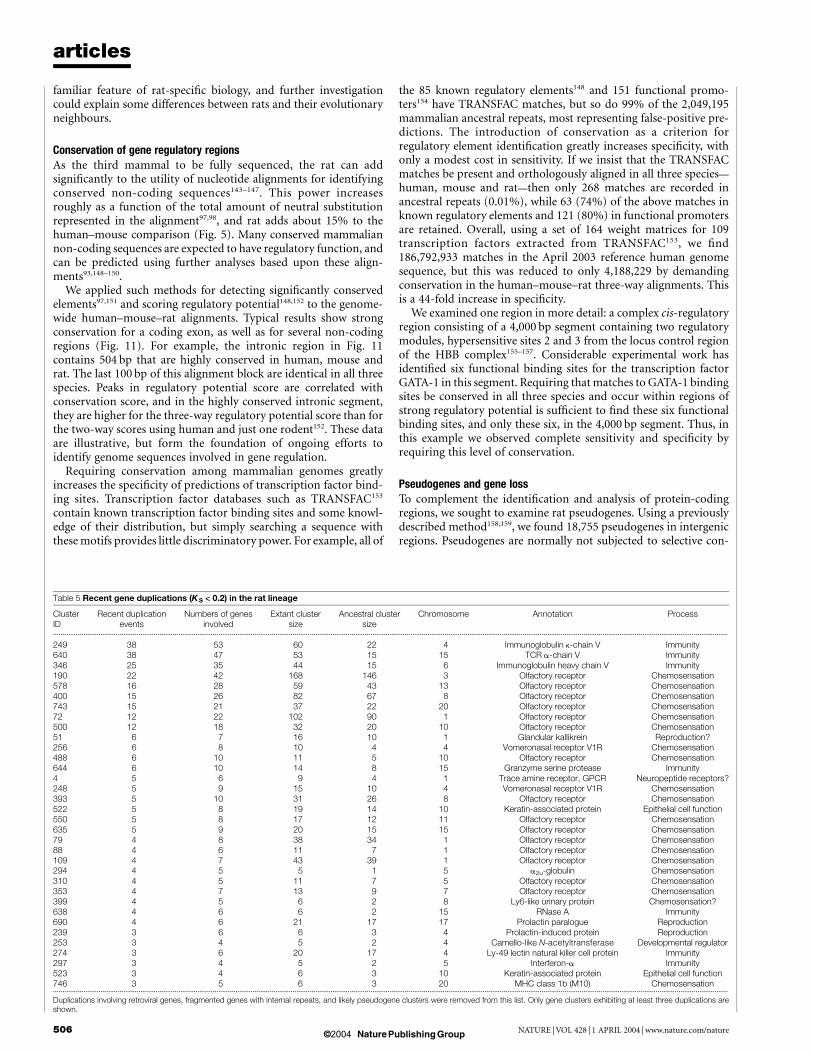
familiar feature of rat-specific biology, and further investigationcould explain some differences between rats and their evolutionaryneighbours.
Conservation of gene regulatory regionsAs the third mammal to be fully sequenced, the rat can addsignificantly to the utility of nucleotide alignments for identifyingconserved non-coding sequences143–147. This power increasesroughly as a function of the total amount of neutral substitutionrepresented in the alignment97,98, and rat adds about 15% to thehuman–mouse comparison (Fig. 5). Many conserved mammaliannon-coding sequences are expected to have regulatory function, andcan be predicted using further analyses based upon these align-ments93,148–150.
We applied such methods for detecting significantly conservedelements97,151 and scoring regulatory potential148,152 to the genome-wide human–mouse–rat alignments. Typical results show strongconservation for a coding exon, as well as for several non-codingregions (Fig. 11). For example, the intronic region in Fig. 11contains 504 bp that are highly conserved in human, mouse andrat. The last 100 bp of this alignment block are identical in all threespecies. Peaks in regulatory potential score are correlated withconservation score, and in the highly conserved intronic segment,they are higher for the three-way regulatory potential score than forthe two-way scores using human and just one rodent152. These dataare illustrative, but form the foundation of ongoing efforts toidentify genome sequences involved in gene regulation.
Requiring conservation among mammalian genomes greatlyincreases the specificity of predictions of transcription factor bind-ing sites. Transcription factor databases such as TRANSFAC153
contain known transcription factor binding sites and some knowl-edge of their distribution, but simply searching a sequence withthese motifs provides little discriminatory power. For example, all of
the 85 known regulatory elements148 and 151 functional promo-ters154 have TRANSFAC matches, but so do 99% of the 2,049,195mammalian ancestral repeats, most representing false-positive pre-dictions. The introduction of conservation as a criterion forregulatory element identification greatly increases specificity, withonly a modest cost in sensitivity. If we insist that the TRANSFACmatches be present and orthologously aligned in all three species—human, mouse and rat—then only 268 matches are recorded inancestral repeats (0.01%), while 63 (74%) of the above matches inknown regulatory elements and 121 (80%) in functional promotersare retained. Overall, using a set of 164 weight matrices for 109transcription factors extracted from TRANSFAC153, we find186,792,933 matches in the April 2003 reference human genomesequence, but this was reduced to only 4,188,229 by demandingconservation in the human–mouse–rat three-way alignments. Thisis a 44-fold increase in specificity.
We examined one region in more detail: a complex cis-regulatoryregion consisting of a 4,000 bp segment containing two regulatorymodules, hypersensitive sites 2 and 3 from the locus control regionof the HBB complex155–157. Considerable experimental work hasidentified six functional binding sites for the transcription factorGATA-1 in this segment. Requiring that matches to GATA-1 bindingsites be conserved in all three species and occur within regions ofstrong regulatory potential is sufficient to find these six functionalbinding sites, and only these six, in the 4,000 bp segment. Thus, inthis example we observed complete sensitivity and specificity byrequiring this level of conservation.
Pseudogenes and gene lossTo complement the identification and analysis of protein-codingregions, we sought to examine rat pseudogenes. Using a previouslydescribed method158,159, we found 18,755 pseudogenes in intergenicregions. Pseudogenes are normally not subjected to selective con-
Table 5 Recent gene duplications (KS < 0.2) in the rat lineage
ClusterID
Recent duplicationevents
Numbers of genesinvolved
Extant clustersize
Ancestral clustersize
Chromosome Annotation Process
...................................................................................................................................................................................................................................................................................................................................................................
249 38 53 60 22 4 Immunoglobulin k-chain V Immunity640 38 47 53 15 15 TCR a-chain V Immunity346 25 35 44 15 6 Immunoglobulin heavy chain V Immunity190 22 42 168 146 3 Olfactory receptor Chemosensation578 16 28 59 43 13 Olfactory receptor Chemosensation400 15 26 82 67 8 Olfactory receptor Chemosensation743 15 21 37 22 20 Olfactory receptor Chemosensation72 12 22 102 90 1 Olfactory receptor Chemosensation500 12 18 32 20 10 Olfactory receptor Chemosensation51 6 7 16 10 1 Glandular kallikrein Reproduction?256 6 8 10 4 4 Vomeronasal receptor V1R Chemosensation488 6 10 11 5 10 Olfactory receptor Chemosensation644 6 10 14 8 15 Granzyme serine protease Immunity4 5 6 9 4 1 Trace amine receptor, GPCR Neuropeptide receptors?248 5 9 15 10 4 Vomeronasal receptor V1R Chemosensation393 5 10 31 26 8 Olfactory receptor Chemosensation522 5 8 19 14 10 Keratin-associated protein Epithelial cell function550 5 8 17 12 11 Olfactory receptor Chemosensation635 5 9 20 15 15 Olfactory receptor Chemosensation79 4 8 38 34 1 Olfactory receptor Chemosensation88 4 6 11 7 1 Olfactory receptor Chemosensation109 4 7 43 39 1 Olfactory receptor Chemosensation294 4 5 5 1 5 a2u-globulin Chemosensation310 4 5 11 7 5 Olfactory receptor Chemosensation353 4 7 13 9 7 Olfactory receptor Chemosensation399 4 5 6 2 8 Ly6-like urinary protein Chemosensation?638 4 6 6 2 15 RNase A Immunity690 4 6 21 17 17 Prolactin paralogue Reproduction239 3 6 6 3 4 Prolactin-induced protein Reproduction253 3 4 5 2 4 Camello-like N-acetyltransferase Developmental regulator274 3 6 20 17 4 Ly-49 lectin natural killer cell protein Immunity297 3 4 5 2 5 Interferon-a Immunity523 3 4 6 3 10 Keratin-associated protein Epithelial cell function746 3 5 6 3 20 MHC class 1b (M10) Chemosensation...................................................................................................................................................................................................................................................................................................................................................................
Duplications involving retroviral genes, fragmented genes with internal repeats, and likely pseudogene clusters were removed from this list. Only gene clusters exhibiting at least three duplications areshown.
articles
NATURE | VOL 428 | 1 APRIL 2004 | www.nature.com/nature506 © 2004 Nature Publishing Group
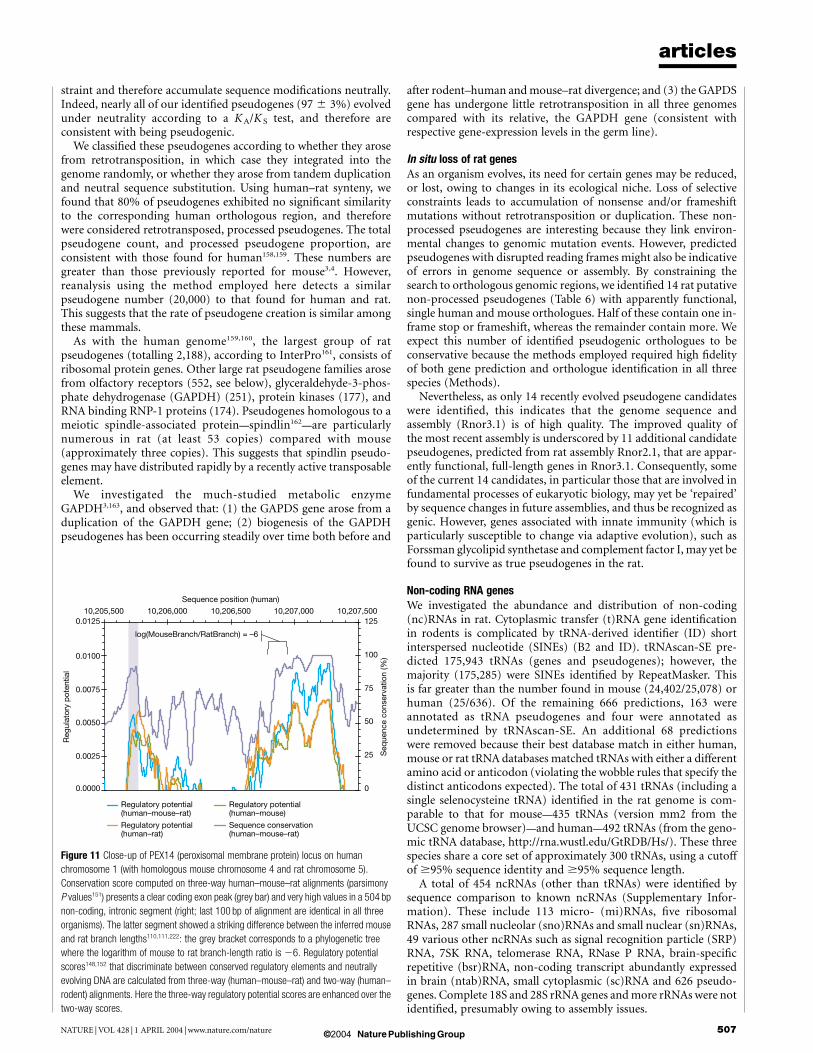
straint and therefore accumulate sequence modifications neutrally.Indeed, nearly all of our identified pseudogenes (97 ^ 3%) evolvedunder neutrality according to a KA/K S test, and therefore areconsistent with being pseudogenic.
We classified these pseudogenes according to whether they arosefrom retrotransposition, in which case they integrated into thegenome randomly, or whether they arose from tandem duplicationand neutral sequence substitution. Using human–rat synteny, wefound that 80% of pseudogenes exhibited no significant similarityto the corresponding human orthologous region, and thereforewere considered retrotransposed, processed pseudogenes. The totalpseudogene count, and processed pseudogene proportion, areconsistent with those found for human158,159. These numbers aregreater than those previously reported for mouse3,4. However,reanalysis using the method employed here detects a similarpseudogene number (20,000) to that found for human and rat.This suggests that the rate of pseudogene creation is similar amongthese mammals.
As with the human genome159,160, the largest group of ratpseudogenes (totalling 2,188), according to InterPro161, consists ofribosomal protein genes. Other large rat pseudogene families arosefrom olfactory receptors (552, see below), glyceraldehyde-3-phos-phate dehydrogenase (GAPDH) (251), protein kinases (177), andRNA binding RNP-1 proteins (174). Pseudogenes homologous to ameiotic spindle-associated protein—spindlin162—are particularlynumerous in rat (at least 53 copies) compared with mouse(approximately three copies). This suggests that spindlin pseudo-genes may have distributed rapidly by a recently active transposableelement.
We investigated the much-studied metabolic enzymeGAPDH3,163, and observed that: (1) the GAPDS gene arose from aduplication of the GAPDH gene; (2) biogenesis of the GAPDHpseudogenes has been occurring steadily over time both before and
after rodent–human and mouse–rat divergence; and (3) the GAPDSgene has undergone little retrotransposition in all three genomescompared with its relative, the GAPDH gene (consistent withrespective gene-expression levels in the germ line).
In situ loss of rat genesAs an organism evolves, its need for certain genes may be reduced,or lost, owing to changes in its ecological niche. Loss of selectiveconstraints leads to accumulation of nonsense and/or frameshiftmutations without retrotransposition or duplication. These non-processed pseudogenes are interesting because they link environ-mental changes to genomic mutation events. However, predictedpseudogenes with disrupted reading frames might also be indicativeof errors in genome sequence or assembly. By constraining thesearch to orthologous genomic regions, we identified 14 rat putativenon-processed pseudogenes (Table 6) with apparently functional,single human and mouse orthologues. Half of these contain one in-frame stop or frameshift, whereas the remainder contain more. Weexpect this number of identified pseudogenic orthologues to beconservative because the methods employed required high fidelityof both gene prediction and orthologue identification in all threespecies (Methods).
Nevertheless, as only 14 recently evolved pseudogene candidateswere identified, this indicates that the genome sequence andassembly (Rnor3.1) is of high quality. The improved quality ofthe most recent assembly is underscored by 11 additional candidatepseudogenes, predicted from rat assembly Rnor2.1, that are appar-ently functional, full-length genes in Rnor3.1. Consequently, someof the current 14 candidates, in particular those that are involved infundamental processes of eukaryotic biology, may yet be ‘repaired’by sequence changes in future assemblies, and thus be recognized asgenic. However, genes associated with innate immunity (which isparticularly susceptible to change via adaptive evolution), such asForssman glycolipid synthetase and complement factor I, may yet befound to survive as true pseudogenes in the rat.
Non-coding RNA genesWe investigated the abundance and distribution of non-coding(nc)RNAs in rat. Cytoplasmic transfer (t)RNA gene identificationin rodents is complicated by tRNA-derived identifier (ID) shortinterspersed nucleotide (SINEs) (B2 and ID). tRNAscan-SE pre-dicted 175,943 tRNAs (genes and pseudogenes); however, themajority (175,285) were SINEs identified by RepeatMasker. Thisis far greater than the number found in mouse (24,402/25,078) orhuman (25/636). Of the remaining 666 predictions, 163 wereannotated as tRNA pseudogenes and four were annotated asundetermined by tRNAscan-SE. An additional 68 predictionswere removed because their best database match in either human,mouse or rat tRNA databases matched tRNAs with either a differentamino acid or anticodon (violating the wobble rules that specify thedistinct anticodons expected). The total of 431 tRNAs (including asingle selenocysteine tRNA) identified in the rat genome is com-parable to that for mouse—435 tRNAs (version mm2 from theUCSC genome browser)—and human—492 tRNAs (from the geno-mic tRNA database, http://rna.wustl.edu/GtRDB/Hs/). These threespecies share a core set of approximately 300 tRNAs, using a cutoffof $95% sequence identity and $95% sequence length.
A total of 454 ncRNAs (other than tRNAs) were identified bysequence comparison to known ncRNAs (Supplementary Infor-mation). These include 113 micro- (mi)RNAs, five ribosomalRNAs, 287 small nucleolar (sno)RNAs and small nuclear (sn)RNAs,49 various other ncRNAs such as signal recognition particle (SRP)RNA, 7SK RNA, telomerase RNA, RNase P RNA, brain-specificrepetitive (bsr)RNA, non-coding transcript abundantly expressedin brain (ntab)RNA, small cytoplasmic (sc)RNA and 626 pseudo-genes. Complete 18S and 28S rRNA genes and more rRNAs were notidentified, presumably owing to assembly issues.
Figure 11 Close-up of PEX14 (peroxisomal membrane protein) locus on human
chromosome 1 (with homologous mouse chromosome 4 and rat chromosome 5).
Conservation score computed on three-way human–mouse–rat alignments (parsimony
P values151) presents a clear coding exon peak (grey bar) and very high values in a 504 bp
non-coding, intronic segment (right; last 100 bp of alignment are identical in all three
organisms). The latter segment showed a striking difference between the inferred mouse
and rat branch lengths110,111,222: the grey bracket corresponds to a phylogenetic tree
where the logarithm of mouse to rat branch-length ratio is 26. Regulatory potential
scores148,152 that discriminate between conserved regulatory elements and neutrally
evolving DNA are calculated from three-way (human–mouse–rat) and two-way (human–
rodent) alignments. Here the three-way regulatory potential scores are enhanced over the
two-way scores.
articles
NATURE | VOL 428 | 1 APRIL 2004 | www.nature.com/nature 507© 2004 Nature Publishing Group
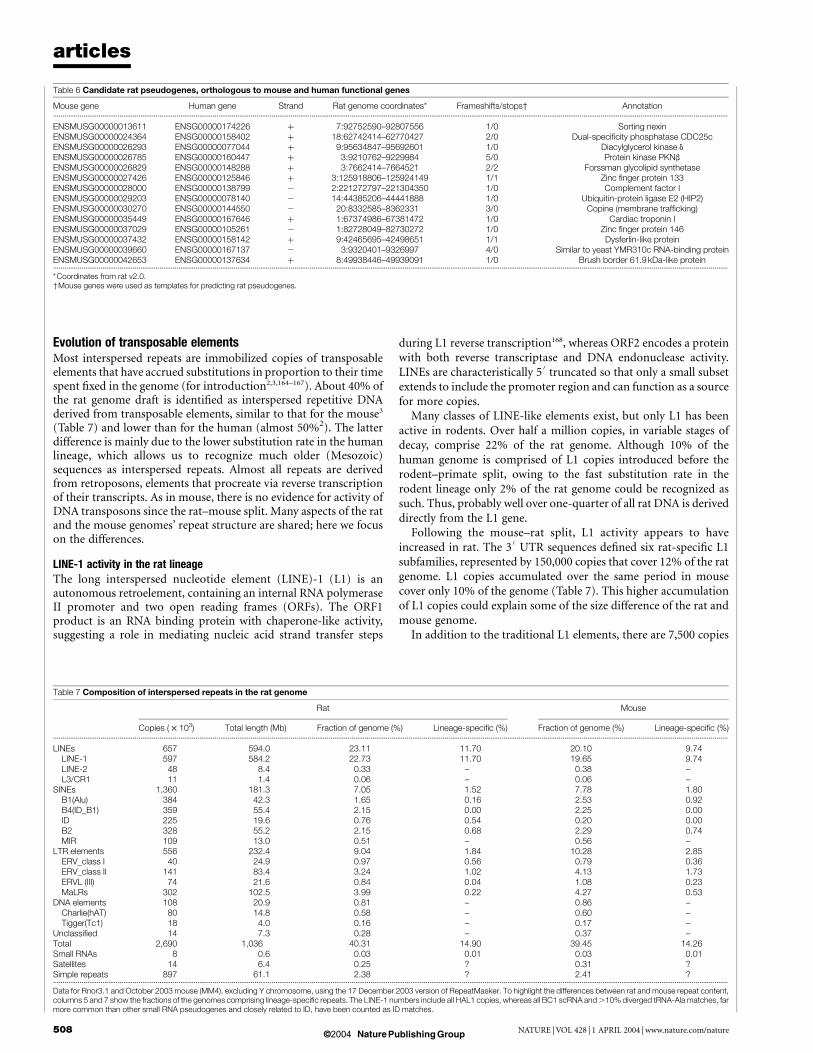
Evolution of transposable elementsMost interspersed repeats are immobilized copies of transposableelements that have accrued substitutions in proportion to their timespent fixed in the genome (for introduction2,3,164–167). About 40% ofthe rat genome draft is identified as interspersed repetitive DNAderived from transposable elements, similar to that for the mouse3
(Table 7) and lower than for the human (almost 50%2). The latterdifference is mainly due to the lower substitution rate in the humanlineage, which allows us to recognize much older (Mesozoic)sequences as interspersed repeats. Almost all repeats are derivedfrom retroposons, elements that procreate via reverse transcriptionof their transcripts. As in mouse, there is no evidence for activity ofDNA transposons since the rat–mouse split. Many aspects of the ratand the mouse genomes’ repeat structure are shared; here we focuson the differences.
LINE-1 activity in the rat lineageThe long interspersed nucleotide element (LINE)-1 (L1) is anautonomous retroelement, containing an internal RNA polymeraseII promoter and two open reading frames (ORFs). The ORF1product is an RNA binding protein with chaperone-like activity,suggesting a role in mediating nucleic acid strand transfer steps
during L1 reverse transcription168, whereas ORF2 encodes a proteinwith both reverse transcriptase and DNA endonuclease activity.LINEs are characteristically 5
0truncated so that only a small subset
extends to include the promoter region and can function as a sourcefor more copies.
Many classes of LINE-like elements exist, but only L1 has beenactive in rodents. Over half a million copies, in variable stages ofdecay, comprise 22% of the rat genome. Although 10% of thehuman genome is comprised of L1 copies introduced before therodent–primate split, owing to the fast substitution rate in therodent lineage only 2% of the rat genome could be recognized assuch. Thus, probably well over one-quarter of all rat DNA is deriveddirectly from the L1 gene.
Following the mouse–rat split, L1 activity appears to haveincreased in rat. The 3 0 UTR sequences defined six rat-specific L1subfamilies, represented by 150,000 copies that cover 12% of the ratgenome. L1 copies accumulated over the same period in mousecover only 10% of the genome (Table 7). This higher accumulationof L1 copies could explain some of the size difference of the rat andmouse genome.
In addition to the traditional L1 elements, there are 7,500 copies
Table 6 Candidate rat pseudogenes, orthologous to mouse and human functional genes
Mouse gene Human gene Strand Rat genome coordinates* Frameshifts/stops† Annotation...................................................................................................................................................................................................................................................................................................................................................................
ENSMUSG00000013611 ENSG00000174226 þ 7:92752590–92807556 1/0 Sorting nexinENSMUSG00000024364 ENSG00000158402 þ 18:62742414–62770427 2/0 Dual-specificity phosphatase CDC25cENSMUSG00000026293 ENSG00000077044 þ 9:95634847–95692601 1/0 Diacylglycerol kinase d
ENSMUSG00000026785 ENSG00000160447 þ 3:9210762–9229984 5/0 Protein kinase PKNb
ENSMUSG00000026829 ENSG00000148288 þ 3:7662414–7664521 2/2 Forssman glycolipid synthetaseENSMUSG00000027426 ENSG00000125846 þ 3:125918806–125924149 1/1 Zinc finger protein 133ENSMUSG00000028000 ENSG00000138799 2 2:221272797–221304350 1/0 Complement factor IENSMUSG00000029203 ENSG00000078140 2 14:44385206–44441888 1/0 Ubiquitin-protein ligase E2 (HIP2)ENSMUSG00000030270 ENSG00000144550 2 20:8332585–8362331 3/0 Copine (membrane trafficking)ENSMUSG00000035449 ENSG00000167646 þ 1:67374986–67381472 1/0 Cardiac troponin IENSMUSG00000037029 ENSG00000105261 2 1:82728049–82730272 1/0 Zinc finger protein 146ENSMUSG00000037432 ENSG00000158142 þ 9:42465695–42498651 1/1 Dysferlin-like proteinENSMUSG00000039660 ENSG00000167137 2 3:9320401–9326997 4/0 Similar to yeast YMR310c RNA-binding proteinENSMUSG00000042653 ENSG00000137634 þ 8:49938446–49939091 1/0 Brush border 61.9 kDa-like protein...................................................................................................................................................................................................................................................................................................................................................................
*Coordinates from rat v2.0.†Mouse genes were used as templates for predicting rat pseudogenes.
Table 7 Composition of interspersed repeats in the rat genome
Rat Mouse
Copies ( £ 103) Total length (Mb) Fraction of genome (%) Lineage-specific (%) Fraction of genome (%) Lineage-specific (%)...................................................................................................................................................................................................................................................................................................................................................................
LINEs 657 594.0 23.11 11.70 20.10 9.74LINE-1 597 584.2 22.73 11.70 19.65 9.74LINE-2 48 8.4 0.33 – 0.38 –L3/CR1 11 1.4 0.06 – 0.06 –
SINEs 1,360 181.3 7.05 1.52 7.78 1.80B1(Alu) 384 42.3 1.65 0.16 2.53 0.92B4(ID_B1) 359 55.4 2.15 0.00 2.25 0.00ID 225 19.6 0.76 0.54 0.20 0.00B2 328 55.2 2.15 0.68 2.29 0.74MIR 109 13.0 0.51 – 0.56 –
LTR elements 556 232.4 9.04 1.84 10.28 2.85ERV_class I 40 24.9 0.97 0.56 0.79 0.36ERV_class II 141 83.4 3.24 1.02 4.13 1.73ERVL (III) 74 21.6 0.84 0.04 1.08 0.23MaLRs 302 102.5 3.99 0.22 4.27 0.53
DNA elements 108 20.9 0.81 – 0.86 –Charlie(hAT) 80 14.8 0.58 – 0.60 –Tigger(Tc1) 18 4.0 0.16 – 0.17 –
Unclassified 14 7.3 0.28 – 0.37 –Total 2,690 1,036 40.31 14.90 39.45 14.26Small RNAs 8 0.6 0.03 0.01 0.03 0.01Satellites 14 6.4 0.25 ? 0.31 ?Simple repeats 897 61.1 2.38 ? 2.41 ?...................................................................................................................................................................................................................................................................................................................................................................
Data for Rnor3.1 and October 2003 mouse (MM4), excluding Y chromosome, using the 17 December 2003 version of RepeatMasker. To highlight the differences between rat and mouse repeat content,columns 5 and 7 show the fractions of the genomes comprising lineage-specific repeats. The LINE-1 numbers include all HAL1 copies, whereas all BC1 scRNA and .10% diverged tRNA-Ala matches, farmore common than other small RNA pseudogenes and closely related to ID, have been counted as ID matches.
articles
NATURE | VOL 428 | 1 APRIL 2004 | www.nature.com/nature508 © 2004 Nature Publishing Group
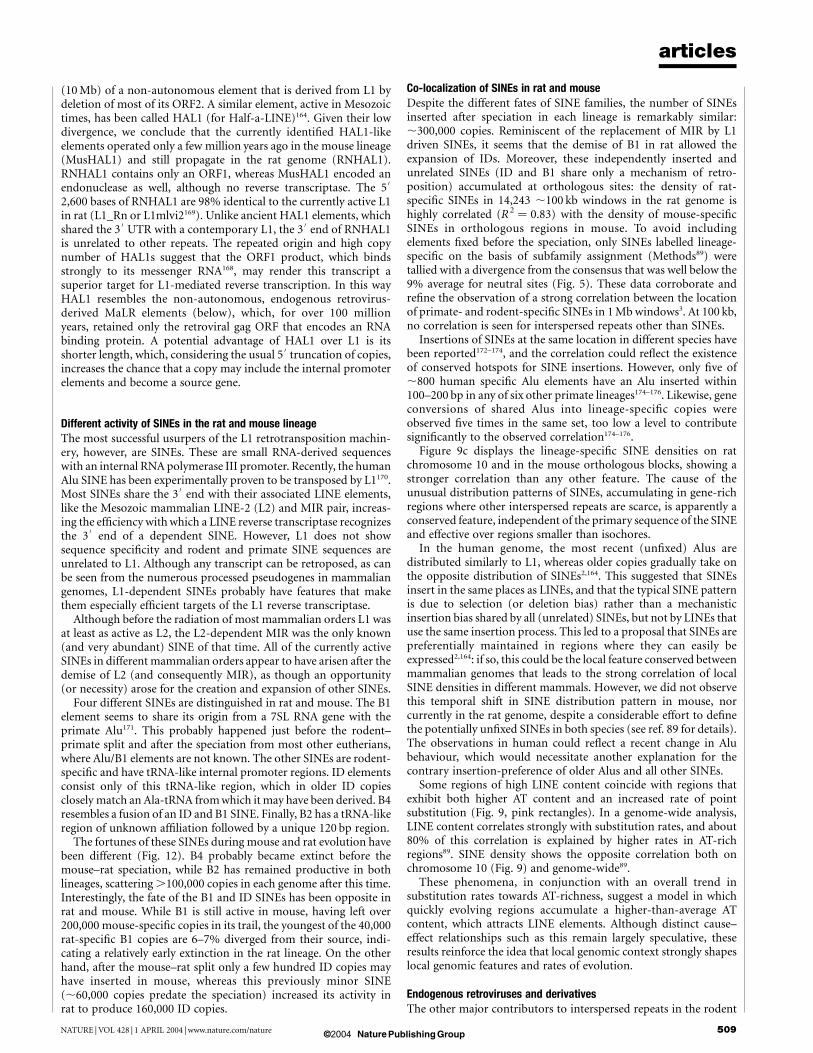
(10 Mb) of a non-autonomous element that is derived from L1 bydeletion of most of its ORF2. A similar element, active in Mesozoictimes, has been called HAL1 (for Half-a-LINE)164. Given their lowdivergence, we conclude that the currently identified HAL1-likeelements operated only a few million years ago in the mouse lineage(MusHAL1) and still propagate in the rat genome (RNHAL1).RNHAL1 contains only an ORF1, whereas MusHAL1 encoded anendonuclease as well, although no reverse transcriptase. The 5 0
2,600 bases of RNHAL1 are 98% identical to the currently active L1in rat (L1_Rn or L1mlvi2169). Unlike ancient HAL1 elements, whichshared the 3
0UTR with a contemporary L1, the 3
0end of RNHAL1
is unrelated to other repeats. The repeated origin and high copynumber of HAL1s suggest that the ORF1 product, which bindsstrongly to its messenger RNA168, may render this transcript asuperior target for L1-mediated reverse transcription. In this wayHAL1 resembles the non-autonomous, endogenous retrovirus-derived MaLR elements (below), which, for over 100 millionyears, retained only the retroviral gag ORF that encodes an RNAbinding protein. A potential advantage of HAL1 over L1 is itsshorter length, which, considering the usual 5
0truncation of copies,
increases the chance that a copy may include the internal promoterelements and become a source gene.
Different activity of SINEs in the rat and mouse lineageThe most successful usurpers of the L1 retrotransposition machin-ery, however, are SINEs. These are small RNA-derived sequenceswith an internal RNA polymerase III promoter. Recently, the humanAlu SINE has been experimentally proven to be transposed by L1170.Most SINEs share the 3 0 end with their associated LINE elements,like the Mesozoic mammalian LINE-2 (L2) and MIR pair, increas-ing the efficiency with which a LINE reverse transcriptase recognizesthe 3
0end of a dependent SINE. However, L1 does not show
sequence specificity and rodent and primate SINE sequences areunrelated to L1. Although any transcript can be retroposed, as canbe seen from the numerous processed pseudogenes in mammaliangenomes, L1-dependent SINEs probably have features that makethem especially efficient targets of the L1 reverse transcriptase.
Although before the radiation of most mammalian orders L1 wasat least as active as L2, the L2-dependent MIR was the only known(and very abundant) SINE of that time. All of the currently activeSINEs in different mammalian orders appear to have arisen after thedemise of L2 (and consequently MIR), as though an opportunity(or necessity) arose for the creation and expansion of other SINEs.
Four different SINEs are distinguished in rat and mouse. The B1element seems to share its origin from a 7SL RNA gene with theprimate Alu171. This probably happened just before the rodent–primate split and after the speciation from most other eutherians,where Alu/B1 elements are not known. The other SINEs are rodent-specific and have tRNA-like internal promoter regions. ID elementsconsist only of this tRNA-like region, which in older ID copiesclosely match an Ala-tRNA from which it may have been derived. B4resembles a fusion of an ID and B1 SINE. Finally, B2 has a tRNA-likeregion of unknown affiliation followed by a unique 120 bp region.
The fortunes of these SINEs during mouse and rat evolution havebeen different (Fig. 12). B4 probably became extinct before themouse–rat speciation, while B2 has remained productive in bothlineages, scattering .100,000 copies in each genome after this time.Interestingly, the fate of the B1 and ID SINEs has been opposite inrat and mouse. While B1 is still active in mouse, having left over200,000 mouse-specific copies in its trail, the youngest of the 40,000rat-specific B1 copies are 6–7% diverged from their source, indi-cating a relatively early extinction in the rat lineage. On the otherhand, after the mouse–rat split only a few hundred ID copies mayhave inserted in mouse, whereas this previously minor SINE(,60,000 copies predate the speciation) increased its activity inrat to produce 160,000 ID copies.
Co-localization of SINEs in rat and mouseDespite the different fates of SINE families, the number of SINEsinserted after speciation in each lineage is remarkably similar:,300,000 copies. Reminiscent of the replacement of MIR by L1driven SINEs, it seems that the demise of B1 in rat allowed theexpansion of IDs. Moreover, these independently inserted andunrelated SINEs (ID and B1 share only a mechanism of retro-position) accumulated at orthologous sites: the density of rat-specific SINEs in 14,243 ,100 kb windows in the rat genome ishighly correlated (R2 ¼ 0.83) with the density of mouse-specificSINEs in orthologous regions in mouse. To avoid includingelements fixed before the speciation, only SINEs labelled lineage-specific on the basis of subfamily assignment (Methods89) weretallied with a divergence from the consensus that was well below the9% average for neutral sites (Fig. 5). These data corroborate andrefine the observation of a strong correlation between the locationof primate- and rodent-specific SINEs in 1 Mb windows3. At 100 kb,no correlation is seen for interspersed repeats other than SINEs.
Insertions of SINEs at the same location in different species havebeen reported172–174, and the correlation could reflect the existenceof conserved hotspots for SINE insertions. However, only five of,800 human specific Alu elements have an Alu inserted within100–200 bp in any of six other primate lineages174–176. Likewise, geneconversions of shared Alus into lineage-specific copies wereobserved five times in the same set, too low a level to contributesignificantly to the observed correlation174–176.
Figure 9c displays the lineage-specific SINE densities on ratchromosome 10 and in the mouse orthologous blocks, showing astronger correlation than any other feature. The cause of theunusual distribution patterns of SINEs, accumulating in gene-richregions where other interspersed repeats are scarce, is apparently aconserved feature, independent of the primary sequence of the SINEand effective over regions smaller than isochores.
In the human genome, the most recent (unfixed) Alus aredistributed similarly to L1, whereas older copies gradually take onthe opposite distribution of SINEs2,164. This suggested that SINEsinsert in the same places as LINEs, and that the typical SINE patternis due to selection (or deletion bias) rather than a mechanisticinsertion bias shared by all (unrelated) SINEs, but not by LINEs thatuse the same insertion process. This led to a proposal that SINEs arepreferentially maintained in regions where they can easily beexpressed2,164: if so, this could be the local feature conserved betweenmammalian genomes that leads to the strong correlation of localSINE densities in different mammals. However, we did not observethis temporal shift in SINE distribution pattern in mouse, norcurrently in the rat genome, despite a considerable effort to definethe potentially unfixed SINEs in both species (see ref. 89 for details).The observations in human could reflect a recent change in Alubehaviour, which would necessitate another explanation for thecontrary insertion-preference of older Alus and all other SINEs.
Some regions of high LINE content coincide with regions thatexhibit both higher AT content and an increased rate of pointsubstitution (Fig. 9, pink rectangles). In a genome-wide analysis,LINE content correlates strongly with substitution rates, and about80% of this correlation is explained by higher rates in AT-richregions89. SINE density shows the opposite correlation both onchromosome 10 (Fig. 9) and genome-wide89.
These phenomena, in conjunction with an overall trend insubstitution rates towards AT-richness, suggest a model in whichquickly evolving regions accumulate a higher-than-average ATcontent, which attracts LINE elements. Although distinct cause–effect relationships such as this remain largely speculative, theseresults reinforce the idea that local genomic context strongly shapeslocal genomic features and rates of evolution.
Endogenous retroviruses and derivativesThe other major contributors to interspersed repeats in the rodent
articles
NATURE | VOL 428 | 1 APRIL 2004 | www.nature.com/nature 509© 2004 Nature Publishing Group

genome are retrovirus-like elements. These have several 100 bp longterminal repeats (LTRs) with transcriptional regulatory sequencesthat flank an internal sequence that, in autonomous elements,encodes all proteins necessary for retrotransposition. All mamma-lian LTR elements are endogenous retroviruses (ERVs) or their non-autonomous derivatives. They fall into three groups, of whichrepresentatives in mouse are: murine leukaemia virus (MuLV)(class I), intracisternal A-particle (IAP) and MMTV (class II), andMERVL (class III).
The most productive retrovirus in mammals has been the class IIIelement ERV-L, primarily through its ancient non-autonomousderivatives, called MaLRs, with 350,000 copies occupying ,5% ofthe rat genome (Table 7). Human ERV-L and MaLR copies are .6%diverged from their reconstructed source genes and must have diedout around the time of human speciation from New Worldmonkeys. In mouse, several thousand almost identical MaLR andERV-L copies suggest sustained activity177–179. In contrast, rat ERV-Lactivity must have been silenced a few million years ago, given thatthe least diverged MaLR and ERV-L (MTB_Rn and MT2_Rat1)copies differ by .4% from each other. Other class III ERVs wereactive earlier in rodent evolution, before the mouse–rat speciation.
In contrast to class III ERVs, class I and class II elements stillthrive in rat. We reconstructed four rat-specific autonomous class IERVs, of which two appear still active, and nine class II ERVs, ofwhich four may still be active. The non-autonomous NICER andRAL elements represent over 60% of all rat-specific class I elements.The autonomous drivers of this group, RNNICER2 and 3, withseveral intact copies, are closely related to the mouse-specific MuLV.Among the potentially active autonomous class II ERVs areMYSERV_Rn, related to the Mys element in Peromyscus, and severalIAP elements, one with a full-length envelope gene. The mostprolific, still-active class II ERV, RNERVK3, is distantly related tothe simian retroviruses and, like ERV-L and NICER, has spawnedabundant non-autonomous elements characterized by closelyrelated LTRs.
Simple repeatsWhereas the above interspersed repeats derive from transposedsequences, mammalian genomes also contain interspersed simplesequence repeats (SSRs), regions of tandemly repeated short(1–6 bp) units that probably arise from slippage during DNAreplication and can expand and compress by unequal crossing
over. Remarkable differences were noted between the SSR contentsof the human and mouse genomes3. Three times as many base pairsare contained in near (.90%) perfect SSRs in mouse than inhuman, and a 4–5-fold excess was revealed when excluding SSRscontained in or seeded by interspersed repeats (primarily SSRsderived from the poly A or simple repeat tails of SINEs and LINEs).SSRs are both more frequent and on average longer in mouse.Polypurine (or polypyrimidine) repeats are especially (tenfold)over-represented in the mouse genome. As discussed above, thiscontrasts sharply with the greater frequency of triplet repeats codingfor amino acids in human than in the rodents.
Rat and mouse SSR contents show, perhaps not surprisingly,much smaller differences. They represent almost the same amountof the rat and mouse genomes (for .90% perfect elements, ,1.4%compared with 0.45% in human) and are of similar average length;for example, the average .90% perfect (CA)n repeat, the mostcommon SSR in mammals, is 42 bp long in mouse and 44 bp in rat.Some potentially significant differences are that polypurine SSRs areof similar average length but are 1.2-fold more common in mouse,whereas the rare SSRs containing CG dimers are 1.5-fold morefrequently observed in rat.
Figure 12 Historical view of rodent repeated sequences. Relationships of the major
families of interspersed repeats (Table 7) are shown for the rat and mouse genomes,
indicating losses and gains of repeat families after speciation. The lines indicate activity as
a function of time. Note that HAL1-like elements appear to have arisen in both the mouse
and rat lineages.
Figure 13 Adaptive remodelling of genomes and genes. a, Orthologous regions of rat,
human and mouse genomes encoding pheromone-carrier proteins of the lipocalin family
(a2u-globulins in rat and major urinary proteins in mouse) shown in brown. Zfp37-like zinc
finger genes are shown in blue. Filled arrows represent likely genes, whereas striped
arrows represent likely pseudogenes. Gene expansions are bracketed. Arrowhead
orientation represents transcriptional direction. Flanking genes 1 and 2 are TSCOT and
CTR1, respectively. b, Site-specific K A/K S analysis of rat a2u-globulins. Shown in red are
side-chains from codons subject to positive selection. These have been mapped to a
ribbon representation of the crystal structure of rat a2u-globulin chain A.
articles
NATURE | VOL 428 | 1 APRIL 2004 | www.nature.com/nature510 © 2004 Nature Publishing Group
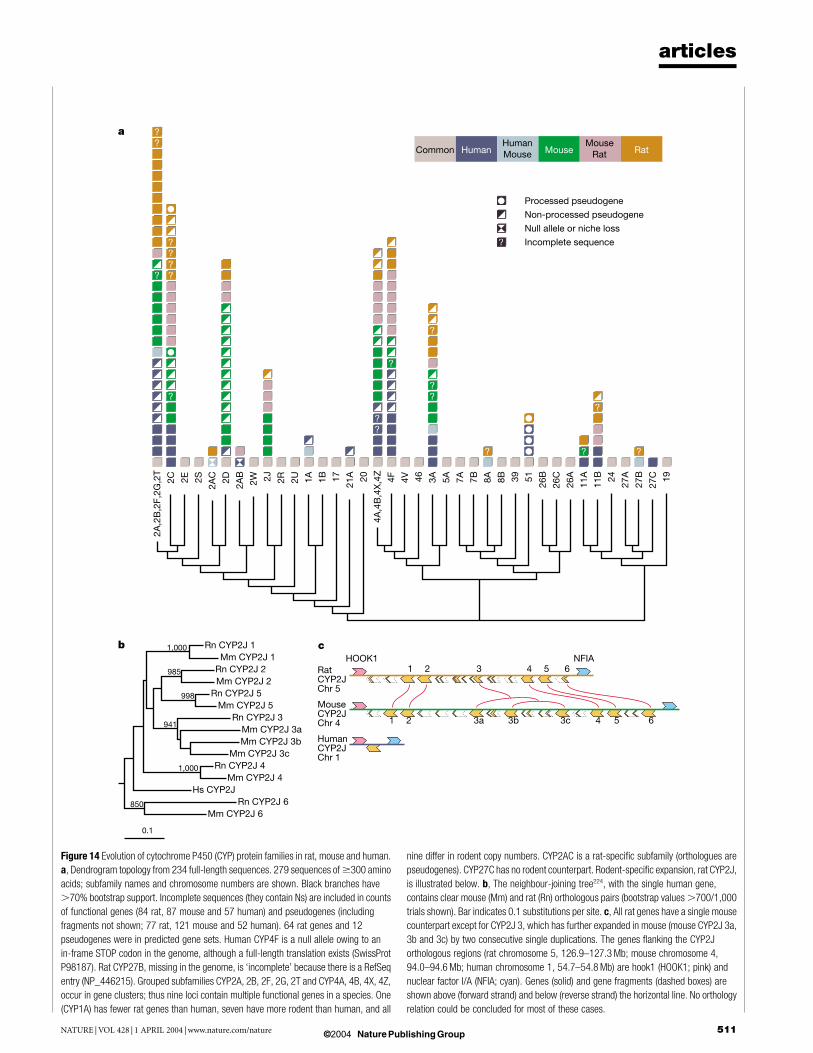
1,000
985
998
941
1,000
850
0.1
b
Figure 14 Evolution of cytochrome P450 (CYP) protein families in rat, mouse and human.
a, Dendrogram topology from 234 full-length sequences. 279 sequences of $300 amino
acids; subfamily names and chromosome numbers are shown. Black branches have
.70% bootstrap support. Incomplete sequences (they contain Ns) are included in counts
of functional genes (84 rat, 87 mouse and 57 human) and pseudogenes (including
fragments not shown; 77 rat, 121 mouse and 52 human). 64 rat genes and 12
pseudogenes were in predicted gene sets. Human CYP4F is a null allele owing to an
in-frame STOP codon in the genome, although a full-length translation exists (SwissProt
P98187). Rat CYP27B, missing in the genome, is ‘incomplete’ because there is a RefSeq
entry (NP_446215). Grouped subfamilies CYP2A, 2B, 2F, 2G, 2T and CYP4A, 4B, 4X, 4Z,
occur in gene clusters; thus nine loci contain multiple functional genes in a species. One
(CYP1A) has fewer rat genes than human, seven have more rodent than human, and all
nine differ in rodent copy numbers. CYP2AC is a rat-specific subfamily (orthologues are
pseudogenes). CYP27C has no rodent counterpart. Rodent-specific expansion, rat CYP2J,
is illustrated below. b, The neighbour-joining tree224, with the single human gene,
contains clear mouse (Mm) and rat (Rn) orthologous pairs (bootstrap values .700/1,000
trials shown). Bar indicates 0.1 substitutions per site. c, All rat genes have a single mouse
counterpart except for CYP2J 3, which has further expanded in mouse (mouse CYP2J 3a,
3b and 3c) by two consecutive single duplications. The genes flanking the CYP2J
orthologous regions (rat chromosome 5, 126.9–127.3 Mb; mouse chromosome 4,
94.0–94.6 Mb; human chromosome 1, 54.7–54.8 Mb) are hook1 (HOOK1; pink) and
nuclear factor I/A (NFIA; cyan). Genes (solid) and gene fragments (dashed boxes) are
shown above (forward strand) and below (reverse strand) the horizontal line. No orthology
relation could be concluded for most of these cases.
articles
NATURE | VOL 428 | 1 APRIL 2004 | www.nature.com/nature 511© 2004 Nature Publishing Group
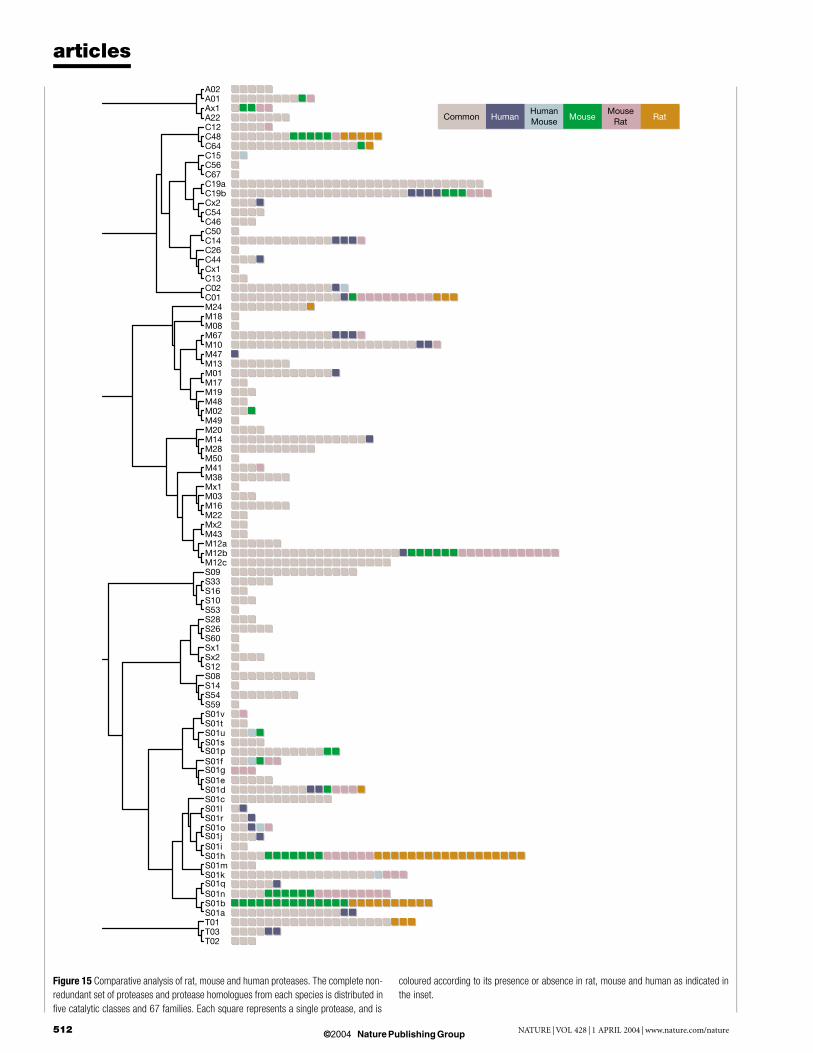
Figure 15 Comparative analysis of rat, mouse and human proteases. The complete non-
redundant set of proteases and protease homologues from each species is distributed in
five catalytic classes and 67 families. Each square represents a single protease, and is
coloured according to its presence or absence in rat, mouse and human as indicated in
the inset.
articles
NATURE | VOL 428 | 1 APRIL 2004 | www.nature.com/nature512 © 2004 Nature Publishing Group
Prevalent, medium-length duplications in rodentsIn addition to the transpositionally derived interspersed repeats andsimple repeats detected by RepeatMasker and Tandem RepeatFinder, the rat and mouse genomes contain a substantial amountof medium-length unclassified duplications (typically 100–5,000 bp). These are readily seen in self-comparisons and in intra-rodent comparisons after masking the known repeats, but they aresubstantially less prevalent in comparisons with the human genome(Supplementary Information). Clearly, a substantial fraction of therodent genomes consists of currently unexplained repeats and a fullcharacterization awaits further studies. The unclassified dupli-cations may include: (1) novel families of low-copy rodent inter-spersed repeats; (2) extensions of known but not fully characterizedrodent repeats; and (3) duplications generated by a mechanismdifferent from transposition.
Rat-specific biologyA principal ambition of the RGSP was to reveal genetic differencesbetween rats and mice that might specify their differences inphysiology and behaviour. This view was well supported by thecurrent draft sequence and predicted gene set. In particular, recentlyduplicated genes are enriched in elements involved in chemosensa-tion and functional aspects of reproduction (Table 5). Here weillustrate the differences in the gene complements of rat and mouseby in-depth analyses of olfactory receptors (ORs), pheromones,cytochromes P450, proteases and protease inhibitors.
ChemosensationThe ability to emit and sense specific smells is a key feature ofsurvival for most animals in the wild. Another paper180 describes theevolution of rat and mouse pheromones, vomeronasal receptors,and ORs whose genes were duplicated frequently during the timesince the common ancestor of rats and mice (Table 5). Their studyyielded over 200 aligned codons predicted to have been subject toadaptive evolution. They attribute the rapid evolution of these genesto conspecific competition—in particular, sexual selection.
Using a homology-based identification procedure with manualcuration181, we found 1,866 ORs in 113 locations in the rat genome:69 multi-gene clusters and 44 single genes. After adjusting formissing sequences (the assembly covers 90.2% of the genome), weextrapolate that there are ,2,070 OR genes and pseudogenes. Therat therefore has ,37% more OR genes and pseudogenes than the,1,510 ORs of the mouse181,182, assuming similar representation ofrecently duplicated sequences in the two genome assemblies used.Of the 1,774 OR sequences that are not interrupted by assemblygaps, 1,227 (69%) encode intact proteins, while the remaining 547(31%) sequences are probably pseudogenes with in-frame stopcodons, frameshifts, and/or interspersed repeat elements. Fewermouse OR homologues are pseudogenes (,20%)181,182, but thelarger family size in rat still leaves it with substantially more intactORs than the mouse (,1,430 versus ,1,210). Striking rat-specificexpansions of two ancestral clusters account for much of thedifference in OR family size and pseudogene content between ratand mouse, although many other clusters exhibit more subtlechanges (not shown). Significant differences between human andmouse OR families have also been reported181–183, but the functionalimplications of OR repertoire size on the ability of different speciesto detect and discriminate odorants are not yet known.
a2u-globulin pheromonesThe a2u-globulin genes are odorant-binding proteins that alsocontribute to essential survival functions in animals. a2u-globulinhomologues are likely to be highly heterogeneous among muridspecies. Several homologues (major urinary proteins) sequencedfrom the BALB/c mouse are distinct from their C57BL/6J mousecounterparts, and these also appear to be arranged differently alongits genome184. Moreover, two full-length genes from other mouse
strains185 differ from their C57BL/6J orthologues—either lackingtwo of the bases or retaining 20 of the bases that render theC57BL/6J sequences likely to be pseudogenes (not shown).
The evolution of a2u-globulin genes on rat chromosome 5 hasclearly driven a significant ‘remodelling’ of this genomic region(Fig. 13a). The orthologous human genomic region contains asingle homologue, suggesting that the common ancestor of rodentsand human possessed one gene. The genome of C57BL/6J micecontains four homologous genes, and seven pseudogenes, whereasthe rat genome contains ten a2u-globulin genes and 12 pseudogenesin a single region (Fig. 13a).
Phylogenetic trees constructed using amino acid, and non-codingDNA, sequences show that, surprisingly, the rat a2u-globulin geneclusters appear to have arisen recently via a rapid burst of geneduplication since the rat–mouse split (Table 5; data not shown).This is consistent with the Rfp37-like zinc-finger-like pseudogenehaving uniquely ‘hitchhiked’ for virtually all of the rat-specifica2u-globulin gene duplications (Fig. 13a). The sequences of thesegenes are also evolving rapidly, with median KA/KS values of 0.77and 1.06 for rat and mouse genes, respectively. Amino acid sites thatappear to have been subject to adaptive evolution are situated bothwithin the ligand-binding cavity, and on the solvent-exposedperiphery of the a2u-globulin structure139 (Fig. 13b). This demon-strates how genome analysis can reveal the imprint of adaptiveevolution from megabase to single-base levels.
The rapid evolution of these genes, and the remodelling oftheir genomic regions, can be attributed to the known roles of rata2u-globulins and mouse major urinary proteins in conspecificcompetition and sexual selection. These proteins are pheromonesand pheromone carriers that are present in large quantities inrodent urine, and act as scent markers indicating dominance andsubspecies identity186,187.
DetoxificationCytochrome P450 is a well-recognized participant in metabolicdetoxification, and we also observe rapid evolution within thisfamily. These enzymes metabolize a large number of toxic andendogenous compounds188 and thus are particularly relevant toclinical and pharmacological studies in humans. As rodents areimportant model organisms for understanding human drugmetabolism, it is important to identify 1:1 orthologues andspecies-specific expansions and losses189. Compared with humangenes, there are clear expansions of several rodent P450 subfamilies,but there are also significant differences between rat and mousesubfamilies (Fig. 14a). The fastest-evolving subfamily seems to beCYP2J, containing a single gene in human, but at least four in ratand eight in mouse (Fig. 14b, c). CYP2J enzymes catalyse theNADPH-dependent oxidation of arachidonic acid to various eico-sanoids, which in turn possess numerous biological activitiesincluding modulation of ion transport, control of bronchial andvascular smooth muscle tone, and stimulation of peptide hormonesecretion190. The genomic ordering of genes and their phylogenetictree indicate an ongoing expansion in the rodents (Fig. 14b, c). Thissuggests that adaptive evolution has been involved in diversifyingtheir functions. Moreover, detailed study of the nuclear receptors, ahighly conserved family of transcription factors, revealed that PXRand CAR, two nuclear receptors regulating CYP genes involved withdetoxification191, have the two highest nucleotide substitution ratesin their ligand binding domains, whereas SF-1, the nuclear receptorregulating CYP19 (ref. 192), which has not undergone expansion, ismore conserved, like other nuclear receptors193.
ProteolysisProtease and protease inhibitor genes also represent an example ofrapid evolution in the rat genome. Proteases are a structurally andfunctionally heterogeneous group of enzymes involved in multiplebiological and pathological processes194. The rat contains 626
articles
NATURE | VOL 428 | 1 APRIL 2004 | www.nature.com/nature 513© 2004 Nature Publishing Group
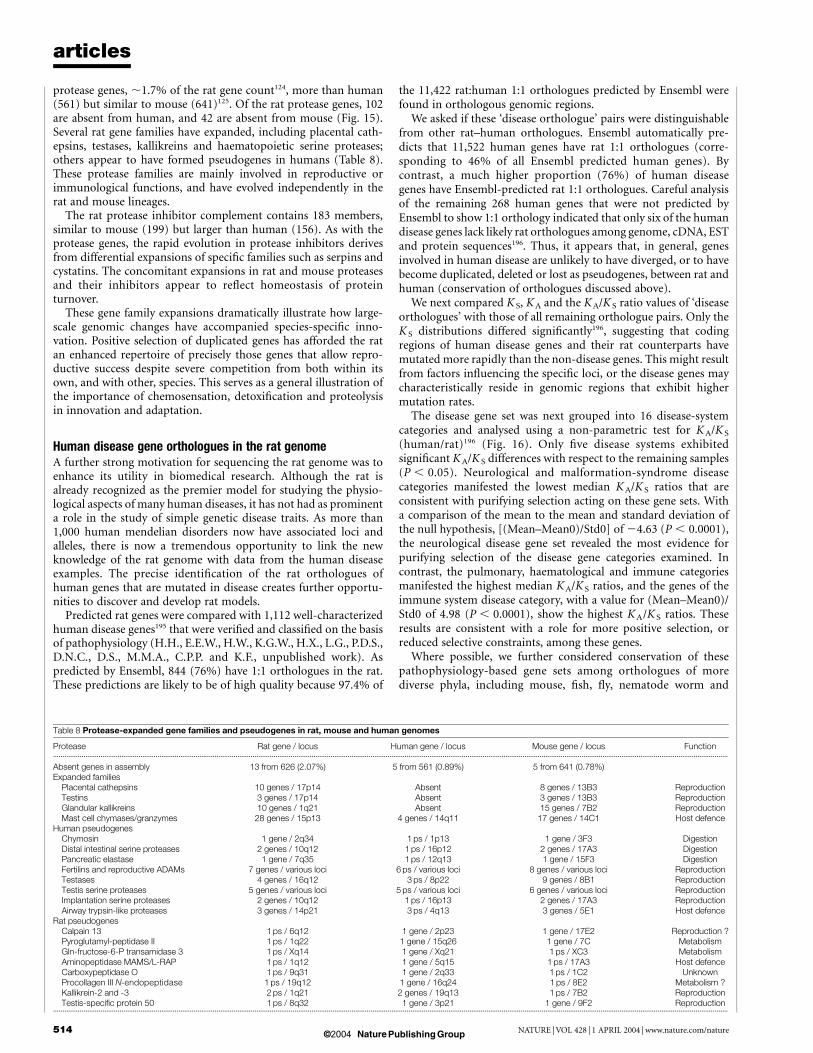
protease genes, ,1.7% of the rat gene count124, more than human(561) but similar to mouse (641)125. Of the rat protease genes, 102are absent from human, and 42 are absent from mouse (Fig. 15).Several rat gene families have expanded, including placental cath-epsins, testases, kallikreins and haematopoietic serine proteases;others appear to have formed pseudogenes in humans (Table 8).These protease families are mainly involved in reproductive orimmunological functions, and have evolved independently in therat and mouse lineages.
The rat protease inhibitor complement contains 183 members,similar to mouse (199) but larger than human (156). As with theprotease genes, the rapid evolution in protease inhibitors derivesfrom differential expansions of specific families such as serpins andcystatins. The concomitant expansions in rat and mouse proteasesand their inhibitors appear to reflect homeostasis of proteinturnover.
These gene family expansions dramatically illustrate how large-scale genomic changes have accompanied species-specific inno-vation. Positive selection of duplicated genes has afforded the ratan enhanced repertoire of precisely those genes that allow repro-ductive success despite severe competition from both within itsown, and with other, species. This serves as a general illustration ofthe importance of chemosensation, detoxification and proteolysisin innovation and adaptation.
Human disease gene orthologues in the rat genomeA further strong motivation for sequencing the rat genome was toenhance its utility in biomedical research. Although the rat isalready recognized as the premier model for studying the physio-logical aspects of many human diseases, it has not had as prominenta role in the study of simple genetic disease traits. As more than1,000 human mendelian disorders now have associated loci andalleles, there is now a tremendous opportunity to link the newknowledge of the rat genome with data from the human diseaseexamples. The precise identification of the rat orthologues ofhuman genes that are mutated in disease creates further opportu-nities to discover and develop rat models.
Predicted rat genes were compared with 1,112 well-characterizedhuman disease genes195 that were verified and classified on the basisof pathophysiology (H.H., E.E.W., H.W., K.G.W., H.X., L.G., P.D.S.,D.N.C., D.S., M.M.A., C.P.P. and K.F., unpublished work). Aspredicted by Ensembl, 844 (76%) have 1:1 orthologues in the rat.These predictions are likely to be of high quality because 97.4% of
the 11,422 rat:human 1:1 orthologues predicted by Ensembl werefound in orthologous genomic regions.
We asked if these ‘disease orthologue’ pairs were distinguishablefrom other rat–human orthologues. Ensembl automatically pre-dicts that 11,522 human genes have rat 1:1 orthologues (corre-sponding to 46% of all Ensembl predicted human genes). Bycontrast, a much higher proportion (76%) of human diseasegenes have Ensembl-predicted rat 1:1 orthologues. Careful analysisof the remaining 268 human genes that were not predicted byEnsembl to show 1:1 orthology indicated that only six of the humandisease genes lack likely rat orthologues among genome, cDNA, ESTand protein sequences196. Thus, it appears that, in general, genesinvolved in human disease are unlikely to have diverged, or to havebecome duplicated, deleted or lost as pseudogenes, between rat andhuman (conservation of orthologues discussed above).
We next compared K S, KA and the KA/K S ratio values of ‘diseaseorthologues’ with those of all remaining orthologue pairs. Only theK S distributions differed significantly196, suggesting that codingregions of human disease genes and their rat counterparts havemutated more rapidly than the non-disease genes. This might resultfrom factors influencing the specific loci, or the disease genes maycharacteristically reside in genomic regions that exhibit highermutation rates.
The disease gene set was next grouped into 16 disease-systemcategories and analysed using a non-parametric test for KA/K S
(human/rat)196 (Fig. 16). Only five disease systems exhibitedsignificant KA/K S differences with respect to the remaining samples(P , 0.05). Neurological and malformation-syndrome diseasecategories manifested the lowest median KA/K S ratios that areconsistent with purifying selection acting on these gene sets. Witha comparison of the mean to the mean and standard deviation ofthe null hypothesis, [(Mean–Mean0)/Std0] of 24.63 (P , 0.0001),the neurological disease gene set revealed the most evidence forpurifying selection of the disease gene categories examined. Incontrast, the pulmonary, haematological and immune categoriesmanifested the highest median KA/K S ratios, and the genes of theimmune system disease category, with a value for (Mean–Mean0)/Std0 of 4.98 (P , 0.0001), show the highest KA/K S ratios. Theseresults are consistent with a role for more positive selection, orreduced selective constraints, among these genes.
Where possible, we further considered conservation of thesepathophysiology-based gene sets among orthologues of morediverse phyla, including mouse, fish, fly, nematode worm and
Table 8 Protease-expanded gene families and pseudogenes in rat, mouse and human genomes
Protease Rat gene / locus Human gene / locus Mouse gene / locus Function...................................................................................................................................................................................................................................................................................................................................................................
Absent genes in assembly 13 from 626 (2.07%) 5 from 561 (0.89%) 5 from 641 (0.78%)Expanded families
Placental cathepsins 10 genes / 17p14 Absent 8 genes / 13B3 ReproductionTestins 3 genes / 17p14 Absent 3 genes / 13B3 ReproductionGlandular kallikreins 10 genes / 1q21 Absent 15 genes / 7B2 ReproductionMast cell chymases/granzymes 28 genes / 15p13 4 genes / 14q11 17 genes / 14C1 Host defence
Human pseudogenesChymosin 1 gene / 2q34 1 ps / 1p13 1 gene / 3F3 DigestionDistal intestinal serine proteases 2 genes / 10q12 1 ps / 16p12 2 genes / 17A3 DigestionPancreatic elastase 1 gene / 7q35 1 ps / 12q13 1 gene / 15F3 DigestionFertilins and reproductive ADAMs 7 genes / various loci 6 ps / various loci 8 genes / various loci ReproductionTestases 4 genes / 16q12 3 ps / 8p22 9 genes / 8B1 ReproductionTestis serine proteases 5 genes / various loci 5 ps / various loci 6 genes / various loci ReproductionImplantation serine proteases 2 genes / 10q12 1 ps / 16p13 2 genes / 17A3 ReproductionAirway trypsin-like proteases 3 genes / 14p21 3 ps / 4q13 3 genes / 5E1 Host defence
Rat pseudogenesCalpain 13 1 ps / 6q12 1 gene / 2p23 1 gene / 17E2 Reproduction ?Pyroglutamyl-peptidase II 1 ps / 1q22 1 gene / 15q26 1 gene / 7C MetabolismGln-fructose-6-P transamidase 3 1 ps / Xq14 1 gene / Xq21 1 ps / XC3 MetabolismAminopeptidase MAMS/L-RAP 1 ps / 1q12 1 gene / 5q15 1 ps / 17A3 Host defenceCarboxypeptidase O 1 ps / 9q31 1 gene / 2q33 1 ps / 1C2 UnknownProcollagen III N-endopeptidase 1 ps / 19q12 1 gene / 16q24 1 ps / 8E2 Metabolism ?Kallikrein-2 and -3 2 ps / 1q21 2 genes / 19q13 1 ps / 7B2 ReproductionTestis-specific protein 50 1 ps / 8q32 1 gene / 3p21 1 gene / 9F2 Reproduction
...................................................................................................................................................................................................................................................................................................................................................................
articles
NATURE | VOL 428 | 1 APRIL 2004 | www.nature.com/nature514 © 2004 Nature Publishing Group
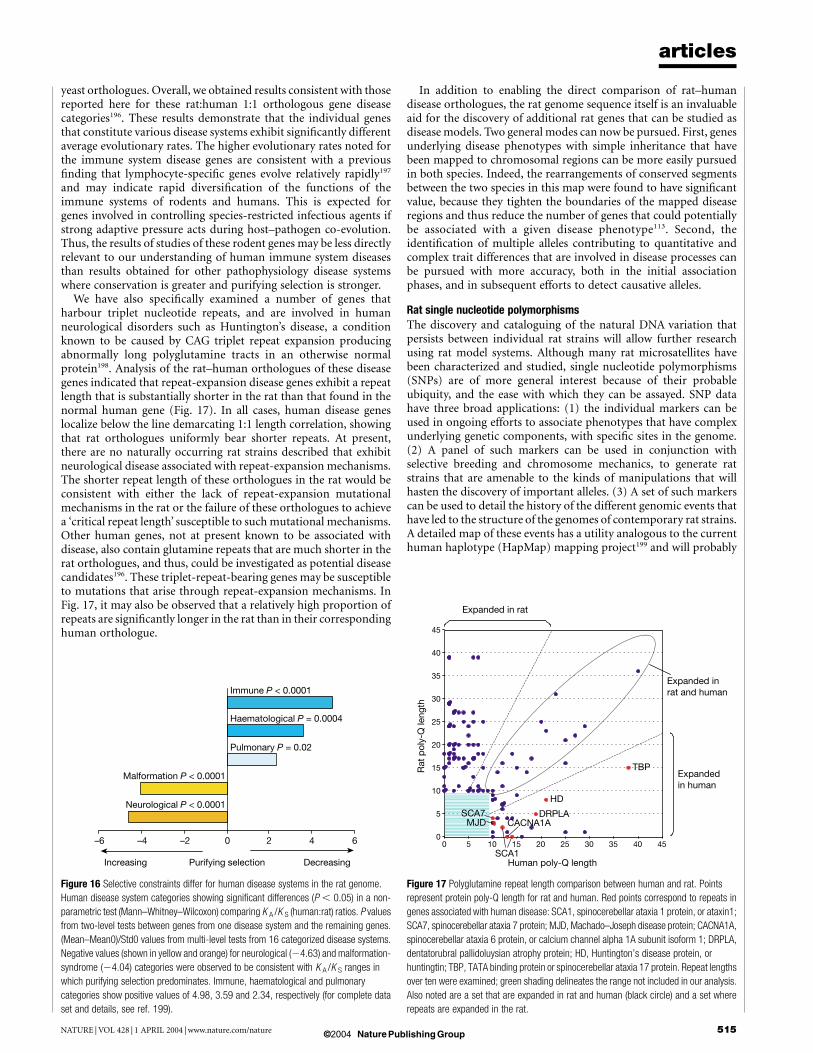
yeast orthologues. Overall, we obtained results consistent with thosereported here for these rat:human 1:1 orthologous gene diseasecategories196. These results demonstrate that the individual genesthat constitute various disease systems exhibit significantly differentaverage evolutionary rates. The higher evolutionary rates noted forthe immune system disease genes are consistent with a previousfinding that lymphocyte-specific genes evolve relatively rapidly197
and may indicate rapid diversification of the functions of theimmune systems of rodents and humans. This is expected forgenes involved in controlling species-restricted infectious agents ifstrong adaptive pressure acts during host–pathogen co-evolution.Thus, the results of studies of these rodent genes may be less directlyrelevant to our understanding of human immune system diseasesthan results obtained for other pathophysiology disease systemswhere conservation is greater and purifying selection is stronger.
We have also specifically examined a number of genes thatharbour triplet nucleotide repeats, and are involved in humanneurological disorders such as Huntington’s disease, a conditionknown to be caused by CAG triplet repeat expansion producingabnormally long polyglutamine tracts in an otherwise normalprotein198. Analysis of the rat–human orthologues of these diseasegenes indicated that repeat-expansion disease genes exhibit a repeatlength that is substantially shorter in the rat than that found in thenormal human gene (Fig. 17). In all cases, human disease geneslocalize below the line demarcating 1:1 length correlation, showingthat rat orthologues uniformly bear shorter repeats. At present,there are no naturally occurring rat strains described that exhibitneurological disease associated with repeat-expansion mechanisms.The shorter repeat length of these orthologues in the rat would beconsistent with either the lack of repeat-expansion mutationalmechanisms in the rat or the failure of these orthologues to achievea ‘critical repeat length’ susceptible to such mutational mechanisms.Other human genes, not at present known to be associated withdisease, also contain glutamine repeats that are much shorter in therat orthologues, and thus, could be investigated as potential diseasecandidates196. These triplet-repeat-bearing genes may be susceptibleto mutations that arise through repeat-expansion mechanisms. InFig. 17, it may also be observed that a relatively high proportion ofrepeats are significantly longer in the rat than in their correspondinghuman orthologue.
In addition to enabling the direct comparison of rat–humandisease orthologues, the rat genome sequence itself is an invaluableaid for the discovery of additional rat genes that can be studied asdisease models. Two general modes can now be pursued. First, genesunderlying disease phenotypes with simple inheritance that havebeen mapped to chromosomal regions can be more easily pursuedin both species. Indeed, the rearrangements of conserved segmentsbetween the two species in this map were found to have significantvalue, because they tighten the boundaries of the mapped diseaseregions and thus reduce the number of genes that could potentiallybe associated with a given disease phenotype113. Second, theidentification of multiple alleles contributing to quantitative andcomplex trait differences that are involved in disease processes canbe pursued with more accuracy, both in the initial associationphases, and in subsequent efforts to detect causative alleles.
Rat single nucleotide polymorphismsThe discovery and cataloguing of the natural DNA variation thatpersists between individual rat strains will allow further researchusing rat model systems. Although many rat microsatellites havebeen characterized and studied, single nucleotide polymorphisms(SNPs) are of more general interest because of their probableubiquity, and the ease with which they can be assayed. SNP datahave three broad applications: (1) the individual markers can beused in ongoing efforts to associate phenotypes that have complexunderlying genetic components, with specific sites in the genome.(2) A panel of such markers can be used in conjunction withselective breeding and chromosome mechanics, to generate ratstrains that are amenable to the kinds of manipulations that willhasten the discovery of important alleles. (3) A set of such markerscan be used to detail the history of the different genomic events thathave led to the structure of the genomes of contemporary rat strains.A detailed map of these events has a utility analogous to the currenthuman haplotype (HapMap) mapping project199 and will probably
Figure 16 Selective constraints differ for human disease systems in the rat genome.
Human disease system categories showing significant differences (P , 0.05) in a non-
parametric test (Mann–Whitney–Wilcoxon) comparing K A /K S (human:rat) ratios. P values
from two-level tests between genes from one disease system and the remaining genes.
(Mean–Mean0)/Std0 values from multi-level tests from 16 categorized disease systems.
Negative values (shown in yellow and orange) for neurological (24.63) and malformation-
syndrome (24.04) categories were observed to be consistent with K A /K S ranges in
which purifying selection predominates. Immune, haematological and pulmonary
categories show positive values of 4.98, 3.59 and 2.34, respectively (for complete data
set and details, see ref. 199).
Figure 17 Polyglutamine repeat length comparison between human and rat. Points
represent protein poly-Q length for rat and human. Red points correspond to repeats in
genes associated with human disease: SCA1, spinocerebellar ataxia 1 protein, or ataxin1;
SCA7, spinocerebellar ataxia 7 protein; MJD, Machado–Joseph disease protein; CACNA1A,
spinocerebellar ataxia 6 protein, or calcium channel alpha 1A subunit isoform 1; DRPLA,
dentatorubral pallidoluysian atrophy protein; HD, Huntington’s disease protein, or
huntingtin; TBP, TATA binding protein or spinocerebellar ataxia 17 protein. Repeat lengths
over ten were examined; green shading delineates the range not included in our analysis.
Also noted are a set that are expanded in rat and human (black circle) and a set where
repeats are expanded in the rat.
articles
NATURE | VOL 428 | 1 APRIL 2004 | www.nature.com/nature 515© 2004 Nature Publishing Group
aid disease gene identification, as recently suggested for themouse200.
The Rnor3.1 draft sequence was generated primarily from DNAof a single inbred rat line. This maximized the likelihood of derivingan accurate sequence assembly, but reduced any likely discovery ofnatural variation in this phase of the project. As a consequence therehas been no large-scale public SNP discovery from rat genomicsequencing. A pilot project based on coding (c)SNP discovery hasbeen initiated, however201, as these cSNPs represent a particularlyimportant subset of variants that may have direct functionalsignificance202. These data have illustrated both immediate appli-cations and the long-term potential for an effort aimed at compre-hensive SNP discovery.
ConclusionsAs the third mammalian genome to be sequenced, the rat genomehas provided both predictable and surprising information aboutmammalian species. Although it was clear at the outset of thisprogramme that ongoing rat research would benefit from theresource of a genome sequence, there was uncertainty about howmany new insights would be found, especially considering thesuperficial similarities between the rat and the already sequencedmouse. Instead, the results of the sequencing and analysis havegenerated some deep insights into the evolutionary processes thathave given rise to these different species. In addition, the project hasbeen invaluable in further developing the methods for the gener-ation and analysis of large genome sequence data sets.
The generation of the rat draft tested the new ‘combinedapproach’ for large genome sequencing. As the overall assembly isof high quality, there is no doubt that this overall strategy, and thesupporting software we have developed, provides a suitableapproach for this problem. Because we included a BAC ‘skimming’component in the underlying data set, the assembly recovered afraction of the genome that was expected, by analogy to the mouseproject, to be difficult to assemble from pure WGS data. In addition,the BAC skimming component allowed progressive generation ofhigh-quality local assemblies that were of use to the rat researchcommunity as the project developed. On the other hand, althoughthe BAC component used here was far less expensive than the fullyordered and highly redundant set used in the hierarchical approachto sequencing the human genome, it nevertheless increased theoverall cost of data production relative to a WGS approach.
The issue of efficacy of WGS versus other approaches to thesequencing of large genomes remains a matter of earnest scientificdebate. In ongoing projects at different centres that participated inthe RGSP consortium, different approaches are being used to tacklenew genomes. These include pure WGS methods, the combinedapproach and variations on that methodology. The future appli-cation of the different procedures depends on the target genomesizes, the expected degree of heterogeneity (that is, polymorphism)in the organism to be sequenced, and the preferences of theindividual centre. So far, all the genomes that have been analysedby RGSP consortium members have been of high quality and weanticipate that this will continue as the benefits and disadvantages ofdifferent approaches are further studied and analysed.
The rat genome data have improved the utility of the rat modelenormously. Now that near-complete knowledge of the rat genecontent is realizable, individual researchers have a data source forthe rat ‘parts list’ that can be explored with the high degree ofconfidence and precision that is appropriate for biomedicalresearch. A similar improvement has been made in the resourcesfor physical and genetic mapping, because the relative position ofindividual markers is now known with high confidence and thereare now computational resources to bridge the process of geneticassociation with gene modelling and experimental investigation.These advances have been reflected by measured increases in the useof all the rat-specific public genome data sets that can be accessed
online, as well as by the informally assessed increases in overall‘genomic’ research of this model.
The expected benefit of a third mammalian sequence providingan outgroup by which to discriminate the timing of events that hadalready been noted between mouse and human was fully realized.Using the three sequences and other partial data sets fromadditional organisms, it was possible to measure some of the overallfaster rate of evolutionary change in the rodent lineage shared bymice and rats, as well as the peculiar acceleration of some aspects ofrat-specific evolution. The observation of specific expanded genefamilies in the rat should provide material for targeted studies forsome time.
At this time there is no plan to further upgrade or finish the ratgenome sequence. This programme decision is a consequence of thehigh cost of converting draft sequence to finished data, and thepressing need to analyse new genomes. However, as the distantobjective of very-low-cost sequencing or other advances that canimprove draft sequences inexpensively are realized, it might beenvisioned that a rat sequence that approaches the quality ofthe current human data will be produced. A finished rat genomemay answer many questions, as specific clues already show thatareas of the genome that are most difficult to resolve in arandom sequencing project are also those areas that are mostdynamic, and therefore of high potential interest in an evolutionarycontext.
Despite the advances represented here, we are clearly still at thebeginning of the full analysis of the mammalian genome and itscomplex evolutionary history. Much of the additional data that arerequired to complete this story will be from other genomes,distantly related to rat. Nevertheless, a considerable body of dataremains to be developed from this species. In addition to the distantprospect of a finished rat genome, analysis of other rat strains mayyield genome-wide polymorphism data, while targeted efforts togenerate cDNA clone collections will provide rat-specific reagentsfor routine use in research. Together with the ongoing efforts to fullydevelop methods to genetically manipulate whole rats and provideeffective ‘gene knockouts’, the current and future rat genomeresources will ensure a place for this organism in genomic andbiomedical research for some time. A
MethodsDNA sequencing and data accessPaired-end reads from BAC and WGS libraries were produced as previously described2,203.Unprocessed sequence reads are available from the NCBI Trace Archive (ftp://ftp.ncbi.nih.gov/pub/TraceDB/rattus_norvegicus/); raw eBAC assembly data are availablefrom the BCM-HGSC (http://www.hgsc.bcm.tmc.edu/Rat/); and the released Rnor3.1assembly is available from the BCM-HGSC (ftp://ftp.hgsc.bcm.tmc.edu/pub/analysis/rat/), the NCBI (ftp://ftp.ncbi.nih.gov/genomes/R_norvegicus), and the UCSC (http://genome.ucsc.edu/downloads.html).
Genome assemblyAssembly of the rat genome by the Atlas system is described in detail elsewhere54. Earlierassemblies (Rnor2.0/2.1) of the initial data set were based on 40 million total reads and19,000 BAC skims. These assemblies spanned 2.66 Gb and comprised over 900 ultrabactigswith N 50 of over 5 Mb. They differed only in the removal of short artefactual duplicationsfrom Rnor2.0. Rnor3.1 includes another 1,100 BACs, selected to fill gaps in Rnor2.1.Because of the comprehensive coverage of the genome by Rnor2.0/2.1, it was used for theinitial predictions of genes and proteins.
BAC fingerprintsAn agarose-gel-based fingerprinting methodology204–207 was employed to generate HindIIIfingerprints from 199,782 clones in the CHORI-230 BAC library. The contig assembly wassubjected to manual review and editing to refine clone order within contigs and to makemerges between contigs, using tools provided in the FPC software208–210. Fingerprints for5,250 RPCI-31 PACs211 and RPCI-32 BACs were subsequently added to allow correlationbetween the fingerprint map and a developing YAC map of the rat genome. BAC and PACclones are available through BACPAC Resources at CHORI ([email protected]).
BAC, PAC and YAC mapsMarkers generated from BAC and PAC clones were hybridized against YAC58 (R.D.,Pmatch, unpublished software) and radiation hybrid libraries61,212 to produceindependent maps that were subsequently combined. Genetic markers from two rat
articles
NATURE | VOL 428 | 1 APRIL 2004 | www.nature.com/nature516 © 2004 Nature Publishing Group
genetic maps61 and the radiation hybrid map59 were aligned to the Rnor3.1 assemblyusing BLAT123 (when sequence was available) or electronic polymerase chain reaction(EPCR)213.
Finished sequence used for quality assessment of the assemblyTo assess the accuracy of the Atlas assembly, the Rnor3.1 sequence was compared to 13 Mbof sequences that had been finished to high quality.
Large-scale rearrangementsWe compared these assemblies: Human (April 2003, NCBI build 33); Mouse (February2003, NCBI build 30); and Rat (June 2003, Rnor3.1). Repeats were masked usingRepeatMasker (A.S. & P. Green, unpublished work; see http://ftp.genome.washington.edu/RM/RepeatMasker.html) and TandemRepeatFinder214. Local alignmentswere produced using PatternHunter70 (Supplementary Information). Repeatcontamination was removed and the remaining similarities combined into two- and three-way anchors73 and synteny blocks produced at various resolutions using GRIMM-Synteny71.
Genome-wide visualization of conserved syntenyPairwise comparisons of the genomes of human, mouse and rat using MULTIZ69,215,MLAGAN216,217, MAVID110, PatternHunter70 and Pash72 were merged into blocks ofconserved synteny69,71,72, and the 1-Mb-resolution images were displayed using the VirtualGenome Painting method (M.L.G.-G. et al., unpublished work; http://www.genboree.org).
Rat segmental duplicationsSegmental duplications .5 kb were identified, extracted and aligned as described218, andparalogous sequence relationships were assessed using PARASIGHT visualization software(J.A.B., unpublished work; Supplementary Information).
Venn diagramPairwise and three-way alignments generated using BLASTZ219 and MULTIZ215 orHUMOR215 were analysed to classify each nucleotide in the three genomes by the specieswith which it aligns: in all three species, aligning between human and rat (but not mouse),between human and mouse (but not rat), or between mouse and rat (but not human).Other nucleotides are species-specific; unassigned nucleotides occupying gaps in thegenome assemblies were excluded. On the basis of output from RepeatMasker164 andRepeatDater89, nucleotides were assigned to categories (of non-repetitive, repetitive with acertain ancestry, or repetitive but unassigned) and counted. See Supplementary Table SI-1for details.
Gene predictionENSEMBL transcript models were built from 28,478 rodent proteins that were aligned tothe genome using a combination of Pmatch (R.D., unpublished software), BLAST220 andGeneWise221. Models based on 5,083 vertebrate proteins were added in regions withoutrodent-protein-based models. UTRs were added using 11,170 transcripts built from 8,615different rat cDNAs aligned to the genome using BLAT, with coverage $90% and identity$95%. This procedure (as described112 but without GENSCAN predictions), gave rise to18,241 genes and 20,373 transcripts. This is the protein-based gene set. Rat and mousecDNA and rat EST-based gene sets were also built. See Supplementary Information fordetails.
Non-processed pseudogene identificationHuman and mouse genes related by 1:1 orthology and lacking an apparent rat orthologuewere considered. See Supplementary Information for details.
High-resolution analyses of chromosome 10These were performed predominantly on the whole genome alignments217. Plots in Fig. 9were generated by sliding windows of width 2 Mb and a step size of 400 kb (total ¼ 277windows). See Supplementary Information for details.
Received 31 December 2003; accepted 20 February 2004; doi:10.1038/nature02426.
1. Darwin, C. On The Origin of Species by Means of Natural Selection 1st edn, Ch. 4, 108 (John Murray,
London, 1859).
2. International Human Genome Sequencing Consortium. Initial sequencing and analysis of the human
genome. Nature 409, 860–921 (2001).
3. Mouse Genome Sequencing Consortium. Initial sequencing and comparative analysis of the mouse
genome. Nature 420, 520–562 (2002).
4. Adkins, R. M., Gelke, E. L., Rowe, D. & Honeycutt, R. L. Molecular phylogeny and divergence time
estimates for major rodent groups: evidence from multiple genes. Mol. Biol. Evol. 18, 777–791 (2001).
5. Springer, M. S., Murphy, W. J., Eizirik, E. & O’Brien, S. J. Placental mammal diversification and the
Cretaceous-Tertiary boundary. Proc. Natl Acad. Sci. USA 100, 1056–1061 (2003).
6. Canby, T. Y. The rat, lapdog of the devil. Nat. Geogr. July, 60–87 (1977).
7. Robinson, R. Genetics of the Norway Rat (Pergamon, Oxford, 1965).
8. Barnett, S. A. The Story of Rats. Their Impact on Us, and Our Impact on Them Ch. 2, 17–18 (Allen
and Unwin, Crows Nest, Australia, 2002).
9. Hedrich, H. J. in History, Strains, and Models in the Laboratory Rat (ed. Krinke, G. J.) 3–16
(Academic, San Diego, 2000).
10. Lindsey, J. R. in The Laboratory Rat (eds Baker, H. J., Lindsey, J. R. & Weisbroth, S. H.) 1–36
(Academic, New York, 1979).
11. Greenhouse, D. D., Festing, M. F. W., Hasan, S. & Cohen, A. L. in Genetic Monitoring of Inbred
Strains of Rats (ed. Hedrich, H. J.) 410–480 (Gustav Fischer, Stuttgart, 1990).
12. Kuntz, C. et al. Comparison of laparoscopic versus conventional technique in colonic and liver
resection in a tumor-bearing small animal model. Surg. Endosc. 16, 1175–1181 (2002).
13. Kitagawa, K., Hamada, Y., Nakai, K., Kato, Y. & Okumura, T. Comparison of one- and two-step
procedures in a rat model of small bowel transplantation. Transplant. Proc. 34, 1030–1032
(2002).
14. Sauve, Y., Girman, S. V., Wang, S., Keegan, D. J. & Lund, R. D. Preservation of visual responsiveness
in the superior colliculus of RCS rats after retinal pigment epithelium cell transplantation.
Neuroscience 114, 389–401 (2002).
15. Wang, H. et al. Attenuation of acute xenograft rejection by short-term treatment with LF15–0195
and monoclonal antibody against CD45RB in a rat-to-mouse cardiac transplantation model.
Transplantation 75, 1475–1481 (2003).
16. Alves, A. et al. Total vascular exclusion of the liver enhances the efficacy of retroviral-mediated
associated thymidine kinase and interleukin-2 genes transfer against multiple hepatic tumors in
rats. Surgery 133, 669–677 (2003).
17. Liu, M. Y., Poellinger, L. & Walker, C. L. Up-regulation of hypoxia-inducible factor 2a in renal
cell carcinoma associated with loss of Tsc-2 tumor suppressor gene. Cancer Res. 63, 2675–2680
(2003).
18. Jin, X. et al. Effects of leptin on endothelial function with OB-Rb gene transfer in Zucker fatty rats.
Atherosclerosis 169, 225–233 (2003).
19. Ravingerova, T., Neckar, J. & Kolar, F. Ischemic tolerance of rat hearts in acute and chronic phases of
experimental diabetes. Mol. Cell. Biochem. 249, 167–174 (2003).
20. Taylor, J. R. et al. An animal model of Tourette’s syndrome. Am. J. Psychiatry 159, 657–660
(2002).
21. Smyth, M. D., Barbaro, N. M. & Baraban, S. C. Effects of antiepileptic drugs on induced
epileptiform activity in a rat model of dysplasia. Epilepsy Res. 50, 251–264 (2002).
22. McBride, W. J. & Li, T. K. Animal models of alcoholism: neurobiology of high alcohol-drinking
behavior in rodents. Crit. Rev. Neurobiol. 12, 339–369 (1998).
23. Crisci, A. R. & Ferreira, A. L. Low-intensity pulsed ultrasound accelerates the regeneration of the
sciatic nerve after neurotomy in rats. Ultrasound Med. Biol. 28, 1335–1341 (2002).
24. Ozkan, O. et al. Reinnervation of denervated muscle in a split-nerve transfer model. Ann. Plast.
Surg. 49, 532–540 (2002).
25. Fray, M. J., Dickinson, R. P., Huggins, J. P. & Occleston, N. L. A potent, selective inhibitor of matrix
metalloproteinase-3 for the topical treatment of chronic dermal ulcers. J. Med. Chem. 46,
3514–3525 (2003).
26. Petratos, P. B. et al. Full-thickness human foreskin transplantation onto nude rats as an in vivo
model of acute human wound healing. Plast. Reconstr. Surg. 111, 1988–1997 (2003).
27. Hussar, P. et al. Bone healing models in rat tibia after different injuries. Ann. Chir. Gynaecol. 90,
271–279 (2001).
28. Yang, T. D., Pei, J. S., Yang, S. L., Liu, Z. Q. & Sun, R. L. Medical prevention of space motion
sickness–animal model of therapeutic effect of a new medicine on motion sickness. Adv. Space Res.
30, 751–755 (2002).
29. Forte, A. et al. Stenosis progression after surgical injury in Milan hypertensive rat carotid arteries.
Cardiovasc. Res. 60, 654–663 (2003).
30. Komamura, K. et al. Differential gene expression in the rat skeletal and heart muscle in
glucocorticoid-induced myopathy: analysis by microarray. Cardiovasc. Drugs Ther. 17, 303–310
(2003).
31. McBride, M. W. et al. Functional genomics in rodent models of hypertension. J. Physiol. (Lond.)
554, 56–63 (2004).
32. Kasteleijn-Nolst Trenite, D. G. & Hirsch, E. Levetiracetam: preliminary efficacy in generalized
seizures. Epileptic Disord. 5, S39–S44 (2003).
33. Malik, A. S. et al. A novel dehydroepiandrosterone analog improves functional recovery in a rat
traumatic brain injury model. J. Neurotrauma 20, 463–476 (2003).
34. Kostrubsky, V. E. et al. Evaluation of hepatotoxic potential of drugs by inhibition of bile acid
transport in cultured primary human hepatocytes and intact rats. Toxicol. Sci. 76, 220–228
(2003).
35. Lindon, J. C. et al. Contemporary issues in toxicology: the role of metabonomics in toxicology and
its evaluation by the COMET project. Toxicol. Appl. Pharmacol. 187, 137–146 (2003).
36. Tam, R. C. et al. The ribavirin analog ICN 17261 demonstrates reduced toxicity and antiviral effects
with retention of both immunomodulatory activity and reduction of hepatitis-induced serum
alanine aminotransferase levels. Antimicrob. Agents Chemother. 44, 1276–1283 (2000).
37. Youssef, A. F., Turck, P. & Fort, F. L. Safety and pharmacokinetics of oral lansoprazole in
preadolescent rats exposed from weaning through sexual maturity. Reprod. Toxicol. 17, 109–116
(2003).
38. National Institutes of Health. Network for Large-Scale Sequencing of the Rat Genome khttp://
grants2.nih.gov/grants/guide/rfa-files/RFA-HG-00-002.htmll (2000).
39. Aparicio, S. et al. Whole-genome shotgun assembly and analysis of the genome of Fugu rubripes.
Science 297, 1301–1310 (2002).
40. Yu, J. et al. A draft sequence of the rice genome (Oryza sativa L. ssp. indica). Science 296, 79–92
(2002).
41. Goff, S. A. et al. A draft sequence of the rice genome (Oryza sativa L. ssp. japonica). Science 296,
92–100 (2002).
42. Adams, M. D. et al. The genome sequence of Drosophila melanogaster. Science 287, 2185–2195
(2000).
43. Dehal, P. et al. The draft genome of Ciona intestinalis: insights into chordate and vertebrate origins.
Science 298, 2157–2167 (2002).
44. Myers, E. W. et al. A whole-genome assembly of Drosophila. Science 287, 2196–2204 (2000).
45. Myers, E. W., Sutton, G. G., Smith, H. O., Adams, M. D. & Venter, J. C. On the sequencing and
assembly of the human genome. Proc. Natl Acad. Sci. USA 99, 4145–4146 (2002).
46. Waterston, R. H., Lander, E. S. & Sulston, J. E. On the sequencing of the human genome. Proc. Natl
Acad. Sci. USA 99, 3712–3716 (2002).
47. Waterston, R. H., Lander, E. S. & Sulston, J. E. More on the sequencing of the human genome. Proc.
Natl Acad. Sci. USA 100, 3022–3024 (2003); author reply (100), 3025–3026 (2003).
48. Green, P. Whole-genome disassembly. Proc. Natl Acad. Sci. USA 99, 4143–4144 (2002).
49. Batzoglou, S. et al. ARACHNE: a whole-genome shotgun assembler. Genome Res. 12, 177–189
(2002).
articles
NATURE | VOL 428 | 1 APRIL 2004 | www.nature.com/nature 517© 2004 Nature Publishing Group
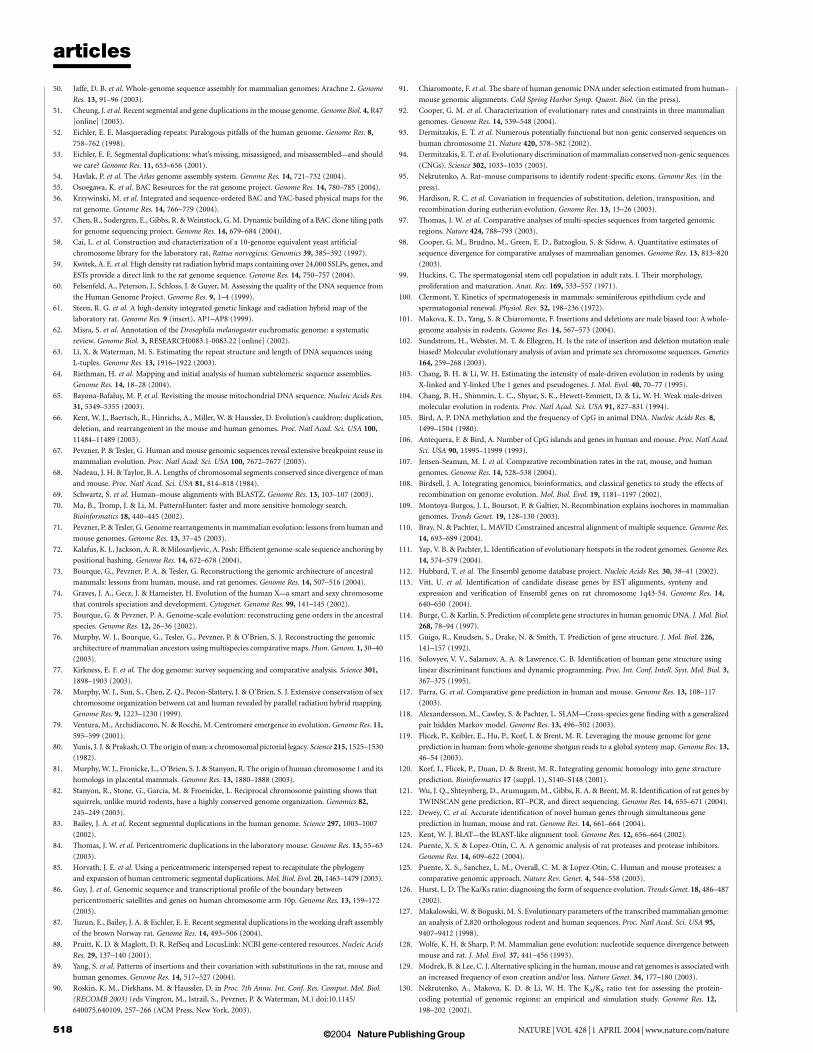
50. Jaffe, D. B. et al. Whole-genome sequence assembly for mammalian genomes: Arachne 2. Genome
Res. 13, 91–96 (2003).
51. Cheung, J. et al. Recent segmental and gene duplications in the mouse genome. Genome Biol. 4, R47
[online] (2003).
52. Eichler, E. E. Masquerading repeats: Paralogous pitfalls of the human genome. Genome Res. 8,
758–762 (1998).
53. Eichler, E. E. Segmental duplications: what’s missing, misassigned, and misassembled—and should
we care? Genome Res. 11, 653–656 (2001).
54. Havlak, P. et al. The Atlas genome assembly system. Genome Res. 14, 721–732 (2004).
55. Osoegawa, K. et al. BAC Resources for the rat genome project. Genome Res. 14, 780–785 (2004).
56. Krzywinski, M. et al. Integrated and sequence-ordered BAC and YAC-based physical maps for the
rat genome. Genome Res. 14, 766–779 (2004).
57. Chen, R., Sodergren, E., Gibbs, R. & Weinstock, G. M. Dynamic building of a BAC clone tiling path
for genome sequencing project. Genome Res. 14, 679–684 (2004).
58. Cai, L. et al. Construction and characterization of a 10-genome equivalent yeast artificial
chromosome library for the laboratory rat, Rattus norvegicus. Genomics 39, 385–392 (1997).
59. Kwitek, A. E. et al. High density rat radiation hybrid maps containing over 24,000 SSLPs, genes, and
ESTs provide a direct link to the rat genome sequence. Genome Res. 14, 750–757 (2004).
60. Felsenfeld, A., Peterson, J., Schloss, J. & Guyer, M. Assessing the quality of the DNA sequence from
the Human Genome Project. Genome Res. 9, 1–4 (1999).
61. Steen, R. G. et al. A high-density integrated genetic linkage and radiation hybrid map of the
laboratory rat. Genome Res. 9 (insert), AP1–AP8 (1999).
62. Misra, S. et al. Annotation of the Drosophila melanogaster euchromatic genome: a systematic
review. Genome Biol. 3, RESEARCH0083.1-0083.22 [online] (2002).
63. Li, X. & Waterman, M. S. Estimating the repeat structure and length of DNA sequences using
L-tuples. Genome Res. 13, 1916–1922 (2003).
64. Riethman, H. et al. Mapping and initial analysis of human subtelomeric sequence assemblies.
Genome Res. 14, 18–28 (2004).
65. Bayona-Bafaluy, M. P. et al. Revisiting the mouse mitochondrial DNA sequence. Nucleic Acids Res.
31, 5349–5355 (2003).
66. Kent, W. J., Baertsch, R., Hinrichs, A., Miller, W. & Haussler, D. Evolution’s cauldron: duplication,
deletion, and rearrangement in the mouse and human genomes. Proc. Natl Acad. Sci. USA 100,
11484–11489 (2003).
67. Pevzner, P. & Tesler, G. Human and mouse genomic sequences reveal extensive breakpoint reuse in
mammalian evolution. Proc. Natl Acad. Sci. USA 100, 7672–7677 (2003).
68. Nadeau, J. H. & Taylor, B. A. Lengths of chromosomal segments conserved since divergence of man
and mouse. Proc. Natl Acad. Sci. USA 81, 814–818 (1984).
69. Schwartz, S. et al. Human–mouse alignments with BLASTZ. Genome Res. 13, 103–107 (2003).
70. Ma, B., Tromp, J. & Li, M. PatternHunter: faster and more sensitive homology search.
Bioinformatics 18, 440–445 (2002).
71. Pevzner, P. & Tesler, G. Genome rearrangements in mammalian evolution: lessons from human and
mouse genomes. Genome Res. 13, 37–45 (2003).
72. Kalafus, K. J., Jackson, A. R. & Milosavljevic, A. Pash: Efficient genome-scale sequence anchoring by
positional hashing. Genome Res. 14, 672–678 (2004).
73. Bourque, G., Pevzner, P. A. & Tesler, G. Reconstructiong the genomic architecture of ancestral
mammals: lessons from human, mouse, and rat genomes. Genome Res. 14, 507–516 (2004).
74. Graves, J. A., Gecz, J. & Hameister, H. Evolution of the human X—a smart and sexy chromosome
that controls speciation and development. Cytogenet. Genome Res. 99, 141–145 (2002).
75. Bourque, G. & Pevzner, P. A. Genome-scale evolution: reconstructing gene orders in the ancestral
species. Genome Res. 12, 26–36 (2002).
76. Murphy, W. J., Bourque, G., Tesler, G., Pevzner, P. & O’Brien, S. J. Reconstructing the genomic
architecture of mammalian ancestors using multispecies comparative maps. Hum. Genom. 1, 30–40
(2003).
77. Kirkness, E. F. et al. The dog genome: survey sequencing and comparative analysis. Science 301,
1898–1903 (2003).
78. Murphy, W. J., Sun, S., Chen, Z. Q., Pecon-Slattery, J. & O’Brien, S. J. Extensive conservation of sex
chromosome organization between cat and human revealed by parallel radiation hybrid mapping.
Genome Res. 9, 1223–1230 (1999).
79. Ventura, M., Archidiacono, N. & Rocchi, M. Centromere emergence in evolution. Genome Res. 11,
595–599 (2001).
80. Yunis, J. J. & Prakash, O. The origin of man: a chromosomal pictorial legacy. Science 215, 1525–1530
(1982).
81. Murphy, W. J., Fronicke, L., O’Brien, S. J. & Stanyon, R. The origin of human chromosome 1 and its
homologs in placental mammals. Genome Res. 13, 1880–1888 (2003).
82. Stanyon, R., Stone, G., Garcia, M. & Froenicke, L. Reciprocal chromosome painting shows that
squirrels, unlike murid rodents, have a highly conserved genome organization. Genomics 82,
245–249 (2003).
83. Bailey, J. A. et al. Recent segmental duplications in the human genome. Science 297, 1003–1007
(2002).
84. Thomas, J. W. et al. Pericentromeric duplications in the laboratory mouse. Genome Res. 13, 55–63
(2003).
85. Horvath, J. E. et al. Using a pericentromeric interspersed repeat to recapitulate the phylogeny
and expansion of human centromeric segmental duplications. Mol. Biol. Evol. 20, 1463–1479 (2003).
86. Guy, J. et al. Genomic sequence and transcriptional profile of the boundary between
pericentromeric satellites and genes on human chromosome arm 10p. Genome Res. 13, 159–172
(2003).
87. Tuzun, E., Bailey, J. A. & Eichler, E. E. Recent segmental duplications in the working draft assembly
of the brown Norway rat. Genome Res. 14, 493–506 (2004).
88. Pruitt, K. D. & Maglott, D. R. RefSeq and LocusLink: NCBI gene-centered resources. Nucleic Acids
Res. 29, 137–140 (2001).
89. Yang, S. et al. Patterns of insertions and their covariation with substitutions in the rat, mouse and
human genomes. Genome Res. 14, 517–527 (2004).
90. Roskin, K. M., Diekhans, M. & Haussler, D. in Proc. 7th Annu. Int. Conf. Res. Comput. Mol. Biol.
(RECOMB 2003) (eds Vingron, M., Istrail, S., Pevzner, P. & Waterman, M.) doi:10.1145/
640075.640109, 257–266 (ACM Press, New York, 2003).
91. Chiaromonte, F. et al. The share of human genomic DNA under selection estimated from human–
mouse genomic alignments. Cold Spring Harbor Symp. Quant. Biol. (in the press).
92. Cooper, G. M. et al. Characterization of evolutionary rates and constraints in three mammalian
genomes. Genome Res. 14, 539–548 (2004).
93. Dermitzakis, E. T. et al. Numerous potentially functional but non-genic conserved sequences on
human chromosome 21. Nature 420, 578–582 (2002).
94. Dermitzakis, E. T. et al. Evolutionary discrimination of mammalian conserved non-genic sequences
(CNGs). Science 302, 1033–1035 (2003).
95. Nekrutenko, A. Rat–mouse comparisons to identify rodent-specific exons. Genome Res. (in the
press).
96. Hardison, R. C. et al. Covariation in frequencies of substitution, deletion, transposition, and
recombination during eutherian evolution. Genome Res. 13, 13–26 (2003).
97. Thomas, J. W. et al. Comparative analyses of multi-species sequences from targeted genomic
regions. Nature 424, 788–793 (2003).
98. Cooper, G. M., Brudno, M., Green, E. D., Batzoglou, S. & Sidow, A. Quantitative estimates of
sequence divergence for comparative analyses of mammalian genomes. Genome Res. 13, 813–820
(2003).
99. Huckins, C. The spermatogonial stem cell population in adult rats. I. Their morphology,
proliferation and maturation. Anat. Rec. 169, 533–557 (1971).
100. Clermont, Y. Kinetics of spermatogenesis in mammals: seminiferous epithelium cycle and
spermatogonial renewal. Physiol. Rev. 52, 198–236 (1972).
101. Makova, K. D., Yang, S. & Chiaromonte, F. Insertions and deletions are male biased too: A whole-
genome analysis in rodents. Genome Res. 14, 567–573 (2004).
102. Sundstrom, H., Webster, M. T. & Ellegren, H. Is the rate of insertion and deletion mutation male
biased? Molecular evolutionary analysis of avian and primate sex chromosome sequences. Genetics
164, 259–268 (2003).
103. Chang, B. H. & Li, W. H. Estimating the intensity of male-driven evolution in rodents by using
X-linked and Y-linked Ube 1 genes and pseudogenes. J. Mol. Evol. 40, 70–77 (1995).
104. Chang, B. H., Shimmin, L. C., Shyue, S. K., Hewett-Emmett, D. & Li, W. H. Weak male-driven
molecular evolution in rodents. Proc. Natl Acad. Sci. USA 91, 827–831 (1994).
105. Bird, A. P. DNA methylation and the frequency of CpG in animal DNA. Nucleic Acids Res. 8,
1499–1504 (1980).
106. Antequera, F. & Bird, A. Number of CpG islands and genes in human and mouse. Proc. Natl Acad.
Sci. USA 90, 11995–11999 (1993).
107. Jensen-Seaman, M. I. et al. Comparative recombination rates in the rat, mouse, and human
genomes. Genome Res. 14, 528–538 (2004).
108. Birdsell, J. A. Integrating genomics, bioinformatics, and classical genetics to study the effects of
recombination on genome evolution. Mol. Biol. Evol. 19, 1181–1197 (2002).
109. Montoya-Burgos, J. I., Boursot, P. & Galtier, N. Recombination explains isochores in mammalian
genomes. Trends Genet. 19, 128–130 (2003).
110. Bray, N. & Pachter, L. MAVID Constrained ancestral alignment of multiple sequence. Genome Res.
14, 693–699 (2004).
111. Yap, V. B. & Pachter, L. Identification of evolutionary hotspots in the rodent genomes. Genome Res.
14, 574–579 (2004).
112. Hubbard, T. et al. The Ensembl genome database project. Nucleic Acids Res. 30, 38–41 (2002).
113. Vitt, U. et al. Identification of candidate disease genes by EST alignments, synteny and
expression and verification of Ensembl genes on rat chromosome 1q43-54. Genome Res. 14,
640–650 (2004).
114. Burge, C. & Karlin, S. Prediction of complete gene structures in human genomic DNA. J. Mol. Biol.
268, 78–94 (1997).
115. Guigo, R., Knudsen, S., Drake, N. & Smith, T. Prediction of gene structure. J. Mol. Biol. 226,
141–157 (1992).
116. Solovyev, V. V., Salamov, A. A. & Lawrence, C. B. Identification of human gene structure using
linear discriminant functions and dynamic programming. Proc. Int. Conf. Intell. Syst. Mol. Biol. 3,
367–375 (1995).
117. Parra, G. et al. Comparative gene prediction in human and mouse. Genome Res. 13, 108–117
(2003).
118. Alexandersson, M., Cawley, S. & Pachter, L. SLAM—Cross-species gene finding with a generalized
pair hidden Markov model. Genome Res. 13, 496–502 (2003).
119. Flicek, P., Keibler, E., Hu, P., Korf, I. & Brent, M. R. Leveraging the mouse genome for gene
prediction in human: from whole-genome shotgun reads to a global synteny map. Genome Res. 13,
46–54 (2003).
120. Korf, I., Flicek, P., Duan, D. & Brent, M. R. Integrating genomic homology into gene structure
prediction. Bioinformatics 17 (suppl. 1), S140–S148 (2001).
121. Wu, J. Q., Shteynberg, D., Arumugam, M., Gibbs, R. A. & Brent, M. R. Identification of rat genes by
TWINSCAN gene prediction, RT–PCR, and direct sequencing. Genome Res. 14, 655–671 (2004).
122. Dewey, C. et al. Accurate identification of novel human genes through simultaneous gene
prediction in human, mouse and rat. Genome Res. 14, 661–664 (2004).
123. Kent, W. J. BLAT—the BLAST-like alignment tool. Genome Res. 12, 656–664 (2002).
124. Puente, X. S. & Lopez-Otin, C. A. A genomic analysis of rat proteases and protease inhibitors.
Genome Res. 14, 609–622 (2004).
125. Puente, X. S., Sanchez, L. M., Overall, C. M. & Lopez-Otin, C. Human and mouse proteases: a
comparative genomic approach. Nature Rev. Genet. 4, 544–558 (2003).
126. Hurst, L. D. The Ka/Ks ratio: diagnosing the form of sequence evolution. Trends Genet. 18, 486–487
(2002).
127. Makalowski, W. & Boguski, M. S. Evolutionary parameters of the transcribed mammalian genome:
an analysis of 2,820 orthologous rodent and human sequences. Proc. Natl Acad. Sci. USA 95,
9407–9412 (1998).
128. Wolfe, K. H. & Sharp, P. M. Mammalian gene evolution: nucleotide sequence divergence between
mouse and rat. J. Mol. Evol. 37, 441–456 (1993).
129. Modrek, B. & Lee, C. J. Alternative splicing in the human, mouse and rat genomes is associated with
an increased frequency of exon creation and/or loss. Nature Genet. 34, 177–180 (2003).
130. Nekrutenko, A., Makova, K. D. & Li, W. H. The KA/KS ratio test for assessing the protein-
coding potential of genomic regions: an empirical and simulation study. Genome Res. 12,
198–202 (2002).
articles
NATURE | VOL 428 | 1 APRIL 2004 | www.nature.com/nature518 © 2004 Nature Publishing Group
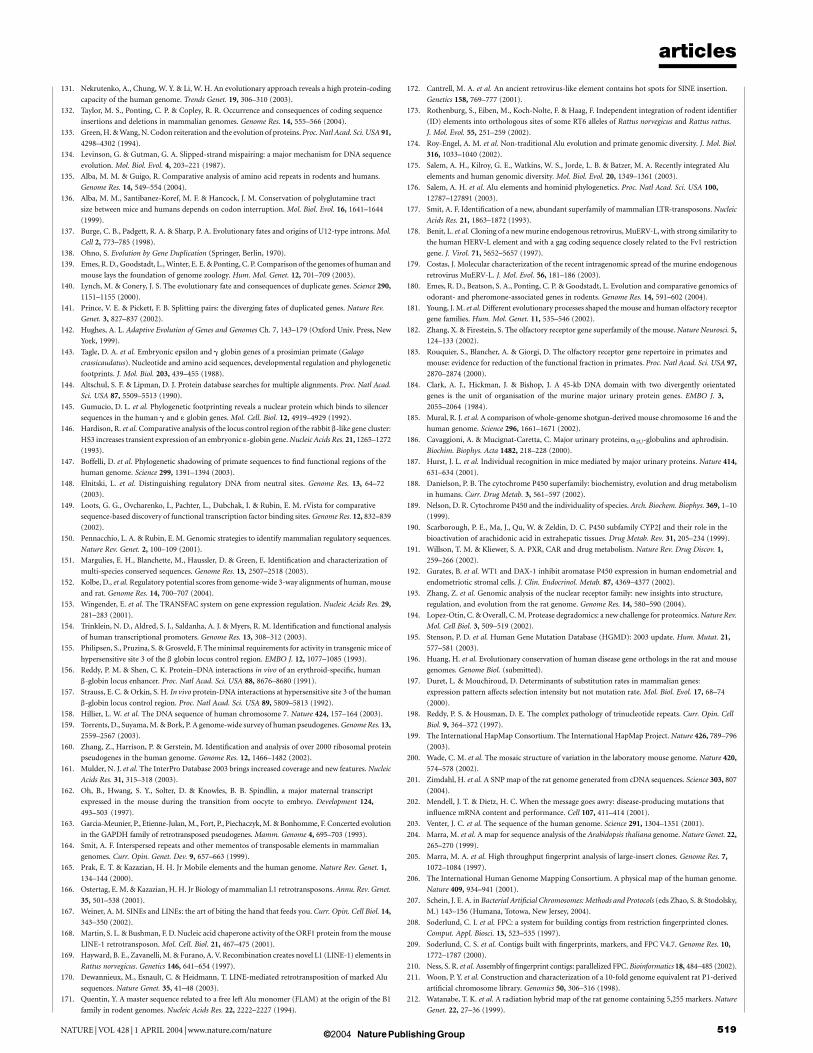
131. Nekrutenko, A., Chung, W. Y. & Li, W. H. An evolutionary approach reveals a high protein-coding
capacity of the human genome. Trends Genet. 19, 306–310 (2003).
132. Taylor, M. S., Ponting, C. P. & Copley, R. R. Occurrence and consequences of coding sequence
insertions and deletions in mammalian genomes. Genome Res. 14, 555–566 (2004).
133. Green, H. & Wang, N. Codon reiteration and the evolution of proteins. Proc. Natl Acad. Sci. USA 91,
4298–4302 (1994).
134. Levinson, G. & Gutman, G. A. Slipped-strand mispairing: a major mechanism for DNA sequence
evolution. Mol. Biol. Evol. 4, 203–221 (1987).
135. Alba, M. M. & Guigo, R. Comparative analysis of amino acid repeats in rodents and humans.
Genome Res. 14, 549–554 (2004).
136. Alba, M. M., Santibanez-Koref, M. F. & Hancock, J. M. Conservation of polyglutamine tract
size between mice and humans depends on codon interruption. Mol. Biol. Evol. 16, 1641–1644
(1999).
137. Burge, C. B., Padgett, R. A. & Sharp, P. A. Evolutionary fates and origins of U12-type introns. Mol.
Cell 2, 773–785 (1998).
138. Ohno, S. Evolution by Gene Duplication (Springer, Berlin, 1970).
139. Emes, R. D., Goodstadt, L., Winter, E. E. & Ponting, C. P. Comparison of the genomes of human and
mouse lays the foundation of genome zoology. Hum. Mol. Genet. 12, 701–709 (2003).
140. Lynch, M. & Conery, J. S. The evolutionary fate and consequences of duplicate genes. Science 290,
1151–1155 (2000).
141. Prince, V. E. & Pickett, F. B. Splitting pairs: the diverging fates of duplicated genes. Nature Rev.
Genet. 3, 827–837 (2002).
142. Hughes, A. L. Adaptive Evolution of Genes and Genomes Ch. 7, 143–179 (Oxford Univ. Press, New
York, 1999).
143. Tagle, D. A. et al. Embryonic epsilon and g globin genes of a prosimian primate (Galago
crassicaudatus). Nucleotide and amino acid sequences, developmental regulation and phylogenetic
footprints. J. Mol. Biol. 203, 439–455 (1988).
144. Altschul, S. F. & Lipman, D. J. Protein database searches for multiple alignments. Proc. Natl Acad.
Sci. USA 87, 5509–5513 (1990).
145. Gumucio, D. L. et al. Phylogenetic footprinting reveals a nuclear protein which binds to silencer
sequences in the human g and 1 globin genes. Mol. Cell. Biol. 12, 4919–4929 (1992).
146. Hardison, R. et al. Comparative analysis of the locus control region of the rabbit b-like gene cluster:
HS3 increases transient expression of an embryonic 1-globin gene. Nucleic Acids Res. 21, 1265–1272
(1993).
147. Boffelli, D. et al. Phylogenetic shadowing of primate sequences to find functional regions of the
human genome. Science 299, 1391–1394 (2003).
148. Elnitski, L. et al. Distinguishing regulatory DNA from neutral sites. Genome Res. 13, 64–72
(2003).
149. Loots, G. G., Ovcharenko, I., Pachter, L., Dubchak, I. & Rubin, E. M. rVista for comparative
sequence-based discovery of functional transcription factor binding sites. Genome Res. 12, 832–839
(2002).
150. Pennacchio, L. A. & Rubin, E. M. Genomic strategies to identify mammalian regulatory sequences.
Nature Rev. Genet. 2, 100–109 (2001).
151. Margulies, E. H., Blanchette, M., Haussler, D. & Green, E. Identification and characterization of
multi-species conserved sequences. Genome Res. 13, 2507–2518 (2003).
152. Kolbe, D., et al. Regulatory potential scores from genome-wide 3-way alignments of human, mouse
and rat. Genome Res. 14, 700–707 (2004).
153. Wingender, E. et al. The TRANSFAC system on gene expression regulation. Nucleic Acids Res. 29,
281–283 (2001).
154. Trinklein, N. D., Aldred, S. J., Saldanha, A. J. & Myers, R. M. Identification and functional analysis
of human transcriptional promoters. Genome Res. 13, 308–312 (2003).
155. Philipsen, S., Pruzina, S. & Grosveld, F. The minimal requirements for activity in transgenic mice of
hypersensitive site 3 of the b globin locus control region. EMBO J. 12, 1077–1085 (1993).
156. Reddy, P. M. & Shen, C. K. Protein–DNA interactions in vivo of an erythroid-specific, human
b-globin locus enhancer. Proc. Natl Acad. Sci. USA 88, 8676–8680 (1991).
157. Strauss, E. C. & Orkin, S. H. In vivo protein-DNA interactions at hypersensitive site 3 of the human
b-globin locus control region. Proc. Natl Acad. Sci. USA 89, 5809–5813 (1992).
158. Hillier, L. W. et al. The DNA sequence of human chromosome 7. Nature 424, 157–164 (2003).
159. Torrents, D., Suyama, M. & Bork, P. A genome-wide survey of human pseudogenes. Genome Res. 13,
2559–2567 (2003).
160. Zhang, Z., Harrison, P. & Gerstein, M. Identification and analysis of over 2000 ribosomal protein
pseudogenes in the human genome. Genome Res. 12, 1466–1482 (2002).
161. Mulder, N. J. et al. The InterPro Database 2003 brings increased coverage and new features. Nucleic
Acids Res. 31, 315–318 (2003).
162. Oh, B., Hwang, S. Y., Solter, D. & Knowles, B. B. Spindlin, a major maternal transcript
expressed in the mouse during the transition from oocyte to embryo. Development 124,
493–503 (1997).
163. Garcia-Meunier, P., Etienne-Julan, M., Fort, P., Piechaczyk, M. & Bonhomme, F. Concerted evolution
in the GAPDH family of retrotransposed pseudogenes. Mamm. Genome 4, 695–703 (1993).
164. Smit, A. F. Interspersed repeats and other mementos of transposable elements in mammalian
genomes. Curr. Opin. Genet. Dev. 9, 657–663 (1999).
165. Prak, E. T. & Kazazian, H. H. Jr Mobile elements and the human genome. Nature Rev. Genet. 1,
134–144 (2000).
166. Ostertag, E. M. & Kazazian, H. H. Jr Biology of mammalian L1 retrotransposons. Annu. Rev. Genet.
35, 501–538 (2001).
167. Weiner, A. M. SINEs and LINEs: the art of biting the hand that feeds you. Curr. Opin. Cell Biol. 14,
343–350 (2002).
168. Martin, S. L. & Bushman, F. D. Nucleic acid chaperone activity of the ORF1 protein from the mouse
LINE-1 retrotransposon. Mol. Cell. Biol. 21, 467–475 (2001).
169. Hayward, B. E., Zavanelli, M. & Furano, A. V. Recombination creates novel L1 (LINE-1) elements in
Rattus norvegicus. Genetics 146, 641–654 (1997).
170. Dewannieux, M., Esnault, C. & Heidmann, T. LINE-mediated retrotransposition of marked Alu
sequences. Nature Genet. 35, 41–48 (2003).
171. Quentin, Y. A master sequence related to a free left Alu monomer (FLAM) at the origin of the B1
family in rodent genomes. Nucleic Acids Res. 22, 2222–2227 (1994).
172. Cantrell, M. A. et al. An ancient retrovirus-like element contains hot spots for SINE insertion.
Genetics 158, 769–777 (2001).
173. Rothenburg, S., Eiben, M., Koch-Nolte, F. & Haag, F. Independent integration of rodent identifier
(ID) elements into orthologous sites of some RT6 alleles of Rattus norvegicus and Rattus rattus.
J. Mol. Evol. 55, 251–259 (2002).
174. Roy-Engel, A. M. et al. Non-traditional Alu evolution and primate genomic diversity. J. Mol. Biol.
316, 1033–1040 (2002).
175. Salem, A. H., Kilroy, G. E., Watkins, W. S., Jorde, L. B. & Batzer, M. A. Recently integrated Alu
elements and human genomic diversity. Mol. Biol. Evol. 20, 1349–1361 (2003).
176. Salem, A. H. et al. Alu elements and hominid phylogenetics. Proc. Natl Acad. Sci. USA 100,
12787–127891 (2003).
177. Smit, A. F. Identification of a new, abundant superfamily of mammalian LTR-transposons. Nucleic
Acids Res. 21, 1863–1872 (1993).
178. Benit, L. et al. Cloning of a new murine endogenous retrovirus, MuERV-L, with strong similarity to
the human HERV-L element and with a gag coding sequence closely related to the Fv1 restriction
gene. J. Virol. 71, 5652–5657 (1997).
179. Costas, J. Molecular characterization of the recent intragenomic spread of the murine endogenous
retrovirus MuERV-L. J. Mol. Evol. 56, 181–186 (2003).
180. Emes, R. D., Beatson, S. A., Ponting, C. P. & Goodstadt, L. Evolution and comparative genomics of
odorant- and pheromone-associated genes in rodents. Genome Res. 14, 591–602 (2004).
181. Young, J. M. et al. Different evolutionary processes shaped the mouse and human olfactory receptor
gene families. Hum. Mol. Genet. 11, 535–546 (2002).
182. Zhang, X. & Firestein, S. The olfactory receptor gene superfamily of the mouse. Nature Neurosci. 5,
124–133 (2002).
183. Rouquier, S., Blancher, A. & Giorgi, D. The olfactory receptor gene repertoire in primates and
mouse: evidence for reduction of the functional fraction in primates. Proc. Natl Acad. Sci. USA 97,
2870–2874 (2000).
184. Clark, A. J., Hickman, J. & Bishop, J. A 45-kb DNA domain with two divergently orientated
genes is the unit of organisation of the murine major urinary protein genes. EMBO J. 3,
2055–2064 (1984).
185. Mural, R. J. et al. A comparison of whole-genome shotgun-derived mouse chromosome 16 and the
human genome. Science 296, 1661–1671 (2002).
186. Cavaggioni, A. & Mucignat-Caretta, C. Major urinary proteins, a2U-globulins and aphrodisin.
Biochim. Biophys. Acta 1482, 218–228 (2000).
187. Hurst, J. L. et al. Individual recognition in mice mediated by major urinary proteins. Nature 414,
631–634 (2001).
188. Danielson, P. B. The cytochrome P450 superfamily: biochemistry, evolution and drug metabolism
in humans. Curr. Drug Metab. 3, 561–597 (2002).
189. Nelson, D. R. Cytochrome P450 and the individuality of species. Arch. Biochem. Biophys. 369, 1–10
(1999).
190. Scarborough, P. E., Ma, J., Qu, W. & Zeldin, D. C. P450 subfamily CYP2J and their role in the
bioactivation of arachidonic acid in extrahepatic tissues. Drug Metab. Rev. 31, 205–234 (1999).
191. Willson, T. M. & Kliewer, S. A. PXR, CAR and drug metabolism. Nature Rev. Drug Discov. 1,
259–266 (2002).
192. Gurates, B. et al. WT1 and DAX-1 inhibit aromatase P450 expression in human endometrial and
endometriotic stromal cells. J. Clin. Endocrinol. Metab. 87, 4369–4377 (2002).
193. Zhang, Z. et al. Genomic analysis of the nuclear receptor family: new insights into structure,
regulation, and evolution from the rat genome. Genome Res. 14, 580–590 (2004).
194. Lopez-Otin, C. & Overall, C. M. Protease degradomics: a new challenge for proteomics. Nature Rev.
Mol. Cell Biol. 3, 509–519 (2002).
195. Stenson, P. D. et al. Human Gene Mutation Database (HGMD): 2003 update. Hum. Mutat. 21,
577–581 (2003).
196. Huang, H. et al. Evolutionary conservation of human disease gene orthologs in the rat and mouse
genomes. Genome Biol. (submitted).
197. Duret, L. & Mouchiroud, D. Determinants of substitution rates in mammalian genes:
expression pattern affects selection intensity but not mutation rate. Mol. Biol. Evol. 17, 68–74
(2000).
198. Reddy, P. S. & Housman, D. E. The complex pathology of trinucleotide repeats. Curr. Opin. Cell
Biol. 9, 364–372 (1997).
199. The International HapMap Consortium. The International HapMap Project. Nature 426, 789–796
(2003).
200. Wade, C. M. et al. The mosaic structure of variation in the laboratory mouse genome. Nature 420,
574–578 (2002).
201. Zimdahl, H. et al. A SNP map of the rat genome generated from cDNA sequences. Science 303, 807
(2004).
202. Mendell, J. T. & Dietz, H. C. When the message goes awry: disease-producing mutations that
influence mRNA content and performance. Cell 107, 411–414 (2001).
203. Venter, J. C. et al. The sequence of the human genome. Science 291, 1304–1351 (2001).
204. Marra, M. et al. A map for sequence analysis of the Arabidopsis thaliana genome. Nature Genet. 22,
265–270 (1999).
205. Marra, M. A. et al. High throughput fingerprint analysis of large-insert clones. Genome Res. 7,
1072–1084 (1997).
206. The International Human Genome Mapping Consortium. A physical map of the human genome.
Nature 409, 934–941 (2001).
207. Schein, J. E. A. in Bacterial Artificial Chromosomes: Methods and Protocols (eds Zhao, S. & Stodolsky,
M.) 143–156 (Humana, Totowa, New Jersey, 2004).
208. Soderlund, C. I. et al. FPC: a system for building contigs from restriction fingerprinted clones.
Comput. Appl. Biosci. 13, 523–535 (1997).
209. Soderlund, C. S. et al. Contigs built with fingerprints, markers, and FPC V4.7. Genome Res. 10,
1772–1787 (2000).
210. Ness, S. R. et al. Assembly of fingerprint contigs: parallelized FPC. Bioinformatics 18, 484–485 (2002).
211. Woon, P. Y. et al. Construction and characterization of a 10-fold genome equivalent rat P1-derived
artificial chromosome library. Genomics 50, 306–316 (1998).
212. Watanabe, T. K. et al. A radiation hybrid map of the rat genome containing 5,255 markers. Nature
Genet. 22, 27–36 (1999).
articles
NATURE | VOL 428 | 1 APRIL 2004 | www.nature.com/nature 519© 2004 Nature Publishing Group
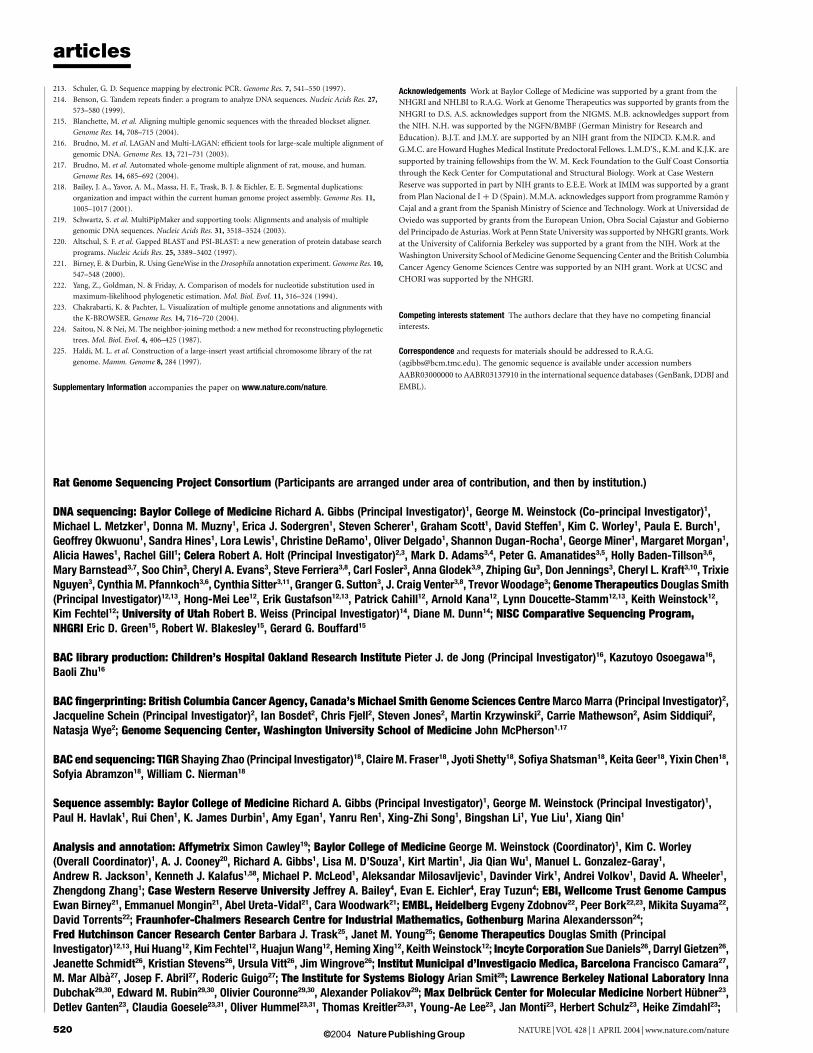
213. Schuler, G. D. Sequence mapping by electronic PCR. Genome Res. 7, 541–550 (1997).
214. Benson, G. Tandem repeats finder: a program to analyze DNA sequences. Nucleic Acids Res. 27,
573–580 (1999).
215. Blanchette, M. et al. Aligning multiple genomic sequences with the threaded blockset aligner.
Genome Res. 14, 708–715 (2004).
216. Brudno, M. et al. LAGAN and Multi-LAGAN: efficient tools for large-scale multiple alignment of
genomic DNA. Genome Res. 13, 721–731 (2003).
217. Brudno, M. et al. Automated whole-genome multiple alignment of rat, mouse, and human.
Genome Res. 14, 685–692 (2004).
218. Bailey, J. A., Yavor, A. M., Massa, H. F., Trask, B. J. & Eichler, E. E. Segmental duplications:
organization and impact within the current human genome project assembly. Genome Res. 11,
1005–1017 (2001).
219. Schwartz, S. et al. MultiPipMaker and supporting tools: Alignments and analysis of multiple
genomic DNA sequences. Nucleic Acids Res. 31, 3518–3524 (2003).
220. Altschul, S. F. et al. Gapped BLAST and PSI-BLAST: a new generation of protein database search
programs. Nucleic Acids Res. 25, 3389–3402 (1997).
221. Birney, E. & Durbin, R. Using GeneWise in the Drosophila annotation experiment. Genome Res. 10,
547–548 (2000).
222. Yang, Z., Goldman, N. & Friday, A. Comparison of models for nucleotide substitution used in
maximum-likelihood phylogenetic estimation. Mol. Biol. Evol. 11, 316–324 (1994).
223. Chakrabarti, K. & Pachter, L. Visualization of multiple genome annotations and alignments with
the K-BROWSER. Genome Res. 14, 716–720 (2004).
224. Saitou, N. & Nei, M. The neighbor-joining method: a new method for reconstructing phylogenetic
trees. Mol. Biol. Evol. 4, 406–425 (1987).
225. Haldi, M. L. et al. Construction of a large-insert yeast artificial chromosome library of the rat
genome. Mamm. Genome 8, 284 (1997).
Supplementary Information accompanies the paper on www.nature.com/nature.
Acknowledgements Work at Baylor College of Medicine was supported by a grant from the
NHGRI and NHLBI to R.A.G. Work at Genome Therapeutics was supported by grants from the
NHGRI to D.S. A.S. acknowledges support from the NIGMS. M.B. acknowledges support from
the NIH. N.H. was supported by the NGFN/BMBF (German Ministry for Research and
Education). B.J.T. and J.M.Y. are supported by an NIH grant from the NIDCD. K.M.R. and
G.M.C. are Howard Hughes Medical Institute Predoctoral Fellows. L.M.D’S., K.M. and K.J.K. are
supported by training fellowships from the W. M. Keck Foundation to the Gulf Coast Consortia
through the Keck Center for Computational and Structural Biology. Work at Case Western
Reserve was supported in part by NIH grants to E.E.E. Work at IMIM was supported by a grant
from Plan Nacional de I þ D (Spain). M.M.A. acknowledges support from programme Ramon y
Cajal and a grant from the Spanish Ministry of Science and Technology. Work at Universidad de
Oviedo was supported by grants from the European Union, Obra Social Cajastur and Gobierno
del Principado de Asturias. Work at Penn State University was supported by NHGRI grants. Work
at the University of California Berkeley was supported by a grant from the NIH. Work at the
Washington University School of Medicine Genome Sequencing Center and the British Columbia
Cancer Agency Genome Sciences Centre was supported by an NIH grant. Work at UCSC and
CHORI was supported by the NHGRI.
Competing interests statement The authors declare that they have no competing financial
interests.
Correspondence and requests for materials should be addressed to R.A.G.
([email protected]). The genomic sequence is available under accession numbers
AABR03000000 to AABR03137910 in the international sequence databases (GenBank, DDBJ and
EMBL).
Rat Genome Sequencing Project Consortium (Participants are arranged under area of contribution, and then by institution.)
DNA sequencing: Baylor College of Medicine Richard A. Gibbs (Principal Investigator)1, George M. Weinstock (Co-principal Investigator)1,Michael L. Metzker1, Donna M. Muzny1, Erica J. Sodergren1, Steven Scherer1, Graham Scott1, David Steffen1, Kim C. Worley1, Paula E. Burch1,Geoffrey Okwuonu1, Sandra Hines1, Lora Lewis1, Christine DeRamo1, Oliver Delgado1, Shannon Dugan-Rocha1, George Miner1, Margaret Morgan1,Alicia Hawes1, Rachel Gill1; Celera Robert A. Holt (Principal Investigator)2,3, Mark D. Adams3,4, Peter G. Amanatides3,5, Holly Baden-Tillson3,6,Mary Barnstead3,7, Soo Chin3, Cheryl A. Evans3, Steve Ferriera3,8, Carl Fosler3, Anna Glodek3,9, Zhiping Gu3, Don Jennings3, Cheryl L. Kraft3,10, TrixieNguyen3, Cynthia M. Pfannkoch3,6, Cynthia Sitter3,11, Granger G. Sutton3, J. Craig Venter3,8, Trevor Woodage3; Genome Therapeutics Douglas Smith(Principal Investigator)12,13, Hong-Mei Lee12, Erik Gustafson12,13, Patrick Cahill12, Arnold Kana12, Lynn Doucette-Stamm12,13, Keith Weinstock12,Kim Fechtel12; University of Utah Robert B. Weiss (Principal Investigator)14, Diane M. Dunn14; NISC Comparative Sequencing Program,NHGRI Eric D. Green15, Robert W. Blakesley15, Gerard G. Bouffard15
BAC library production: Children’s Hospital Oakland Research Institute Pieter J. de Jong (Principal Investigator)16, Kazutoyo Osoegawa16,Baoli Zhu16
BAC fingerprinting: British Columbia Cancer Agency, Canada’s Michael Smith Genome Sciences Centre Marco Marra (Principal Investigator)2,Jacqueline Schein (Principal Investigator)2, Ian Bosdet2, Chris Fjell2, Steven Jones2, Martin Krzywinski2, Carrie Mathewson2, Asim Siddiqui2,Natasja Wye2; Genome Sequencing Center, Washington University School of Medicine John McPherson1,17
BAC end sequencing: TIGR Shaying Zhao (Principal Investigator)18, Claire M. Fraser18, Jyoti Shetty18, Sofiya Shatsman18, Keita Geer18, Yixin Chen18,Sofyia Abramzon18, William C. Nierman18
Sequence assembly: Baylor College of Medicine Richard A. Gibbs (Principal Investigator)1, George M. Weinstock (Principal Investigator)1,Paul H. Havlak1, Rui Chen1, K. James Durbin1, Amy Egan1, Yanru Ren1, Xing-Zhi Song1, Bingshan Li1, Yue Liu1, Xiang Qin1
Analysis and annotation: Affymetrix Simon Cawley19; Baylor College of Medicine George M. Weinstock (Coordinator)1, Kim C. Worley(Overall Coordinator)1, A. J. Cooney20, Richard A. Gibbs1, Lisa M. D’Souza1, Kirt Martin1, Jia Qian Wu1, Manuel L. Gonzalez-Garay1,Andrew R. Jackson1, Kenneth J. Kalafus1,58, Michael P. McLeod1, Aleksandar Milosavljevic1, Davinder Virk1, Andrei Volkov1, David A. Wheeler1,Zhengdong Zhang1; Case Western Reserve University Jeffrey A. Bailey4, Evan E. Eichler4, Eray Tuzun4; EBI, Wellcome Trust Genome CampusEwan Birney21, Emmanuel Mongin21, Abel Ureta-Vidal21, Cara Woodwark21; EMBL, Heidelberg Evgeny Zdobnov22, Peer Bork22,23, Mikita Suyama22,David Torrents22; Fraunhofer-Chalmers Research Centre for Industrial Mathematics, Gothenburg Marina Alexandersson24;Fred Hutchinson Cancer Research Center Barbara J. Trask25, Janet M. Young25; Genome Therapeutics Douglas Smith (PrincipalInvestigator)12,13, Hui Huang12, Kim Fechtel12, Huajun Wang12, Heming Xing12, Keith Weinstock12; Incyte Corporation Sue Daniels26, Darryl Gietzen26,Jeanette Schmidt26, Kristian Stevens26, Ursula Vitt26, Jim Wingrove26; Institut Municipal d’Investigacio Medica, Barcelona Francisco Camara27,M. Mar Alba27, Josep F. Abril27, Roderic Guigo27; The Institute for Systems Biology Arian Smit28; Lawrence Berkeley National Laboratory InnaDubchak29,30, Edward M. Rubin29,30, Olivier Couronne29,30, Alexander Poliakov29; Max Delbruck Center for Molecular Medicine Norbert Hubner23,Detlev Ganten23, Claudia Goesele23,31, Oliver Hummel23,31, Thomas Kreitler23,31, Young-Ae Lee23, Jan Monti23, Herbert Schulz23, Heike Zimdahl23;
articles
NATURE | VOL 428 | 1 APRIL 2004 | www.nature.com/nature520 © 2004 Nature Publishing Group
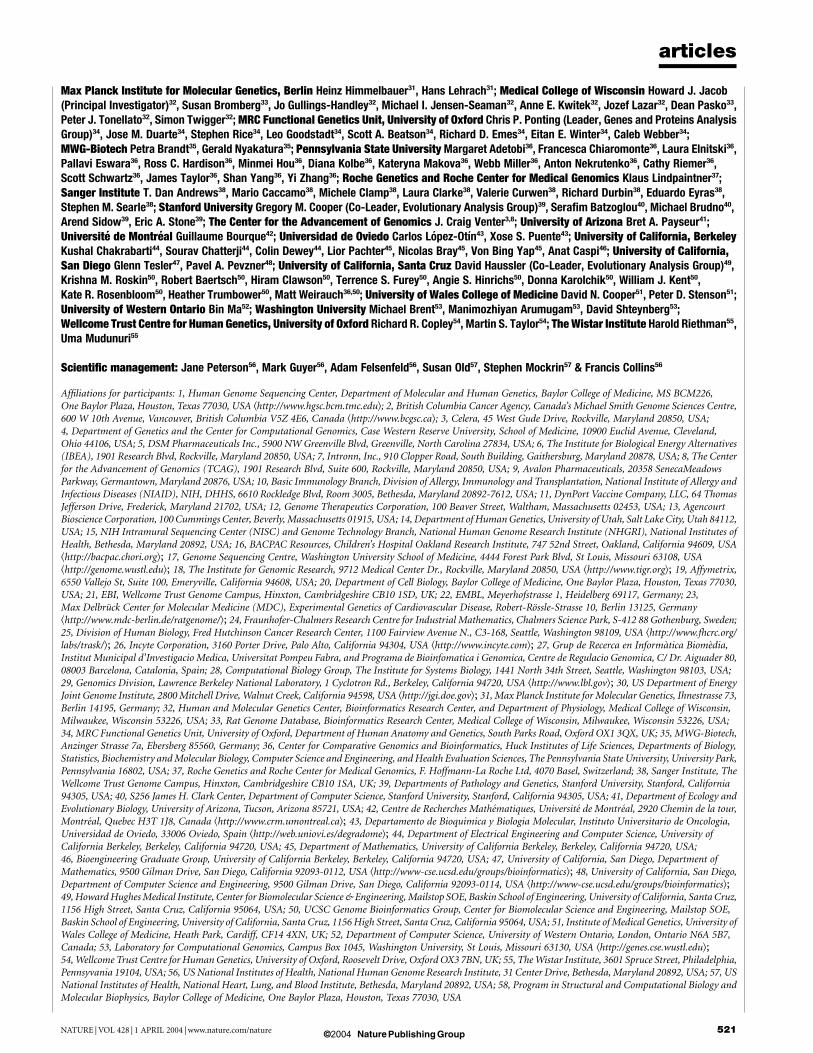
Max Planck Institute for Molecular Genetics, Berlin Heinz Himmelbauer31, Hans Lehrach31; Medical College of Wisconsin Howard J. Jacob(Principal Investigator)32, Susan Bromberg33, Jo Gullings-Handley32, Michael I. Jensen-Seaman32, Anne E. Kwitek32, Jozef Lazar32, Dean Pasko33,Peter J. Tonellato32, Simon Twigger32; MRC Functional Genetics Unit, University of Oxford Chris P. Ponting (Leader, Genes and Proteins AnalysisGroup)34, Jose M. Duarte34, Stephen Rice34, Leo Goodstadt34, Scott A. Beatson34, Richard D. Emes34, Eitan E. Winter34, Caleb Webber34;MWG-Biotech Petra Brandt35, Gerald Nyakatura35; Pennsylvania State University Margaret Adetobi36, Francesca Chiaromonte36, Laura Elnitski36,Pallavi Eswara36, Ross C. Hardison36, Minmei Hou36, Diana Kolbe36, Kateryna Makova36, Webb Miller36, Anton Nekrutenko36, Cathy Riemer36,Scott Schwartz36, James Taylor36, Shan Yang36, Yi Zhang36; Roche Genetics and Roche Center for Medical Genomics Klaus Lindpaintner37;Sanger Institute T. Dan Andrews38, Mario Caccamo38, Michele Clamp38, Laura Clarke38, Valerie Curwen38, Richard Durbin38, Eduardo Eyras38,Stephen M. Searle38; Stanford University Gregory M. Cooper (Co-Leader, Evolutionary Analysis Group)39, Serafim Batzoglou40, Michael Brudno40,Arend Sidow39, Eric A. Stone39; The Center for the Advancement of Genomics J. Craig Venter3,8; University of Arizona Bret A. Payseur41;Universite de Montreal Guillaume Bourque42; Universidad de Oviedo Carlos Lopez-Otın43, Xose S. Puente43; University of California, BerkeleyKushal Chakrabarti44, Sourav Chatterji44, Colin Dewey44, Lior Pachter45, Nicolas Bray45, Von Bing Yap45, Anat Caspi46; University of California,San Diego Glenn Tesler47, Pavel A. Pevzner48; University of California, Santa Cruz David Haussler (Co-Leader, Evolutionary Analysis Group)49,Krishna M. Roskin50, Robert Baertsch50, Hiram Clawson50, Terrence S. Furey50, Angie S. Hinrichs50, Donna Karolchik50, William J. Kent50,Kate R. Rosenbloom50, Heather Trumbower50, Matt Weirauch36,50; University of Wales College of Medicine David N. Cooper51, Peter D. Stenson51;University of Western Ontario Bin Ma52; Washington University Michael Brent53, Manimozhiyan Arumugam53, David Shteynberg53;Wellcome Trust Centre for Human Genetics, University of Oxford Richard R. Copley54, Martin S. Taylor54; The Wistar Institute Harold Riethman55,Uma Mudunuri55
Scientific management: Jane Peterson56, Mark Guyer56, Adam Felsenfeld56, Susan Old57, Stephen Mockrin57 & Francis Collins56
Affiliations for participants: 1, Human Genome Sequencing Center, Department of Molecular and Human Genetics, Baylor College of Medicine, MS BCM226,One Baylor Plaza, Houston, Texas 77030, USA khttp://www.hgsc.bcm.tmc.edul; 2, British Columbia Cancer Agency, Canada’s Michael Smith Genome Sciences Centre,600 W 10th Avenue, Vancouver, British Columbia V5Z 4E6, Canada khttp://www.bcgsc.cal; 3, Celera, 45 West Gude Drive, Rockville, Maryland 20850, USA;4, Department of Genetics and the Center for Computational Genomics, Case Western Reserve University, School of Medicine, 10900 Euclid Avenue, Cleveland,Ohio 44106, USA; 5, DSM Pharmaceuticals Inc., 5900 NW Greenville Blvd, Greenville, North Carolina 27834, USA; 6, The Institute for Biological Energy Alternatives(IBEA), 1901 Research Blvd, Rockville, Maryland 20850, USA; 7, Intronn, Inc., 910 Clopper Road, South Building, Gaithersburg, Maryland 20878, USA; 8, The Centerfor the Advancement of Genomics (TCAG), 1901 Research Blvd, Suite 600, Rockville, Maryland 20850, USA; 9, Avalon Pharmaceuticals, 20358 SenecaMeadowsParkway, Germantown, Maryland 20876, USA; 10, Basic Immunology Branch, Division of Allergy, Immunology and Transplantation, National Institute of Allergy andInfectious Diseases (NIAID), NIH, DHHS, 6610 Rockledge Blvd, Room 3005, Bethesda, Maryland 20892-7612, USA; 11, DynPort Vaccine Company, LLC, 64 ThomasJefferson Drive, Frederick, Maryland 21702, USA; 12, Genome Therapeutics Corporation, 100 Beaver Street, Waltham, Massachusetts 02453, USA; 13, AgencourtBioscience Corporation, 100 Cummings Center, Beverly, Massachusetts 01915, USA; 14, Department of Human Genetics, University of Utah, Salt Lake City, Utah 84112,USA; 15, NIH Intramural Sequencing Center (NISC) and Genome Technology Branch, National Human Genome Research Institute (NHGRI), National Institutes ofHealth, Bethesda, Maryland 20892, USA; 16, BACPAC Resources, Children’s Hospital Oakland Research Institute, 747 52nd Street, Oakland, California 94609, USAkhttp://bacpac.chori.orgl; 17, Genome Sequencing Centre, Washington University School of Medicine, 4444 Forest Park Blvd, St Louis, Missouri 63108, USAkhttp://genome.wustl.edul; 18, The Institute for Genomic Research, 9712 Medical Center Dr., Rockville, Maryland 20850, USA khttp://www.tigr.orgl; 19, Affymetrix,6550 Vallejo St, Suite 100, Emeryville, California 94608, USA; 20, Department of Cell Biology, Baylor College of Medicine, One Baylor Plaza, Houston, Texas 77030,USA; 21, EBI, Wellcome Trust Genome Campus, Hinxton, Cambridgeshire CB10 1SD, UK; 22, EMBL, Meyerhofstrasse 1, Heidelberg 69117, Germany; 23,Max Delbruck Center for Molecular Medicine (MDC), Experimental Genetics of Cardiovascular Disease, Robert-Rossle-Strasse 10, Berlin 13125, Germanykhttp://www.mdc-berlin.de/ratgenome/l; 24, Fraunhofer-Chalmers Research Centre for Industrial Mathematics, Chalmers Science Park, S-412 88 Gothenburg, Sweden;25, Division of Human Biology, Fred Hutchinson Cancer Research Center, 1100 Fairview Avenue N., C3-168, Seattle, Washington 98109, USA khttp://www.fhcrc.org/labs/trask/l; 26, Incyte Corporation, 3160 Porter Drive, Palo Alto, California 94304, USA khttp://www.incyte.coml; 27, Grup de Recerca en Informatica Biomedia,Institut Municipal d’Investigacio Medica, Universitat Pompeu Fabra, and Programa de Bioinfomatica i Genomica, Centre de Regulacio Genomica, C/ Dr. Aiguader 80,08003 Barcelona, Catalonia, Spain; 28, Computational Biology Group, The Institute for Systems Biology, 1441 North 34th Street, Seattle, Washington 98103, USA;29, Genomics Division, Lawrence Berkeley National Laboratory, 1 Cyclotron Rd., Berkeley, California 94720, USA khttp://www.lbl.govl; 30, US Department of EnergyJoint Genome Institute, 2800 Mitchell Drive, Walnut Creek, California 94598, USA khttp://jgi.doe.govl; 31, Max Planck Institute for Molecular Genetics, Ihnestrasse 73,Berlin 14195, Germany; 32, Human and Molecular Genetics Center, Bioinformatics Research Center, and Department of Physiology, Medical College of Wisconsin,Milwaukee, Wisconsin 53226, USA; 33, Rat Genome Database, Bioinformatics Research Center, Medical College of Wisconsin, Milwaukee, Wisconsin 53226, USA;34, MRC Functional Genetics Unit, University of Oxford, Department of Human Anatomy and Genetics, South Parks Road, Oxford OX1 3QX, UK; 35, MWG-Biotech,Anzinger Strasse 7a, Ebersberg 85560, Germany; 36, Center for Comparative Genomics and Bioinformatics, Huck Institutes of Life Sciences, Departments of Biology,Statistics, Biochemistry and Molecular Biology, Computer Science and Engineering, and Health Evaluation Sciences, The Pennsylvania State University, University Park,Pennsylvania 16802, USA; 37, Roche Genetics and Roche Center for Medical Genomics, F. Hoffmann-La Roche Ltd, 4070 Basel, Switzerland; 38, Sanger Institute, TheWellcome Trust Genome Campus, Hinxton, Cambridgeshire CB10 1SA, UK; 39, Departments of Pathology and Genetics, Stanford University, Stanford, California94305, USA; 40, S256 James H. Clark Center, Department of Computer Science, Stanford University, Stanford, California 94305, USA; 41, Department of Ecology andEvolutionary Biology, University of Arizona, Tucson, Arizona 85721, USA; 42, Centre de Recherches Mathematiques, Universite de Montreal, 2920 Chemin de la tour,Montreal, Quebec H3T 1J8, Canada khttp://www.crm.umontreal.cal; 43, Departamento de Bioquimica y Biologia Molecular, Instituto Universitario de Oncologia,Universidad de Oviedo, 33006 Oviedo, Spain khttp://web.uniovi.es/degradomel; 44, Department of Electrical Engineering and Computer Science, University ofCalifornia Berkeley, Berkeley, California 94720, USA; 45, Department of Mathematics, University of California Berkeley, Berkeley, California 94720, USA;46, Bioengineering Graduate Group, University of California Berkeley, Berkeley, California 94720, USA; 47, University of California, San Diego, Department ofMathematics, 9500 Gilman Drive, San Diego, California 92093-0112, USA khttp://www-cse.ucsd.edu/groups/bioinformaticsl; 48, University of California, San Diego,Department of Computer Science and Engineering, 9500 Gilman Drive, San Diego, California 92093-0114, USA khttp://www-cse.ucsd.edu/groups/bioinformaticsl;49, Howard Hughes Medical Institute, Center for Biomolecular Science & Engineering, Mailstop SOE, Baskin School of Engineering, University of California, Santa Cruz,1156 High Street, Santa Cruz, California 95064, USA; 50, UCSC Genome Bioinformatics Group, Center for Biomolecular Science and Engineering, Mailstop SOE,Baskin School of Engineering, University of California, Santa Cruz, 1156 High Street, Santa Cruz, California 95064, USA; 51, Institute of Medical Genetics, University ofWales College of Medicine, Heath Park, Cardiff, CF14 4XN, UK; 52, Department of Computer Science, University of Western Ontario, London, Ontario N6A 5B7,Canada; 53, Laboratory for Computational Genomics, Campus Box 1045, Washington University, St Louis, Missouri 63130, USA khttp://genes.cse.wustl.edul;54, Wellcome Trust Centre for Human Genetics, University of Oxford, Roosevelt Drive, Oxford OX3 7BN, UK; 55, The Wistar Institute, 3601 Spruce Street, Philadelphia,Pennsyvania 19104, USA; 56, US National Institutes of Health, National Human Genome Research Institute, 31 Center Drive, Bethesda, Maryland 20892, USA; 57, USNational Institutes of Health, National Heart, Lung, and Blood Institute, Bethesda, Maryland 20892, USA; 58, Program in Structural and Computational Biology andMolecular Biophysics, Baylor College of Medicine, One Baylor Plaza, Houston, Texas 77030, USA
articles
NATURE | VOL 428 | 1 APRIL 2004 | www.nature.com/nature 521© 2004 Nature Publishing Group