asgard: an open-access database of annotated ... · citable link ... the assembled searchable giant...
TRANSCRIPT
ASGARD: An Open-Access Database of Annotated Transcriptomesfor Emerging Model Arthropod Species
(Article begins on next page)
The Harvard community has made this article openly available.Please share how this access benefits you. Your story matters.
Citation Zeng, Victor, and Cassandra G. Extavour. 2012. ASGARD: Anopen-access database of annotated transcriptomes for emergingmodel arthropod species. Database 2012:bas048.
Published Version doi:10.1093/database/bas048
Accessed February 19, 2015 11:49:29 AM EST
Citable Link http://nrs.harvard.edu/urn-3:HUL.InstRepos:10482548
Terms of Use This article was downloaded from Harvard University's DASHrepository, and is made available under the terms and conditionsapplicable to Other Posted Material, as set forth athttp://nrs.harvard.edu/urn-3:HUL.InstRepos:dash.current.terms-of-use#LAA
Database tool
ASGARD: an open-access database ofannotated transcriptomes for emergingmodel arthropod species
Victor Zeng and Cassandra G. Extavour*
Department of Organismic and Evolutionary Biology, Harvard University, 16 Divinity Avenue, Cambridge, MA 02138, USA
*Corresponding author: Tel: +1 617 496 1935; Fax: +1 617 496 9507; Email: [email protected]
Present address: Victor Zeng, Stylux Incorporated, 25 Stickney Road, Atkinson, NH 03811, USA
Submitted 14 August 2012; Revised 1 October 2012; Accepted 16 October 2012
.............................................................................................................................................................................................................................................................................................
The increased throughput and decreased cost of next-generation sequencing (NGS) have shifted the bottleneck genomic
research from sequencing to annotation, analysis and accessibility. This is particularly challenging for research communities
working on organisms that lack the basic infrastructure of a sequenced genome, or an efficient way to utilize whatever
sequence data may be available. Here we present a new database, the Assembled Searchable Giant Arthropod Read
Database (ASGARD). This database is a repository and search engine for transcriptomic data from arthropods that are of
high interest to multiple research communities but currently lack sequenced genomes. We demonstrate the functionality
and utility of ASGARD using de novo assembled transcriptomes from the milkweed bug Oncopeltus fasciatus, the cricket
Gryllus bimaculatus and the amphipod crustacean Parhyale hawaiensis. We have annotated these transcriptomes to assign
putative orthology, coding region determination, protein domain identification and Gene Ontology (GO) term annotation
to all possible assembly products. ASGARD allows users to search all assemblies by orthology annotation, GO term anno-
tation or Basic Local Alignment Search Tool. User-friendly features of ASGARD include search term auto-completion sug-
gestions based on database content, the ability to download assembly product sequences in FASTA format, direct links to
NCBI data for predicted orthologs and graphical representation of the location of protein domains and matches to similar
sequences from the NCBI non-redundant database. ASGARD will be a useful repository for transcriptome data from future
NGS studies on these and other emerging model arthropods, regardless of sequencing platform, assembly or annotation
status. This database thus provides easy, one-stop access to multi-species annotated transcriptome information. We antici-
pate that this database will be useful for members of multiple research communities, including developmental biology,
physiology, evolutionary biology, ecology, comparative genomics and phylogenomics.
Database URL: asgard.rc.fas.harvard.edu
.............................................................................................................................................................................................................................................................................................
Introduction
In the early ‘genomic era’ of the late 1990s and early 2000s,
the genomes of several long-standing traditional laboratory
model organisms were completely sequenced (1–5), which
galvanized their respective fields by offering enormous
amounts of new data for analysis. Importantly, the benefi-
cial effects of these genome projects were maximized by the
simultaneous creation of dedicated web interfaces (e.g. 6–
11), or incorporation of the data into existing community
databases (e.g. 12), so that users could immediately and
easily access and search genome sequences. The advent of
next-generation sequencing (NGS) has further advanced
biological research not only in traditional model systems,
but also in an increasing number of clades that previously
lacked genomic data (13–22). High-throughput NGS
.............................................................................................................................................................................................................................................................................................
� The Author(s) 2012. Published by Oxford University Press.This is an Open Access article distributed under the terms of the Creative Commons Attribution License (http://creativecommons.org/licenses/by-nc/3.0/), which permits non-commercial reuse, distribution, and reproduction in any medium, provided the original work isproperly cited. For commercial re-use, please contact [email protected]. Page 1 of 17
(page number not for citation purposes)
Database, Vol. 2012, Article ID bas048, doi:10.1093/database/bas048.............................................................................................................................................................................................................................................................................................
at Ernst M
ayr Library of the M
useum C
omp Z
oology, Harvard U
niversity on Novem
ber 24, 2012http://database.oxfordjournals.org/
Dow
nloaded from

technology now enables researchers studying non-
traditional model organisms to obtain genomic or transcrip-
tomic data relatively efficiently and at modest costs.
Transcriptome and RNA-Seq data are currently the fas-
test growing category of genomic data across many biolo-
gical research fields (23, 24). However, unlike the
pioneering genome sequence projects, these smaller
‘omics’ datasets are usually minimally annotated to meet
the needs of a specific research goal, and are rarely avail-
able or searchable in assembled or annotated form. The
NCBI’s Sequence Read Archive (SRA) (25) provides a
means of archiving data obtained from 454 pyrosequen-
cing, Illumina Genome Analyzer sequencing and other
NGS platforms. However, it does not allow for deposition
or searching of assembled transcriptomes. Basic Local
Alignment Search Tool (BLAST) searches of the SRA data
are possible, but only by selecting a single SRA dataset
for a given organism at a time. The commonly used NCBI
BLAST portal (http://blast.ncbi.nlm.nih.gov/Blast.cgi) does
not include SRA data within the nucleotide collection or
reference RNA sequences (refseq_rna), although it does
allow SRA searches as a specialized BLAST option. The tran-
scriptome shotgun assembly (TSA) database (http://www.
ncbi.nlm.nih.gov/genbank/tsa/) allows storage of complete
assemblies, but annotation of deposited assemblies is not
required. As a result, the potential for leveraging the vast
majority of transcriptome data generated are diminished.
One animal clade for which substantial amounts of NGS
data are being generated is the Arthropoda (e.g. 21, 22,
26–34). The most speciose animal phylum, arthropods in-
clude spiders and scorpions (Chelicerata), centipedes and
millipedes (Myriapoda) and insects and crustaceans
(Pancrustacea). Arthropods have served as important
models for studies of evolutionary biology (35–39), ecology
(40–42), physiology (43, 44) and biomechanics (45, 46). As
prevalent vectors of human disease and major agricultural
pests, arthropods are also of significance to economic
development and global health. Finally, the fruit fly
Drosophila melanogaster has been a powerful model or-
ganism for the study of genetic, evolutionary, developmen-
tal and biomedical research for over a century (47, 48) and
possesses the most sophisticated genetic analysis toolkit of
any animal model (12, 49–51). As a result, functional gen-
etic and genomic studies in other arthropods have flour-
ished by taking advantage of the well characterized
Drosophila genome as a point of reference (9, 11, 52–54).
However, these studies exhibit a distinct phylogenetic bias:
the vast majority of arthropod genomic data available have
been generated for the holometabolous insects, which
undergo complete metamorphosis. Because the Holometa-
bola are derived in many respects compared with the
basally branching Hemimetabola (insects that do not
undergo metamorphosis) and other arthropods (55),
many recent efforts have used NGS to obtain transcriptome
data from other emerging model arthropods (19, 21, 22, 56,
V. Zeng, B. Ewen Campben, H.W. Horch et al., submitted for
publication). These projects are particularly important for
new model organisms for which functional genetic tech-
niques have been developed, as the roles of genes dis-
covered through NGS can be functionally tested in these
animals. However, even if these data are deposited in the
SRA, as described above, there is typically no public access
provided to search the annotated data.
To address this problem, we have created a searchable
database of the annotated transcriptomes of three emer-
ging model arthropods, which provide data for a range of
phylogenetic diversity within Pancrustacea. All of these or-
ganisms have risen to prominence as emerging model or-
ganisms due to their ease of inbred laboratory cultures,
year-round embryo collection and gene expression analysis
via in situ hybridization and antibody staining. The milk-
weed bug Oncopeltus fasciatus (Figure1, left) belongs to
the order Hemiptera, the sister order to all holometabolous
insects including Drosophila (55). Determination of gene
function is possible in O. fasciatus using maternal or embry-
onic RNA interference (RNAi) (57–61). The amphipod crust-
acean Parhyale hawaiensis (Figure 1, middle) is a member of
the crustacean class Malacostraca and thus serves as a
Pancrustacean outgroup to insects (62). Multiple functional
genetic tools have been developed for P. hawaiensis, includ-
ing gene knockdown by small interfering RNAs (siRNAs) and
morpholinos (63–65), stable germ line transgenesis (66), in-
ducible gene overexpression (67), site-directed insertions
and enhancer trapping (68). The cricket Gryllus bimaculatus
(Figure 1, right) branches basally to both Holometabola and
Hemiptera and has multiple advanced functional genetic
techniques available, including maternal, zygotic, nymphal
and regenerative RNAi (69–72), stable germ line transgen-
esis (73) and targeted genome editing (74).
The database presented here provides a way for re-
searchers in any field to easily search for genes of interest
in these animals among previously described maternal and
embryonic transcriptome data (21, 22, V. Zeng, B. Ewen
Campben, H.W. Horch et al., submitted for publication).
The database provides BLAST search capability for any or
all transcriptome assemblies, something which is not
possible with SRA BLAST searches as the SRA houses only
unassembled, un-annotated raw reads. Moreover, all tran-
scriptomes have been annotated for gene orthology, pro-
tein coding regions, functional protein domains and Gene
Ontology (GO) terms, allowing researchers to search for
genes of interest using any of these identifiers.
Database content
The ASGARD integrates annotated assembly information
from the maternal and developmental transcriptomes of
O. fasciatus, P. hawaiensis and G. bimaculatus. Full details
.............................................................................................................................................................................................................................................................................................
Page 2 of 17
Database tool Database, Vol. 2012, Article ID bas048, doi:10.1093/database/bas048.............................................................................................................................................................................................................................................................................................
at Ernst M
ayr Library of the M
useum C
omp Z
oology, Harvard U
niversity on Novem
ber 24, 2012http://database.oxfordjournals.org/
Dow
nloaded from

of the creation, assembly and annotation of each transcrip-
tome have been previously described (21, 22, V. Zeng, B.
Ewen Campben, H.W. Horch et al., submitted for publica-
tion). Briefly, the transcriptome for each organism was
created by isolating total RNA from adult ovaries and
from embryos of multiple developmental stages (Figure 1,
blue boxes). The complementary DNA (cDNA) libraries were
sequenced using 454 GS-FLX and Titanium pyrosequencing
Figure 1. Origin and processing of data contained in ASGARD. Flowchart showing adult specimens and tissue types obtained forASGARD v1.0 organisms O. fasciatus, P. hawaiensis and G. bimaculatus. Total RNA was prepared separately from ovaries andmixed-stage embryos and used for cDNA synthesis. For insect samples, some libraries were normalized in pilot experiments andsequenced using GS-FLX 454 pyrosequencing. The majority of reads used in the de novo assemblies were obtained using GS-FLXTitanium 454 pyrosequencing. SRA accession numbers are shown for each sequenced sample. Reads from each organism werepooled, assembled with Newbler v2.5 and annotated using the data processing pipeline described in the main text. The resultingdata are searchable via the ASGARD web interface.
.............................................................................................................................................................................................................................................................................................
Page 3 of 17
Database, Vol. 2012, Article ID bas048, doi:10.1093/database/bas048 Database tool.............................................................................................................................................................................................................................................................................................
at Ernst M
ayr Library of the M
useum C
omp Z
oology, Harvard U
niversity on Novem
ber 24, 2012http://database.oxfordjournals.org/
Dow
nloaded from
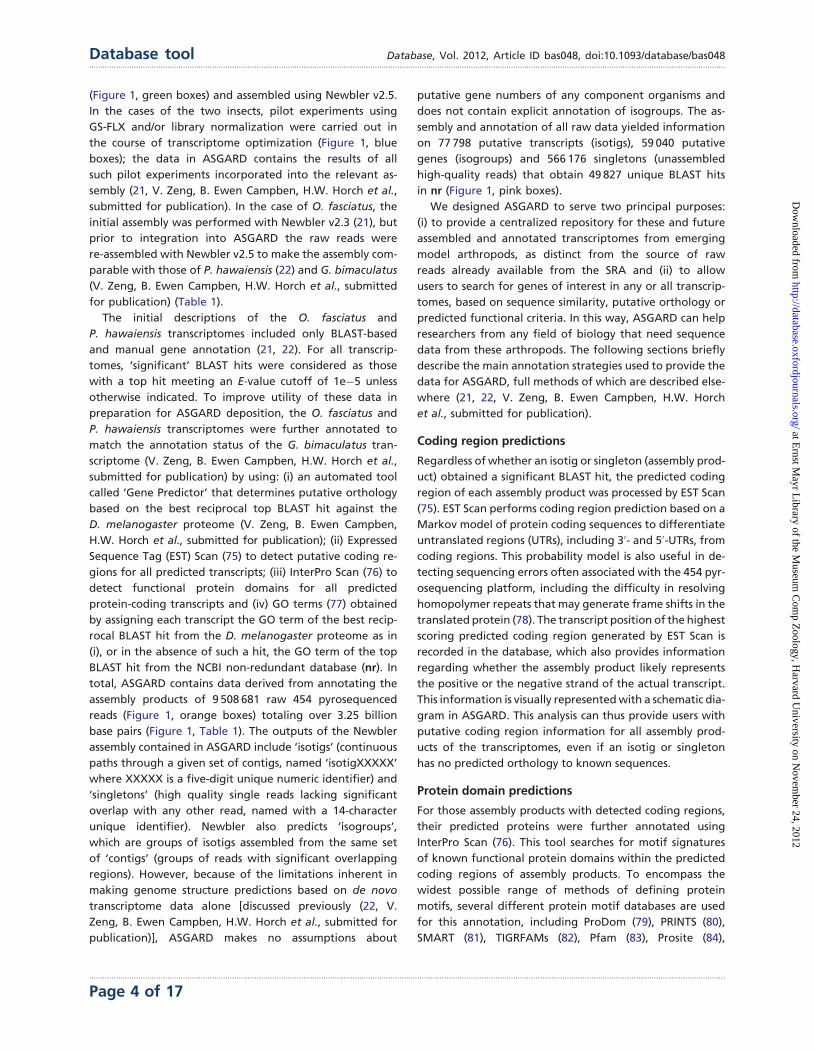
(Figure 1, green boxes) and assembled using Newbler v2.5.
In the cases of the two insects, pilot experiments using
GS-FLX and/or library normalization were carried out in
the course of transcriptome optimization (Figure 1, blue
boxes); the data in ASGARD contains the results of all
such pilot experiments incorporated into the relevant as-
sembly (21, V. Zeng, B. Ewen Campben, H.W. Horch et al.,
submitted for publication). In the case of O. fasciatus, the
initial assembly was performed with Newbler v2.3 (21), but
prior to integration into ASGARD the raw reads were
re-assembled with Newbler v2.5 to make the assembly com-
parable with those of P. hawaiensis (22) and G. bimaculatus
(V. Zeng, B. Ewen Campben, H.W. Horch et al., submitted
for publication) (Table 1).
The initial descriptions of the O. fasciatus and
P. hawaiensis transcriptomes included only BLAST-based
and manual gene annotation (21, 22). For all transcrip-
tomes, ‘significant’ BLAST hits were considered as those
with a top hit meeting an E-value cutoff of 1e�5 unless
otherwise indicated. To improve utility of these data in
preparation for ASGARD deposition, the O. fasciatus and
P. hawaiensis transcriptomes were further annotated to
match the annotation status of the G. bimaculatus tran-
scriptome (V. Zeng, B. Ewen Campben, H.W. Horch et al.,
submitted for publication) by using: (i) an automated tool
called ‘Gene Predictor’ that determines putative orthology
based on the best reciprocal top BLAST hit against the
D. melanogaster proteome (V. Zeng, B. Ewen Campben,
H.W. Horch et al., submitted for publication); (ii) Expressed
Sequence Tag (EST) Scan (75) to detect putative coding re-
gions for all predicted transcripts; (iii) InterPro Scan (76) to
detect functional protein domains for all predicted
protein-coding transcripts and (iv) GO terms (77) obtained
by assigning each transcript the GO term of the best recip-
rocal BLAST hit from the D. melanogaster proteome as in
(i), or in the absence of such a hit, the GO term of the top
BLAST hit from the NCBI non-redundant database (nr). In
total, ASGARD contains data derived from annotating the
assembly products of 9 508 681 raw 454 pyrosequenced
reads (Figure 1, orange boxes) totaling over 3.25 billion
base pairs (Figure 1, Table 1). The outputs of the Newbler
assembly contained in ASGARD include ‘isotigs’ (continuous
paths through a given set of contigs, named ‘isotigXXXXX’
where XXXXX is a five-digit unique numeric identifier) and
‘singletons’ (high quality single reads lacking significant
overlap with any other read, named with a 14-character
unique identifier). Newbler also predicts ‘isogroups’,
which are groups of isotigs assembled from the same set
of ‘contigs’ (groups of reads with significant overlapping
regions). However, because of the limitations inherent in
making genome structure predictions based on de novo
transcriptome data alone [discussed previously (22, V.
Zeng, B. Ewen Campben, H.W. Horch et al., submitted for
publication)], ASGARD makes no assumptions about
putative gene numbers of any component organisms and
does not contain explicit annotation of isogroups. The as-
sembly and annotation of all raw data yielded information
on 77 798 putative transcripts (isotigs), 59 040 putative
genes (isogroups) and 566 176 singletons (unassembled
high-quality reads) that obtain 49 827 unique BLAST hits
in nr (Figure 1, pink boxes).
We designed ASGARD to serve two principal purposes:
(i) to provide a centralized repository for these and future
assembled and annotated transcriptomes from emerging
model arthropods, as distinct from the source of raw
reads already available from the SRA and (ii) to allow
users to search for genes of interest in any or all transcrip-
tomes, based on sequence similarity, putative orthology or
predicted functional criteria. In this way, ASGARD can help
researchers from any field of biology that need sequence
data from these arthropods. The following sections briefly
describe the main annotation strategies used to provide the
data for ASGARD, full methods of which are described else-
where (21, 22, V. Zeng, B. Ewen Campben, H.W. Horch
et al., submitted for publication).
Coding region predictions
Regardless of whether an isotig or singleton (assembly prod-
uct) obtained a significant BLAST hit, the predicted coding
region of each assembly product was processed by EST Scan
(75). EST Scan performs coding region prediction based on a
Markov model of protein coding sequences to differentiate
untranslated regions (UTRs), including 30- and 50-UTRs, from
coding regions. This probability model is also useful in de-
tecting sequencing errors often associated with the 454 pyr-
osequencing platform, including the difficulty in resolving
homopolymer repeats that may generate frame shifts in the
translated protein (78). The transcript position of the highest
scoring predicted coding region generated by EST Scan is
recorded in the database, which also provides information
regarding whether the assembly product likely represents
the positive or the negative strand of the actual transcript.
This information is visually represented with a schematic dia-
gram in ASGARD. This analysis can thus provide users with
putative coding region information for all assembly prod-
ucts of the transcriptomes, even if an isotig or singleton
has no predicted orthology to known sequences.
Protein domain predictions
For those assembly products with detected coding regions,
their predicted proteins were further annotated using
InterPro Scan (76). This tool searches for motif signatures
of known functional protein domains within the predicted
coding regions of assembly products. To encompass the
widest possible range of methods of defining protein
motifs, several different protein motif databases are used
for this annotation, including ProDom (79), PRINTS (80),
SMART (81), TIGRFAMs (82), Pfam (83), Prosite (84),
.............................................................................................................................................................................................................................................................................................
Page 4 of 17
Database tool Database, Vol. 2012, Article ID bas048, doi:10.1093/database/bas048.............................................................................................................................................................................................................................................................................................
at Ernst M
ayr Library of the M
useum C
omp Z
oology, Harvard U
niversity on Novem
ber 24, 2012http://database.oxfordjournals.org/
Dow
nloaded from
PIRSF (85), SUPERFAMILY (86), CATH (87), PANTHER (88),
SignalPHMM (89) and Transmembrane (90). The location
of predicted protein domain motifs within the translation
is displayed schematically, enabling ASGARD users to bet-
ter interpret the potential structure and functions of pre-
dicted proteins. A link to the relevant protein database
website is also generated for each predicted motif, so
that users may easily obtain details of specific protein
domains.
Orthology (gene identity) predictions
Assembly products of transcriptomes were compared with
the NCBI nr database to determine their similarity to
known sequences, and the top 50 BLAST hits meeting an
E-value cutoff of 1e�5 were recorded in the database.
The criterion of reciprocal best BLAST hit against the
D. melanogaster proteome is a commonly used method of
automated annotation in projects involving insect genomes
(e.g. 91, 92). We therefore additionally employed this
method of putative orthology assignment as the
D. melanogaster proteome is well annotated, and is the
best annotated arthropod proteome derived from a com-
plete genome sequence. To do this, we used a previously
described custom script called ‘Gene Predictor’ (V. Zeng, B.
Ewen Campben, H.W. Horch et al., submitted for publica-
tion). Specifically, each D. melanogaster protein was quer-
ied against each assembly product of the ASGARD BLAST
databases using tBLASTn and conversely, each assembly
product was queried against the D. melanogaster prote-
ome BLAST database using BLASTx (93). Because each
predicted transcript may comprise multiple assembly prod-
ucts and multiple predicted isoforms may exist for a
Table 1. Transcriptome assembly statistics for data contained in ASGARD V1.0
Species O. fasciatus P. hawaiensis G. bimaculatus
Class, order Insecta, Hemiptera Malacostraca, Amphipoda Insecta, Orthoptera
No. of raw reads 2 087 410 3 172 925 4 248 346
Mean read length 297 400 349
No. of raw base pairs (bp) 619 186 225 1 204 620 614 1 483 726 666
Assembler(s) used Newbler v2.3, CAP3 Newbler v2.5 Newbler v2.5 Newbler v2.5
No. of reads input for assembly
(percent of raw reads)
2 041 966 (97.8) 2 041 951 (97.8) 3 157 373 (99.5) 4 216 721
No. of base pair input for assembly
(percent of raw base pairs)
566 097 669 (91.4) 566 080 984 (91.4) 1 179 544 291 (97.9) 1 449 059 795 (97.7)
No. of reads used in assembly products
(percent of reads input)
1 773 450 (86.8) 1 794 099 (87.9) 2 625 830 (83.2) 4 146 625 (98.3)
No. of base pairs assembled
(percent of base pair input)
508 738 047 (89.9) 509 976 789 (90.1) 1 027 860 567 (87.1) 1 383 106 269 (95.4)
No. of isotigs 21 097 20 985 35 301 21 512
No. of isogroups 16 617 16 849 25 735 16 456
No. of singletons
(percent assembled reads)
178 770a (10.1) 168 807a (9.5) 276 564 (8.8) 120 805 (2.9)
No. of CAP3 contigs 28 143 29 434 n/ab n/a
Isotig N50 1735 1651 1510 2133
No. of isotigs with BLAST hitsc (%) 7219d (43.4) 7305d (43.4e) 10 424 (29.5%) 11 943 (55.5)
No. of singletons with BLAST hits (%) 2367f (2.8) 2350g (2.8) 9583 (3.5) 10 815 (9.0)
No. of unique BLAST hits 10 775 10 886 19 067 19 874
No. of CAP3 contigs with BLAST hits (%) 2594 (9.2) 2642 (9.0%) n/a n/a
Mean no. of contigs per isotig 1.9 1.8 2.1 1.7
Mean no. of isotigs per isogroup 1.3 1.2 1.4 1.2
Mean coverage per base pair 23.2 28.7 25.4 51.3
aRefers to the number of singletons produced by the Newbler v2.3 assembly. These singletons were further assembled with CAP3,
resulting in CAP3 contigs and CAP3 singlets (reads still left as singletons); bCAP3 assembly of Newbler singletons was not performed
for P. hawaiensis or G. bimaculatus assemblies; cBLASTx performed against the NCBI non-redundant database (nr) with E-value cutoff of
e�5, unless otherwise specified; dBLASTx performed against RefSeq Protein database; ePercent isotigs with BLAST hits calculated by
dividing by the number of isogroups, because in this case, only one isotig per isogroup was used for BLAST analysis; fTotal number of
CAP3 singlets following CAP3 assembly of Newbler v2.3 singletons was 84 388; gTotal number of CAP3 singlets following CAP3 assembly
of Newbler v2.5 singletons was 85 053.
.............................................................................................................................................................................................................................................................................................
Page 5 of 17
Database, Vol. 2012, Article ID bas048, doi:10.1093/database/bas048 Database tool.............................................................................................................................................................................................................................................................................................
at Ernst M
ayr Library of the M
useum C
omp Z
oology, Harvard U
niversity on Novem
ber 24, 2012http://database.oxfordjournals.org/
Dow
nloaded from

transcript as discussed below (see ‘Treatment of putative
paralogs, isoforms and singletons’ section), only the top
50 results of the D. melanogaster proteome against assem-
bly product query were retained. Similarly, only the top
BLAST result of each assembly product against the
D. melanogaster proteome was used to infer whether a
specific D. melanogaster protein was the best match for a
given assembly product. To prevent a given assembly prod-
uct from being annotated repeatedly as different isoforms
of a single D. melanogaster gene, only the longest
D. melanogaster protein isoform was considered. To pre-
vent an assembly product from escaping annotation if its
top BLAST hit was not the longest isoform of a D. melano-
gaster gene, all D. melanogaster protein hits were verified
based on the gene rather than a particular protein product.
Treatment of putative paralogs, isoforms andsingletons
During iteration through the top 50 BLAST results of the
D. melanogaster proteome against the assembly products,
we also assessed whether those hits that were assigned a
putative orthology based on reciprocal BLAST (which we
call here ‘verified’ by Gene Predictor) might be paralogs
or isoforms. We used criteria for assessing putative paralogs
as previously described for the initial assemblies of ASGARD
transcriptomes (21, 22, V. Zeng, B. Ewen Campben, H.W.
Horch et al., submitted for publication). Specifically, we
asked whether the alignments of verified assembly prod-
ucts overlapped with any other verified assembly product
that had been assigned the same orthology. If the se-
quences did not overlap, they were considered to be frag-
ments of a single isoform that were not assembled
together due to insufficient overlap. If the assembly prod-
uct sequences overlapped, then we asked whether they had
been predicted as isoforms based on the original assembly.
Briefly, if two isotigs shared a contig, they were considered
likely to belong to the same isogroup, suggesting that they
were isoforms of the same gene. Singletons lack isogroup
information and were thus considered as putative isoforms.
If overlapping assembly products were not predicted to
belong to the same isoform, they were considered as puta-
tive paralogs. The same method of paralog inference was
used to determine whether specific D. melanogaster genes
might have multiple paralogs among the assembly
products.
We emphasize that although accurate prediction of iso-
forms, paralogs and orthologs is not possible in the absence
of complete genome sequences and phylogenetic analysis,
the assumptions described above will not prevent ASGARD
users from obtaining meaningful biological information
from the database. Our aim is to facilitate annotation of
assembly products, allowing users to retrieve sequence data
from these emerging model organisms based on similarity
to known genes or predicted function. Even if not all
paralogy or isoform assignments of assembly products are
accurate, sequence similarity can still be revealed by the
reciprocal BLAST searches performed by Gene Prediction.
GO annotations
The GO annotation of each assembly product was obtained
using blast2go (94, 95). The top 50 BLASTx hits of each as-
sembly product against nr were exported in M7 format
(XML). These XML BLAST data were then processed using
the command-line version of blast2go (b2gPipe) with data-
base version 2.3.5.
Database implementation
Unlike a genome database, the database schema of
ASGARD is designed around isotigs and singletons (assem-
bly products) rather than genome scaffolds. Figure 2 shows
a schematic representation of the database schema with
relevant input data and user interface outputs. Because
all singletons and isotigs obtained from assembly of raw
sequence data have unique identifiers, the ASGARD data-
base uses these identifiers (called ‘read name’ or ‘Sequence
ID’) to associate each assembly product with all annotation
data. Singular data (including read name, isogroup, assem-
bly product length, nucleotide sequence, predicted coding
sequence, translation and coding strand) are stored within
one central table (Figure 2, ‘assembled_sequences’). Data
where multiple values exist for each assembly product
(including protein motifs, BLAST hits and GO annotations)
are stored in separate tables (Figure 2, ‘protein_feature’,
‘blast_annotation’ and ‘go_annotation’) with multi-key
indexing associated with the read name of the central
table. Lastly, data produced by Gene Predictor are stored
in a separate table (Figure 2, ‘gene_prediction’). Because
under our annotation conditions every assembly product
can only be the ortholog of a single gene, the gene predic-
tion table is uniquely keyed to each assembly product iden-
tifier. This table is also multi-key indexed for the predicted
orthologous gene, which allows rapid query of all assembly
products annotated as putative orthologs of that gene.
To develop ASGARD and implement the ASGARD schema,
we used MySQL, custom Perl scripts with the Apache web
server hosting tool, and developed custom HTML5 and
JavaScript rendering code for the visual output displays.
Site navigation and overview ofsearch capabilities
The home page of ASGARD provides a brief description of
the provenance and preparation of the transcript se-
quences house in the database. To the bottom left is a
‘News’ area where ASGARD development updates are
posted. To the bottom right is a ‘Publications’ area that
.............................................................................................................................................................................................................................................................................................
Page 6 of 17
Database tool Database, Vol. 2012, Article ID bas048, doi:10.1093/database/bas048.............................................................................................................................................................................................................................................................................................
at Ernst M
ayr Library of the M
useum C
omp Z
oology, Harvard U
niversity on Novem
ber 24, 2012http://database.oxfordjournals.org/
Dow
nloaded from

provides updated literature obtained from PubMed men-
tioning any of the ASGARD transcriptome organisms.
A navigation menu at the top of the page allows users
to: (i) access pages where they can search ASGARD annota-
tions; (ii) use BLAST to query transcriptome sequences;
(iii) obtain contact information for ASGARD developers;
(iv) obtain citation information for ASGARD and its compo-
nent transcriptomes, including links to the PubMed entries
and PDFs for download and (v) download the assemblies of
all three transcriptomes in FASTA format. The download
page also provides links to previously described custom
scripts used for assembly (21, 22, V. Zeng, B. Ewen
Campben, H.W. Horch et al., submitted for publication),
and files listing the BLAST hits of assembly products.
The ‘Search’ link in the top navigation menu takes the
user to the main search page of ASGARD, with an introduc-
tion to the four search methods provided: (i) Gene
Prediction; (ii) Read Name; (iii) GO Annotation and
(iv) BLAST Annotation (Figure 3A). The search method intro-
duction text can be shown or hidden using a button on the
top left. Users are provided with a drop-down menu contain-
ing search options and a second drop-down menu where
they can choose the transcriptome they wish to query.
The ‘BLAST’ link in the top navigation menu takes users
to a page where they can search through transcriptome
sequences using the NCBI BLAST algorithm (96). Users can
query individual transcriptomes from a given organism, or
all transcriptome sequences in a single search.
User interface and queryimplementation
The following sections describe the input and output user
interfaces for the five search capabilities of ASGARD.
Figure 2. ASGARD database schema. Schematic of database implementation showing destination tables (gray/white) for eachdata type created by the data processing pipeline (pink), how users may access those data via the ASGARD web interface (yellow)and sources of linkout data provided by the ASGARD search results displays (blue). See main text for details.
.............................................................................................................................................................................................................................................................................................
Page 7 of 17
Database, Vol. 2012, Article ID bas048, doi:10.1093/database/bas048 Database tool.............................................................................................................................................................................................................................................................................................
at Ernst M
ayr Library of the M
useum C
omp Z
oology, Harvard U
niversity on Novem
ber 24, 2012http://database.oxfordjournals.org/
Dow
nloaded from

Figure 3. ASGARD Gene Prediction search. The search page gives users access to the Gene Prediction, Read Name, GOAnnotation and BLAST Annotation search functions. (A) The input user interface allows users to choose an organism of interestand enter query terms based on D. melanogaster gene names. While entering the search term, users are assisted by anauto-completed list of suggested matching gene names. In this example, a user searching for G. bimaculatus orthologs ofJanus kinase (JAK) has begun to enter the name of the D. melanogaster JAK ortholog ‘hopscotch’, which obtained an exactmatch in the auto-completion list (arrow). (B) The output of the gene prediction search shows predicted ortholog matches, adescription of the D. melanogaster gene, schematic representations of and links to matching assembly products.
.............................................................................................................................................................................................................................................................................................
Page 8 of 17
Database tool Database, Vol. 2012, Article ID bas048, doi:10.1093/database/bas048.............................................................................................................................................................................................................................................................................................
at Ernst M
ayr Library of the M
useum C
omp Z
oology, Harvard U
niversity on Novem
ber 24, 2012http://database.oxfordjournals.org/
Dow
nloaded from

Search by Gene Prediction
It can be difficult to distinguish the most likely ortholog to a
query sequence among multiple results with low E-values
obtained by BLAST searches against nr. For ASGARD users
wishing to identify putative O. fasciatus, P. hawaiensis and
G. bimaculatus orthologs of genes of interest, the most
direct route is therefore to use a Gene Prediction search
(Figure 3A). Users can choose an organism of interest from
the drop-down menu and enter query terms into the search
box. Query terms may be a complete or abbreviated D. mel-
anogaster gene name. A link to FlyBase (12) is provided to
help users find D. melanogaster gene names. As the user
enters a query term, the auto-complete function suggests
results ranked in order of best match, retrieved from the
pre-computed reciprocal BLAST data to the D. melanogaster
proteome (Figure 3A). Only genes with predicted orthologs
in the selected transcriptome appear as results of the
auto-complete function, allowing users to quickly detect
whether a putative ortholog to their gene of interest is avail-
able in ASGARD (Figure 3A, arrow). Users can choose a term
from the auto-complete list or click the search button. If any
predicted orthologs of the query gene are present in the
transcriptomes, ASGARD directs the users to a dynamically
generated Common Gateway interface (CGI) page that in-
cludes a link to each read annotated as a putative ortholog
(Figure 3B). The results page also contains the name of the
predicted D. melanogaster ortholog, the FlyBase description
of the gene and an explanation of the search results display.
Because the current ASGARD transcriptomes were
created with tissue-specific samples and were not all
sequenced to saturation (21, 22, V. Zeng, B. Ewen
Campben, H.W. Horch et al., submitted for publication),
many predicted transcripts are incompletely covered with
fragmented (non-overlapping) assembly products. As a
result, users may obtain multiple assembly products as
matches to a query. In addition, multiple splicing isoforms
of many genes may be present in the transcriptomes. The
results page therefore includes a graphical interface, de-
signed to help users visualize all of the matching different
assembly products identified as putative orthologs of the
query gene (Figure 3B), and to understand which portions
of their gene of interest have sequence coverage in the
transcriptomes. In this schematic, a black bar representing
the full-length D. melanogaster protein is used as a parent
track and beneath it, the matching regions of each assem-
bly product are displayed on individual tracks as grey bars.
Tracks of the same length shown in different shades of grey
indicate potential isoforms. The unique identifier (read
name) of each assembly product result is listed to the left
of the schematic and links to all annotation information
about each sequence. On this and all other search result
pages, explanatory text and result components can be
shown or hidden using buttons at the left.
Search by Read Name
The read name search method provides comprehensive an-
notation information about each transcript. As read names
are the unique identifiers of isotigs and singletons, users
are unlikely to know these read names a priori, and will
therefore perform this search most easily by clicking on
read name links returned as results of gene predictor,
BLAST annotation, GO annotation or NCBI BLAST searches
in ASGARD. Links to or searches for read names direct users
to a dynamically generated CGI page containing all anno-
tation data for the specified read name.
The page displays eight types of information for each as-
sembly product (Figure 4): (i) the read name (‘sequence ID’);
(ii) the name of the predicted D. melanogaster ortholog ob-
tained by Gene Predictor if applicable; (iii) the GO annota-
tion prediction if applicable, including a link to the GO
accession number that allows users to access all transcripts
from the query organism with the same GO annotation;
(iv) the nucleotide sequence of the predicted coding strand
[negative (NEG) or positive (POS) strand is indicated] based
on EST Scan results, including a link to the sequence in FASTA
format (predicted non-coding sequences are indicated as
such above the nucleotide sequence); (v) the predicted
amino acid sequence of the assembly product based on EST
Scan results if applicable, including a link to the sequence in
FASTA format (for predicted non-coding sequences no trans-
lation is shown); (vi) a schematic of the predicted protein
coding region (white bar) relative to the entire nucleotide
sequence of the assembly product (black bar), the lengths of
both sequences are indicated; (vii) a list of predicted func-
tional protein domains based on InterPro Scan analysis if
applicable, with a schematic representation of the portion
of the transcript sequence containing each domain (yellow
bars), for each predicted protein domain, links are provided
to the relevant protein database where users can obtain fur-
ther information about each domain and (viii) the
pre-computed results of a BLAST search against the NCBI
nr database using the assembly product as a query (E-value
cutoff 1e�5). BLAST results are listed in order of increasing
E-value, and display the species identity and sequence name
of the result, E-value, NCBI accession number and a sche-
matic showing the overlapping region of query (white) and
subject (black) sequences. The NCBI accession numbers are
links to the corresponding GenBank accession.
In addition to providing complete information on reads
retrieved via other searches, the read name search method
will also be useful for researchers to revisit a particular se-
quence of interest for which they have noted the unique
ASGARD read name.
Search by GO Annotation
ASGARD users who would like to identify all transcriptome
sequences from a given organism that fall into a given GO
.............................................................................................................................................................................................................................................................................................
Page 9 of 17
Database, Vol. 2012, Article ID bas048, doi:10.1093/database/bas048 Database tool.............................................................................................................................................................................................................................................................................................
at Ernst M
ayr Library of the M
useum C
omp Z
oology, Harvard U
niversity on Novem
ber 24, 2012http://database.oxfordjournals.org/
Dow
nloaded from

Fig
ure
4.
ASG
AR
DR
ea
dN
am
ese
arc
h.
Th
ein
pu
tu
ser
inte
rfa
cea
llo
ws
use
rsto
en
ter
an
ass
em
bly
pro
du
ct(i
soti
go
rsi
ng
leto
n)
un
iqu
eid
en
tifi
er
(re
ad
na
me
)o
bta
ine
dw
ith
an
yo
fth
eo
the
rse
arc
hm
eth
od
s(F
igu
res
3a
nd
5–7
).In
this
exa
mp
le,
rea
dn
am
eis
oti
g0
42
76
wa
so
bta
ine
din
aG
en
eP
red
icti
on
sea
rch
(Fig
ure
3)
as
ap
uta
tive
G.
bim
acu
latu
sJA
Ko
rth
olo
g.
Th
eo
utp
ut
of
rea
dn
am
ese
arc
he
sp
rovi
de
sa
lla
nn
ota
tio
nd
ata
for
the
sele
cte
da
sse
mb
lyp
rod
uct
.
.............................................................................................................................................................................................................................................................................................
Page 10 of 17
Database tool Database, Vol. 2012, Article ID bas048, doi:10.1093/database/bas048.............................................................................................................................................................................................................................................................................................
at Ernst M
ayr Library of the M
useum C
omp Z
oology, Harvard U
niversity on Novem
ber 24, 2012http://database.oxfordjournals.org/
Dow
nloaded from
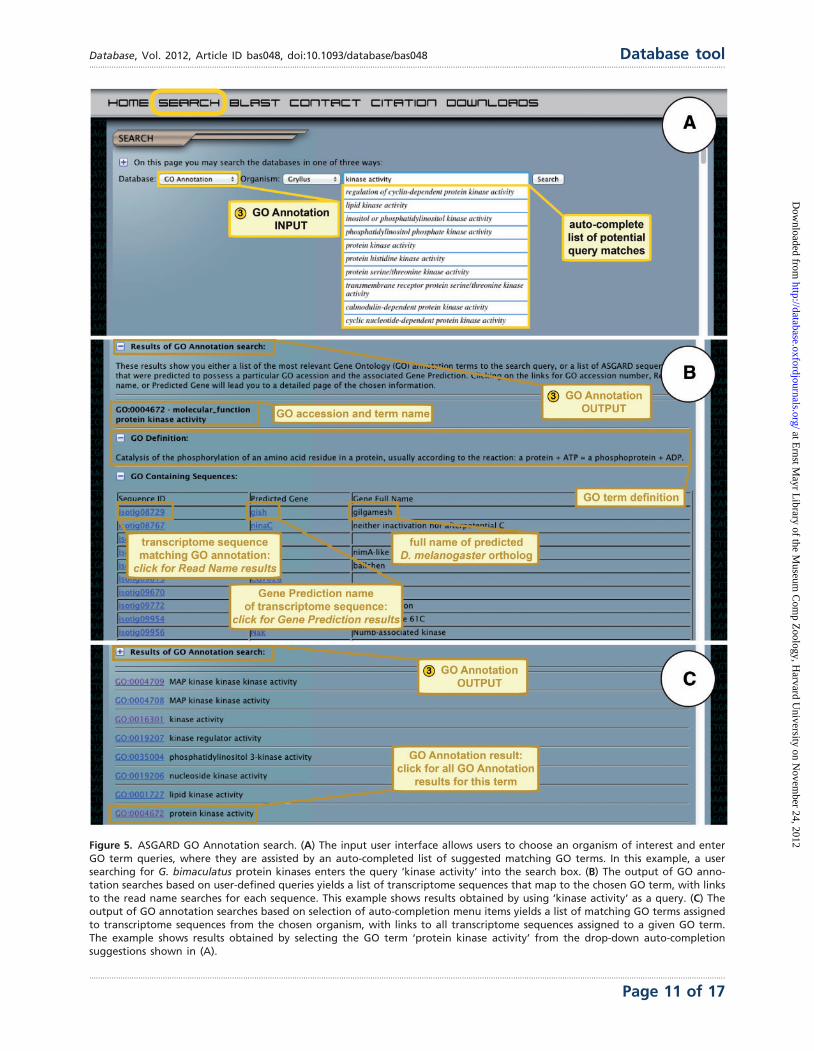
Figure 5. ASGARD GO Annotation search. (A) The input user interface allows users to choose an organism of interest and enterGO term queries, where they are assisted by an auto-completed list of suggested matching GO terms. In this example, a usersearching for G. bimaculatus protein kinases enters the query ‘kinase activity’ into the search box. (B) The output of GO anno-tation searches based on user-defined queries yields a list of transcriptome sequences that map to the chosen GO term, with linksto the read name searches for each sequence. This example shows results obtained by using ‘kinase activity’ as a query. (C) Theoutput of GO annotation searches based on selection of auto-completion menu items yields a list of matching GO terms assignedto transcriptome sequences from the chosen organism, with links to all transcriptome sequences assigned to a given GO term.The example shows results obtained by selecting the GO term ‘protein kinase activity’ from the drop-down auto-completionsuggestions shown in (A).
.............................................................................................................................................................................................................................................................................................
Page 11 of 17
Database, Vol. 2012, Article ID bas048, doi:10.1093/database/bas048 Database tool.............................................................................................................................................................................................................................................................................................
at Ernst M
ayr Library of the M
useum C
omp Z
oology, Harvard U
niversity on Novem
ber 24, 2012http://database.oxfordjournals.org/
Dow
nloaded from

category can use the GO Annotation search function. Users
select an organism of interest from the drop-down menu
and enter query terms into the search box (Figure 5A). All
or part of GO term may be used as a query and a link to the
GO (77) web page is provided to help users find GO terms if
necessary. As the user enters a query term, the
auto-complete function suggests GO terms that the user
may choose to search, or they can simply enter their desired
text and click the search button (Figure 5A).
In response to user queries, ASGARD utilizes two differ-
ent search algorithms. The first algorithm is initiated if
the user enters a search term and clicks the search
button. This algorithm takes the user to a dynamic CGI
page with a list of matching GO terms assigned to transcrip-
tome sequences, listed in order of descending relevance
(Figure 5B) (relevance is defined as the number of words
matching the query possessed by each GO term). GO acces-
sion numbers in the results list are links to a page listing
transcriptome sequences from their chosen organism that
were assigned to the selected GO term.
The second algorithm is used if the user selects a term
from the auto-completion list. The auto-completion
module uses an exact match algorithm, which means the
suggested GO terms must possess each of the search words
to be counted as a match. This module shows the first 10
GO terms found under these criteria. Choosing a GO term
in this way takes the user to a dynamic CGI page listing
transcriptome sequences from their chosen organism that
were assigned the selected GO term (Figure 5C). The unique
identifiers of these results provide links to the results of the
read name search.
Search by BLAST Annotation
Searching for an ASGARD sequence similar to a gene of
interest via BLAST is limited by the query sequence, and
the Gene Predictor search method is similarly limited by
Figure 6. ASGARD BLAST Annotation search. Top: the input user interface allows users to select an organism of interest andenter queries based on gene names from any organism. This example shows what a user might enter to search forG. bimaculatus transcripts similar to JAK orthologs from any organism in nr. Bottom: the output of this search lists BLAST hitsagainst nr whose text descriptions contain the search term, with links to the NCBI accession for each hit, schematic represen-tations of matching transcriptome sequences and links to read name data.
.............................................................................................................................................................................................................................................................................................
Page 12 of 17
Database tool Database, Vol. 2012, Article ID bas048, doi:10.1093/database/bas048.............................................................................................................................................................................................................................................................................................
at Ernst M
ayr Library of the M
useum C
omp Z
oology, Harvard U
niversity on Novem
ber 24, 2012http://database.oxfordjournals.org/
Dow
nloaded from
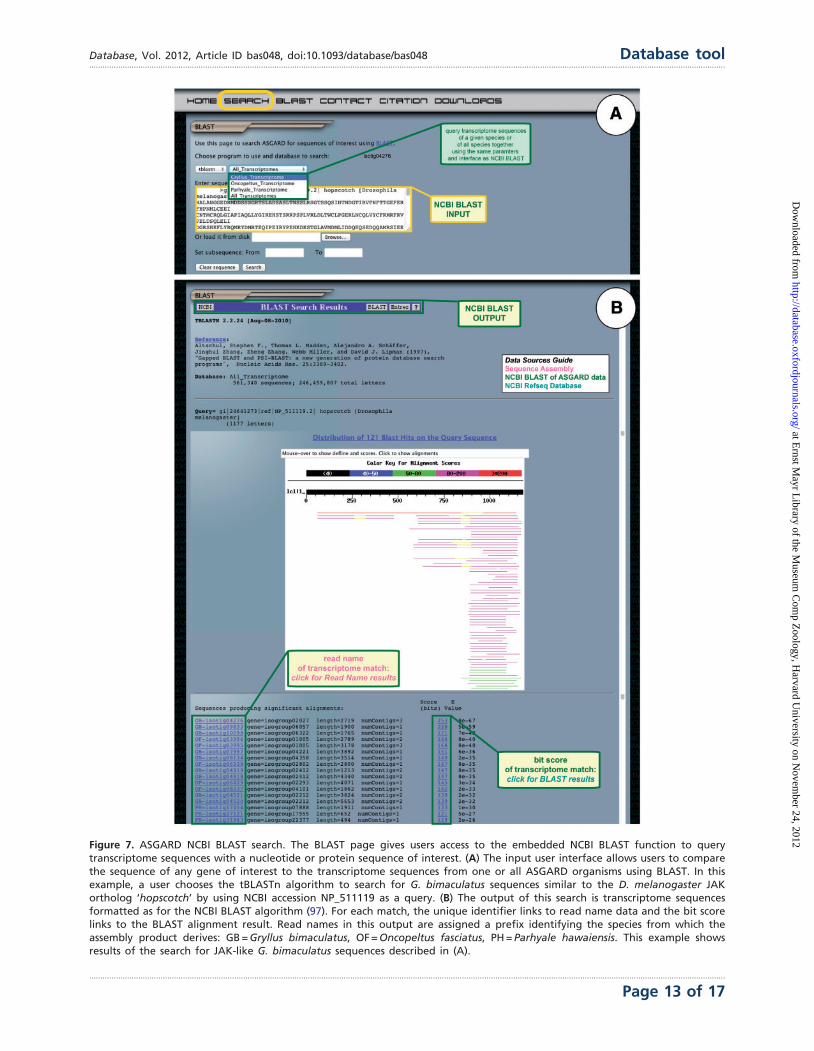
Figure 7. ASGARD NCBI BLAST search. The BLAST page gives users access to the embedded NCBI BLAST function to querytranscriptome sequences with a nucleotide or protein sequence of interest. (A) The input user interface allows users to comparethe sequence of any gene of interest to the transcriptome sequences from one or all ASGARD organisms using BLAST. In thisexample, a user chooses the tBLASTn algorithm to search for G. bimaculatus sequences similar to the D. melanogaster JAKortholog ‘hopscotch’ by using NCBI accession NP_511119 as a query. (B) The output of this search is transcriptome sequencesformatted as for the NCBI BLAST algorithm (97). For each match, the unique identifier links to read name data and the bit scorelinks to the BLAST alignment result. Read names in this output are assigned a prefix identifying the species from which theassembly product derives: GB = Gryllus bimaculatus, OF = Oncopeltus fasciatus, PH = Parhyale hawaiensis. This example showsresults of the search for JAK-like G. bimaculatus sequences described in (A).
.............................................................................................................................................................................................................................................................................................
Page 13 of 17
Database, Vol. 2012, Article ID bas048, doi:10.1093/database/bas048 Database tool.............................................................................................................................................................................................................................................................................................
at Ernst M
ayr Library of the M
useum C
omp Z
oology, Harvard U
niversity on Novem
ber 24, 2012http://database.oxfordjournals.org/
Dow
nloaded from
the D. melanogaster proteome sequences. The BLAST an-
notation search therefore provides users with an alterna-
tive method to identify genes that may most closely
resemble known sequences from organisms other than
D. melanogaster, or that may have been lost in the lineage
leading to D. melanogaster. Users select a transcriptome of
interest from the drop-down menu and enter a query term,
which may be gene name of any organism (Figure 6, top).
This prompts a text search through descriptions of all
pre-computed BLAST hits against nr for each assembly
product in the selected ASGARD transcriptome. The results
of the search are displayed on a dynamic CGI page and
include the search term and list of BLAST hits in order of
increasing E-value (Figure 6, bottom). The results are dis-
played as described above for the BLAST hit results of the
read name search.
BLAST against NCBI nr sequences
Finally, ASGARD users may search all transcriptome se-
quences based on nucleotide or protein similarity to nr se-
quences using the embedded NCBI BLAST module. All
ASGARD sequences have been formatted as nucleotide
BLAST databases. The user interface mimics that of the
NCBI BLAST interface, which is likely familiar to prospective
ASGARD users. The transcriptome databases can be queried
with a nucleotide sequence using BLASTn or tBLASTx or
with a protein sequence using tBLASTn (Figure 7A). The
output of these searches is formatted identically to BLAST
results obtained through NCBI (Figure 7B). Based on the
unique identifier of each sequence in ASGARD, BLAST re-
sults are parsed to create a link for each hit that directs the
user to the read name results. The bit score of each hit links
to the alignment of the query and subject sequences for a
given BLAST hit.
Conclusions and futureperspectives
The ASGARD web interface provides public, searchable
access to de novo transcriptomes for three emerging
model arthropod species. The original descriptions of
these transcriptomes (21, 22, V. Zeng, B. Ewen Campben,
H.W. Horch et al., submitted for publication) provided SRA
accession numbers (Figure 1) and links to raw data and as-
sembly files but the annotated data for O. fasciatus and
P. hawaiensis were initially searchable only by text searches
through the FASTA format files. ASGARD provides a solu-
tion to this problem, allowing users to obtain comprehen-
sive annotation data for each transcriptome assembly
product. In the immediate future, ASGARD will also serve
as a repository for the results of RNA-Seq experiments,
genome sequencing and other NGS applications on
ASGARD organisms. We will augment the existing
transcriptomes with such data produced by our group
and invite other researchers generating NGS data for
O. fasciatus, G. bimaculatus or P. hawaiensis to submit
their data to ASGARD for processing via our data ana-
lysis pipeline and inclusion in the searchable database.
To facilitate this, future versions of ASGARD will contain
an upload interface for interested researchers to deposit
and annotate their sequence data. As new sequence
data are added to ASGARD, the baseline assemblies and
annotations will also be updated, providing increasingly
comprehensive coverage of the transcriptomes of these
arthropods.
If and when future genomic data are generated for
these organisms, the ASGARD transcriptomes will provide
a useful method of immediately validating genome
annotations, as all ASGARD data are currently publicly
available. At the moment, to our knowledge, there are
no public projects planned for sequencing the genomes
of P. hawaiensis or G. bimaculatus. However, sequencing
of the O. fasciatus genome (https://www.hgsc.bcm.edu/
content/i5k-milkweed-bug) has recently been undertaken
by the i5k project (http://arthropodgenomes.org/wiki/i5K),
and we plan to ensure that the ASGARD database is fully
relational with the O. fasciatus genome data when they
become available. At the moment, however, this genome
project is in its infancy and no final repository or database
structure for the genome data has yet been publicly
decided upon.
RNA interference (97) and targeted genome editing
techniques (98, 99) have extended the power of functional
genetic testing to nearly any arthropod organism in prin-
ciple (100). The examples of long-standing, highly successful
organism-specific databases, including FlyBase (12, 101) and
VectorBase (102, 103) illustrate that such databases are in-
strumental in helping researchers make effective use of
functional tools and build sustainable research commu-
nities. Albeit at a more modest scale, searchable databases
such as ASGARD are required to maximize the potential of
NGS data for organisms with limited genomic resources, as
they make sequence data publicly available in an easily
searchable format. We anticipate that ASGARD will be a
useful repository and resource for NGS and genomic data
generated for additional non-traditional arthropod
models, and welcome deposition of sequence data from
researchers working on such organisms.
Acknowledgements
Thanks to James Cuff and the Harvard Faculty of Arts and
Sciences Research Computing Group for ASGARD sugges-
tions and discussion, Seth Donoughe for suggestions on
figure design and members of the Extavour lab for discus-
sion and ASGARD beta testing.
.............................................................................................................................................................................................................................................................................................
Page 14 of 17
Database tool Database, Vol. 2012, Article ID bas048, doi:10.1093/database/bas048.............................................................................................................................................................................................................................................................................................
at Ernst M
ayr Library of the M
useum C
omp Z
oology, Harvard U
niversity on Novem
ber 24, 2012http://database.oxfordjournals.org/
Dow
nloaded from

Funding
The Harvard Stem Cell Institute (Seed Grant number
SG-0057-10-00 to C.G.E.); the Ellison Medical Foundation
(New Scholar Award number AG-NS-07010-10 to C.G.E.);
the National Science Foundation (grant number
IOS-0817678 to C.G.E.).
Conflict of interest. None declared.
References1. Adams,M.D., Celniker,S.E., Holt,R.A. et al. (2000) The genome se-
quence of Drosophila melanogaster. Science, 287, 2185–2195.
2. Venter,J.C., Adams,M.D., Myers,E.W. et al. (2001) The sequence of
the human genome. Science, 291, 1304–1351.
3. Initiative,A.G. (2000) Analysis of the genome sequence of the flow-
ering plant Arabidopsis thaliana. Nature, 408, 796–815.
4. Goffeau,A., Barrell,B.G., Bussey,H. et al. (1996) Life with 6000
genes. Science, 274, 546–563.
5. Myers,E.W., Sutton,G.G., Delcher,A.L. et al. (2000) A whole-genome
assembly of Drosophila. Science, 287, 2196–2204.
6. Mita,K., Morimyo,M., Okano,K. et al. (2003) The construction of an
EST database for Bombyx mori and its application. Proc. Natl Acad.
Sci. USA, 100, 14121–14126.
7. Wang,L., Wang,S., Li,Y., Paradesi,M.S. et al. (2007) BeetleBase: the
model organism database for Tribolium castaneum. Nucleic Acids
Res., 35, D476–D479.
8. Gauthier,J.P., Legeai,F., Zasadzinski,A. et al. (2007) AphidBase: a
database for aphid genomic resources. Bioinformatics, 23, 783–784.
9. Brown,S.J., Denell,R., Gibbs,R. et al. (2008) The genome of the
model beetle and pest Tribolium castaneum. Nature, 452, 949–955.
10. Consortium,I.A.G. (2010) Genome sequence of the pea aphid
Acyrthosiphon pisum. PLoS Biol., 8, e1000313.
11. Xia,Q., Zhou,Z., Lu,C. et al. (2004) A draft sequence for the genome
of the domesticated silkworm (Bombyx mori). Science, 306,
1937–1940.
12. FlyBase–the Drosophila database. The FlyBase Consortium. Nucleic
Acids Res., 22, 3456–3458.
13. Papanicolaou,A., Stierli,R., Ffrench-Constant,R.H. et al. (2009) Next
generation transcriptomes for next generation genomes using
est2assembly. BMC Bioinformatics, 10, 447.
14. Vera,J.C., Wheat,C.W., Fescemyer,H.W. et al. (2008) Rapid transcrip-
tome characterization for a nonmodel organism using 454 pyrose-
quencing. Mol. Ecol., 17, 1636–1647.
15. Meyer,E., Aglyamova,G.V., Wang,S. et al. (2009) Sequencing and de
novo analysis of a coral larval transcriptome using 454 GSFlx. BMC
Genomics, 10, 219.
16. Bellin,D., Ferrarini,A., Chimento,A. et al. (2009) Combining
next-generation pyrosequencing with microarray for large scale ex-
pression analysis in non-model species. BMC Genomics, 10, 555.
17. Birol,I., Jackman,S.D., Nielsen,C.B. et al. (2009) De novo transcrip-
tome assembly with ABySS. Bioinformatics, 25, 2872–2877.
18. Kumar,S. and Blaxter,M.L. (2010) Comparing de novo assemblers
for 454 transcriptome data. BMC Genomics, 11, 571.
19. Chen,S., Yang,P., Jiang,F. et al. (2010) De novo analysis of transcrip-
tome dynamics in the migratory locust during the development of
phase traits. PLoS ONE, 5, e15633.
20. Surget-Groba,Y. and Montoya-Burgos,J.I. (2010) Optimization of de
novo transcriptome assembly from next-generation sequencing
data. Genome Res., 20, 1432–1440.
21. Ewen-Campen,B., Shaner,N., Panfilio,K.A. et al. (2011) The maternal
and embryonic transcriptome of the milkweed bug Oncopeltus fas-
ciatus. BMC Genomics, 12, 61.
22. Zeng,V., Villanueva,K.E., Ewen-Campen,B. et al. (2011) De novo as-
sembly and characterization of a maternal and developmental
transcriptome for the emerging model crustacean Parhyale
hawaiensis. BMC Genomics, 12, 581.
23. Wang,Z., Gerstein,M. and Snyder,M. (2009) RNA-Seq: a revolution-
ary tool for transcriptomics. Nat. Rev. Genet., 10, 57–63.
24. Ozsolak,F. and Milos,P.M. (2011) RNA sequencing: advances, chal-
lenges and opportunities. Nat. Rev. Genet., 12, 87–98.
25. Wheeler,D.L., Barrett,T., Benson,D.A. et al. (2008) Database re-
sources of the National Center for Biotechnology Information.
Nucleic Acids Res., 36, D13–D21.
26. Zhang,X., Zheng,Y., Jagadeeswaran,G. et al. (2012) Identification
and developmental profiling of conserved and novel microRNAs
in Manduca sexta. Insect Biochem. Mol. Biol., 42, 381–395.
27. Zhang,D., Lax,A.R., Henrissat,B. et al. (2012) Carbohydrate-active
enzymes revealed in Coptotermes formosanus (Isoptera:
Rhinotermitidae) transcriptome. Insect Mol. Biol., 21, 235–245.
28. Xie,L., Zhang,L., Zhong,Y. et al. (2012) Profiling the metatranscrip-
tome of the protistan community in Coptotermes formosanus with
emphasis on the lignocellulolytic system. Genomics, 99, 246–255.
29. Liu,F., Tang,T., Sun,L. et al. (2012) Transcriptomic analysis of the
housefly (Musca domestica) larva using massively parallel pyrose-
quencing. Mol. Biol. Rep., 39, 1927–1934.
30. He,W., You,M., Vasseur,L. et al. (2012) Developmental and insecti-
cide-resistant insights from the de novo assembled transcriptome of
the diamondback moth, Plutella xylostella. Genomics, 99, 169–177.
31. Diego-Garcia,E., Peigneur,S., Clynen,E. et al. (2012) Molecular diver-
sity of the telson and venom components from Pandinus cavimanus
(Scorpionidae Latreille 1802): transcriptome, venomics and func-
tion. Proteomics, 12, 313–328.
32. Blythe,M.J., Malla,S., Everall,R. et al. (2012) High-throughput
sequencing of the Parhyale hawaiensis mRNAs and microRNAs to
aid comparative developmental studies. PLoS One, 7, e33784.
33. Bengtsson,J.M., Trona,F., Montagne,N. et al. (2012) Putative che-
mosensory receptors of the codling moth, Cydia pomonella, iden-
tified by antennal transcriptome analysis. PLoS One, 7, e31620.
34. Wang,X.W., Luan,J.B., Li,J.M. et al. (2011) Transcriptome analysis
and comparison reveal divergence between two invasive whitefly
cryptic species. BMC Genomics, 12, 458.
35. Edgecombe,G.D. (1998) Arthropod Fossils and Phylogeny. Columbia
University Press, New York, p. 347.
36. Manton,S.M. (1977) The Arthropoda: Habits, Functional
Morphology, and Evolution. Clarendon Press, Oxford, p. 527.
37. Gupta,A.P. (1979) Arthropod Phylogeny. Van Nost. Reinhold,
p. 762.
38. Fortey,R.A. and Thomas,R.H. (1998) Arthropod Relationships.
Chapman & Hall, London, p. 383.
39. Boudreaux,H.B. (1987) Arthropod Phylogeny with Special Reference
to Insects. Robert E. Krieger Publishing Co., Malabar, FL, p. 320.
40. Roy,H., Clercq,P.D., Handley,L.-J.L. et al. (2012) Invasive Alien
Arthropod Predators and Parasitoids: An Ecological Approach.
Springer, New York, p. 275.
41. Jolivet,P. (1998) Interrelationship Between Insects and Plants. CRC
Press, Boca Raton, FL, p. 336.
.............................................................................................................................................................................................................................................................................................
Page 15 of 17
Database, Vol. 2012, Article ID bas048, doi:10.1093/database/bas048 Database tool.............................................................................................................................................................................................................................................................................................
at Ernst M
ayr Library of the M
useum C
omp Z
oology, Harvard U
niversity on Novem
ber 24, 2012http://database.oxfordjournals.org/
Dow
nloaded from
42. Ozaki,K., Yukawa,J., Ohgushi,T. et al. (2006) Galling Arthropods
and Their Associates. Springer, New York, p. 304.
43. Gupta,A.P. (1991) Immunology of Insects and Other Arthtropods
(Comparative Arthrpod Morphology, Physiology, and
Development). CRC Press, Boca Raton, FL, p. 508.
44. Wigglesworth,V.B. (1946) Insect Physiology. Methuen & Co. Ltd.,
London, p. 134.
45. Dudley,R. (2002) The Biomechanics of Insect Flight: Form, Function,
Evolution. Princeton University Press, Princeton, NJ, p. 536.
46. Alexander,D.E. (2004) Nature’s Flyers: Birds, Insects, and the
Biomechanics of Flight. The Johns Hopkins University Press,
Baltimore, MD, p. 304.
47. Ashburner,M., Golic,K.G. and Hawley,R.S. (2005) Drosophila:
A Laboratory Handbook. Cold Spring Harbor Laboratory Press,
Cold Spring Harbor, NY, p. 1331.
48. Morgan,T.H. (1910) Sex limited inheritance in Drosophila. Science,
32, 120–122.
49. Greenspan,R.J. (2004) Fly Pushing: The Theory and Practice of
Drosophila Genetics. Cold Spring Harbor Laboratory Press, Cold
Spring Harbor, NY, p. 155.
50. del Valle Rodriguez,A., Didiano,D. and Desplan,C. (2011) Power
tools for gene expression and clonal analysis in Drosophila. Nat.
Chem. Biol., 9, 47–55.
51. St Johnston,D. (2002) The art and design of genetic screens:
Drosophila melanogaster. Nat. Rev. Genet., 3, 176–188.
52. Holt,R.A., Subramanian,G.M., Halpern,A. et al. (2002) The genome
sequence of the malaria mosquito Anopheles gambiae. Science,
298, 129–149.
53. Zhan,S., Merlin,C., Boore,J.L. et al. (2011) The monarch butterfly
genome yields insights into long-distance migration. Cell, 147,
1171–1185.
54. Heliconius Genome Consortium. Butterfly genome reveals promis-
cuous exchange of mimicry adaptations among species. Nature,
487, 94–98.
55. Grimaldi,D. and Engel,M.S. (2005) Evolution of the Insects.
Cambridge University Press, Cambridge, p. 772.
56. Khila,A., Abouheif,E. and Rowe,L. (2012) Function, developmental
genetics, and fitness consequences of a sexually antagonistic trait.
Science, 336, 585–589.
57. Liu,P. and Kaufman,T.C. (2009) Dissection and fixation of large
milkweed bug (Oncopeltus) embryos. Cold Spring Harb. Protoc.,
2009, pdb.prot5261.
58. Liu,P. and Kaufman,T.C. (2009) Morphology and husbandry of the
large milkweed bug, Oncopeltus fasciatus. Cold Spring Harb.
Protoc., 2009, pdb.emo127.
59. Liu,P. and Kaufman,T.C. (2009) In situ hybridization of large milk-
weed bug (Oncopeltus) tissues. Cold Spring Harb. Protoc., 2009,
pdb.prot5262.
60. Hrycaj,S., Mihajlovic,M., Mahfooz,N. et al. (2008) RNAi analysis of
nubbin embryonic functions in a hemimetabolous insect,
Oncopeltus fasciatus. Evol. Dev., 10, 705–716.
61. Chesebro,J., Hrycaj,S., Mahfooz,N. et al. (2009) Diverging functions
of Scr between embryonic and post-embryonic development in a
hemimetabolous insect, Oncopeltus fasciatus. Dev. Biol., 329,
142–151.
62. Regier,J.C., Shultz,J.W., Zwick,A. et al. (2010) Arthropod relation-
ships revealed by phylogenomic analysis of nuclear protein-coding
sequences. Nature, 463, 1079–1083.
63. Ozhan-Kizil,G., Havemann,J. and Gerberding,M. (2009) Germ cells
in the crustacean Parhyale hawaiensis depend on Vasa protein for
their maintenance but not for their formation. Dev. Biol., 327,
230–239.
64. Liubicich,D.M., Serano,J.M., Pavlopoulos,A. et al. (2009) Knockdown
of Parhyale Ultrabithorax recapitulates evolutionary changes in
crustacean appendage morphology. Proc. Natl Acad. Sci. USA,
106, 13892–13896.
65. Vargas-Vila,M.A., Hannibal,R.L., Parchem,R.J. et al. (2010) A prom-
inent requirement for single-minded and the ventral midline in
patterning the dorsoventral axis of the crustacean Parhyale
hawaiensis. Development, 137, 3469–3476.
66. Pavlopoulos,A. and Averof,M. (2005) Establishing genetic trans-
formation for comparative developmental studies in the crustacean
Parhyale hawaiensis. Proc. Natl Acad. Sci. USA, 102, 7888–7893.
67. Pavlopoulos,A., Kontarakis,Z., Liubicich,D.M. et al. (2009) Probing
the evolution of appendage specialization by Hox gene misexpres-
sion in an emerging model crustacean. Proc. Natl Acad. Sci. USA,
106, 13897–13902.
68. Kontarakis,Z., Pavlopoulos,A., Kiupakis,A. et al. (2011) A versatile
strategy for gene trapping and trap conversion in emerging model
organisms. Development, 138, 2625–2630.
69. Mito,T. and Noji,S. (2009) The two-spotted cricket Gryllus bimacu-
latus: An emerging model for developmental and regeneration
studies. In: Emerging Model Organisms: A Laboratory Manual,
Vol. 1. Cold Spring Harbor Laboratory Press, Cold Spring Harbor,
NY, pp. 331–346.
70. Miyawaki,K., Mito,T., Sarashina,I. et al. (2004) Involvement of
Wingless/Armadillo signaling in the posterior sequential segmenta-
tion in the cricket, Gryllus bimaculatus (Orthoptera), as revealed by
RNAi analysis. Mech. Dev., 121, 119–130.
71. Nakamura,T., Mito,T., Bando,T. et al. (2007) Dissecting insect leg re-
generation through RNA interference. Cell. Mol. Life Sci., 65, 64–72.
72. Takahashi,T., Hamada,A., Miyawaki,K. et al. (2009) Systemic RNA
interference for the study of learning and memory in an insect.
J. Neurosci. Methods, 179, 9–15.
73. Nakamura,T., Yoshizaki,M., Ogawa,S. et al. (2010) Imaging of trans-
genic cricket embryos reveals cell movements consistent with a
syncytial patterning mechanism. Curr. Biol., 20, 1641–1647.
74. Watanabe,T., Ochiai,H., Sakuma,T. et al. (2012) Non-transgenic
genome modifications in a hemimetabolous insect using zinc-finger
and TAL effector nucleases. Nat. Commun., 3, 1017.
75. Iseli,C., Jongeneel,C.V. and Bucher,P. (1999) ESTScan: a program for
detecting, evaluating, and reconstructing potential coding regions
in EST sequences. Proc. Int.l Conf. Intell. Syst. Mol. Biol., 138–148.
76. Zdobnov,E.M. and Apweiler,R. (2001) InterProScan–an integration
platform for the signature-recognition methods in InterPro.
Bioinformatics, 17, 847–848.
77. Ashburner,M., Ball,C.A., Blake,J.A. et al. (2000) Gene ontology: tool
for the unification of biology. The Gene Ontology Consortium. Nat.
Genet., 25, 25–29.
78. Balzer,S., Malde,K., Lanzen,A. et al. (2010) Characteristics of 454
pyrosequencing data–enabling realistic simulation with flowsim.
Bioinformatics, 26, i420–i425.
79. Bru,C., Courcelle,E., Carrere,S. et al. (2005) The ProDom database of
protein domain families: more emphasis on 3D. Nucleic Acids Res.,
33, D212–D215.
80. Attwood,T.K., Coletta,A., Muirhead,G. et al. (2012) The PRINTS
database: a fine-grained protein sequence annotation and analysis
resource–its status in 2012. Database, 2012, bas019.
81. Letunic,I., Goodstadt,L., Dickens,N.J. et al. (2002) Recent improve-
ments to the SMART domain-based sequence annotation resource.
Nucleic Acids Res., 30, 242–244.
.............................................................................................................................................................................................................................................................................................
Page 16 of 17
Database tool Database, Vol. 2012, Article ID bas048, doi:10.1093/database/bas048.............................................................................................................................................................................................................................................................................................
at Ernst M
ayr Library of the M
useum C
omp Z
oology, Harvard U
niversity on Novem
ber 24, 2012http://database.oxfordjournals.org/
Dow
nloaded from

82. Haft,D.H., Selengut,J.D. and White,O. (2003) The TIGRFAMs data-
base of protein families. Nucleic Acids Res., 31, 371–373.
83. Bateman,A., Coin,L., Durbin,R. et al. (2004) The Pfam protein
families database. Nucleic Acids Res., 32, D138–D141.
84. Hulo,N., Sigrist,C.J., LeSaux,V. et al. (2004) Recent improvements to
the PROSITE database. Nucleic Acids Res., 32, D134–D137.
85. Wu,C.H., Nikolskaya,A., Huang,H. et al. (2004) PIRSF: family classi-
fication system at the Protein Information Resource. Nucleic Acids
Res., 32, D112–D114.
86. Gough,J., Karplus,K., Hughey,R. and Chothia,C. (2001) Assignment
of homology to genome sequences using a library of hidden
Markov models that represent all proteins of known structure.
J. Mol. Biol., 313, 903–919.
87. Pearl,F.M., Lee,D., Bray,J.E. et al. (2000) Assigning genomic se-
quences to CATH. Nucleic Acids Res., 28, 277–282.
88. Mi,H., Lazareva-Ulitsky,B., Loo,R. et al. (2005) The PANTHER data-
base of protein families, subfamilies, functions and pathways.
Nucleic Acids Res., 33, D284–D288.
89. Bendtsen,J.D., Nielsen,H., von Heijne,G. et al. (2004) Improved pre-
diction of signal peptides: SignalP 3.0. J. Mol. Biol., 340, 783–795.
90. Sonnhammer,E.L., von Heijne,G. and Krogh,A. (1998) A hidden
Markov model for predicting transmembrane helices in protein se-
quences. Proc. Int. Conf. Intell. Syst. Mol. Biol., 6, 175–182.
91. Chen,F., Mackey,A.J., Vermunt,J.K. et al. (2007) Assessing perform-
ance of orthology detection strategies applied to eukaryotic gen-
omes. PLoS One, 2, e383.
92. Yandell,M., Mungall,C.J., Smith,C. et al. (2006) Large-scale trends in
the evolution of gene structures within 11 animal genomes. PLoS
Comput. Biol., 2, e15.
93. Wall,D.P., Fraser,H.B. and Hirsh,A.E. (2003) Detecting putative
orthologs. Bioinformatics, 19, 1710–1711.
94. Conesa,A., Gotz,S., Garcia-Gomez,J.M. et al. (2005) Blast2GO: a
universal tool for annotation, visualization and analysis in func-
tional genomics research. Bioinformatics, 21, 3674–3676.
95. Gotz,S., Garcia-Gomez,J.M., Terol,J. et al. (2008) High-throughput
functional annotation and data mining with the Blast2GO suite.
Nucleic Acids Res., 36, 3420–3435.
96. Altschul,S.F., Gish,W., Miller,W. et al. (1990) Basic local alignment
search tool. J. Mol. Biol., 215, 403–410.
97. Moss,E.G. (2001) RNA interference: it’s a small RNA world. Curr.
Biol., 11, R772–R775.
98. Carroll,D. (2011) Genome engineering with zinc-finger nucleases.
Genetics, 188, 773–782.
99. Mussolino,C. and Cathomen,T. (2012) TALE nucleases: tailored
genome engineering made easy. Curr. Opin. Biotechnol., 23, 1–7.
100. Denell,R. and Shippy,T. (2001) Comparative insect develop-
mental genetics: phenotypes without mutants. Bioessays, 23,
379–382.
101. McQuilton,P., St Pierre,S.E. and Thurmond,J. (2012) FlyBase 101–
the basics of navigating FlyBase. Nucleic Acids Res., 40,
D706–D714.
102. Lawson,D., Arensburger,P., Atkinson,P. et al. (2007) VectorBase: a
home for invertebrate vectors of human pathogens. Nucleic Acids
Res., 35, D503–D505.
103. Megy,K., Emrich,S.J., Lawson,D. et al. (2012) VectorBase: improve-
ments to a bioinformatics resource for invertebrate vector gen-
omics. Nucleic Acids Res., 40, D729–D734.
.............................................................................................................................................................................................................................................................................................
.............................................................................................................................................................................................................................................................................................
Page 17 of 17
Database, Vol. 2012, Article ID bas048, doi:10.1093/database/bas048 Database tool.............................................................................................................................................................................................................................................................................................
at Ernst M
ayr Library of the M
useum C
omp Z
oology, Harvard U
niversity on Novem
ber 24, 2012http://database.oxfordjournals.org/
Dow
nloaded from