asia-pacific fishery commission regional overview of capture fisheries in asia and the pacific 2014
TRANSCRIPT
Asia-Pacific Fishery Commission
Regional overview of capture fisheries in Asia and the Pacific 2014
Simon Funge-Smith
Secretary, Asia-Pacific Fishery Commission
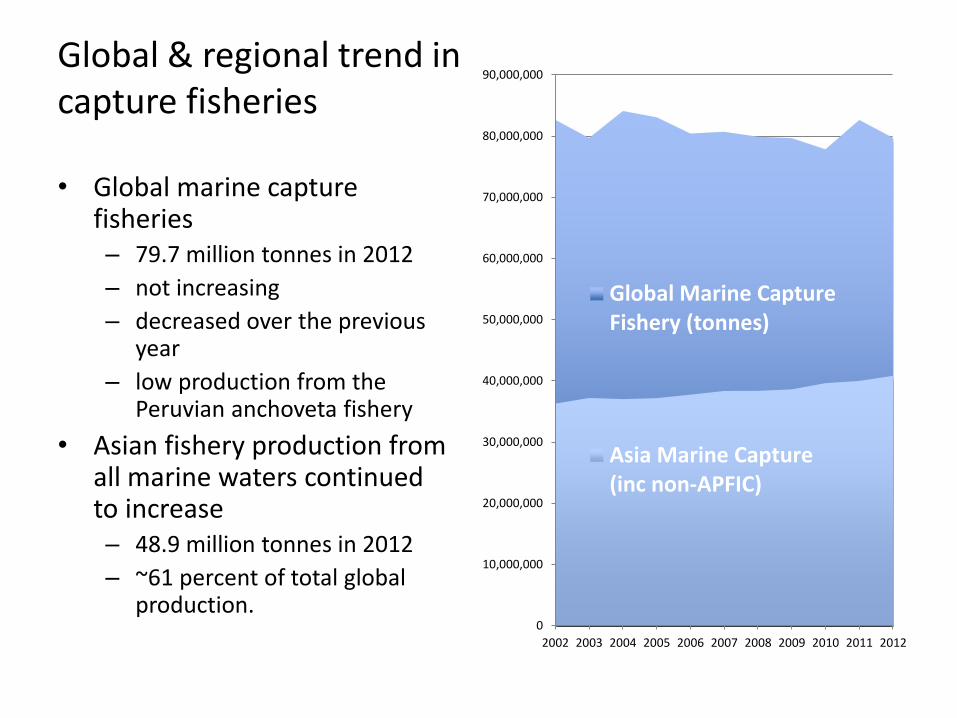
Global & regional trend in capture fisheries
• Global marine capture fisheries – 79.7 million tonnes in 2012
– not increasing
– decreased over the previous year
– low production from the Peruvian anchoveta fishery
• Asian fishery production from all marine waters continued to increase – 48.9 million tonnes in 2012
– ~61 percent of total global production.
0
10,000,000
20,000,000
30,000,000
40,000,000
50,000,000
60,000,000
70,000,000
80,000,000
90,000,000
2002 2003 2004 2005 2006 2007 2008 2009 2010 2011 2012
Global Marine CaptureFishery (tonnes)
Asia Marine Capture(inc non-APFIC)
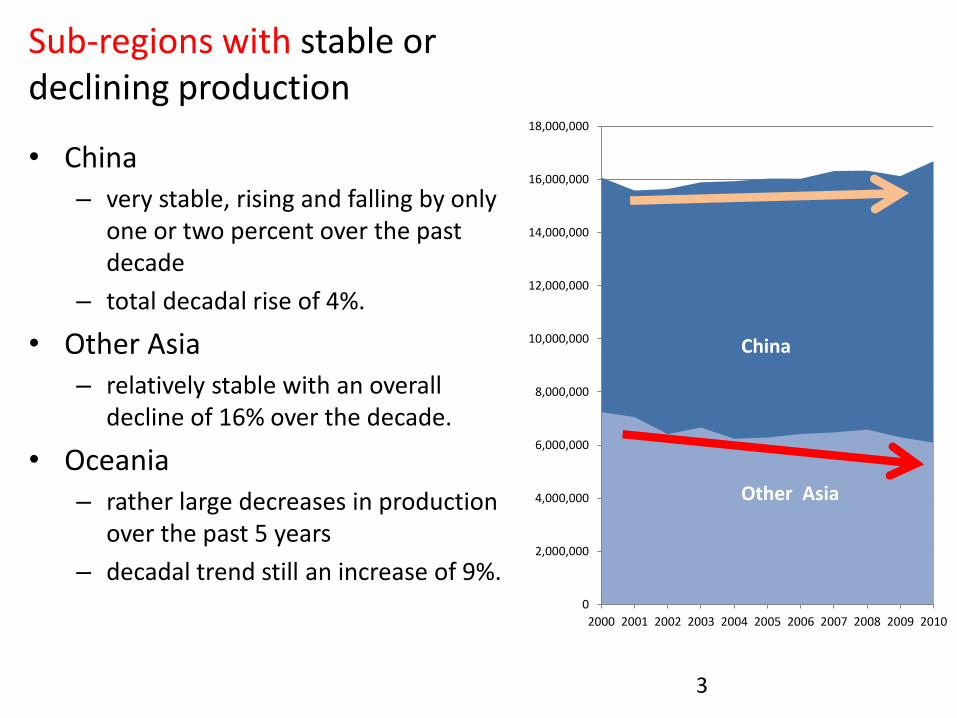
Sub-regions with stable or declining production
• China – very stable, rising and falling by only
one or two percent over the past decade
– total decadal rise of 4%.
• Other Asia – relatively stable with an overall
decline of 16% over the decade.
• Oceania– rather large decreases in production
over the past 5 years
– decadal trend still an increase of 9%.
3
0
2,000,000
4,000,000
6,000,000
8,000,000
10,000,000
12,000,000
14,000,000
16,000,000
18,000,000
2000 2001 2002 2003 2004 2005 2006 2007 2008 2009 2010
China
Other Asia
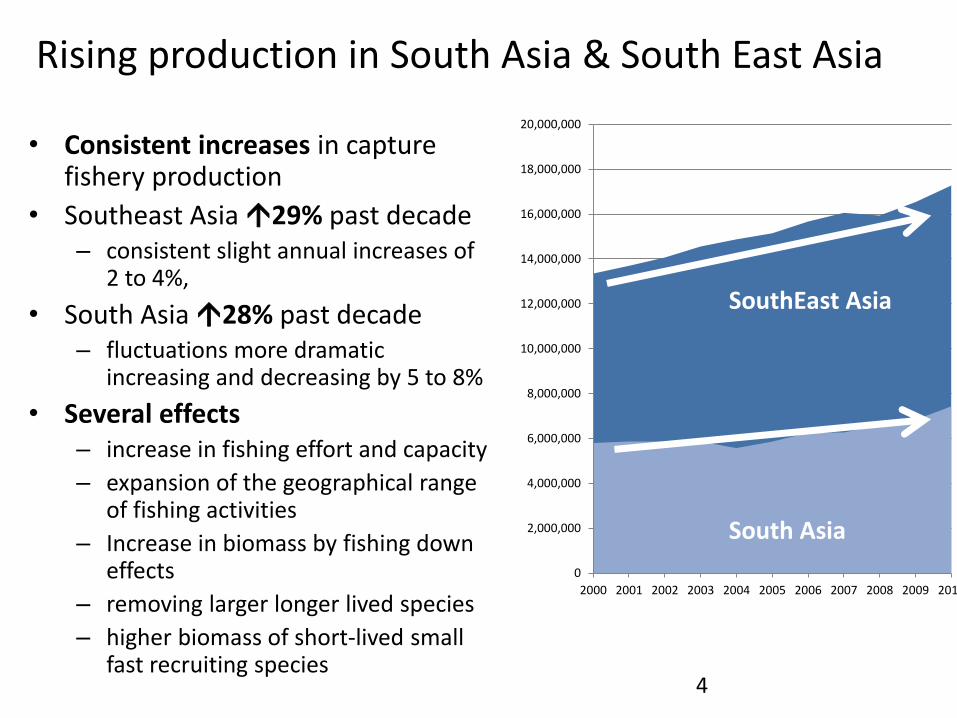
Rising production in South Asia & South East Asia
• Consistent increases in capture fishery production
• Southeast Asia 29% past decade– consistent slight annual increases of
2 to 4%,
• South Asia 28% past decade– fluctuations more dramatic
increasing and decreasing by 5 to 8%
• Several effects– increase in fishing effort and capacity
– expansion of the geographical range of fishing activities
– Increase in biomass by fishing down effects
– removing larger longer lived species
– higher biomass of short-lived small fast recruiting species
4
0
2,000,000
4,000,000
6,000,000
8,000,000
10,000,000
12,000,000
14,000,000
16,000,000
18,000,000
20,000,000
2000 2001 2002 2003 2004 2005 2006 2007 2008 2009 2010
SouthEast Asia
South Asia
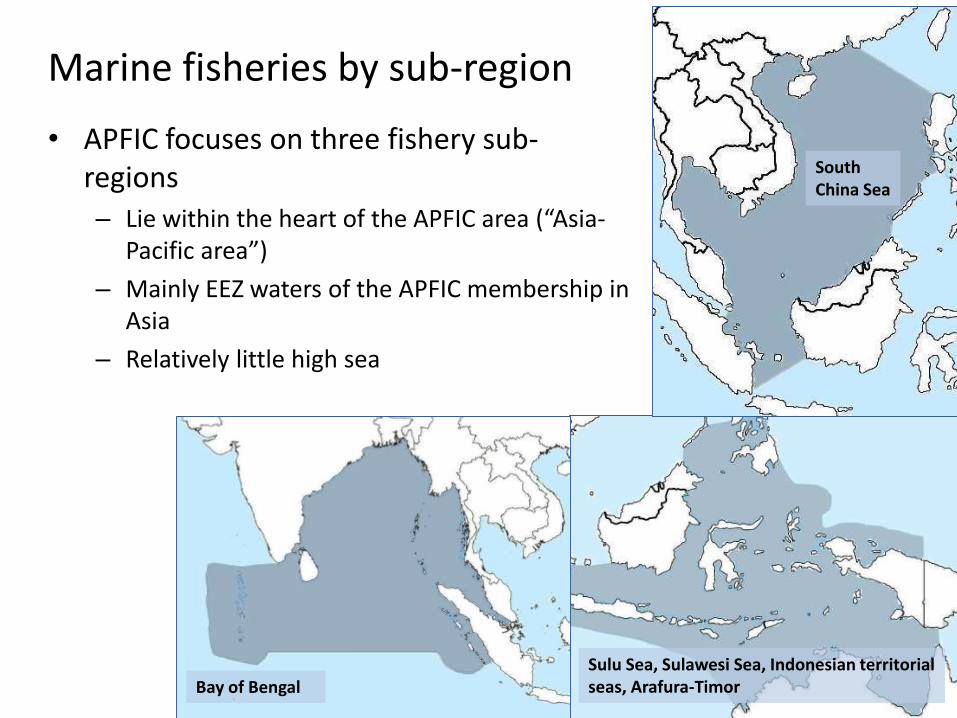
Marine fisheries by sub-region
• APFIC focuses on three fishery sub-regions– Lie within the heart of the APFIC area (“Asia-
Pacific area”)
– Mainly EEZ waters of the APFIC membership in Asia
– Relatively little high sea
Sulu Sea, Sulawesi Sea, Indonesian territorial seas, Arafura-TimorBay of Bengal
South China Sea

Challenges to getting reliable production figures for fisheries
• Fish catches for sub-regions within the large FAO statistical areas is a challenge
• Majority national catch– Little high sea in the APFIC sub-
regions – Requires access to statistical data at
the sub-national level
• Foreign catches less important– long distance fishing nations
• APFIC members do not, typically, grant foreign fishing access to their waters – neighbouring countries may fish in
their waters, legally or illegally
• Unreported catch and the catch of IUU fishing is greatest issue
FAO Area 57 - Eastern Indian Ocean
FAO Area 71 - Western Central Pacific Ocean
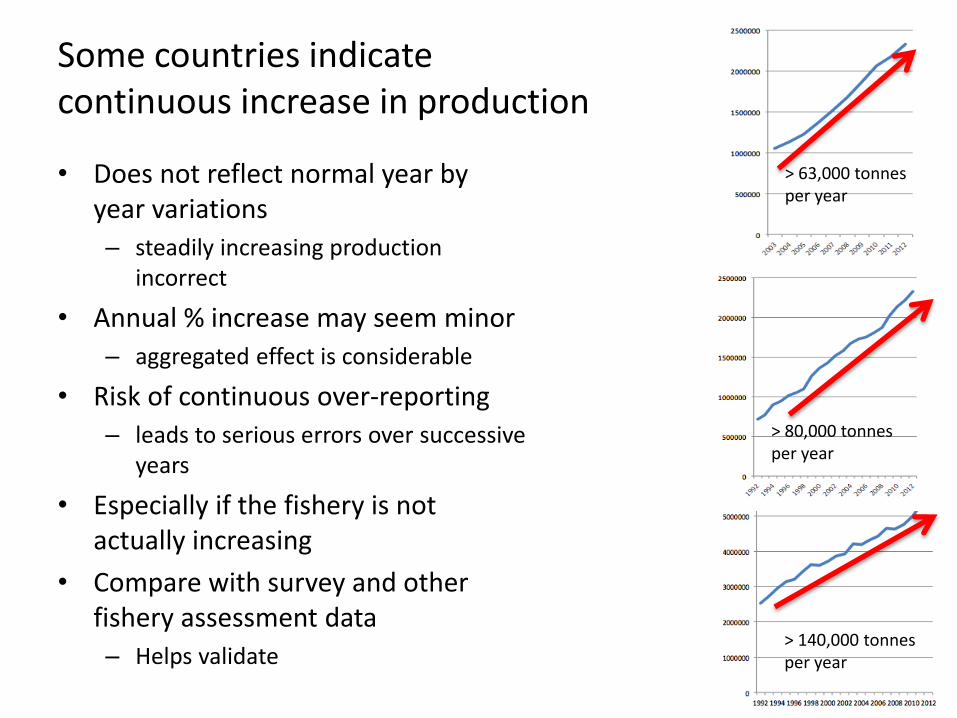
Some countries indicate continuous increase in production
• Does not reflect normal year by year variations
– steadily increasing production incorrect
• Annual % increase may seem minor
– aggregated effect is considerable
• Risk of continuous over-reporting
– leads to serious errors over successive years
• Especially if the fishery is not actually increasing
• Compare with survey and other fishery assessment data
– Helps validate> 140,000 tonnesper year
> 80,000 tonnesper year
> 63,000 tonnesper year

9% 6.7%
6%
Regional contribution to
global marine catch~18.7 million tonnes
21 % of global marine catch
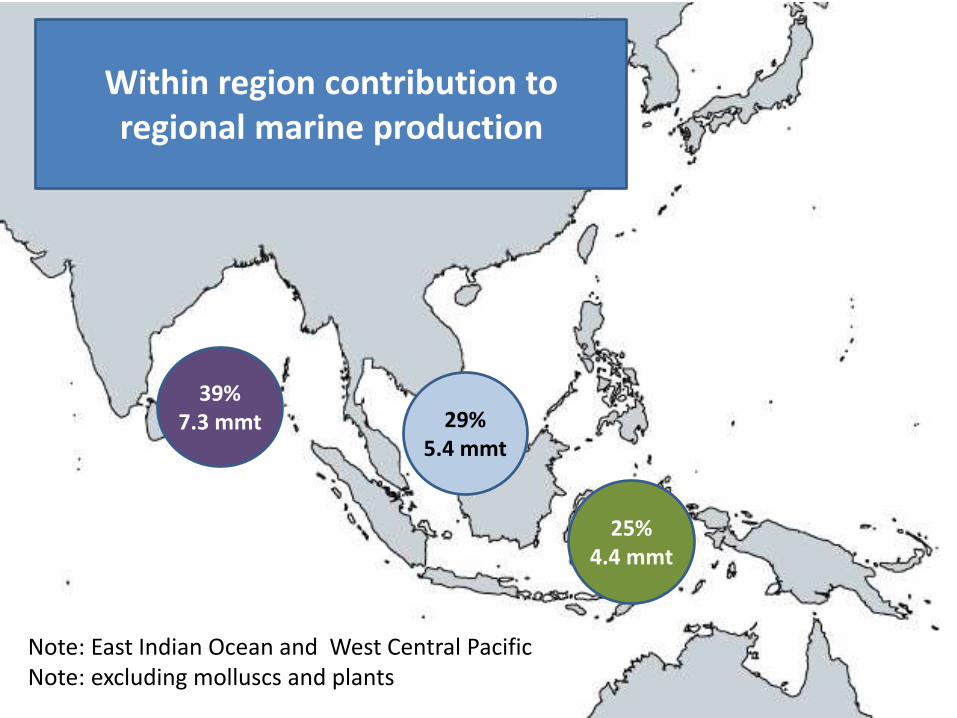
39%7.3 mmt 29%
5.4 mmt
25%4.4 mmt
Within region contribution to regional marine production
Note: East Indian Ocean and West Central PacificNote: excluding molluscs and plants

Using catch reconstructions to investigate reported catch
• Catch reconstructions can adjust for– unreported catch
– IUU catch
– over-reported fishing
• Bay of Bengal example – ~ 7.3 million tonnes reported to FAO
– ~ 10.7 million tonnes reconstructed
• Difference primarily due to: – unreported catches from commercial
fisheries
– underestimation of artisanal catches
– catches lost to IUU fishing
– adjustments made for over-reporting
Unreported catch
Reported catch
Unreported catch
Reported catch
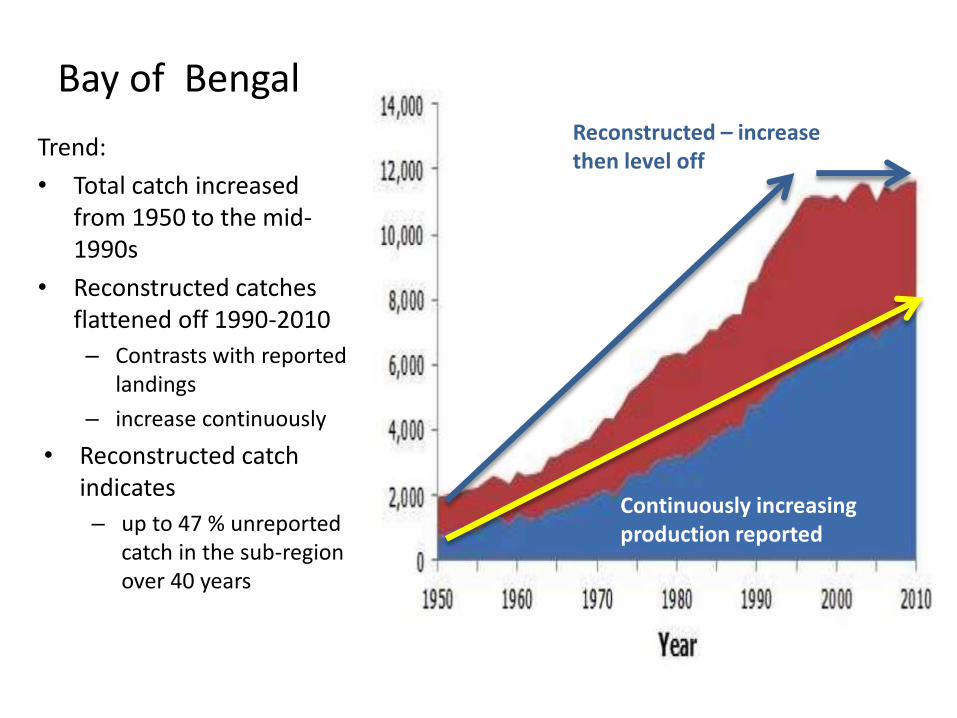
Bay of Bengal
Trend:
• Total catch increased from 1950 to the mid-1990s
• Reconstructed catches flattened off 1990-2010
– Contrasts with reported landings
– increase continuously
• Reconstructed catch indicates
– up to 47 % unreported catch in the sub-region over 40 years
Continuously increasing production reported
Reconstructed – increase then level off
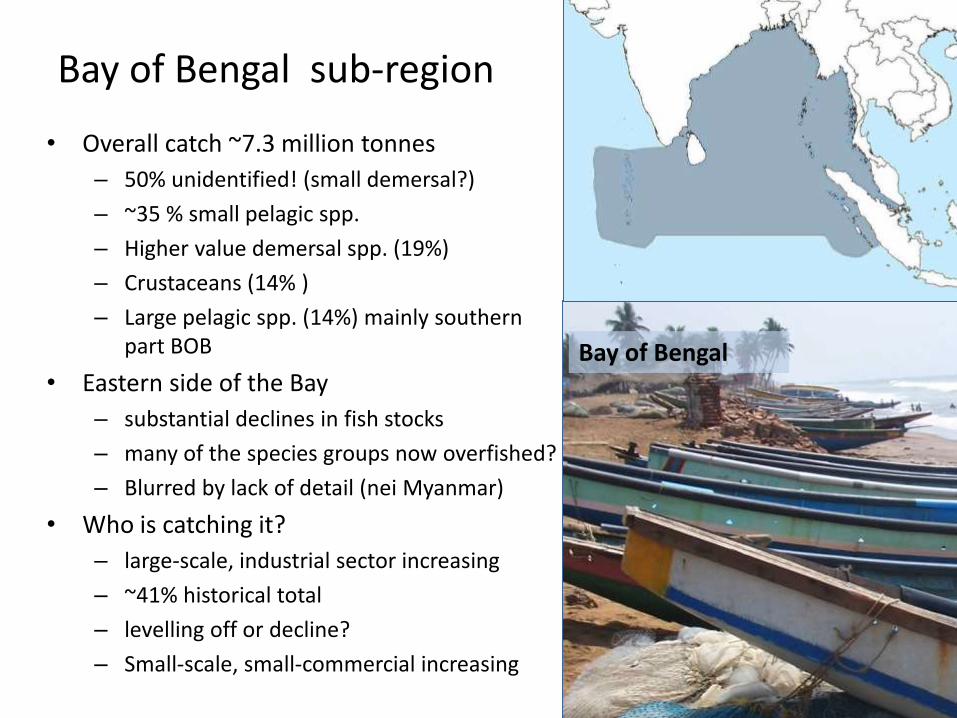
Bay of Bengal sub-region
• Overall catch ~7.3 million tonnes
– 50% unidentified! (small demersal?)
– ~35 % small pelagic spp.
– Higher value demersal spp. (19%)
– Crustaceans (14% )
– Large pelagic spp. (14%) mainly southern part BOB
• Eastern side of the Bay
– substantial declines in fish stocks
– many of the species groups now overfished?
– Blurred by lack of detail (nei Myanmar)
• Who is catching it?
– large-scale, industrial sector increasing
– ~41% historical total
– levelling off or decline?
– Small-scale, small-commercial increasing
Bay of Bengal
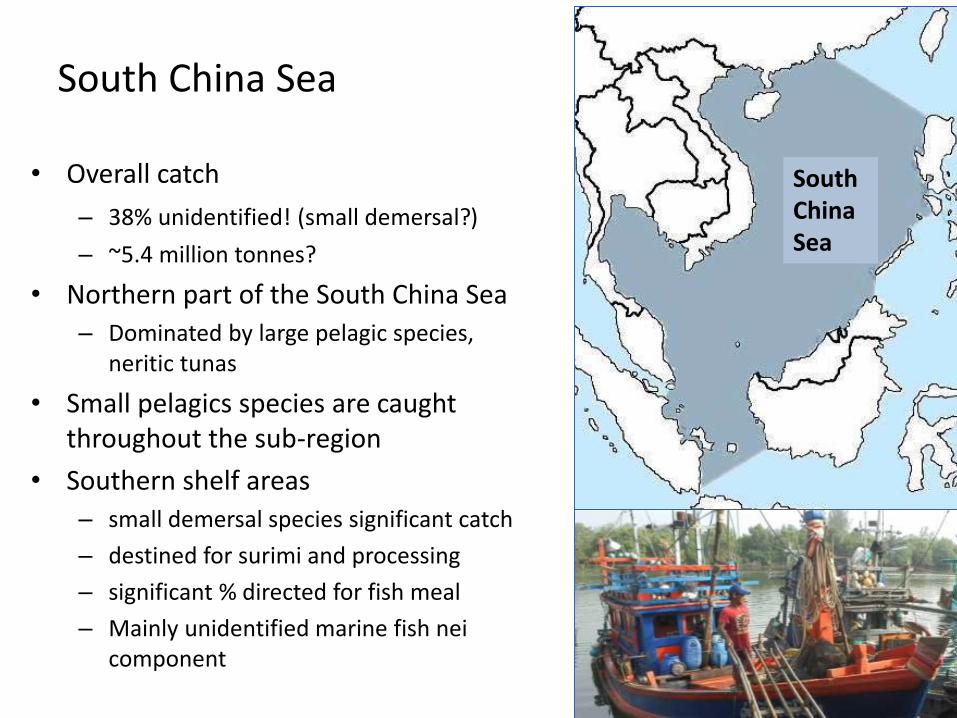
South China Sea
• Overall catch
– 38% unidentified! (small demersal?)
– ~5.4 million tonnes?
• Northern part of the South China Sea
– Dominated by large pelagic species, neritic tunas
• Small pelagics species are caught throughout the sub-region
• Southern shelf areas
– small demersal species significant catch
– destined for surimi and processing
– significant % directed for fish meal
– Mainly unidentified marine fish neicomponent
South China Sea

Sulu Sea, Sulawesi Sea, Indonesian territorial seas, Arafura-Timor
• Catch ~4.4 million tonnes– mainly Indonesia (~69%) ; Philippines (~30
percent); Timor Leste & Australia (< 1 %)
• Little scope for increasing catches
• Species– demersal spp (inc. crustaceans) over-fished
– Small and large pelagic fisheries, moderately/fully fished
– Arafura-Timor Sea fisheries - fully exploited or over exploited
• Sub-region highly vulnerable to IUU fishing– difficult to control
– early 2000 ~85 percent of vessels (~7 000) >50 GT no licence
– Timor-Leste IUU loss of income ~US$36 million per year (2011)
– Sulu-Sulawesi sea ~33 percent of the catch is IUU (2009)
Sulu Sea, Sulawesi Sea, Indonesian territorial seas, Arafura-Timor sea
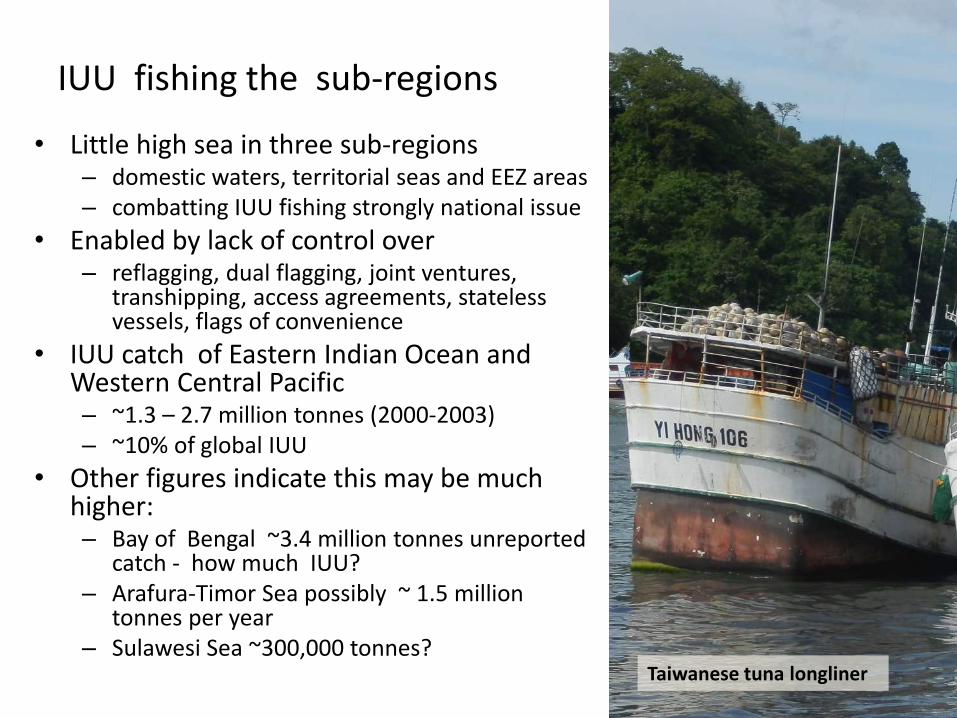
IUU fishing the sub-regions
• Little high sea in three sub-regions – domestic waters, territorial seas and EEZ areas– combatting IUU fishing strongly national issue
• Enabled by lack of control over– reflagging, dual flagging, joint ventures,
transhipping, access agreements, stateless vessels, flags of convenience
• IUU catch of Eastern Indian Ocean and Western Central Pacific– ~1.3 – 2.7 million tonnes (2000-2003)– ~10% of global IUU
• Other figures indicate this may be much higher: – Bay of Bengal ~3.4 million tonnes unreported
catch - how much IUU?– Arafura-Timor Sea possibly ~ 1.5 million
tonnes per year– Sulawesi Sea ~300,000 tonnes?
Taiwanese tuna longliner
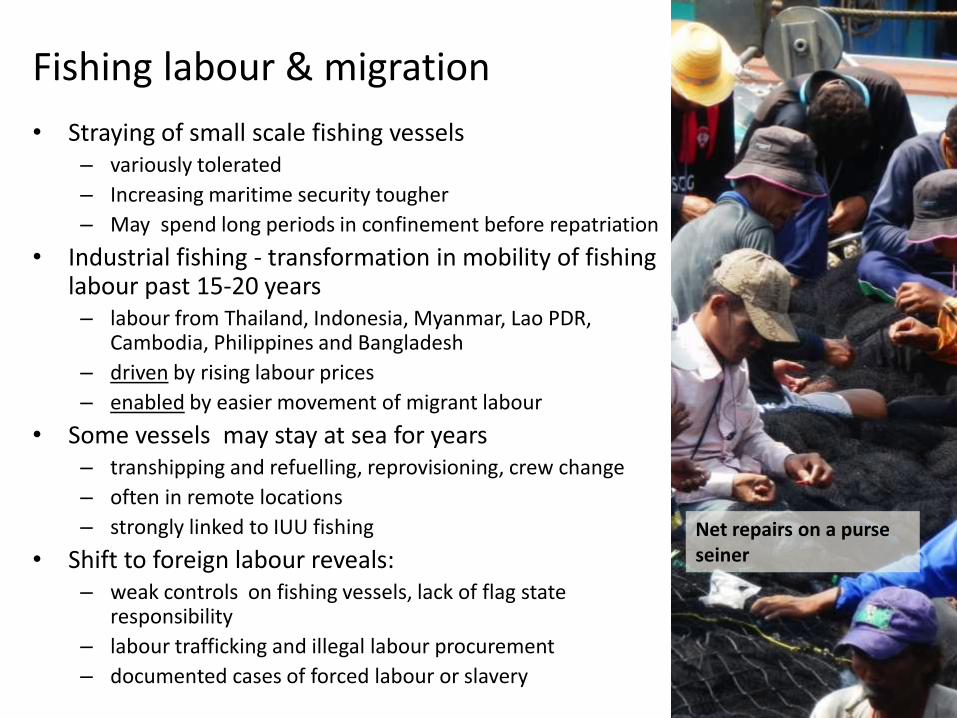
Fishing labour & migration
• Straying of small scale fishing vessels– variously tolerated
– Increasing maritime security tougher
– May spend long periods in confinement before repatriation
• Industrial fishing - transformation in mobility of fishing labour past 15-20 years– labour from Thailand, Indonesia, Myanmar, Lao PDR,
Cambodia, Philippines and Bangladesh
– driven by rising labour prices
– enabled by easier movement of migrant labour
• Some vessels may stay at sea for years– transhipping and refuelling, reprovisioning, crew change
– often in remote locations
– strongly linked to IUU fishing
• Shift to foreign labour reveals:– weak controls on fishing vessels, lack of flag state
responsibility
– labour trafficking and illegal labour procurement
– documented cases of forced labour or slavery
Net repairs on a purse seiner
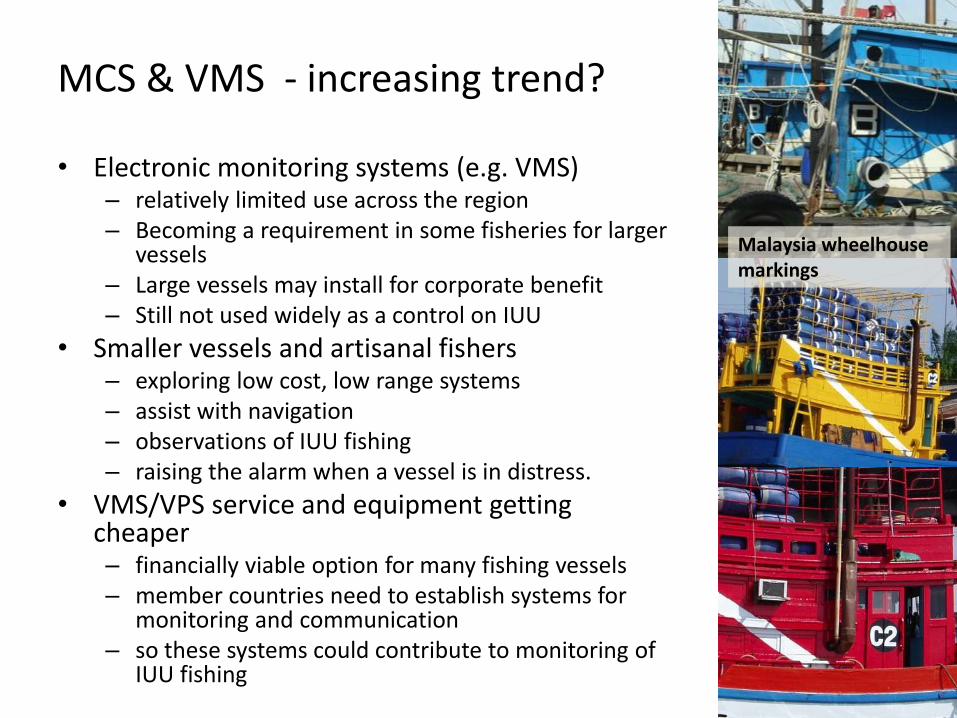
MCS & VMS - increasing trend?
• Electronic monitoring systems (e.g. VMS) – relatively limited use across the region – Becoming a requirement in some fisheries for larger
vessels – Large vessels may install for corporate benefit– Still not used widely as a control on IUU
• Smaller vessels and artisanal fishers– exploring low cost, low range systems – assist with navigation – observations of IUU fishing – raising the alarm when a vessel is in distress.
• VMS/VPS service and equipment getting cheaper – financially viable option for many fishing vessels– member countries need to establish systems for
monitoring and communication– so these systems could contribute to monitoring of
IUU fishing
Malaysia wheelhouse markings
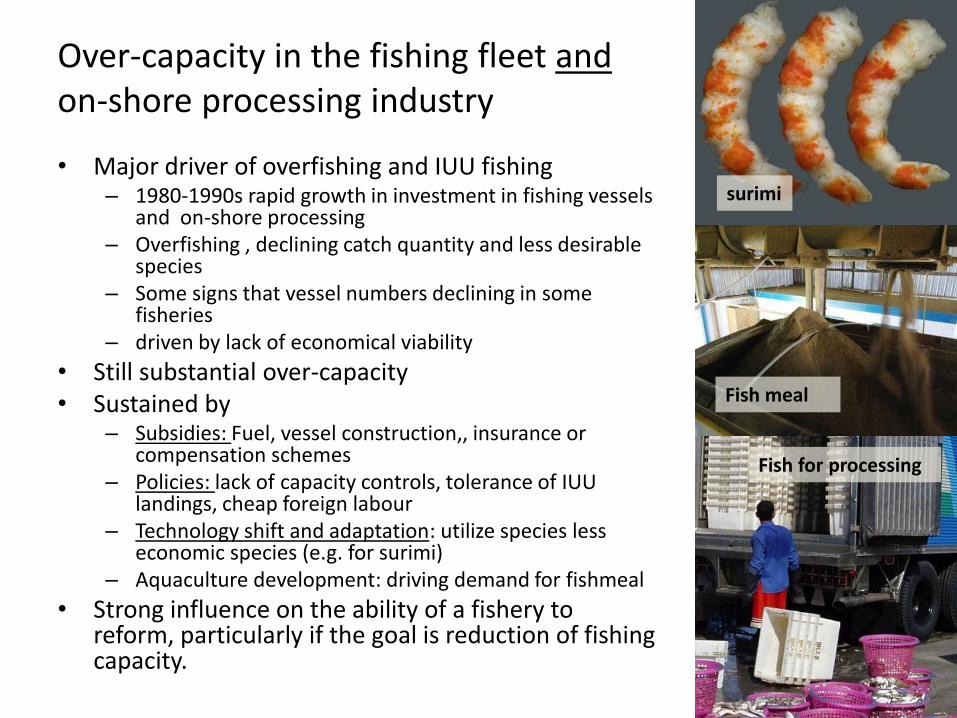
Over-capacity in the fishing fleet andon-shore processing industry
• Major driver of overfishing and IUU fishing– 1980-1990s rapid growth in investment in fishing vessels
and on-shore processing – Overfishing , declining catch quantity and less desirable
species– Some signs that vessel numbers declining in some
fisheries – driven by lack of economical viability
• Still substantial over-capacity• Sustained by
– Subsidies: Fuel, vessel construction,, insurance or compensation schemes
– Policies: lack of capacity controls, tolerance of IUU landings, cheap foreign labour
– Technology shift and adaptation: utilize species less economic species (e.g. for surimi)
– Aquaculture development: driving demand for fishmeal
• Strong influence on the ability of a fishery to reform, particularly if the goal is reduction of fishing capacity.
surimi
Fish meal
Fish for processing
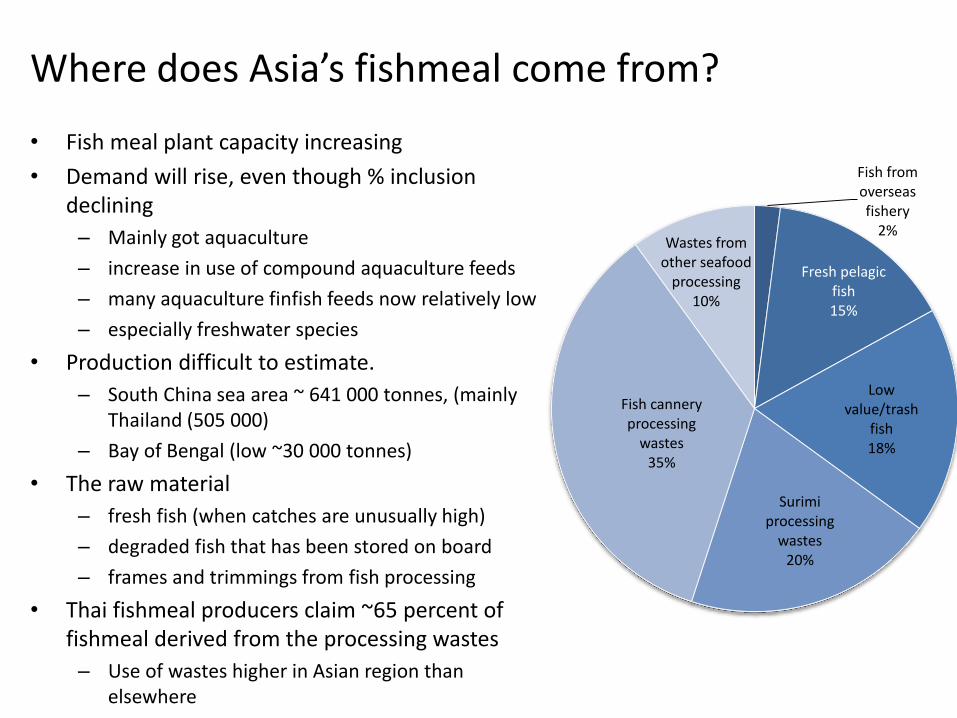
Where does Asia’s fishmeal come from?
• Fish meal plant capacity increasing
• Demand will rise, even though % inclusion declining
– Mainly got aquaculture
– increase in use of compound aquaculture feeds
– many aquaculture finfish feeds now relatively low
– especially freshwater species
• Production difficult to estimate.
– South China sea area ~ 641 000 tonnes, (mainly Thailand (505 000)
– Bay of Bengal (low ~30 000 tonnes)
• The raw material
– fresh fish (when catches are unusually high)
– degraded fish that has been stored on board
– frames and trimmings from fish processing
• Thai fishmeal producers claim ~65 percent of fishmeal derived from the processing wastes
– Use of wastes higher in Asian region than elsewhere
Fish from overseas fishery
2%
Fresh pelagic fish15%
Low value/trash
fish18%
Surimi processing
wastes20%
Fish cannery processing
wastes35%
Wastes from other seafood
processing10%
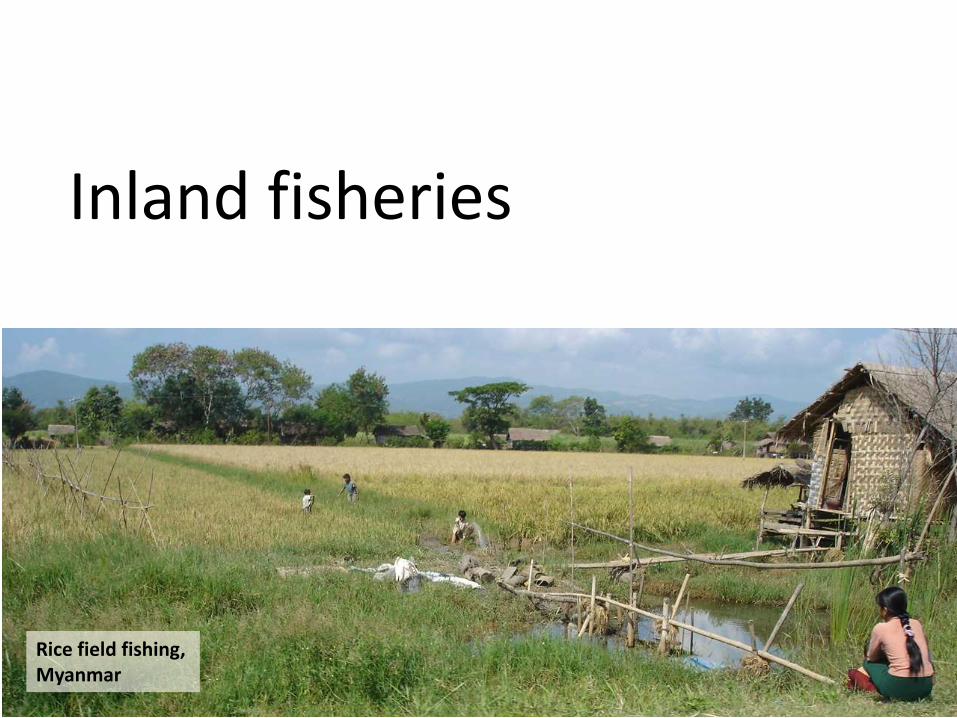
Inland fisheries
Rice field fishing,Myanmar

20%
1%
13%11%
8%
4%
3%
2%
2%
2%
1%
Regional contribution to inland fishery production66 % of global production
• 10 countries produce 97% of the region’s inland capture of inland fish
– South Asia 37%
– South East Asia 30%
– China 30%
• Large variations within countries

Asian inland fishery production
• Continuous strong increase over decade– rising 50%
– compared with 21% in rest of the world
• Need better indicators for inland fisheries production
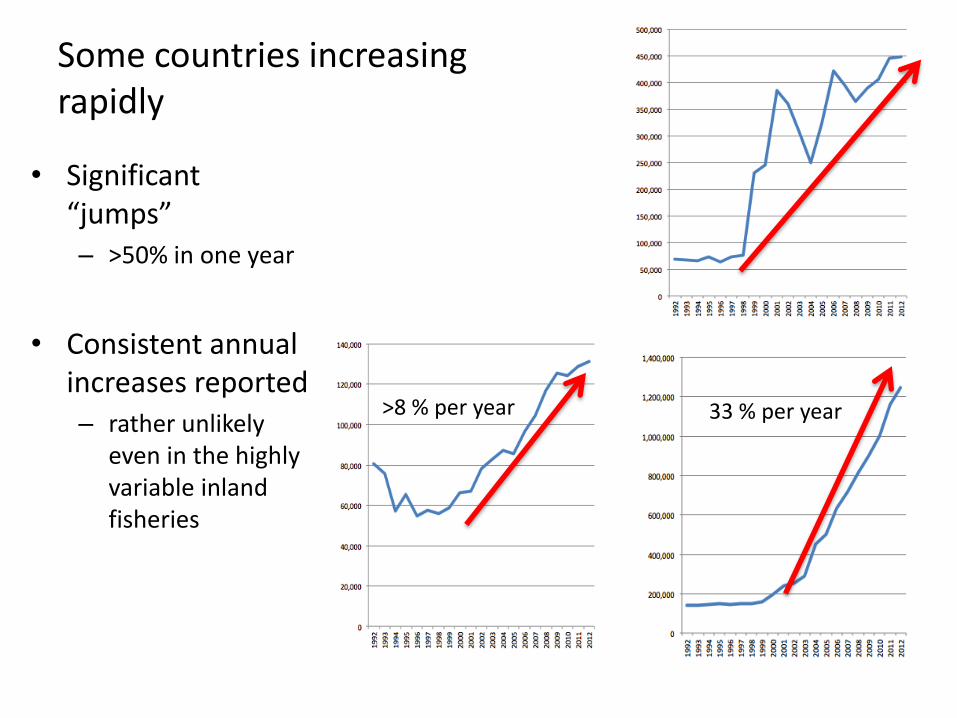
>8 % per year 33 % per year
Some countries increasing rapidly
• Significant “jumps”– >50% in one year
• Consistent annual increases reported – rather unlikely
even in the highly variable inland fisheries
Unlike marine fisheries, fishing is not typically the main impact on the status of inland fishery resources
• Changing water flows– Damming: 62 % Asian rivers
– dike and levee Construction
– diversions, irrigation abstraction
– Draining of wetlands
– Navigation
• Runoff and pollution changes – Deforestation/land use changes
– Urbanization
– Pollution
– Acid deposition
• Exotic species
• Climate change
• Overharvesting
Most of these are related to water quantity and quality: “environmental flow”
Most solutions are rarely “fishery management solutions”
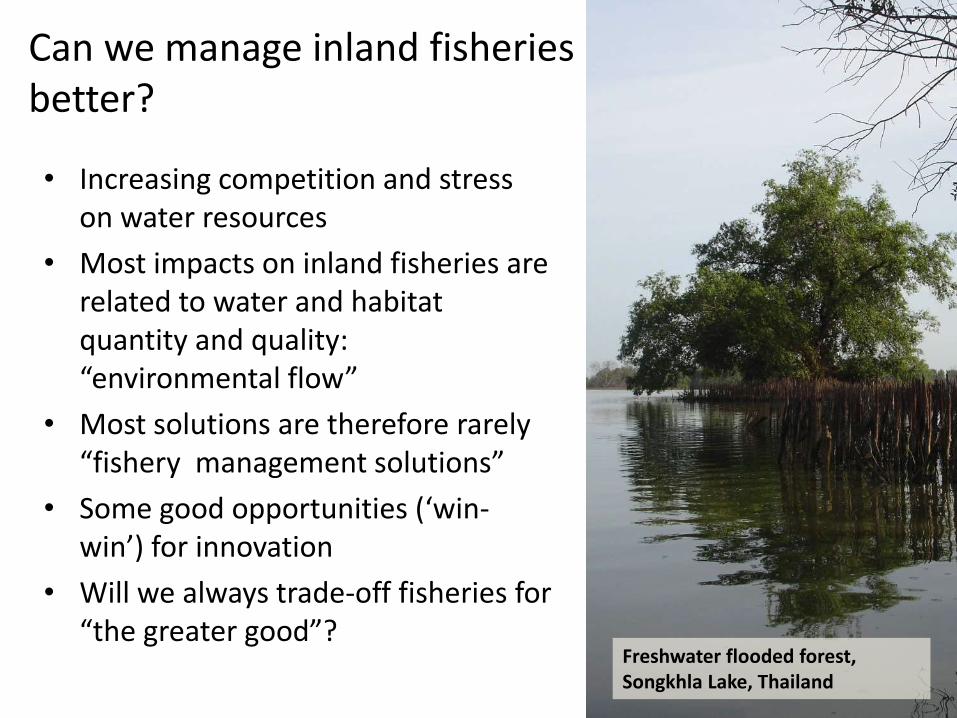
Can we manage inland fisheries better?
• Increasing competition and stress on water resources
• Most impacts on inland fisheries are related to water and habitat quantity and quality: “environmental flow”
• Most solutions are therefore rarely “fishery management solutions”
• Some good opportunities (‘win-win’) for innovation
• Will we always trade-off fisheries for “the greater good”?
Freshwater flooded forest, Songkhla Lake, Thailand

Fish trade & fish consumption
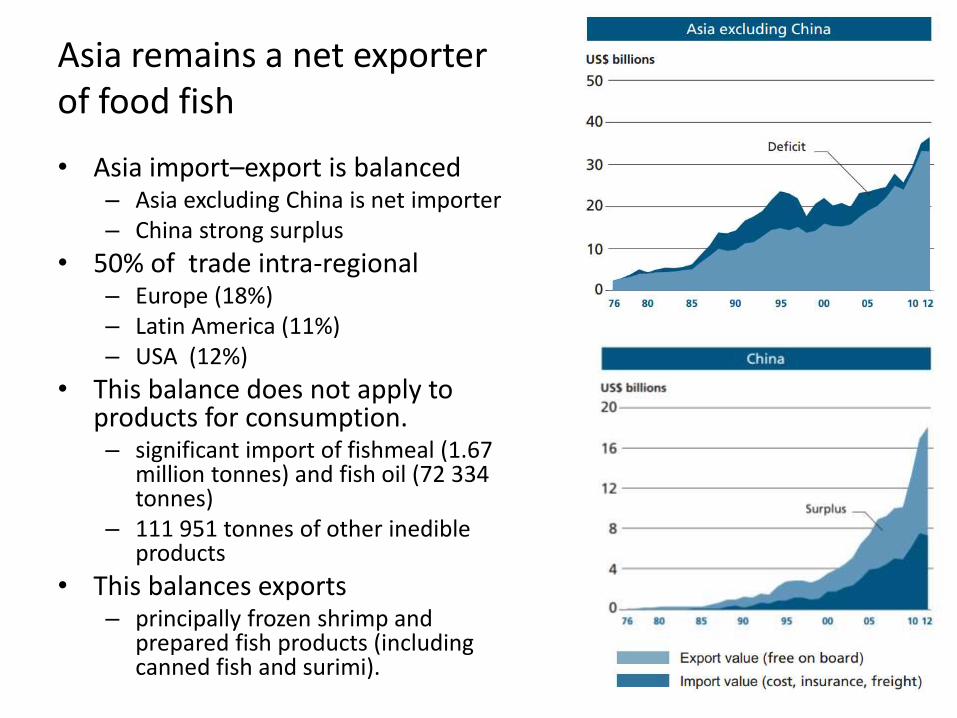
Asia remains a net exporter of food fish
• Asia import–export is balanced – Asia excluding China is net importer– China strong surplus
• 50% of trade intra-regional– Europe (18%)– Latin America (11%)– USA (12%)
• This balance does not apply to products for consumption. – significant import of fishmeal (1.67
million tonnes) and fish oil (72 334 tonnes)
– 111 951 tonnes of other inedible products
• This balances exports – principally frozen shrimp and
prepared fish products (including canned fish and surimi).

Fish consumption is highly variable across the region
• Asia Pacific countries have a range of environments– landlocked mountainous areas
– large tropical floodplains
– arid grasslands and
– oceanic tropical islands
• Affects accessibility to fish and consumption figures vary considerably– 110.7 kg per capita per year in the
Pacific island of Tuvalu
– 0.18 kg per capita per year in Mongolia and parts of western China
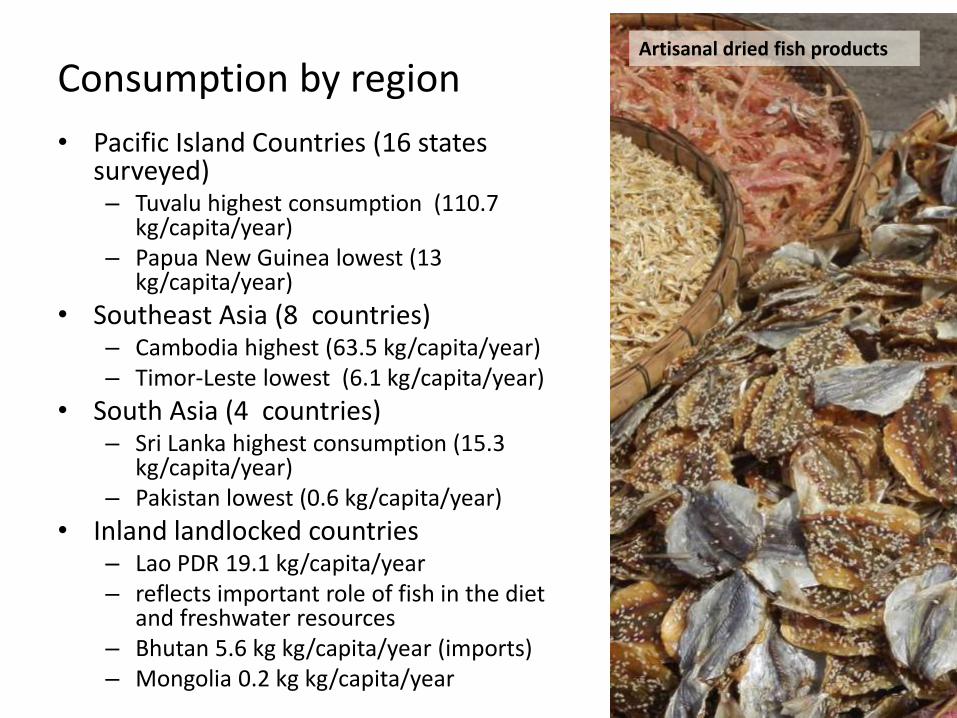
Consumption by region
• Pacific Island Countries (16 states surveyed)– Tuvalu highest consumption (110.7
kg/capita/year)– Papua New Guinea lowest (13
kg/capita/year)
• Southeast Asia (8 countries)– Cambodia highest (63.5 kg/capita/year)– Timor-Leste lowest (6.1 kg/capita/year)
• South Asia (4 countries)– Sri Lanka highest consumption (15.3
kg/capita/year)– Pakistan lowest (0.6 kg/capita/year)
• Inland landlocked countries– Lao PDR 19.1 kg/capita/year– reflects important role of fish in the diet
and freshwater resources– Bhutan 5.6 kg kg/capita/year (imports)– Mongolia 0.2 kg kg/capita/year
Artisanal dried fish products
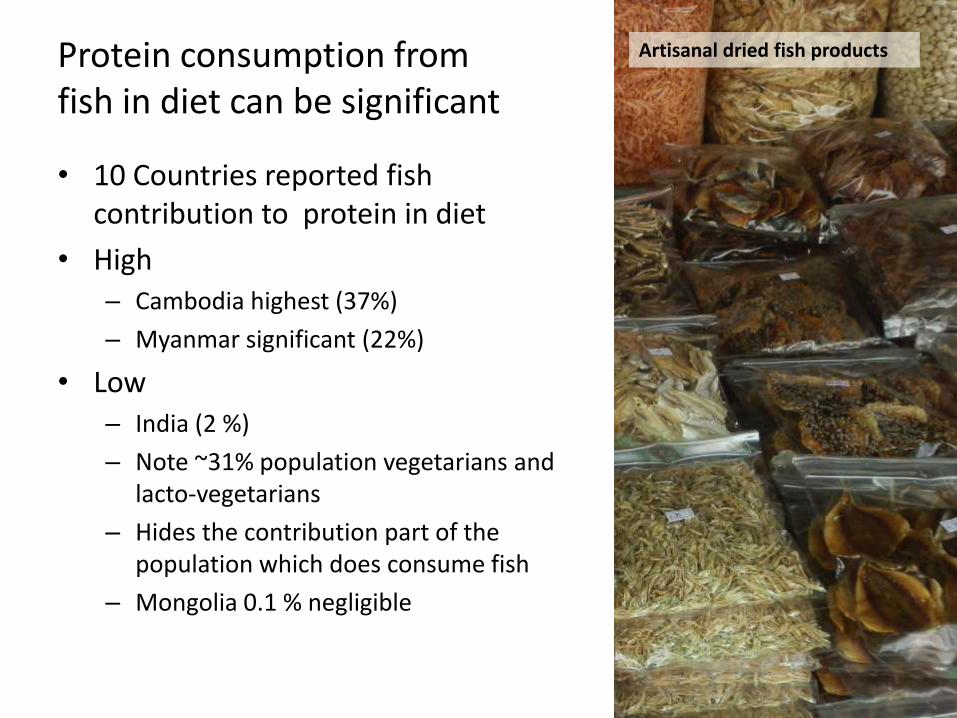
Protein consumption from fish in diet can be significant
• 10 Countries reported fish contribution to protein in diet
• High– Cambodia highest (37%)
– Myanmar significant (22%)
• Low– India (2 %)
– Note ~31% population vegetarians and lacto-vegetarians
– Hides the contribution part of the population which does consume fish
– Mongolia 0.1 % negligible
Artisanal dried fish products
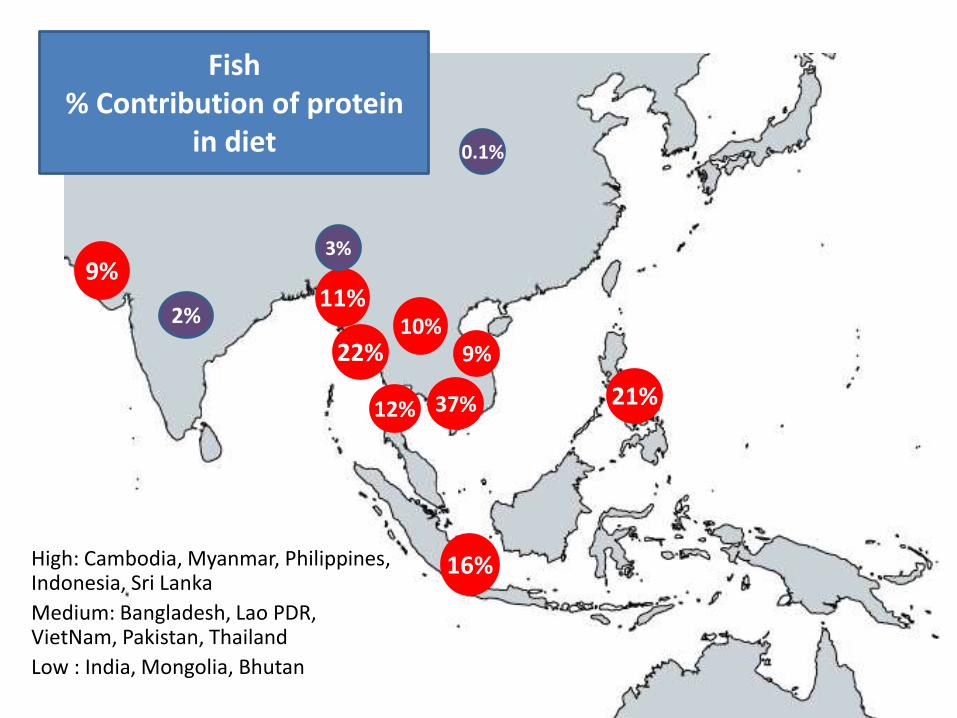
High: Cambodia, Myanmar, Philippines, Indonesia, Sri Lanka
Medium: Bangladesh, Lao PDR, VietNam, Pakistan, Thailand
Low : India, Mongolia, Bhutan
Fish % Contribution of protein
in diet
2%
37%
22%
11%
3%
16%
10%
0.1%
9%
21%12%
9%
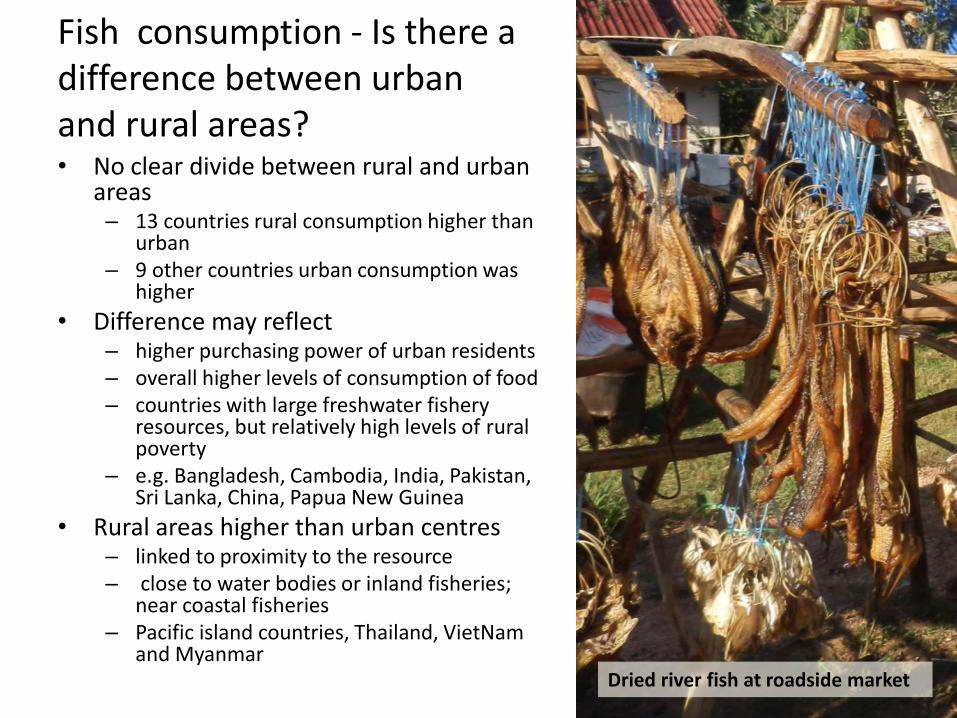
Fish consumption - Is there a difference between urban and rural areas?• No clear divide between rural and urban
areas– 13 countries rural consumption higher than
urban– 9 other countries urban consumption was
higher
• Difference may reflect – higher purchasing power of urban residents– overall higher levels of consumption of food – countries with large freshwater fishery
resources, but relatively high levels of rural poverty
– e.g. Bangladesh, Cambodia, India, Pakistan, Sri Lanka, China, Papua New Guinea
• Rural areas higher than urban centres– linked to proximity to the resource– close to water bodies or inland fisheries;
near coastal fisheries– Pacific island countries, Thailand, VietNam
and MyanmarDried river fish at roadside market

Thank you