asia pacific dailyasiaresearch.daiwacm.com/eg/cgi-bin/files/daily01apr13.pdf · profiting from...
TRANSCRIPT
Asia Pacific Daily
See important disclosures, including any required research certifications, beginning on page 51.
1 April 2013
Company Roadshows Date Company Event Venue 2 Apr Rexlot (555 HK) NDR SG 2-3 Apr CSCI (3311 HK) NDR Tokyo 5 Apr GMR Infrastructure (GMRI IN) Video Con. UK 8 Apr Lai Sun Development (488 HK) NDR HK 8 Apr Lai Sun Development (488 HK) Video Con. SG 8 Apr Lai Sun Development (488 HK) Video Con. UK 8 Apr First Financial (2892 TT) NDR SG 8 Apr Chiho Tiande (976 HK) NDR HK 8-9 Apr Shenzhen International (152 HK) NDR Tokyo 8-12 Apr Orion Corp (001800 KS) NDR US 8-16 Apr Shui On Land (272 HK) NDR US 9-10 Apr First Financial (2892 TT) NDR HK 11 Apr CR Cement (1313 HK) NDR HK 11 Apr CR Cement (1313 HK) Video Con. UK 12 Apr Wharf (4 HK) NDR HK 12 Apr Wharf (4 HK) Video Con. SG 12 Apr Wharf (4 HK) Video Con. UK 12 Apr Wharf (4 HK) Video Con. Tokyo 15-16 Apr Hopefluent (733 HK) NDR Tokyo 15-19 Apr ENN Energy (2688 HK) NDR US 16 Apr Techtronic Industries (669 HK) NDR US 16 Apr Dah Chong Hong (1828 HK) NDR SG 6-10 May KT Corp (30200 KS) NDR US 20-21 May Advanced Info Service
(ADVANC TB) NDR Tokyo
6-7 Jun Sansiri (SIRI TB) NDR SG
Daiwa Asian Events Date Company Venue 15-17 Apr Daiwa Consumer and Gaming Forum 2013 HK 22-23 May Daiwa Investment Conference London 2013 London 24 May Daiwa Investment Water Conference Zurich 28-29 May Daiwa Investment Conference NY 2013 New York 31 May Daiwa Investment Conference SF 2013 San
Francisco Source: Daiwa
Regional indices
Performance chg
(%) EPS growth
(%) PER (x)
Market 1D 1M YTD 12E 13E 12E 13E HSI (0.7) (3.1) (1.6) 9.4 8.6 10.5 9.6 HSCEI (1.2) (4.7) (4.7) 7.4 10.0 7.2 6.6 SENSEX* 0.7 (1.7) (3.0) 15.1 15.4 13.5** 11.7** KOSPI 0.0 (1.6) (0.2) 34.1 14.6 9.4 8.1 TWSE (0.3) (0.4) 2.2 37.5 12.1 14.2 13.2 FSSTI (0.1) 1.2 4.5 3.4 10.3 14.8 13.4 ASX 200 (0.6) (2.7) 6.8 (0.2) 12.0 15.4 13.8 TOPIX (0.9) 6.3 20.6 22.8 46.1 20.5 14.2 Source: Thomson Reuters *Valuation based on MSCI India **MSCI India price as of 27 Mar
Analyst Rating Page
Daiwa’s Banner Products P.2 Major changes
Bangkok Chain Hospital (BCH TB) Siriporn Arunothai
Buy P.3
New price point
Target price ↑20.2% to THB13.8 Macro research
Asia economic calendar Kevin Lai P.4
Macro preview: 1Q13 GDP and other data
Taiwan Economy Christie Chien P.6
Free economic pilot zone gets the nod
Technical Daily Comment Eiji Kinouchi P.7
Kinouchi’s Technical Tips for Institutions
Euro 4Sight Tobias S. Blattner P.9
Highlights Other research
Discovery John Choi P.12
Asia small-cap weekly
China COSCO (1919 HK) Kelvin Lau Buy P.13
Profitability upturn expected
AirChina (753 HK) Kelvin Lau Buy P.17
Expect 2013 profitability to improve
Daphne International (210 HK) Bing Zhou Outperform P.21
Operating leverage intact
Doosan Infracore (042670 KS) Mike Oh Hold P.25
Visit: expect a YoY earnings recovery from 2H13
Chailease Holding (5871 TT) Rita Hsu Buy P.29
China the focus
Taiwan Acceptance Corp (9941 TT) Rita Hsu Not Rated P.33
A car-leasing stock with a China angle
CapitaCommercial Trust (CCT SP) David Lum Hold P.35
Showcasing CapitaGreen
PTT Global Chemical (PTTGC TB) Supanna
Suwankird
Buy P.39
Tokyo NDR Feedback
Japan equity research
Capital Goods Sector Update Volume 16 Hirokazu Miyagi P.40
China research trip
Tokyo Electron (8035 JP) Hirokazu Mitsuda 3 → Outperform
P.41
NAND flash memory investments gaining steam
Korea: share prices and Daiwa recommendation trends P.44 Analysts’ company visits P.45 Economic calendar – April 2013 P.46 Rating and target-price information P.47 Recently published reports P.47
- 2 -
Click for our latest editions
Strategy
Hong Kong &
China
Hong Kong Strategy: Is Hong Kong Inc. ready to make the jump? 22 March 2013
Integration with China promises to transform Hong Kong’s finance, property and rail sectors
Some Hong Kong companies are already reaping the rewards
We highlight 30 companies that offer exposure to six integration-related investment themes for 2013 and beyond
Jonas Kan, CFA (852) 2848 4439 ([email protected]) Grace Wu (852) 2532 4383 ([email protected]) Kelvin Lau (852) 2848 4467 ([email protected])
Capital Goods Sector
China
China Capital Goods Sector: Profiting from industry upcycles 8 March 2013
The China Capital Goods Sector has outperformed the MSCI Asia ex-Japan Index in most market upturns over the past 10 years
We highlight favourable industry cycles in the agriculture, aviation, traditional power and railway equipment sub-sectors
At the stock level, our picks are First Tractor (Outperform [2]), AviChina, Shanghai Electric, and CSR Corp (all rated Buy [1])
Joseph Ho, CFA (852) 2848 4443 ([email protected]) Dave Dai, CFA (852) 2848 4068 ([email protected]) China Research Team
Back in Form
Japan
Japan Back in Form: Abe's Three Arrows Catalysts for Change 4 March 2013
PM Abe’s three arrows: bold monetary easing, flexible fiscal policy, growth strategy to spur private-sector investment
Japan’s energy problems
Sino-Japanese relations a notable risk factor
Masahiro Kushida (81) 3 5555 7137 ([email protected]) Makoto Morita (81) 3 5555 7153 ([email protected]) Japan strategy tam / Japan equity analysts / DIR econnomist team
Real Estate Investment
Trusts
Pan Asia
Pan Asia Real Estate Investment Trusts: More acquisitions? 26 February 2013
Since the start of 2013, acquisitions, fund-raising, and acquisition appetite have accelerated in the J-REIT market
Open-market acquisitions face structural difficulties in Hong Kong and H-REITs have had to focus on asset enhancements
Investment conditions remain favourable in Singapore, with near record high prices and the likelihood of DPU and NAV-accretion
David Lum, CFA (65) 6329 2102 ([email protected]) Tomohiro Sumiya (81) 3 5555 7014 ([email protected]) Jonas Kan, CFA (852) 2848 4439 ([email protected])
Daiwa research is available electronically on Bloomberg, Reuters, Thomson One Analytics, FactSet, TMC, Capital IQ and Daiwa’s L-ZONE. Please contact your Daiwa sales representative for more information.
Daiwa’s Banner Products

Important
BUY (Unchanged) TP: Bt 13.80 (Pre XD) (From Bt 11.00 ) 28 MARCH 2013
TP : Bt 11.00 (Post XD)
Change in Numbers Upside: 16.9%
Bangkok Chain Hospital (BCH TB)
SIRIPORN ARUNOTHAI
662 – 617 4900 [email protected]
New price point
The WMC has just been officially opened and BCH plans to open another one in Pattaya to upgrade its market segmentation to a higher price point. We include all new hospitals for the next few years in our forecast. Our long-term EPS estimates are raised by 12% on average from 2016 and our TP lifted to Bt13.8; BUY.
World Medical Center officially opened The World Medical Center (WMC) which is BCH’s new price point hospital, had its grand opening late last week. This hospital is BCH’s new product line to diversify into the middle-to-high market from its existing middle-to-low market. Thanks to its prime location on Chaengwattana road close to Central Chaengwattana mall, many office buildings and communities, plus healthcare demand shifting down from premium hospitals and up from mid-tier hospitals due to higher bills at the premium end and people’s rising incomes, we expect WMC to succeed in the longer term but it may make losses in the first two years of operation which we already factored into our previous projection.
Earnings upgrade reflects future expansion Besides the WMC, BCH plans to open another WMC in Pattaya with capacity of 200-250 beds. In addition, BCH plans a 250-300-bed hospital on Ramkhamhaeng road under the Kasemrad brand and a 100-bed new building at Kasemrad Sriburin Hospital in Chiang Rai to serve expected rising demand. BCH needs around Bt3.0bn-3.5bn for all the new projects (excluding land which is already secured) and plans to finance them using internal cash flow and debt. We factor in all of these new projects in our projection. Our earnings forecasts are lowered by 1-2% in 2013-15 but we raise our estimates from 2016 onwards by 12% on average.
Short-term earnings are less exciting We project BCH’s earnings to slow in the next few years due to some loss contribution from new hospitals and its new building in the early years of their operations. However, we expect strong operations of six Kasemrad hospitals at Prachachuen, Sukhapiban 3, Bangkae, Rattanatibeth, Saraburi and Sriburin and for this to be enough to offset losses from new hospitals and still allow EPS growth of 7%, 14% and 9% in 2013-15, respectively compared to 36% EPS growth in 2012. BCH’s growth drivers at existing hospitals are cash patient numbers growing by 3-8% p.a., billing per cash patient rising 4% p.a. and gross margin forecast to fatten to 39.4-39.5% in 2013-15 from 39.2% in 2012.
Reaffirm BUY with new TP of Bt13.8/share Given our earnings upgrade to reflect its capacity expansion, our 12-month DCF-based TP is raised from Bt11.0/share to Bt13.8. Despite uninspiring forecast EPS growth in the next few years, we see limited downside risk to our earnings projections for BCH, supported by our expectation for rising demand and limited supply in the healthcare industry as well as BCH’s strong competitiveness versus peers. We reaffirm our BUY call.
Please see the important notice on the back page
COMPANY VALUATION
Y/E Dec (Bt m) 2012A 2013F 2014F 2015F
Sales 4,466 5,356 5,866 6,679
Net profit 910 970 1,102 1,203
Consensus NP ⎯ 937 1,078 1,126
Diff frm cons (%) ⎯ 3.5 2.2 6.9
Norm profit 910 970 1,102 1,203
Prev. Norm profit ⎯ 982 1,118 1,230
Chg frm prev (%) ⎯ (1.2) (1.4) (2.2)
Norm EPS (Bt) 0.5 0.5 0.6 0.6
Norm EPS grw (%) 36.3 6.5 13.7 9.1
Norm PE (x) 25.9 24.3 21.4 19.6
EV/EBITDA (x) 16.4 14.3 13.1 12.0
P/BV (x) 6.5 5.7 5.1 4.6
Div yield (%) 1.5 2.5 2.8 3.1
ROE (%) 26.6 25.0 25.3 24.8
Net D/E (%) 36.6 29.9 23.2 22.0
PRICE PERFORMANCE
COMPANY INFORMATION
Price as of 28-Mar-13 (Bt) 11.80
Market cap (US$ m) 792.4
Listed shares (m shares) 1,995.0
Free float (%) 26.4
Avg daily turnover (US$ m) 3.1
12M price H/L (Bt) 13.7/7.5
Sector Healthcare
Major shareholder Harnphanich Family 49.9%
Sources: Bloomberg, Company data, Thanachart estimates
6
8
10
12
14
M ar-12 Jul-12 Nov-12 M ar-13
(Bt /shr)
(10)
0
10
20
30
40
50
(%)BCH Rel to SET Index
Th
an
ach
art
Sec
uri
ties
Th
an
ach
art
Sec
uri
ties

- 4 -
■ Summary As China’s recovery remains on track, it continues to extract sizable surpluses from its neighbours. This trend suggests that the positive spillover of this recovery has been less exciting than previous episodes. Some demand disappointment for the region may be inevitable, in our view.
■ Fundamentals 1Q13 GDP: There are four GDP releases in April. China’s cyclical uptrend looks to be on track. We expect GDP growth to pick up further to 8.1% YoY for 1Q13, on stronger exports. For the rest of Asia, the positive spillover of China’s recovery seems to be less exciting this time round, however, as China’s import demand has been quite soft for numerous reasons as discussed in our report, QE uncertainty, China’s import shortfall and other crosswinds, 26 March 2013. We see potential GDP disappointment for economies more exposed to these challenges. Especially for Korea, which is very dependent on China, as its economy is already weighed down by ongoing Yen depreciation and domestic-demand sluggishness. With the help of a low base, however, we look for 1Q13 GDP to be up 2.3% YoY. Similarly for Singapore, a range of indicators including exports, retail sales and industrial production have taken a big hit. Much of the regional export recovery has been led by a surge in smartphone demand but Singapore is unable to benefit as it is more specialised in other types of
electronics such as PCs and ICs. For 2M13, electronics exports were still down by 16.8% YoY. We look for 1Q13 GDP growth to be just 0.3% YoY. Interest rate decision: Korea’s GDP growth has been lacklustre and well below its potential level. CPI inflation has eased further from 1.7% YoY for 4Q12 to 1.5% YoY for 2M13. We believe the pressure is on the BOK again to deliver another 25bps interest-rate cut in their next meeting on 11 April. After that, we expect it to stay on hold again for the rest of the year. Otherwise, we do not expect any actions from ASEAN central banks in April, given both growth and inflation dynamics remain in a fine balance. China’s imports from Asia: Trade data for Korea, Taiwan and Hong Kong should be interesting to watch as the data for the first two months was somewhat distorted by the different timing of the Lunar New Year holiday. As a result, the trade data for March should be more telling. In particular, if China’s import demand for Asian goods continues to disappoint, there will be a legitimate cause for concern, in our view.
■ GDP growth
■ Korea: CPI inflation and policy rate
Source: CEIC, Daiwa forecasts Source: CEIC, Daiwa
7.9
3.7
1.5 1.5
8.1
3.2
2.3
0.3
0
1
2
3
4
5
6
7
8
9
China Taiwan Korea Singapore
4Q12 1Q13E
(% YoY)
0
1
2
3
4
5
6
Feb-
06
Aug-
06
Feb-
07
Aug-
07
Feb-
08
Aug-
08
Feb-
09
Aug-
09
Feb-
10
Aug-
10
Feb-
11
Aug-
11
Feb-
12
Aug-
12
Feb-
13
CPI, YoY % Policy rate
(%)
28 March 2013
Asia economic calendar
Macro preview: 1Q13 GDP and other data
• China’s GDP growth looks set to pick up further to 8.1%
• Its Asian neighbours, however, could disappoint
• BOK should be under pressure to deliver a 25bps cut in April
Economy / Asia ex Japan
Kevin Lai(852) 2848 [email protected]
Christie Chien(852) 2848 [email protected]
Economy / Asia ex Japan 28 March 2013
- 5 -
Economic Indicators
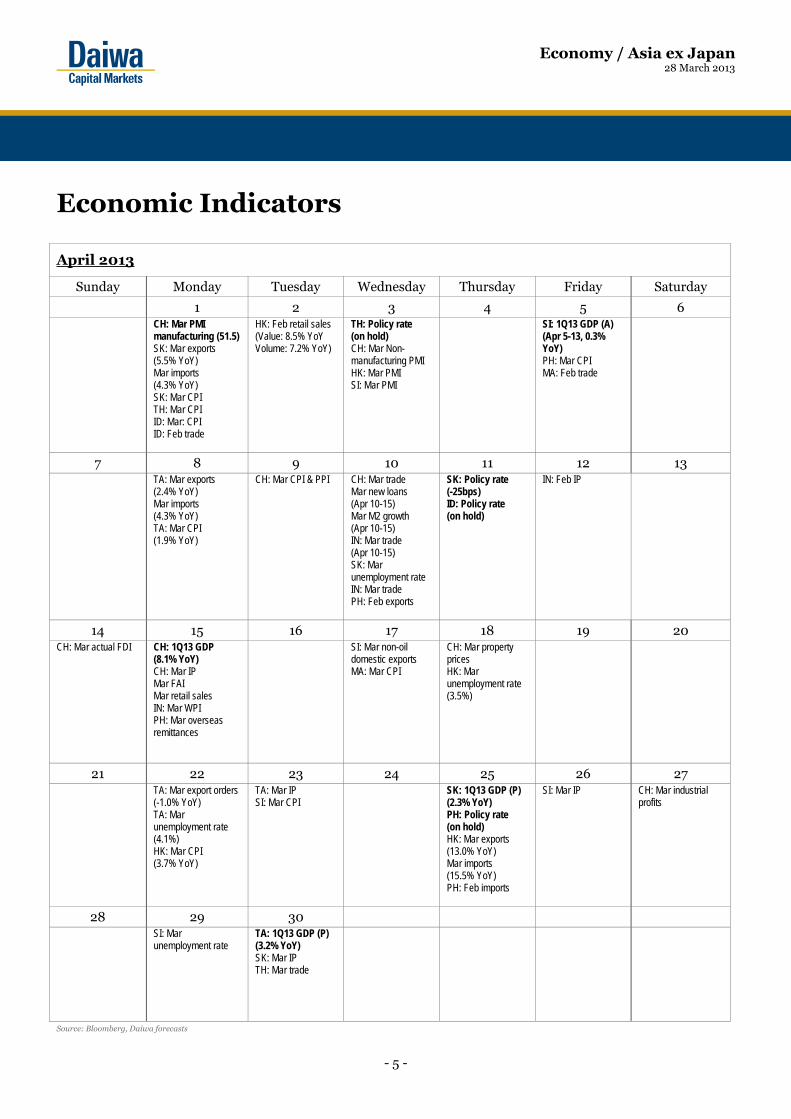
April 2013
Sunday Monday Tuesday Wednesday Thursday Friday Saturday
1 2 3 4 5 6
CH: Mar PMI manufacturing (51.5) SK: Mar exports (5.5% YoY) Mar imports (4.3% YoY) SK: Mar CPI TH: Mar CPI ID: Mar: CPI ID: Feb trade
HK: Feb retail sales (Value: 8.5% YoY Volume: 7.2% YoY)
TH: Policy rate(on hold) CH: Mar Non-manufacturing PMI HK: Mar PMI SI: Mar PMI
SI: 1Q13 GDP (A) (Apr 5-13, 0.3% YoY) PH: Mar CPI MA: Feb trade
7 8 9 10 11 12 13 TA: Mar exports
(2.4% YoY) Mar imports (4.3% YoY) TA: Mar CPI (1.9% YoY)
CH: Mar CPI & PPI
CH: Mar trade Mar new loans (Apr 10-15) Mar M2 growth (Apr 10-15) IN: Mar trade (Apr 10-15) SK: Mar unemployment rate IN: Mar trade PH: Feb exports
SK: Policy rate(-25bps) ID: Policy rate (on hold)
IN: Feb IP
14 15 16 17 18 19 20 CH: Mar actual FDI
CH: 1Q13 GDP (8.1% YoY) CH: Mar IP Mar FAI Mar retail sales IN: Mar WPI PH: Mar overseas remittances
SI: Mar non-oil domestic exports MA: Mar CPI
CH: Mar property prices HK: Mar unemployment rate (3.5%)
21 22 23 24 25 26 27 TA: Mar export orders
(-1.0% YoY) TA: Mar unemployment rate (4.1%) HK: Mar CPI (3.7% YoY)
TA: Mar IP SI: Mar CPI
SK: 1Q13 GDP (P)(2.3% YoY) PH: Policy rate (on hold) HK: Mar exports (13.0% YoY) Mar imports (15.5% YoY) PH: Feb imports
SI: Mar IP
CH: Mar industrial profits
28 29 30 SI: Mar
unemployment rate
TA: 1Q13 GDP (P)(3.2% YoY) SK: Mar IP TH: Mar trade
Source: Bloomberg, Daiwa forecasts

- 6 -
■ Summary On 27 March, the cabinet released the blueprint for its free economic pilot zone, which we see as the most ambitious plan to promote the liberalisation of trade and upgrade the industrial value chain in recent years. ■ Fundamentals Taiwan Vice-Premier Mao Chih-Kuo said the aim of the zone is to boost economic growth through further economic and trade liberalisation. The plan sets out two stages for the implementation of the zone. The first will focus on expanding the existing free trade zone (covering five ports and one airport zone) to boost economic growth. Easing regulations on hiring foreign workers is also a highlight (skilled foreign workers no longer need to have two years’ work experience before applying for a working visa in
Taiwan). Qualified Mainlanders can now apply for a three-year multiple visa. Meanwhile, there are no longer limitations on Mainland investment in the zone’s manufacturing sector, as long as the industry itself is not related to national security. This is a big step forward, in our view, as it opens the door for more cross-strait industrial strategic alliances. The second stage aims to give better terms to foreign investors than currently provided for under the WTO. It plans to give tax breaks to foreign workers and residency rights to Mainlanders who need to work in the zone. Stage one will likely be implemented in July 2013, while changes to Taiwan law are needed for stage two, which means the Legislative Yuan will be involved. Even though there is a high risk that the Legislative Yuan will reduce the proposed tax benefits, and narrow the scale of liberalisation and the proposed relaxation of certain regulations, the plan itself shows the Taiwan Government’s determination to embrace free trade. We regard this as a step in the right direction to prepare Taiwan for further Trans-Pacific Strategic Economic Partnership (TPP) talks. Foreign investment in Taiwan has been sluggish in recent years, as shown by the growing deficit in its direct investment balance. While we hope the free trade zone will be a watershed, it remains to be seen whether such a scheme could be eventually successfully applied to the whole island.
■ Balance of payments: net direct investment into Taiwan
Source: CEIC, Daiwa
If the zone is successfully implemented, we believe Taiwan will have the edge regionally in being able to attract foreign investment, even despite fierce competition from other Asian economies. Taiwan could even become the gateway for foreign investors looking to play the China market. In addition, we believe Taiwan has a strong manufacturing base with the ability to innovate. This is attractive to investors. ■ Taiwan: unit labour cost index
Source: CEIC, Daiwa
Over the near term, however, the upside to GDP growth may be limited. We are leaving our real GDP growth forecast unchanged at 3% YoY for 2013.
(16)
(14)
(12)
(10)
(8)
(6)
(4)
(2)
0
2
1995
1996
1997
1998
1999
2000
2001
2002
2003
2004
2005
2006
2007
2008
2009
2010
2011
2012
(USD bn)
7580859095
100105110
1991
1993
1995
1997
1999
2001
2003
2005
2007
2009
2011
(1990=100)
28 March 2013
Taiwan Economy
Free economic pilot zone gets the nod
• First stage of the zone will be set up in 2H13
• More relaxed regulations on hiring and more favourable investment terms highlighted
• A long-term positive but limited near-term upside
Economy / Taiwan
Christie Chien(852) 2848 [email protected]
Kevin Lai(852) 2848 [email protected]

- 7 -
Eiji Kinouchi (81) 3 5555-7230 [email protected] Hikaru Sato (81) 3 5555-7330 [email protected]
Slight setback at opening
The Tokyo stock market opened slightly below the flat line, probably due to fears over a possible change in foreign investors’ stance on Japanese shares. Japan’s Ministry of Finance released International Transactions in Securities before the opening this morning. The data shows nonresidents were net sellers of Japanese equities worth Y267.6 billion on the week ended 23 March. Also, buy orders placed by foreign brokers before the opening
reportedly outweighed sell orders only modestly compared with recent strong buying interest. The news apparently added to concerns. Given the turmoil in Cyprus last week, we fear that European investors may have changed their investment stance. Japanese shares broadly faced a slight setback, except for electric utilities, telecommunications, and Internet plays. Euro/yen below 52W MA, European
banks below recent range The euro/dollar rate fell to the 1.270-1.279 range, below the key support level of the 52-week moving average (see chart). Given the roughly 18-month cycle in the currency exchange rate, the euro could remain weak in 2013 if it stays below the moving average (see chart).
We think a modest decline below the key level does not necessarily suggest that the above-noted scenario will materialize. Still, we should remain cautious until around the ECB Governing Council meeting on 4 April. Furthermore, shares of European banks (not only those in southern Europe but also those in countries with solidest finances) have increasingly fallen below their six-month trading ranges at higher levels. With this in mind, we need to stay alert at least over the short term. At the same time, we expect selling pressure from pension funds to ease early in the new fiscal year. Tighter bank regulations warrant
caution Visibility is murky on banking-sector regulations, with the deposit
Technical analysis / Japan
28 March 2013Japanese report: 28 Mar 13
Kinouchi’s Technical Tips for Institutions
Technical Daily Comment
• Tokyo opened lower; watch for possible impact of G20
Source: Bloomberg; compiled by Daiwa.
1/41.184
10/151.089
1/50.957 9/20
0.928
7/161.012
5/291.191
2/171.284
12/301.364
9/51.254
5/121.293
12/41.334
4/221.599
11/251.513
11/41.421
5/21.483
2/11.364
1.0147/14
0.8905/4
0.82710/25
0.8367/5
0.8591/31
1.0819/2
1.1825/13
1.1907/4 1.167
11/16
1.24511/20 1.192
6/7
1.2911/7 1.267
1/161.2067/24
1.2783/27
0.7
0.8
0.9
1
1.1
1.2
1.3
1.4
1.5
1.6
1.7
23 mos.20 mos.
19 mos.
23 mos.
16 mos.
19 mos.
18 mos.
21 mos.$/€(weekly; 52W MA)
99 00 01 02 03 04 05 06 07 08 09 10 11 12 13
Prospectivetrend
52W MA simulatedassuming constantvalue at current level
($/€)

Technical Daily Comment
28 March 2013
- 8 -
haircut expected in Cyprus and the separation called for commercial and investment banking operations. A change in bank regulations tends to have a meaningful impact on European brokers’ open positions in Nikkei 225 futures. They started to close out their positions ahead of the introduction of tighter capital requirements and the Greek election in June 2012, and the Nikkei Stock Average began pulling back. This time, we think European brokers will start to reduce open positions around September with an eye on the January 2014 application of Basel III requirements in the region. As such, deleveraging appears unlikely anytime soon. In our view, however, the 18-19 April meetings of G20 finance ministers and central bank governors warrant attention as they could temporarily spur position squaring by European brokers. (Comment following opening of morning session—28 March 2013)
Translation: K.T. Style check: K.R. Accuracy check: K.T.
- 9 -
Tobias S. Blattner +44 20 7597 8318
Market review
Post-Cyprus re-pricing of risk
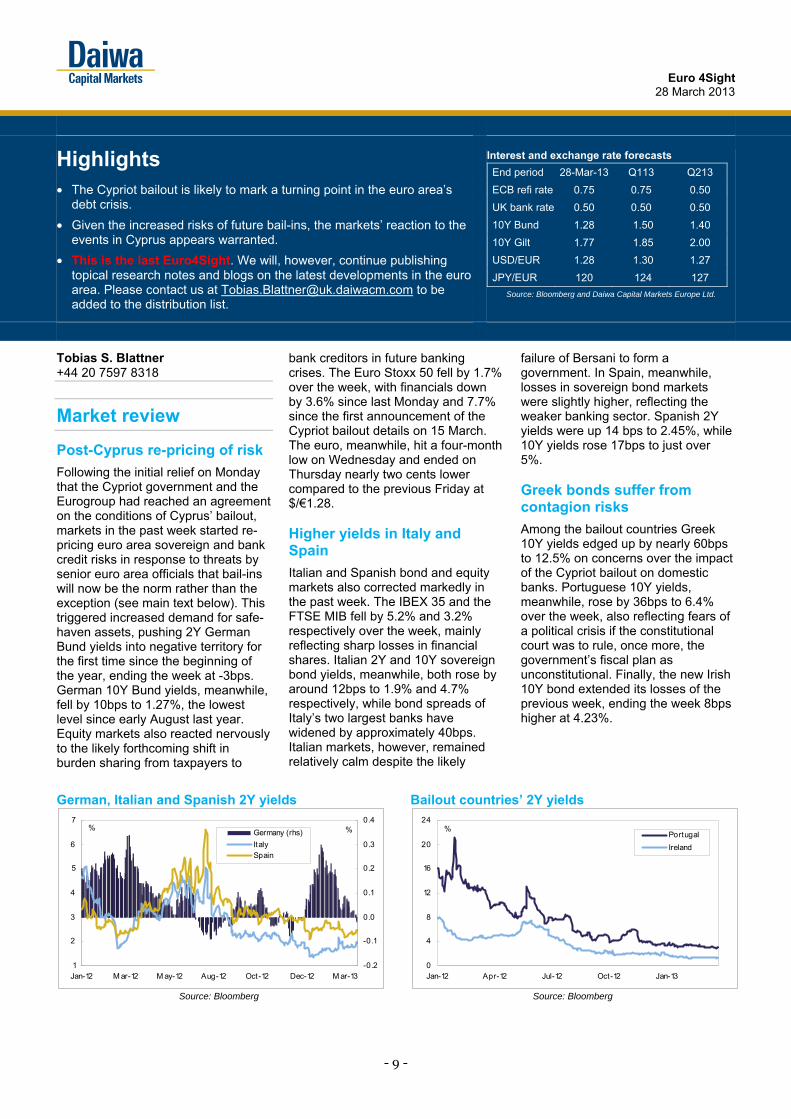
Following the initial relief on Monday that the Cypriot government and the Eurogroup had reached an agreement on the conditions of Cyprus’ bailout, markets in the past week started re-pricing euro area sovereign and bank credit risks in response to threats by senior euro area officials that bail-ins will now be the norm rather than the exception (see main text below). This triggered increased demand for safe-haven assets, pushing 2Y German Bund yields into negative territory for the first time since the beginning of the year, ending the week at -3bps. German 10Y Bund yields, meanwhile, fell by 10bps to 1.27%, the lowest level since early August last year. Equity markets also reacted nervously to the likely forthcoming shift in burden sharing from taxpayers to
bank creditors in future banking crises. The Euro Stoxx 50 fell by 1.7% over the week, with financials down by 3.6% since last Monday and 7.7% since the first announcement of the Cypriot bailout details on 15 March. The euro, meanwhile, hit a four-month low on Wednesday and ended on Thursday nearly two cents lower compared to the previous Friday at $/€1.28. Higher yields in Italy and Spain
Italian and Spanish bond and equity markets also corrected markedly in the past week. The IBEX 35 and the FTSE MIB fell by 5.2% and 3.2% respectively over the week, mainly reflecting sharp losses in financial shares. Italian 2Y and 10Y sovereign bond yields, meanwhile, both rose by around 12bps to 1.9% and 4.7% respectively, while bond spreads of Italy’s two largest banks have widened by approximately 40bps. Italian markets, however, remained relatively calm despite the likely
failure of Bersani to form a government. In Spain, meanwhile, losses in sovereign bond markets were slightly higher, reflecting the weaker banking sector. Spanish 2Y yields were up 14 bps to 2.45%, while 10Y yields rose 17bps to just over 5%. Greek bonds suffer from contagion risks
Among the bailout countries Greek 10Y yields edged up by nearly 60bps to 12.5% on concerns over the impact of the Cypriot bailout on domestic banks. Portuguese 10Y yields, meanwhile, rose by 36bps to 6.4% over the week, also reflecting fears of a political crisis if the constitutional court was to rule, once more, the government’s fiscal plan as unconstitutional. Finally, the new Irish 10Y bond extended its losses of the previous week, ending the week 8bps higher at 4.23%.
German, Italian and Spanish 2Y yields Bailout countries’ 2Y yields
Source: Bloomberg Source: Bloomberg
1
2
3
4
5
6
7
Jan-12 M ar-12 M ay-12 Aug-12 Oct-12 Dec-12 M ar-13-0.2
-0.1
0.0
0.1
0.2
0.3
0.4
Germany (rhs)
Italy Spain
% %
0
4
8
12
16
20
24
Jan-12 Apr-12 Jul-12 Oct-12 Jan-13
Portugal
Ireland
%
Euro 4Sight
28 March 2013
Highlights • The Cypriot bailout is likely to mark a turning point in the euro area’s
debt crisis.
• Given the increased risks of future bail-ins, the markets’ reaction to the events in Cyprus appears warranted.
• This is the last Euro4Sight. We will, however, continue publishing topical research notes and blogs on the latest developments in the euro area. Please contact us at [email protected] to be added to the distribution list.
Interest and exchange rate forecasts
End period 28-Mar-13 Q113 Q213
ECB refi rate 0.75 0.75 0.50
UK bank rate 0.50 0.50 0.50
10Y Bund 1.28 1.50 1.40
10Y Gilt 1.77 1.85 2.00
USD/EUR 1.28 1.30 1.27
JPY/EUR 120 124 127
Source: Bloomberg and Daiwa Capital Markets Europe Ltd.

Euro 4Sight 28 March 2013
- 10 -
Review & Outlook
Markets started re-pricing risks…
The Cypriot bailout is likely to mark a new turning point in the euro area’s debt crisis. Akin to the declaration of Deauville in October 2010, when German Chancellor Merkel and then French President Sarkozy first threatened private creditors with losses in future rescue packages, post-Cyprus bailout comments by Eurogroup Chairman Dijsselbloem (and others) sent a strong signal to markets that bail-ins of bank creditors will now be the norm rather than the exception. As we argued last week, bailing-in bank creditors is not inappropriate per se. But it is dangerous when the banking sector as a whole remains fragile and funding remains constrained. Market developments over the past few days have clearly highlighted these risks. Since the Eurogroup announcement of the details of the Cypriot bailout deal on 15 March, European banks’ generic 5Y CDS index has risen by more than 35% to its highest level since October last year. European financial CDS index
Source: Bloomberg and Daiwa Capital Markets Europe Ltd.
…intensifying the pressure on bank funding
Similarly, financing costs for banks in the periphery have also risen sharply since the decision to bail-in depositor in Cyprus. Bond spreads of Italy’s two largest banks have widened by approximately 40bps and by as much as 80bps for more vulnerable second-tier banks in Italy, Portugal and elsewhere in the periphery. This will not only put further upward pressure on bank lending rates, but also aggravate peripheral banks’ already strained market access. Indeed, a continuation of the recent successful bond market returns of many peripheral banks seems unlikely. Moreover, downward pressure on deposits is likely to increase too in coming months, further adding to peripheral banks’ funding constrains. With household net disposable income expected to decline, on average, by around 2%Y/Y this and next year, negatively affecting savings rates, deposit growth will slow considerably or remain negative in the periphery in the foreseeable future. And having seen what's happened in Cyprus, depositors will now be much more careful about where they put their
money for fear that it will be frozen or, even worse, expropriated. …and hence bank lending…
But the ramifications are broader than this. With funding pressure on peripheral banks intensifying, their dependency on cheap ECB liquidity is bound to increase. This comes amid pressure on banks in Portugal and Spain to lower their reliance on ECB liquidity as part of their respective adjustment programmes, substantially aggravating the required deleveraging process in these economies. Portuguese banks, for example, are required to lower their loan-to-deposit ratio to 120% by end-2014, from currently close to 150%. Of course, all of this will contribute to deepen the credit crunch in the periphery, choking economic recovery. The latest ECB data released today highlight the scale of the problem. In February, compared to a year earlier, loans to non-financial companies were down by 12% in Spain, and by 8% in Portugal, crushing investment. And in light of the renewed deterioration in business sentiment amid the broad-based return of political uncertainty, downside risks to the euro area’s growth outlook have clearly increased in recent weeks. Euro area: Loans to non-financial corporations
Source: Datastream
…thereby affecting sovereign spreads too
This has not left sovereign bond spreads unaffected. Although a stronger focus on private sector involvement (PSI) should arguably have reduced the potential bailout costs of weak sovereigns in the absence of a true banking union, Italian and Spanish 10Y sovereign bond spreads edged up by around 30bps in the past few days and by 50bps in Portugal. Indeed, if the Cypriot bailout creates a precedent, which we think it does, the risks of a restructuring, sovereign or otherwise, have clearly increased in the periphery. Even if a sizable share of creditors are non-residents as in the case of Cyprus, any decision ultimately to go down the PSI route in Spain, Italy or Portugal would almost certainly go hand-in-hand with a deeper recession and a steeper rise in the debt-to-GDP ratio than otherwise would be the case. Moreover, if accompanied by eye-watering fiscal consolidation, which seems likely to be the norm in the euro area, bail-ins
100
150
200
250
300
350
400
Jan-11 Apr-11 Jul-11 Oct-11 Jan-12 Apr-12 Jul-12 Oct-12 Jan-13
bps
Draghi's pledge tosave the euro
ECB announces
LTROs
-15
-10
-5
0
5
10
15
20
25
Jan-08 Jan-09 Jan-10 Jan-11 Jan-12 Jan-13
Euro area Italy
Portugal Spain
% , Y/Y
Euro 4Sight 28 March 2013
- 11 -
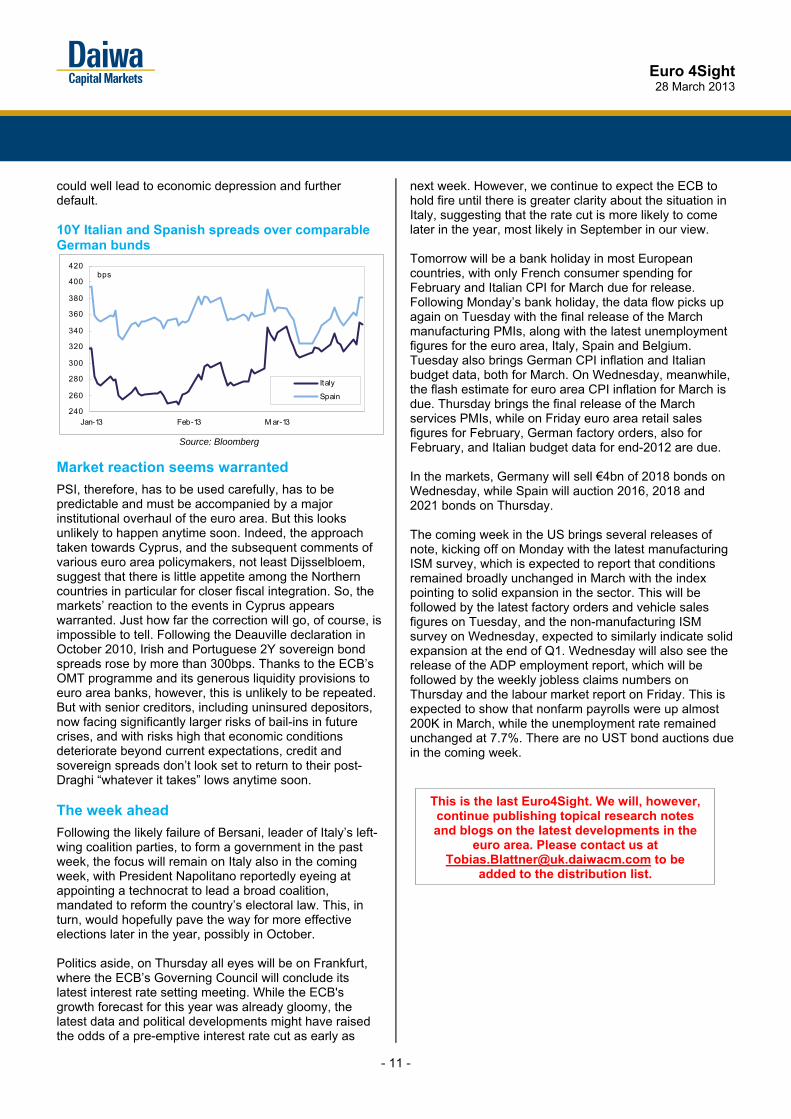
could well lead to economic depression and further default. 10Y Italian and Spanish spreads over comparable German bunds
Source: Bloomberg
Market reaction seems warranted
PSI, therefore, has to be used carefully, has to be predictable and must be accompanied by a major institutional overhaul of the euro area. But this looks unlikely to happen anytime soon. Indeed, the approach taken towards Cyprus, and the subsequent comments of various euro area policymakers, not least Dijsselbloem, suggest that there is little appetite among the Northern countries in particular for closer fiscal integration. So, the markets’ reaction to the events in Cyprus appears warranted. Just how far the correction will go, of course, is impossible to tell. Following the Deauville declaration in October 2010, Irish and Portuguese 2Y sovereign bond spreads rose by more than 300bps. Thanks to the ECB’s OMT programme and its generous liquidity provisions to euro area banks, however, this is unlikely to be repeated. But with senior creditors, including uninsured depositors, now facing significantly larger risks of bail-ins in future crises, and with risks high that economic conditions deteriorate beyond current expectations, credit and sovereign spreads don’t look set to return to their post-Draghi “whatever it takes” lows anytime soon. The week ahead
Following the likely failure of Bersani, leader of Italy’s left-wing coalition parties, to form a government in the past week, the focus will remain on Italy also in the coming week, with President Napolitano reportedly eyeing at appointing a technocrat to lead a broad coalition, mandated to reform the country’s electoral law. This, in turn, would hopefully pave the way for more effective elections later in the year, possibly in October. Politics aside, on Thursday all eyes will be on Frankfurt, where the ECB’s Governing Council will conclude its latest interest rate setting meeting. While the ECB's growth forecast for this year was already gloomy, the latest data and political developments might have raised the odds of a pre-emptive interest rate cut as early as
next week. However, we continue to expect the ECB to hold fire until there is greater clarity about the situation in Italy, suggesting that the rate cut is more likely to come later in the year, most likely in September in our view. Tomorrow will be a bank holiday in most European countries, with only French consumer spending for February and Italian CPI for March due for release. Following Monday’s bank holiday, the data flow picks up again on Tuesday with the final release of the March manufacturing PMIs, along with the latest unemployment figures for the euro area, Italy, Spain and Belgium. Tuesday also brings German CPI inflation and Italian budget data, both for March. On Wednesday, meanwhile, the flash estimate for euro area CPI inflation for March is due. Thursday brings the final release of the March services PMIs, while on Friday euro area retail sales figures for February, German factory orders, also for February, and Italian budget data for end-2012 are due. In the markets, Germany will sell €4bn of 2018 bonds on Wednesday, while Spain will auction 2016, 2018 and 2021 bonds on Thursday. The coming week in the US brings several releases of note, kicking off on Monday with the latest manufacturing ISM survey, which is expected to report that conditions remained broadly unchanged in March with the index pointing to solid expansion in the sector. This will be followed by the latest factory orders and vehicle sales figures on Tuesday, and the non-manufacturing ISM survey on Wednesday, expected to similarly indicate solid expansion at the end of Q1. Wednesday will also see the release of the ADP employment report, which will be followed by the weekly jobless claims numbers on Thursday and the labour market report on Friday. This is expected to show that nonfarm payrolls were up almost 200K in March, while the unemployment rate remained unchanged at 7.7%. There are no UST bond auctions due in the coming week.
240
260
280
300
320
340
360
380
400
420
Jan-13 Feb-13 M ar-13
Italy
Spain
bps
This is the last Euro4Sight. We will, however, continue publishing topical research notes and blogs on the latest developments in the
euro area. Please contact us at [email protected] to be
added to the distribution list.
12
What's new This is the final week of the results season in Hong Kong/China, with many of the stocks that we cover reporting their full-year 2012 results. Chaowei Power’s 2012 results highlighted the tough market conditions in 2H12; its gross margin declined to 14.1% in 2H12 (27.1% in 1H12). However, during an investor roadshow we hosted in Hong Kong and Singapore over 25-28 March, management said the pricing situation should improve in 2H13, especially due to the Mainland government’s requirement to shut down production of lead-acid batteries and lead-based cadmium components using sub-standard cadmium by end-2013. As at the end of 2012, the enclosed battery formation process accounted for some 83% of the company’s capacity. Meanwhile, Shenzhou International announced a 5% YoY decline in its 2012 net profit, its first such decline, owing to sluggish sales in Japan and China. Still, Shenzhou generated very strong cash flow last year and now has a net
cash position. It declared a special dividend per share of HKD0.20. Discovery idea Founded in 1990, Taiwan Acceptance Corp (TAC) is part of Taiwan automaker Yulon, which has a 53.29% stake in TAC, which engages in car leasing and factoring in Taiwan and operates equipment leasing and car rental businesses in China. TAC continues to expand in tandem with Yulon group. Backed by the asset quality of its China loans, it plans to raise its ticket size to CNY1m. TAC expects its China loans to increase by 50% YoY for 2013 and says it will consider starting a vendor programme in China. Picks of the week Ilvin Cornelis initiated coverage on Singapore’s third-largest grocery retailer, Sheng Siong Group, with a Buy (1) call. He forecasts a 2013-15 sales CAGR of 11%, on floor-space expansion and improvements in same-store sales (SSS), and sees room for the company to win market share from inefficient grocery retailers. Also, he expects demand for its low-priced supermarket products to remain strong, supported by overall population growth and the price-sensitivity of many consumers. Techtronic Industrial’s (TTI) 2012 gross margin was 33.5% (2011: 32.6%). We believe TTI will expand its gross margin in 2013 as the company continues to increase the proportion of sales of high-margin power-tool products. We are also
positive on the power-tool business, on strong sales of the Milwaukee Red Lithium cordless platform and the launch of a sub-compact product line. Besides, with a new generation of products (higher ASPs and profit margins) expected by management to account for 80% of total floor-care products by year-end (40% currently), we believe sales growth and margin increases for its floor-care business are likely over 2013-14. Corporate events Date Company Event Venue Mar 28 & Apr 2
REXLot (555 HK) NDR HK & SG
Mar 28 Shenzhou Int’l (2313 HK) NDR HK Apr 16 Techtronic (669 HK) NDR Boston
Source: Daiwa
Recent company visits (18 Mar – 28 Mar) Name Ticker Chailease Holdings* 5871 TT Chaowei Power* 951 HK China Financial Services* 605 HK China Outfitters* 1146 HK Kingsoft* 3888 HK REXLot* 555 HK Shenzhou Int'l* 2313 HK Stella* 1836 HK Techtronic Industries* 669 HK Weiqiao Textile* 2698 HK Win Hanverky 3322 HK
Source: Daiwa; * Results
MSCI small-cap index MSCI Small Cap
Chg (%) 27-Mar-13 1-week 1-month 3-month 6-month
Asia 1.8 4.5 9.9 13.4Asia ex-Japan 0.9 0.9 5.8 11.4China 0.2 (0.2) 7.9 29.8Hong Kong 1.5 2.0 8.8 18.1Taiwan 1.3 1.5 6.6 3.8Korea 0.8 3.9 7.0 2.5India (1.9) (6.8) (15.3) (8.9)Singapore 2.5 0.8 6.3 11.3Indonesia 0.5 8.2 22.7 25.0Malaysia 0.2 3.7 2.9 3.8Philippines 3.1 0.3 19.1 31.6Source: Bloomberg
28 March 2013
Asia small-cap weekly
• Despite falling short of expectations in 2012, Chaowei Power and Shenzhou International should resume positive growth in 2013
• Discovery idea: Taiwan Acceptance • Pick of the week: Sheng Siong Group and Techtronic
Discovery
Small Cap / Asia ex Japan
John Choi(852) 2773 8730
Regional Small-cap Team

- 13 -
■ What's new China COSCO (COSCO) posted a net loss of CNY9.6bn for 2012, worse than we and the market expected. Still, we believe the worst is behind us and expect the industry to recover gradually from 2013 onwards, underpinning a profitability upturn for COSCO. ■ What's the impact We envisage only short-term share-price pressure on the back of the weak 2012 results, as COSCO had already issued a profit warning on 25 January stating that it expected a significant net loss for 2012. Weakness in dry-bulk demand was the main reason for its net loss. Its full-year operating loss was CNY7.8bn, with no improvement in 2H12. Management expects a net capacity increase for the company after scrapping of about 6-7% YoY in 2013, which should match closely to the dry-bulk demand growth,
projected at 5% YoY. Though the shipping industry’s overcapacity accumulated in the past years would need time to be absorbed, management believes the worst situation is already over. COSCO has announced that it will record a one-off disposal gain of CNY1.96bn from the planned disposal of its logistics business for 2013. We expect the transaction to be completed in 1H13, and our 2013-14 forecasts now incorporate the financial impact of the disposal. Though we do not consider the disposal as a long-term positive for COSCO, it concurs with our and the market’s expectation that the company would need to sell this business to avoid a delisting from the A-share market. COSCO’s share price has moved in line with those of its peers since it announced the disposal, and thus we do not see major negative sentiment on the transaction. The company’s container-shipping business reduced its operating loss to CNY1.5bn for 2012 (from CNY6.4bn for 2011), due we believe to consistent freight rate hikes. We expect better profitability in 2013 assuming a continued freight rate improvement. Our revenue and bottom-line revisions for COSCO for 2013-14E reflect primarily the exclusion of the logistics business. ■ What we recommend We believe COSCO’s current share price already factors in the negatives and reiterate our Buy (1) rating. Going forward, as well as an industry recovery, we expect another share-price catalyst from supportive policies from the PRC Government, which could be in the form of subsidies for the scrapping of aged vessels.
We lower our six-month target price to HKD4.50 (from HKD5.60), reflecting mainly the exclusion of the logistics business which reduces our 2013E BVPS, to which we assign an unchanged PBR of 1.8x, in line with COSCO’s average trading PBR before it acquired the logistics business. Risks to our call would include weaker-than-expected cargo traffic and freight-rate increases, and further asset disposals. ■ How we differ We are more optimistic than the market about a recovery in COSCO’s profitability.
28 March 2013
Profitability upturn expected
• Disposal of its logistics business should suffice to turn COSCO back to a reported-basis profit in 2013
• Worst of the dry-bulk industry appears over and we expect a gradual recovery this year
• Additional catalyst from potentially supportive government policies
Source: Daiwa forecasts
Source: FactSet, Daiwa forecasts
Industrials / Hong Kong
China COSCO1919 HK
Buy (unchanged)
OutperformHoldUnderperformSell
1
2
3
4
5Target (HKD): 5.60 4.50 Upside: 23.0% 28 Mar price (HKD): 3.66
Kelvin Lau(852) 2848 [email protected]
Forecast revisions (%)Year to 31 Dec 13E 14E 15ERevenue change (10.4) (24.3) n.a.Net profit change n.a. (13.1) n.a.Core EPS (FD) change n.a. (13.1) n.a.
65
78
90
103
115
2.5
3.3
4.0
4.8
5.5
Mar-12 Jun-12 Sep-12 Dec-12 Mar-13
Share price performance
Ch COSCO (LHS) Relative to HSI (RHS)
(HKD) (%)
12-month range 2.76-5.10Market cap (USDbn) 4.823m avg daily turnover (USDm) 11.13Shares outstanding (m) 10,216Major shareholder China Ocean Shipping (52.8%)
Financial summary (CNY)Year to 31 Dec 13E 14E 15ERevenue (m) 88,677 85,097 91,649Operating profit (m) (1,289) 3,071 4,025Net profit (m) (624) 2,753 3,610Core EPS (fully-diluted) (0.061) 0.269 0.353EPS change (%) n.a. n.a. 31.2Daiwa vs Cons. EPS (%) n.a. 30.2 135.6PER (x) n.a. 10.9 8.3Dividend yield (%) 0.0 0.0 0.0DPS 0.000 0.000 0.000PBR (x) 1.4 1.3 1.1EV/EBITDA (x) 27.9 10.3 8.6ROE (%) n.a. 12.3 14.3
Industrials / Hong Kong 1919 HK
28 March 2013
14
China COSCO: income statement summary (IFRS) YoY (%)
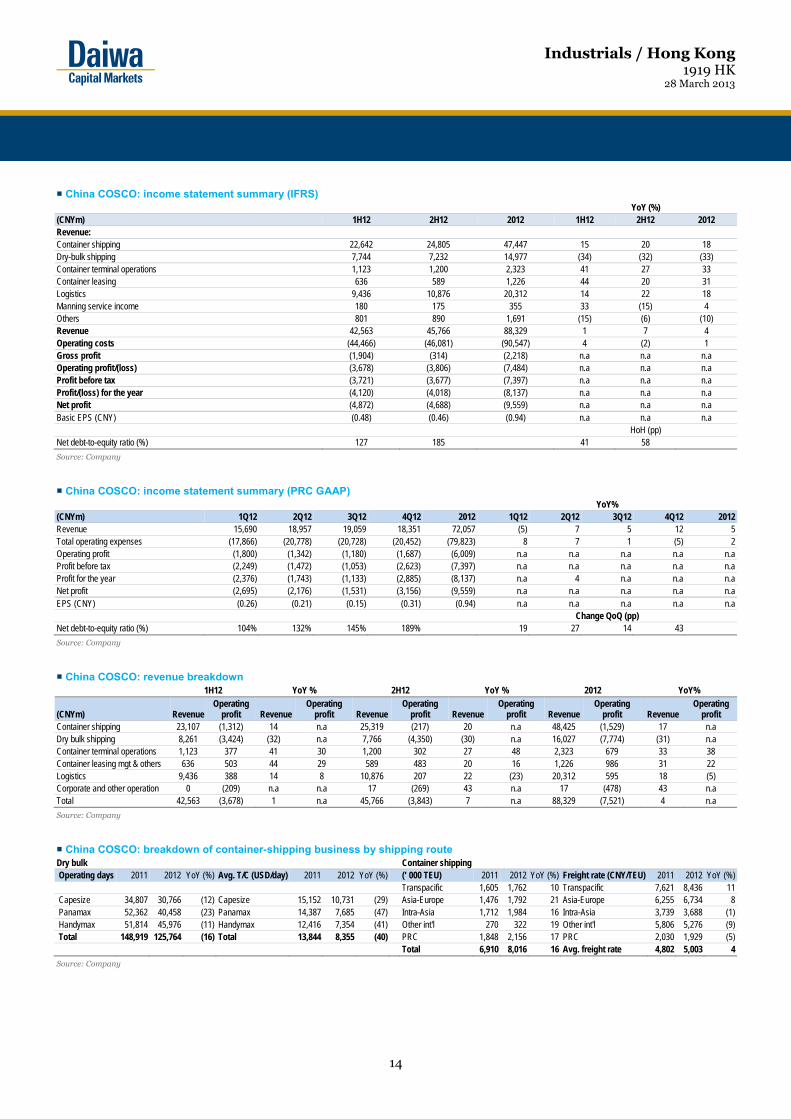
(CNYm) 1H12 2H12 2012 1H12 2H12 2012 Revenue: Container shipping 22,642 24,805 47,447 15 20 18 Dry-bulk shipping 7,744 7,232 14,977 (34) (32) (33) Container terminal operations 1,123 1,200 2,323 41 27 33 Container leasing 636 589 1,226 44 20 31 Logistics 9,436 10,876 20,312 14 22 18 Manning service income 180 175 355 33 (15) 4 Others 801 890 1,691 (15) (6) (10) Revenue 42,563 45,766 88,329 1 7 4 Operating costs (44,466) (46,081) (90,547) 4 (2) 1 Gross profit (1,904) (314) (2,218) n.a n.a n.a Operating profit/(loss) (3,678) (3,806) (7,484) n.a n.a n.a Profit before tax (3,721) (3,677) (7,397) n.a n.a n.a Profit/(loss) for the year (4,120) (4,018) (8,137) n.a n.a n.a Net profit (4,872) (4,688) (9,559) n.a n.a n.a Basic EPS (CNY) (0.48) (0.46) (0.94) n.a n.a n.a
HoH (pp) Net debt-to-equity ratio (%) 127 185 41 58
Source: Company
China COSCO: income statement summary (PRC GAAP) YoY%
(CNYm) 1Q12 2Q12 3Q12 4Q12 2012 1Q12 2Q12 3Q12 4Q12 2012Revenue 15,690 18,957 19,059 18,351 72,057 (5) 7 5 12 5Total operating expenses (17,866) (20,778) (20,728) (20,452) (79,823) 8 7 1 (5) 2Operating profit (1,800) (1,342) (1,180) (1,687) (6,009) n.a n.a n.a n.a n.a Profit before tax (2,249) (1,472) (1,053) (2,623) (7,397) n.a n.a n.a n.a n.aProfit for the year (2,376) (1,743) (1,133) (2,885) (8,137) n.a 4 n.a n.a n.aNet profit (2,695) (2,176) (1,531) (3,156) (9,559) n.a n.a n.a n.a n.aEPS (CNY) (0.26) (0.21) (0.15) (0.31) (0.94) n.a n.a n.a n.a n.a
Change QoQ (pp) Net debt-to-equity ratio (%) 104% 132% 145% 189% 19 27 14 43
Source: Company
China COSCO: revenue breakdown 1H12 YoY % 2H12 YoY % 2012 YoY%
(CNYm) Revenue Operating
profit Revenue Operating
profit RevenueOperating
profit RevenueOperating
profit Revenue Operating
profit Revenue Operating
profit Container shipping 23,107 (1,312) 14 n.a 25,319 (217) 20 n.a 48,425 (1,529) 17 n.a Dry bulk shipping 8,261 (3,424) (32) n.a 7,766 (4,350) (30) n.a 16,027 (7,774) (31) n.a Container terminal operations 1,123 377 41 30 1,200 302 27 48 2,323 679 33 38 Container leasing mgt & others 636 503 44 29 589 483 20 16 1,226 986 31 22 Logistics 9,436 388 14 8 10,876 207 22 (23) 20,312 595 18 (5) Corporate and other operation 0 (209) n.a n.a 17 (269) 43 n.a 17 (478) 43 n.a Total 42,563 (3,678) 1 n.a 45,766 (3,843) 7 n.a 88,329 (7,521) 4 n.a
Source: Company
China COSCO: breakdown of container-shipping business by shipping route Dry bulk Container shipping Operating days 2011 2012 YoY (%) Avg. T/C (USD/day) 2011 2012 YoY (%) (‘ 000 TEU) 2011 2012 YoY (%) Freight rate (CNY/TEU) 2011 2012 YoY (%)
Transpacific 1,605 1,762 10 Transpacific 7,621 8,436 11 Capesize 34,807 30,766 (12) Capesize 15,152 10,731 (29) Asia-Europe 1,476 1,792 21 Asia-Europe 6,255 6,734 8 Panamax 52,362 40,458 (23) Panamax 14,387 7,685 (47) Intra-Asia 1,712 1,984 16 Intra-Asia 3,739 3,688 (1) Handymax 51,814 45,976 (11) Handymax 12,416 7,354 (41) Other int'l 270 322 19 Other int'l 5,806 5,276 (9) Total 148,919 125,764 (16) Total 13,844 8,355 (40) PRC 1,848 2,156 17 PRC 2,030 1,929 (5)
Total 6,910 8,016 16 Avg. freight rate 4,802 5,003 4
Source: Company
Industrials / Hong Kong 1919 HK
28 March 2013
15
Key assumptions
Profit and loss (CNYm)
Cash flow (CNYm)
Source: FactSet, Daiwa forecasts
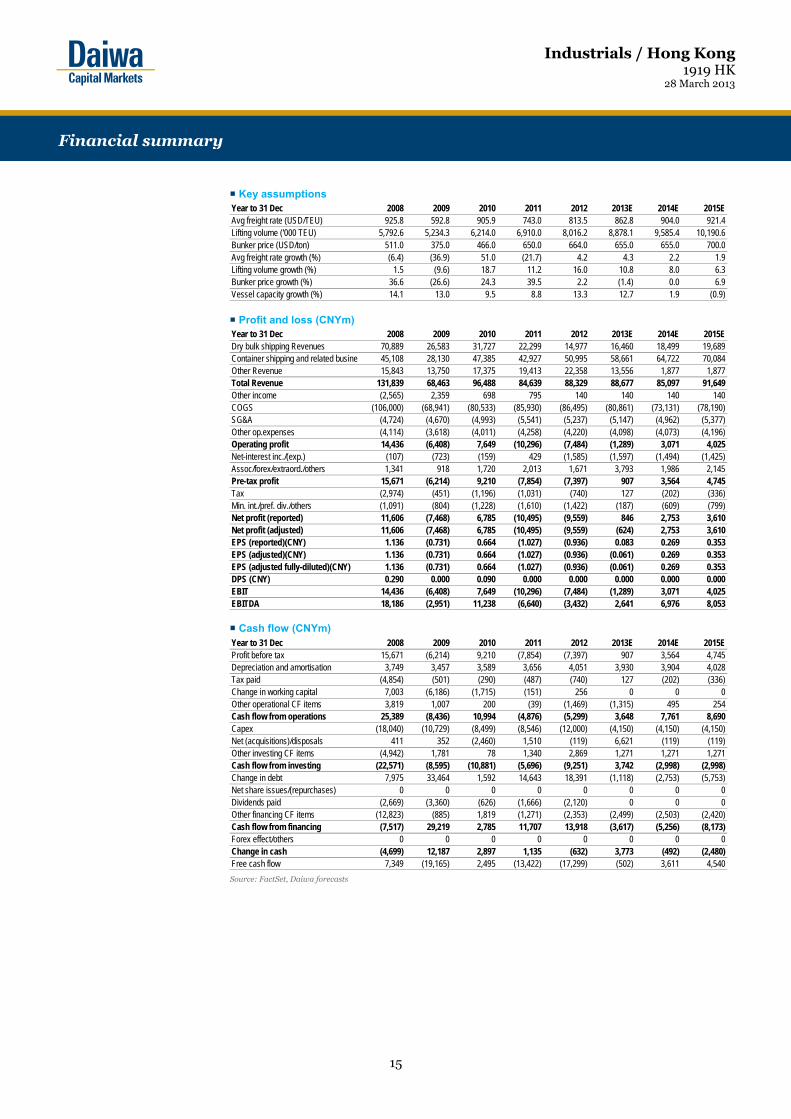
Year to 31 Dec 2008 2009 2010 2011 2012 2013E 2014E 2015EAvg freight rate (USD/TEU) 925.8 592.8 905.9 743.0 813.5 862.8 904.0 921.4Lifting volume ('000 TEU) 5,792.6 5,234.3 6,214.0 6,910.0 8,016.2 8,878.1 9,585.4 10,190.6Bunker price (USD/ton) 511.0 375.0 466.0 650.0 664.0 655.0 655.0 700.0Avg freight rate growth (%) (6.4) (36.9) 51.0 (21.7) 4.2 4.3 2.2 1.9Lifting volume growth (%) 1.5 (9.6) 18.7 11.2 16.0 10.8 8.0 6.3Bunker price growth (%) 36.6 (26.6) 24.3 39.5 2.2 (1.4) 0.0 6.9Vessel capacity growth (%) 14.1 13.0 9.5 8.8 13.3 12.7 1.9 (0.9)
Year to 31 Dec 2008 2009 2010 2011 2012 2013E 2014E 2015EDry bulk shipping Revenues 70,889 26,583 31,727 22,299 14,977 16,460 18,499 19,689Container shipping and related busines 45,108 28,130 47,385 42,927 50,995 58,661 64,722 70,084Other Revenue 15,843 13,750 17,375 19,413 22,358 13,556 1,877 1,877Total Revenue 131,839 68,463 96,488 84,639 88,329 88,677 85,097 91,649Other income (2,565) 2,359 698 795 140 140 140 140COGS (106,000) (68,941) (80,533) (85,930) (86,495) (80,861) (73,131) (78,190)SG&A (4,724) (4,670) (4,993) (5,541) (5,237) (5,147) (4,962) (5,377)Other op.expenses (4,114) (3,618) (4,011) (4,258) (4,220) (4,098) (4,073) (4,196)Operating profit 14,436 (6,408) 7,649 (10,296) (7,484) (1,289) 3,071 4,025Net-interest inc./(exp.) (107) (723) (159) 429 (1,585) (1,597) (1,494) (1,425)Assoc/forex/extraord./others 1,341 918 1,720 2,013 1,671 3,793 1,986 2,145Pre-tax profit 15,671 (6,214) 9,210 (7,854) (7,397) 907 3,564 4,745Tax (2,974) (451) (1,196) (1,031) (740) 127 (202) (336)Min. int./pref. div./others (1,091) (804) (1,228) (1,610) (1,422) (187) (609) (799)Net profit (reported) 11,606 (7,468) 6,785 (10,495) (9,559) 846 2,753 3,610Net profit (adjusted) 11,606 (7,468) 6,785 (10,495) (9,559) (624) 2,753 3,610EPS (reported)(CNY) 1.136 (0.731) 0.664 (1.027) (0.936) 0.083 0.269 0.353EPS (adjusted)(CNY) 1.136 (0.731) 0.664 (1.027) (0.936) (0.061) 0.269 0.353EPS (adjusted fully-diluted)(CNY) 1.136 (0.731) 0.664 (1.027) (0.936) (0.061) 0.269 0.353DPS (CNY) 0.290 0.000 0.090 0.000 0.000 0.000 0.000 0.000EBIT 14,436 (6,408) 7,649 (10,296) (7,484) (1,289) 3,071 4,025EBITDA 18,186 (2,951) 11,238 (6,640) (3,432) 2,641 6,976 8,053
Year to 31 Dec 2008 2009 2010 2011 2012 2013E 2014E 2015EProfit before tax 15,671 (6,214) 9,210 (7,854) (7,397) 907 3,564 4,745Depreciation and amortisation 3,749 3,457 3,589 3,656 4,051 3,930 3,904 4,028Tax paid (4,854) (501) (290) (487) (740) 127 (202) (336)Change in working capital 7,003 (6,186) (1,715) (151) 256 0 0 0Other operational CF items 3,819 1,007 200 (39) (1,469) (1,315) 495 254Cash flow from operations 25,389 (8,436) 10,994 (4,876) (5,299) 3,648 7,761 8,690Capex (18,040) (10,729) (8,499) (8,546) (12,000) (4,150) (4,150) (4,150)Net (acquisitions)/disposals 411 352 (2,460) 1,510 (119) 6,621 (119) (119)Other investing CF items (4,942) 1,781 78 1,340 2,869 1,271 1,271 1,271Cash flow from investing (22,571) (8,595) (10,881) (5,696) (9,251) 3,742 (2,998) (2,998)Change in debt 7,975 33,464 1,592 14,643 18,391 (1,118) (2,753) (5,753)Net share issues/(repurchases) 0 0 0 0 0 0 0 0Dividends paid (2,669) (3,360) (626) (1,666) (2,120) 0 0 0Other financing CF items (12,823) (885) 1,819 (1,271) (2,353) (2,499) (2,503) (2,420)Cash flow from financing (7,517) 29,219 2,785 11,707 13,918 (3,617) (5,256) (8,173)Forex effect/others 0 0 0 0 0 0 0 0Change in cash (4,699) 12,187 2,897 1,135 (632) 3,773 (492) (2,480)Free cash flow 7,349 (19,165) 2,495 (13,422) (17,299) (502) 3,611 4,540
Financial summary

Industrials / Hong Kong 1919 HK
28 March 2013
16
Balance sheet (CNYm)
Key ratios (%)
Source: FactSet, Daiwa forecasts
Company profile
China COSCO is the world’s second-largest integrated shipping company in terms of capacity. The company provides a wide range of container shipping, dry-bulk shipping, logistics services, terminal and container leasing services for both international and domestic customers. As at the end of 2011, the company had 332 dry-bulk vessels with a total capacity of 30m DWT, and 174 container vessels with a total capacity of 0.76m TEUs (and an average age of 10 years).
As at 31 Dec 2008 2009 2010 2011 2012 2013E 2014E 2015ECash & short-term investment 32,356 44,280 47,381 47,473 46,765 50,538 50,045 47,565Inventory 1,539 1,783 2,117 3,387 2,731 2,731 2,731 2,731Accounts receivable 10,543 8,700 10,961 11,899 13,564 10,121 9,727 10,447Other current assets 650 464 152 0 54 54 54 54Total current assets 45,088 55,227 60,610 62,759 63,114 63,444 62,558 60,797Fixed assets 55,849 63,025 67,096 73,030 80,643 75,158 75,577 75,874Goodwill & intangibles 186 214 210 196 202 151 100 49Other non-current assets 18,887 20,356 23,065 21,474 21,248 19,109 19,082 19,056Total assets 120,010 138,822 150,982 157,459 165,208 157,861 157,317 155,776Short-term debt 3,650 7,233 5,870 21,713 14,118 10,753 10,753 10,753Accounts payable 15,412 17,799 20,392 23,799 24,213 21,019 19,594 20,546Other current liabilities 10,284 2,508 2,281 2,481 2,082 2,082 2,082 2,082Total current liabilities 29,345 27,540 28,543 47,993 40,413 33,854 32,428 33,381Long-term debt 23,296 53,117 54,927 55,314 79,086 82,586 79,586 73,586Other non-current liabilities 5,462 4,630 5,211 3,982 4,011 4,011 4,011 4,011Total liabilities 58,104 85,287 88,681 107,288 123,510 120,451 116,026 110,978Share capital 10,216 10,216 10,216 10,216 10,216 10,216 10,216 10,216Reserves/R.E./others 41,927 32,720 37,613 24,479 14,921 10,446 13,718 16,425Shareholders' equity 52,144 42,936 47,829 34,695 25,137 20,662 23,935 26,641Minority interests 9,763 10,599 14,472 15,475 16,561 16,748 17,357 18,156Total equity & liabilities 120,010 138,822 150,982 157,459 165,208 157,861 157,317 155,776EV 23,875 45,929 42,335 58,815 76,313 73,813 71,914 69,194Net debt/(cash) (5,410) 16,070 13,416 29,553 46,439 42,801 40,294 36,774BVPS (CNY) 5.104 4.203 4.682 3.396 2.460 2.022 2.343 2.608
Year to 31 Dec 2008 2009 2010 2011 2012 2013E 2014E 2015ESales (YoY) 17.5 (48.1) 40.9 (12.3) 4.4 0.4 (4.0) 7.7EBITDA (YoY) (35.6) n.a. n.a. n.a. n.a. n.a. 164.1 15.4Operating profit (YoY) (40.1) n.a. n.a. n.a. n.a. n.a. n.a. 31.1Net profit (YoY) (40.4) n.a. n.a. n.a. n.a. n.a. n.a. 31.2Core EPS (fully-diluted) (YoY) (47.9) n.a. n.a. n.a. n.a. n.a. n.a. 31.2Gross-profit margin 19.6 n.a. 16.5 n.a. 2.1 8.8 14.1 14.7EBITDA margin 13.8 n.a. 11.6 n.a. n.a. 3.0 8.2 8.8Operating-profit margin 10.9 n.a. 7.9 n.a. n.a. n.a. 3.6 4.4Net profit margin 8.8 (10.9) 7.0 (12.4) (10.8) (0.7) 3.2 3.9ROAE 23.5 n.a. 15.0 n.a. n.a. n.a. 12.3 14.3ROAA 9.8 n.a. 4.7 n.a. n.a. n.a. 1.7 2.3ROCE 17.5 n.a. 6.5 n.a. n.a. n.a. 2.3 3.1ROIC 24.5 (10.2) 9.2 (13.2) (8.9) (1.5) 3.6 4.6Net debt to equity net cash 37.4 28.1 85.2 184.7 207.1 168.3 138.0Effective tax rate 19.0 n.a. 13.0 n.a. n.a. n.a. 5.7 7.1Accounts receivable (days) 33.0 51.3 37.2 49.3 52.6 48.7 42.6 40.2Current ratio (x) 1.5 2.0 2.1 1.3 1.6 1.9 1.9 1.8Net interest cover (x) 135.3 n.a. 48.0 n.a. n.a. n.a. 2.1 2.8Net dividend payout 25.5 n.a. 13.6 n.a. n.a. 0.0 0.0 0.0Free cash flow yield 24.6 n.a. 8.3 n.a. n.a. n.a. 12.1 15.2
Financial summary continued …
- 17 -
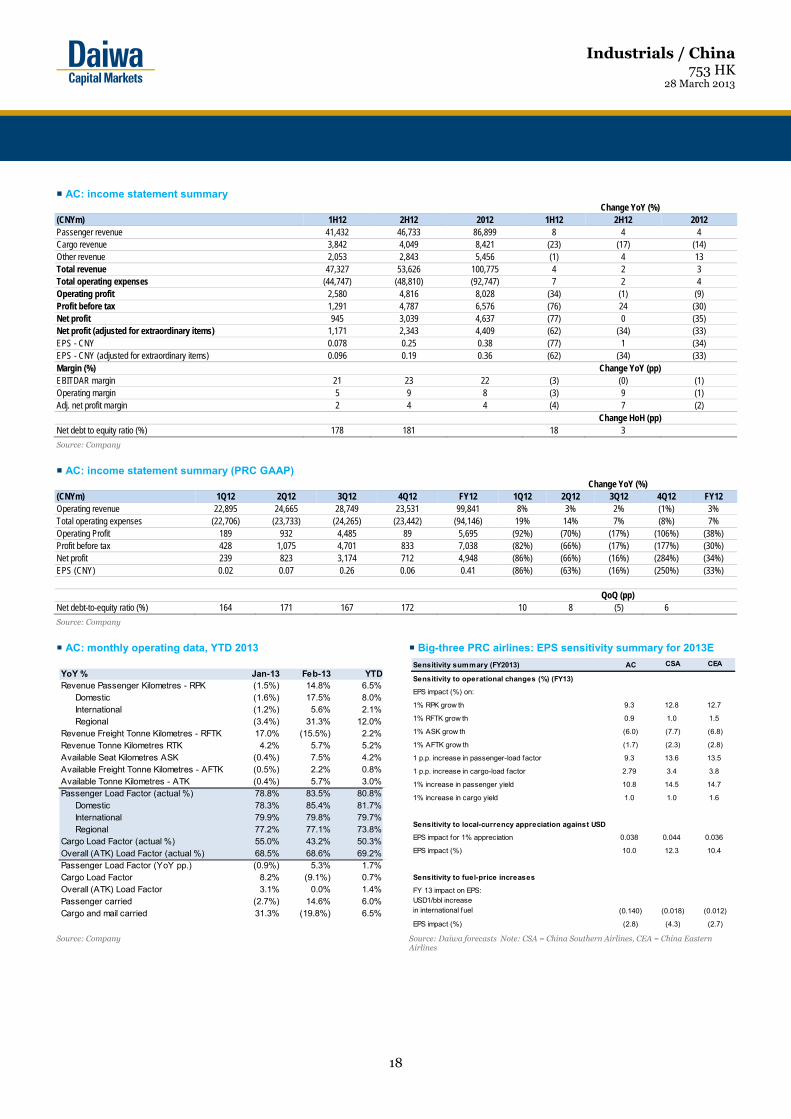
■ What's new We have reassessed our forecasts for Air China (AC) post our meeting with management on 27 March, and expect profitability for AC and its PRC peers to improve substantially this year. ■ What's the impact AC’s recurring net profit for 2012 was CNY4.4bn, down 33% YoY, which was better than market expectations but lower than ours. The major disappointment was the 1.3% YoY decline in yield for 2H12. Management is optimistic about a recovery in passenger traffic in 2013 and plans to increase domestic passenger capacity by 15% YoY and international passenger capacity by 13% YoY this year. AC is bullish on the US market, where it aims to raise capacity by 35% YoY this year, whereas it plans only a 6% YoY capacity increase in Europe. We believe demand growth should able to match the planned capacity
rises and thus forecast a stable passenger load factor of 80% for AC for 2013. We are positive about the pick-up in premium traffic of 13% YoY over January-February, but remain cautious on a passenger yield recovery as the big-three PRC airlines target to raise capacity this year by 11-14% YoY, which we consider aggressive. We reduce slightly our 2013 passenger yield growth forecast for AC to 2% YoY (from 3% YoY). On the cargo market, AC does not see a significant recovery and expects demand to remain weak in 2013. It expects to increase cargo capacity by 5% YoY this year. The negative impact of increases in landing and take-off charges and parking charges should be about CNY750m a year for AC, according to management. We now include this additional cost impact in our forecasts. ■ What we recommend We reduce our 2013-14E EPS by 12% to factor in the lower-than-expected 2012 results, along with the impact of increased landing/take-off charges and lower-than-previously-assumed passenger yields. As such, we lower our six-month target price to HKD8.00 (from HKD8.60), based on our revised 2013E BVPS and an unchanged PBR of 1.4x, corresponding to the industry’s adjusted average PBR for 2010. We reaffirm our Buy (1) rating on AC. We expect profitability to improve significantly this year and are positively surprised by the improving premium traffic and sound traffic growth for January-February. In the long run, AC still looks the best-positioned PRC airline to capture growing PRC outbound traffic,
premium-class travel and a recovery in the air freight market. The stock trades at a 2013E PBR of 1.2x, which is below its past-five-year average PBR of 1.5x and looks undemanding to us. Risks to our call would include lower-than-expected traffic and yield increases. ■ How we differ Our 2013-14E EPS are 7-10% higher than the Bloomberg consensus forecasts as we are more positive about a traffic improvement in 2013.
28 March 2013
Expect 2013 profitability to improve
• AC’s 2012 results beat market expectations but missed ours
• We expect passenger traffic growth to match planned capacity growth of 13-15% YoY for 2013
• We have slight yield concerns but still expect a strong profitability improvement
Source: Daiwa forecasts
Source: FactSet, Daiwa forecasts
Industrials / China
Air China753 HK
Buy (unchanged)
OutperformHoldUnderperformSell
1
2
3
4
5Target (HKD): 8.60 8.00 Upside: 15.9% 28 Mar price (HKD): 6.90
Kelvin Lau(852) 2848 [email protected]
Forecast revisions (%)Year to 31 Dec 13E 14E 15ERevenue change 0.2 (0.2) n.a.Net profit change (12.9) (12.8) n.a.Core EPS (FD) change (12.1) (12.0) n.a.
90
100
110
120
130
4.0
4.9
5.8
6.6
7.5
Mar-12 Jun-12 Sep-12 Dec-12 Mar-13
Share price performance
Air China (LHS) Relative to HSI (RHS)
(HKD) (%)
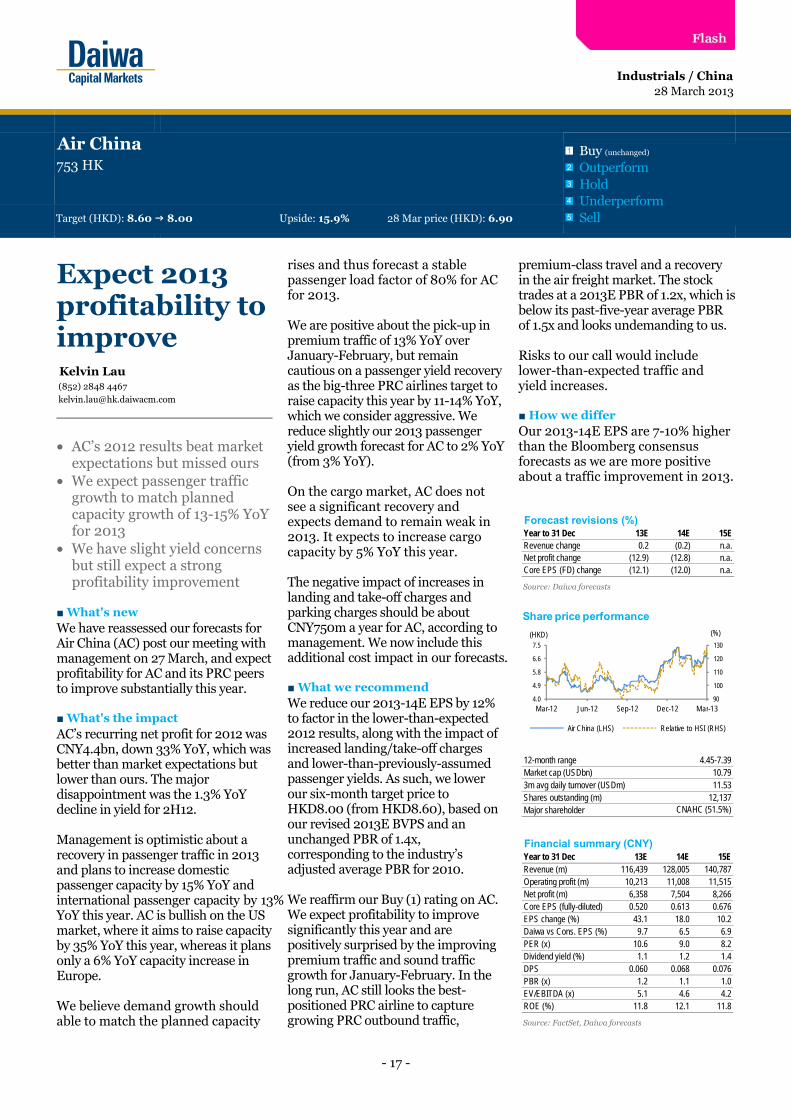
12-month range 4.45-7.39Market cap (USDbn) 10.793m avg daily turnover (USDm) 11.53Shares outstanding (m) 12,137Major shareholder CNAHC (51.5%)
Financial summary (CNY)Year to 31 Dec 13E 14E 15ERevenue (m) 116,439 128,005 140,787Operating profit (m) 10,213 11,008 11,515Net profit (m) 6,358 7,504 8,266Core EPS (fully-diluted) 0.520 0.613 0.676EPS change (%) 43.1 18.0 10.2Daiwa vs Cons. EPS (%) 9.7 6.5 6.9PER (x) 10.6 9.0 8.2Dividend yield (%) 1.1 1.2 1.4DPS 0.060 0.068 0.076PBR (x) 1.2 1.1 1.0EV/EBITDA (x) 5.1 4.6 4.2ROE (%) 11.8 12.1 11.8
Industrials / China 753 HK
28 March 2013
18
AC: income statement summary Change YoY (%)
(CNYm) 1H12 2H12 2012 1H12 2H12 2012 Passenger revenue 41,432 46,733 86,899 8 4 4 Cargo revenue 3,842 4,049 8,421 (23) (17) (14) Other revenue 2,053 2,843 5,456 (1) 4 13 Total revenue 47,327 53,626 100,775 4 2 3 Total operating expenses (44,747) (48,810) (92,747) 7 2 4 Operating profit 2,580 4,816 8,028 (34) (1) (9) Profit before tax 1,291 4,787 6,576 (76) 24 (30) Net profit 945 3,039 4,637 (77) 0 (35) Net profit (adjusted for extraordinary items) 1,171 2,343 4,409 (62) (34) (33) EPS - CNY 0.078 0.25 0.38 (77) 1 (34) EPS - CNY (adjusted for extraordinary items) 0.096 0.19 0.36 (62) (34) (33) Margin (%) Change YoY (pp) EBITDAR margin 21 23 22 (3) (0) (1) Operating margin 5 9 8 (3) 9 (1) Adj. net profit margin 2 4 4 (4) 7 (2)
Change HoH (pp) Net debt to equity ratio (%) 178 181 18 3
Source: Company
AC: income statement summary (PRC GAAP)
Change YoY (%) (CNYm) 1Q12 2Q12 3Q12 4Q12 FY12 1Q12 2Q12 3Q12 4Q12 FY12 Operating revenue 22,895 24,665 28,749 23,531 99,841 8% 3% 2% (1%) 3% Total operating expenses (22,706) (23,733) (24,265) (23,442) (94,146) 19% 14% 7% (8%) 7% Operating Profit 189 932 4,485 89 5,695 (92%) (70%) (17%) (106%) (38%) Profit before tax 428 1,075 4,701 833 7,038 (82%) (66%) (17%) (177%) (30%) Net profit 239 823 3,174 712 4,948 (86%) (66%) (16%) (284%) (34%) EPS (CNY) 0.02 0.07 0.26 0.06 0.41 (86%) (63%) (16%) (250%) (33%)
QoQ (pp)
Net debt-to-equity ratio (%) 164 171 167 172 10 8 (5) 6
Source: Company
AC: monthly operating data, YTD 2013 Big-three PRC airlines: EPS sensitivity summary for 2013E
Source: Company
Source: Daiwa forecasts Note: CSA = China Southern Airlines, CEA = China Eastern Airlines
YoY % Jan-13 Feb-13 YTDRevenue Passenger Kilometres - RPK (1.5%) 14.8% 6.5%
Domestic (1.6%) 17.5% 8.0%International (1.2%) 5.6% 2.1%Regional (3.4%) 31.3% 12.0%
Revenue Freight Tonne Kilometres - RFTK 17.0% (15.5%) 2.2%Revenue Tonne Kilometres RTK 4.2% 5.7% 5.2%Available Seat Kilometres ASK (0.4%) 7.5% 4.2%Available Freight Tonne Kilometres - AFTK (0.5%) 2.2% 0.8%Available Tonne Kilometres - ATK (0.4%) 5.7% 3.0%Passenger Load Factor (actual %) 78.8% 83.5% 80.8%
Domestic 78.3% 85.4% 81.7%International 79.9% 79.8% 79.7%Regional 77.2% 77.1% 73.8%
Cargo Load Factor (actual %) 55.0% 43.2% 50.3%Overall (ATK) Load Factor (actual %) 68.5% 68.6% 69.2%Passenger Load Factor (YoY pp.) (0.9%) 5.3% 1.7%Cargo Load Factor 8.2% (9.1%) 0.7%Overall (ATK) Load Factor 3.1% 0.0% 1.4%Passenger carried (2.7%) 14.6% 6.0%Cargo and mail carried 31.3% (19.8%) 6.5%
Sensitivity summary (FY2013) AC CSA CEA
Sensitivity to operational changes (%) (FY13)
EPS impact (%) on:
1% RPK grow th 9.3 12.8 12.7
1% RFTK grow th 0.9 1.0 1.5
1% ASK grow th (6.0) (7.7) (6.8)
1% AFTK grow th (1.7) (2.3) (2.8)
1 p.p. increase in passenger-load factor 9.3 13.6 13.5
1 p.p. increase in cargo-load factor 2.79 3.4 3.8
1% increase in passenger yield 10.8 14.5 14.7
1% increase in cargo yield 1.0 1.0 1.6
Sensitivity to local-currency appreciation against USD
EPS impact for 1% appreciation 0.038 0.044 0.036
EPS impact (%) 10.0 12.3 10.4
Sensitivity to fuel-price increases
FY 13 impact on EPS:USD1/bbl increasein international fuel (0.140) (0.018) (0.012)
EPS impact (%) (2.8) (4.3) (2.7)

Industrials / China 753 HK
28 March 2013
19
Key assumptions
Profit and loss (CNYm)
Cash flow (CNYm)
Source: FactSet, Daiwa forecasts
Year to 31 Dec 2008 2009 2010 2011 2012 2013E 2014E 2015EOverall RPK growth (%) (1.8) 9.8 40.0 16.8 5.1 14.3 7.9 8.1Overall RFTK growth (%) (6.8) (2.3) 37.2 0.1 (6.2) 7.0 10.0 10.0Overall ASK growth (%) 2.9 7.4 33.9 14.8 6.5 14.3 7.9 8.4Overall AFTK growth (%) (7.5) 2.4 20.7 4.1 (4.1) 5.0 9.0 10.0Overall PLF (%) 74.9 76.5 80.0 81.5 80.4 80.4 80.4 80.1Overall CLF (%) 56.8 54.2 61.6 59.3 58.0 59.2 59.7 59.7Overall passenger yield growth (%) 1.8 (10.3) 14.0 4.9 (1.0) 2.1 2.0 1.8Cargo Yield growth (%) 5.1 (23.1) 21.0 (5.4) (3.3) 3.0 2.0 2.0Int'l jet-fuel price (USD/bbl) 122.1 70.1 90.1 126.0 126.9 126.0 126.0 126.0
Year to 31 Dec 2008 2009 2010 2011 2012 2013E 2014E 2015EPassenger revenue 43,352 42,695 68,138 83,510 86,899 101,399 111,529 122,700Cargo revenue 7,185 5,396 10,072 9,833 8,421 9,281 10,413 11,683Other Revenue 2,342 2,435 4,119 4,813 5,456 5,759 6,063 6,404Total Revenue 52,879 50,527 82,329 98,157 100,775 116,439 128,005 140,787Other income (3,692) (4,101) (6,241) (7,742) (6,566) (8,026) (9,356) (10,987)COGS (44,758) (37,243) (56,291) (72,078) (75,805) (85,892) (94,198) (103,706)SG&A 0 0 0 0 0 0 0 0Other op.expenses (6,365) (7,051) (8,569) (9,561) (10,376) (12,308) (13,443) (14,579)Operating profit (1,937) 2,131 11,227 8,775 8,028 10,213 11,008 11,515Net-interest inc./(exp.) (1,696) (1,174) (1,389) (1,354) (2,163) (2,105) (1,852) (1,793)Assoc/forex/extraord./others (7,344) 4,109 4,995 1,933 710 2,286 2,430 3,045Pre-tax profit (10,978) 5,066 14,834 9,355 6,576 10,395 11,585 12,766Tax 1,611 (263) (2,498) (2,292) (1,648) (2,534) (2,736) (2,943)Min. int./pref. div./others 111 51 (331) 20 (291) (465) (523) (581)Net profit (reported) (9,256) 4,854 12,005 7,082 4,637 7,396 8,326 9,243Net profit (adjusted) (4,827) 2,245 10,790 6,321 4,409 6,358 7,504 8,266EPS (reported)(CNY) (0.780) 0.410 1.031 0.582 0.382 0.605 0.681 0.756EPS (adjusted)(CNY) (0.407) 0.190 0.927 0.520 0.363 0.520 0.613 0.676EPS (adjusted fully-diluted)(CNY) (0.407) 0.190 0.927 0.520 0.363 0.520 0.613 0.676DPS (CNY) 0.000 0.000 0.118 0.118 0.044 0.060 0.068 0.076EBIT (1,937) 2,131 11,227 8,775 8,028 10,213 11,008 11,515EBITDA 7,276 11,979 23,997 22,937 22,631 27,247 29,490 31,496
Year to 31 Dec 2008 2009 2010 2011 2012 2013E 2014E 2015EProfit before tax (10,978) 5,066 14,834 9,355 6,576 10,395 11,585 12,766Depreciation and amortisation 6,365 7,051 8,569 9,561 10,831 12,308 13,443 14,579Tax paid (650) 28 (503) (3,466) (1,648) (2,534) (2,736) (2,943)Change in working capital 3,302 (644) 678 6,798 (4,454) 2,797 251 296Other operational CF items 6,954 (6,037) (5,213) (2,577) (1,845) (2,434) (2,652) (3,369)Cash flow from operations 4,994 5,465 18,366 19,670 9,460 20,532 19,891 21,329Capex (7,552) (7,916) (17,246) (22,750) (15,300) (15,300) (15,300) (15,300)Net (acquisitions)/disposals 159 (165) 1,928 3,914 4,137 0 0 0Other investing CF items 191 (4,585) 1,260 (2,833) (366) 254 330 433Cash flow from investing (7,202) (12,666) (14,058) (21,669) (11,529) (15,046) (14,970) (14,867)Change in debt 3,866 6,813 1,042 92 2,175 (1,167) 2,010 2,010Net share issues/(repurchases) 0 0 6,421 0 788 1,051 0 0Dividends paid (838) 0 0 (1,524) (1,521) (777) (740) (833)Other financing CF items (157) 136 0 0 234 0 0 0Cash flow from financing 2,870 6,948 7,463 (1,432) 1,676 (892) 1,270 1,177Forex effect/others (190) (20) (71) (161) (61) (61) (61) (61)Change in cash 472 (273) 11,700 (3,593) (454) 4,533 6,130 7,579Free cash flow (2,558) (2,451) 1,120 (3,080) (5,840) 5,232 4,591 6,029
Financial summary
Industrials / China 753 HK
28 March 2013
20
Balance sheet (CNYm)
Key ratios (%)
Source: FactSet, Daiwa forecasts
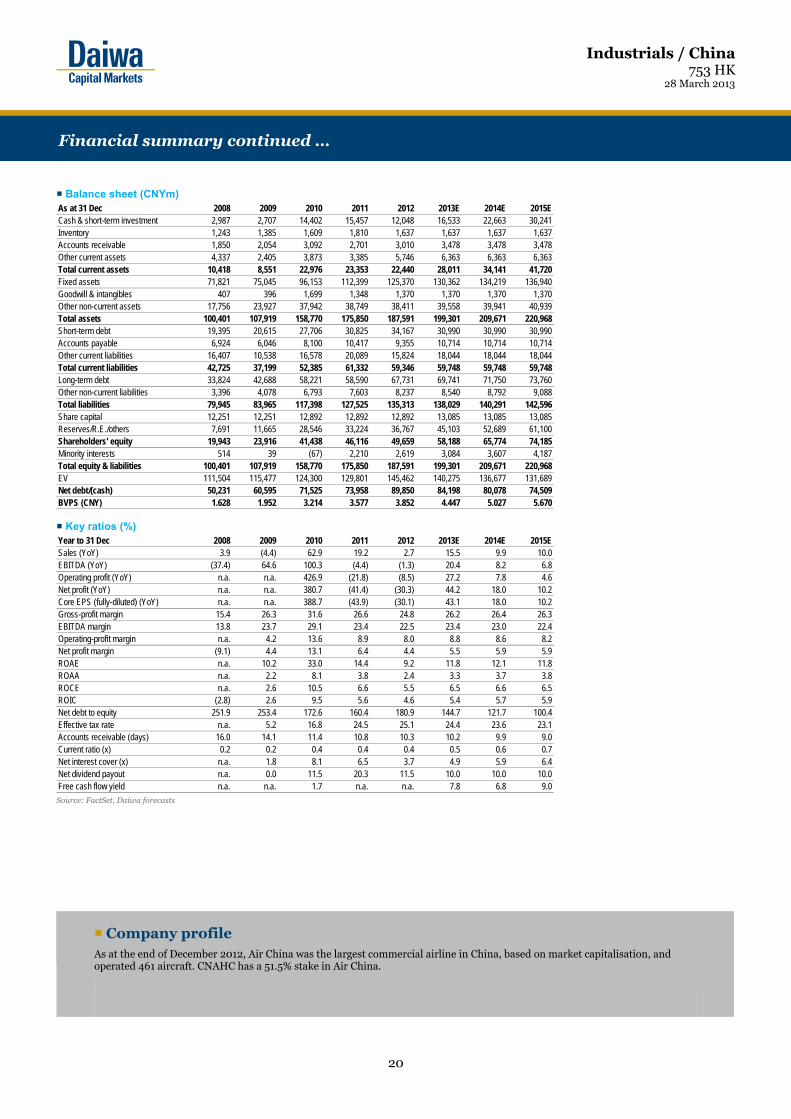
Company profile
As at the end of December 2012, Air China was the largest commercial airline in China, based on market capitalisation, and operated 461 aircraft. CNAHC has a 51.5% stake in Air China.
As at 31 Dec 2008 2009 2010 2011 2012 2013E 2014E 2015ECash & short-term investment 2,987 2,707 14,402 15,457 12,048 16,533 22,663 30,241Inventory 1,243 1,385 1,609 1,810 1,637 1,637 1,637 1,637Accounts receivable 1,850 2,054 3,092 2,701 3,010 3,478 3,478 3,478Other current assets 4,337 2,405 3,873 3,385 5,746 6,363 6,363 6,363Total current assets 10,418 8,551 22,976 23,353 22,440 28,011 34,141 41,720Fixed assets 71,821 75,045 96,153 112,399 125,370 130,362 134,219 136,940Goodwill & intangibles 407 396 1,699 1,348 1,370 1,370 1,370 1,370Other non-current assets 17,756 23,927 37,942 38,749 38,411 39,558 39,941 40,939Total assets 100,401 107,919 158,770 175,850 187,591 199,301 209,671 220,968Short-term debt 19,395 20,615 27,706 30,825 34,167 30,990 30,990 30,990Accounts payable 6,924 6,046 8,100 10,417 9,355 10,714 10,714 10,714Other current liabilities 16,407 10,538 16,578 20,089 15,824 18,044 18,044 18,044Total current liabilities 42,725 37,199 52,385 61,332 59,346 59,748 59,748 59,748Long-term debt 33,824 42,688 58,221 58,590 67,731 69,741 71,750 73,760Other non-current liabilities 3,396 4,078 6,793 7,603 8,237 8,540 8,792 9,088Total liabilities 79,945 83,965 117,398 127,525 135,313 138,029 140,291 142,596Share capital 12,251 12,251 12,892 12,892 12,892 13,085 13,085 13,085Reserves/R.E./others 7,691 11,665 28,546 33,224 36,767 45,103 52,689 61,100Shareholders' equity 19,943 23,916 41,438 46,116 49,659 58,188 65,774 74,185Minority interests 514 39 (67) 2,210 2,619 3,084 3,607 4,187Total equity & liabilities 100,401 107,919 158,770 175,850 187,591 199,301 209,671 220,968EV 111,504 115,477 124,300 129,801 145,462 140,275 136,677 131,689Net debt/(cash) 50,231 60,595 71,525 73,958 89,850 84,198 80,078 74,509BVPS (CNY) 1.628 1.952 3.214 3.577 3.852 4.447 5.027 5.670
Year to 31 Dec 2008 2009 2010 2011 2012 2013E 2014E 2015ESales (YoY) 3.9 (4.4) 62.9 19.2 2.7 15.5 9.9 10.0EBITDA (YoY) (37.4) 64.6 100.3 (4.4) (1.3) 20.4 8.2 6.8Operating profit (YoY) n.a. n.a. 426.9 (21.8) (8.5) 27.2 7.8 4.6Net profit (YoY) n.a. n.a. 380.7 (41.4) (30.3) 44.2 18.0 10.2Core EPS (fully-diluted) (YoY) n.a. n.a. 388.7 (43.9) (30.1) 43.1 18.0 10.2Gross-profit margin 15.4 26.3 31.6 26.6 24.8 26.2 26.4 26.3EBITDA margin 13.8 23.7 29.1 23.4 22.5 23.4 23.0 22.4Operating-profit margin n.a. 4.2 13.6 8.9 8.0 8.8 8.6 8.2Net profit margin (9.1) 4.4 13.1 6.4 4.4 5.5 5.9 5.9ROAE n.a. 10.2 33.0 14.4 9.2 11.8 12.1 11.8ROAA n.a. 2.2 8.1 3.8 2.4 3.3 3.7 3.8ROCE n.a. 2.6 10.5 6.6 5.5 6.5 6.6 6.5ROIC (2.8) 2.6 9.5 5.6 4.6 5.4 5.7 5.9Net debt to equity 251.9 253.4 172.6 160.4 180.9 144.7 121.7 100.4Effective tax rate n.a. 5.2 16.8 24.5 25.1 24.4 23.6 23.1Accounts receivable (days) 16.0 14.1 11.4 10.8 10.3 10.2 9.9 9.0Current ratio (x) 0.2 0.2 0.4 0.4 0.4 0.5 0.6 0.7Net interest cover (x) n.a. 1.8 8.1 6.5 3.7 4.9 5.9 6.4Net dividend payout n.a. 0.0 11.5 20.3 11.5 10.0 10.0 10.0Free cash flow yield n.a. n.a. 1.7 n.a. n.a. 7.8 6.8 9.0
Financial summary continued …

- 21 -
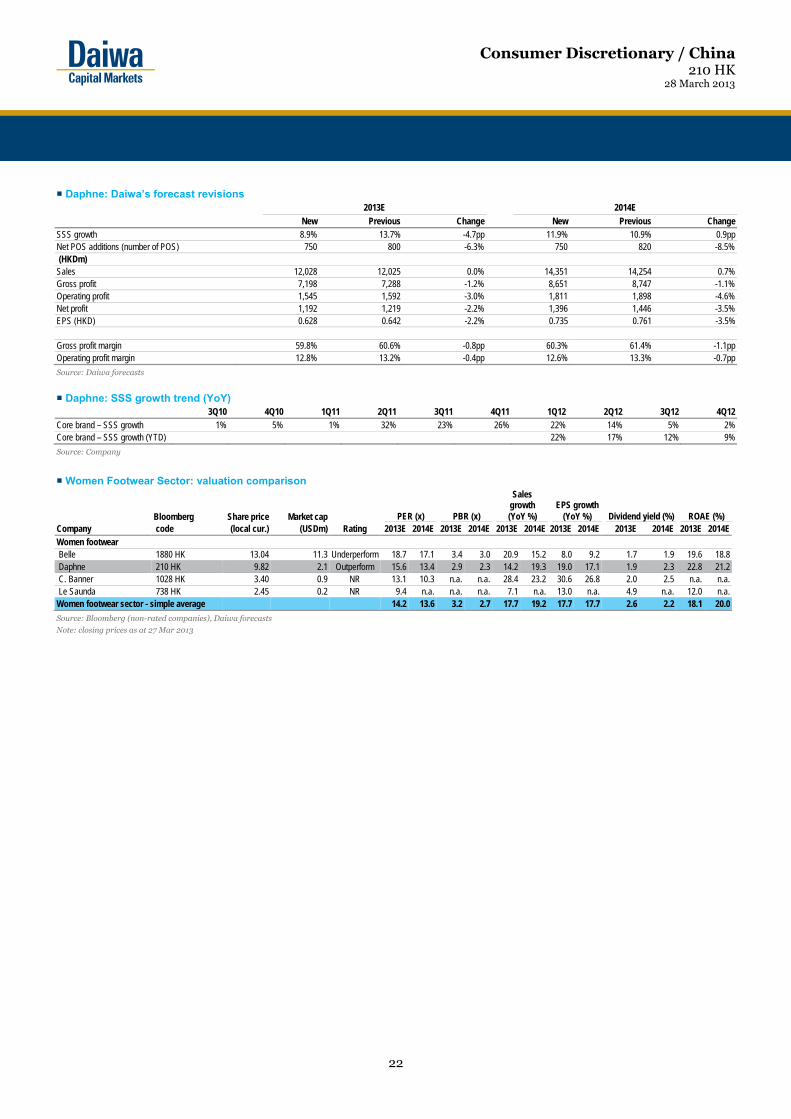
■ What's new We hosted investor meetings with Daphne in Singapore on 27 March 2013, during which we learned that the company plans to focus on its core brands this year, and implement more cost-cutting measures to boost its bottom line. ■ What's the impact SSS growth. We expect Daphne’s 1Q13 SSS growth to be flat YoY. In terms of monthly trends, we expect the combined January-February SSS growth to decline by a double-digit percentage, while strong double-digit growth for March is likely to have been driven by both sales volume and an ASP recovery. We still think the 1H13 SSS growth will be soft due to China’s slower-than-expected macro recovery, and a very high base for the same period last year (1H12 SSS growth: 17%). Store expansion strategy. Daphne has more than 7,000 points of sale (POS) and expects to add 700 core brands a year from 2013, with an annual increase of 50 POS for its mid- to high-end brands over 2013-
15, based on our estimates (a far cry from last year’s target POS growth of 200 a year). In terms of expanding its core brands, Daphne continues to increase its store count, predominantly in China’s third/fourth-tier cities. However, we do not rule out possible expansion in areas that are on the outskirts of the first/second-tier cities. It is worth noting that of the 767 new store additions in 2012, 46% of them were in the rural areas of these first/second-tier cities. We have found that purchasing habits and demand in these rural regions are similar to those in the third/fourth-tier cities. While the company’s promotional patterns and products vary across China, we do not think lower ASPs necessarily translate into smaller margins. Moreover, management said that the ramp-up of new stores in the lower-tier cities has been good, and that in their first year of operation most of them were running at 70-75% of the efficiency of a well-established (mature) store. Cost-cutting measures. Management’s 2013 cost-cutting strategy includes: 1) staff-related costs and productivity enhancement, 2) carefully selecting locations for new POS and closing poorly performing stores, and 3) the opening of smaller stores and maximising floor space, which should improve rent/sales ratios. ■ What we recommend We are cutting our 2013 earnings forecast by 2.2% as we are lowering our SSS growth forecast to 8.9% YoY (13.7% YoY previously) to reflect potentially weak 1H13 SSS. As a result of these changes, we are
cutting our six-month target price to HKD11.10 (from HKD11.40), based on an unchanged target PER of 17.7x, which is 1SD above Daphne’s average forward PER for 2010-12. We maintain our Outperform (2) rating. Risks to our call would include lower-than-expected SSS growth in 2013. ■ How we differ Our 2013 net-profit forecast is 5.6% higher than that of the Bloomberg consensus, probably because we are more positive on the company’s operating leverage.
28 March 2013
Operating leverage intact
• SSS growth likely to have rebounded strongly in March
• Management is making tangible cost cuts this year
• Maintain Outperform rating
Source: Daiwa forecasts
Source: FactSet, Daiwa forecasts
Consumer Discretionary / China
Daphne International210 HK
BuyOutperform (unchanged)
HoldUnderperformSell
1
2
3
4
5Target (HKD): 11.40 11.10 Upside: 13.0% 27 Mar price (HKD): 9.82
Bing Zhou(852) 2773 [email protected]
Cris Xu(852) 2773 [email protected]
Forecast revisions (%)Year to 31 Dec 13E 14E 15ERevenue change - 0.7 n.a.Net profit change (2.2) (3.5) n.a.Core EPS (FD) change (2.2) (3.5) n.a.
65
76
88
99
110
6
8
9
11
12
Mar-12 Jun-12 Sep-12 Dec-12 Mar-13
Share price performance
Daphne Int (LHS) Relative to HSI (RHS)
(HKD) (%)
12-month range 6.67-11.78Market cap (USDbn) 2.083m avg daily turnover (USDm) 5.87Shares outstanding (m) 1,644Major shareholder Chen Family (24.4%)
Financial summary (HKD)Year to 31 Dec 13E 14E 15ERevenue (m) 12,028 14,351 17,130Operating profit (m) 1,545 1,811 2,135Net profit (m) 1,192 1,396 1,648Core EPS (fully-diluted) 0.628 0.735 0.867EPS change (%) 19.0 17.1 18.1Daiwa vs Cons. EPS (%) (2.4) (4.5) (4.4)PER (x) 15.6 13.4 11.3Dividend yield (%) 1.9 2.3 2.7DPS 0.187 0.224 0.269PBR (x) 2.9 2.3 2.1EV/EBITDA (x) 7.4 5.9 4.4ROE (%) 22.8 21.2 20.3
Consumer Discretionary / China 210 HK
28 March 2013
22
Daphne: Daiwa’s forecast revisions 2013E 2014E
New Previous Change New Previous ChangeSSS growth 8.9% 13.7% -4.7pp 11.9% 10.9% 0.9ppNet POS additions (number of POS) 750 800 -6.3% 750 820 -8.5% (HKDm) Sales 12,028 12,025 0.0% 14,351 14,254 0.7%Gross profit 7,198 7,288 -1.2% 8,651 8,747 -1.1%Operating profit 1,545 1,592 -3.0% 1,811 1,898 -4.6%Net profit 1,192 1,219 -2.2% 1,396 1,446 -3.5%EPS (HKD) 0.628 0.642 -2.2% 0.735 0.761 -3.5% Gross profit margin 59.8% 60.6% -0.8pp 60.3% 61.4% -1.1ppOperating profit margin 12.8% 13.2% -0.4pp 12.6% 13.3% -0.7pp
Source: Daiwa forecasts
Daphne: SSS growth trend (YoY)
3Q10 4Q10 1Q11 2Q11 3Q11 4Q11 1Q12 2Q12 3Q12 4Q12
Core brand – SSS growth 1% 5% 1% 32% 23% 26% 22% 14% 5% 2%Core brand – SSS growth (YTD) 22% 17% 12% 9%
Source: Company
Women Footwear Sector: valuation comparison
Bloomberg Share price Market cap PER (x) PBR (x)
Sales growth (YoY %)
EPS growth (YoY %) Dividend yield (%) ROAE (%)
Company code (local cur.) (USDm) Rating 2013E 2014E 2013E 2014E 2013E 2014E 2013E 2014E 2013E 2014E 2013E 2014E Women footwear Belle 1880 HK 13.04 11.3 Underperform 18.7 17.1 3.4 3.0 20.9 15.2 8.0 9.2 1.7 1.9 19.6 18.8 Daphne 210 HK 9.82 2.1 Outperform 15.6 13.4 2.9 2.3 14.2 19.3 19.0 17.1 1.9 2.3 22.8 21.2 C. Banner 1028 HK 3.40 0.9 NR 13.1 10.3 n.a. n.a. 28.4 23.2 30.6 26.8 2.0 2.5 n.a. n.a. Le Saunda 738 HK 2.45 0.2 NR 9.4 n.a. n.a. n.a. 7.1 n.a. 13.0 n.a. 4.9 n.a. 12.0 n.a.Women footwear sector - simple average 14.2 13.6 3.2 2.7 17.7 19.2 17.7 17.7 2.6 2.2 18.1 20.0
Source: Bloomberg (non-rated companies), Daiwa forecasts
Note: closing prices as at 27 Mar 2013

Consumer Discretionary / China 210 HK
28 March 2013
23
Key assumptions
Profit and loss (HKDm)
Cash flow (HKDm)
Source: FactSet, Daiwa forecasts
Year to 31 Dec 2008 2009 2010 2011 2012 2013E 2014E 2015Enumber of stores 3,642 4,225 5,199 6,165 6,881 7,631 8,381 9,131Core-brand same store sales growth n.a. 5.0 4.6 21.0 9.0 9.0 12.5 12.5Gross margin (%) 52.7 55.0 57.4 61.1 59.2 59.8 60.3 60.7EBIT margin (%) 12.8 14.7 14.1 15.2 12.6 12.8 12.6 12.5
Year to 31 Dec 2008 2009 2010 2011 2012 2013E 2014E 2015ECore brands 4,265 5,018 5,697 7,671 9,592 11,135 13,429 16,096Other brands 404 279 430 530 691 683 744 882Other Revenue 620 536 497 376 246 210 179 151Total Revenue 5,289 5,832 6,624 8,577 10,529 12,028 14,351 17,130Other income (8) 21 63 (16) 47 39 41 42COGS (2,502) (2,625) (2,823) (3,333) (4,300) (4,830) (5,701) (6,727)SG&A (2,103) (2,371) (2,930) (3,922) (4,954) (5,692) (6,881) (8,310)Other op.expenses 0 0 0 0 0 0 0 0Operating profit 676 856 935 1,305 1,322 1,545 1,811 2,135Net-interest inc./(exp.) (11) (20) (8) 16 (6) 17 60 108Assoc/forex/extraord./others 1 1 1 0 (8) (2) 0 2Pre-tax profit 666 837 927 1,322 1,307 1,560 1,871 2,245Tax (169) (233) (239) (377) (333) (397) (476) (571)Min. int./pref. div./others (4) (7) (16) (12) (19) (18) (23) (26)Net profit (reported) 493 597 673 933 956 1,146 1,372 1,648Net profit (adjusted) 493 823 792 979 1,002 1,192 1,396 1,648EPS (reported)(HKD) 0.301 0.365 0.411 0.570 0.581 0.697 0.775 0.898EPS (adjusted)(HKD) 0.301 0.502 0.483 0.597 0.610 0.725 0.788 0.898EPS (adjusted fully-diluted)(HKD) 0.301 0.474 0.424 0.522 0.528 0.628 0.735 0.867DPS (HKD) 0.055 0.075 0.105 0.149 0.156 0.187 0.224 0.269EBIT 676 856 935 1,305 1,322 1,545 1,811 2,135EBITDA 794 992 1,077 1,491 1,579 1,934 2,293 2,721
Year to 31 Dec 2008 2009 2010 2011 2012 2013E 2014E 2015EProfit before tax 666 837 927 1,322 1,307 1,560 1,871 2,245Depreciation and amortisation 117 135 142 186 289 389 482 586Tax paid (131) (201) (264) (367) (333) (397) (476) (571)Change in working capital (517) 531 18 (1,003) (688) 492 (1,079) 385Other operational CF items 37 47 68 104 23 (13) (60) (112)Cash flow from operations 173 1,349 892 242 598 2,031 738 2,533Capex (234) (143) (277) (392) (500) (500) (463) (523)Net (acquisitions)/disposals 35 9 (33) (30) 0 0 0 0Other investing CF items 3 (71) 80 99 43 64 84 108Cash flow from investing (196) (205) (229) (323) (457) (436) (379) (414)Change in debt 74 (256) (34) (4) 0 0 0 0Net share issues/(repurchases) 0 0 0 19 0 0 400 0Dividends paid (82) (98) (180) (231) (297) (356) (426) (511)Other financing CF items (16) 589 (22) (26) (16) (47) (24) (0)Cash flow from financing (25) 235 (236) (242) (312) (402) (49) (512)Forex effect/others 0 0 0 0 0 0 0 0Change in cash (48) 1,379 426 (323) (171) 1,193 309 1,607Free cash flow (62) 1,207 615 (149) 98 1,531 275 2,010
Financial summary

Consumer Discretionary / China 210 HK
28 March 2013
24
Balance sheet (HKDm)
Key ratios (%)
Source: FactSet, Daiwa forecasts
Company profile
Daphne is an owner and retailer of women's footwear brands in the Greater China region. Its core brands are Daphne and Shoebox. Other brands include AEE, Ameda, dulala, ALDO, and Aerosoles.
As at 31 Dec 2008 2009 2010 2011 2012 2013E 2014E 2015ECash & short-term investment 148 1,548 2,024 1,796 1,495 2,685 2,961 4,570Inventory 1,355 889 1,084 2,059 2,369 2,183 3,190 3,151Accounts receivable 163 181 210 274 347 333 478 490Other current assets 481 521 607 926 1,278 1,278 1,278 1,278Total current assets 2,147 3,139 3,926 5,055 5,489 6,480 7,907 9,489Fixed assets 575 561 711 900 1,120 1,240 1,230 1,176Goodwill & intangibles 27 130 130 115 117 110 104 0Other non-current assets 214 111 283 432 469 464 462 559Total assets 2,962 3,941 5,049 6,501 7,194 8,294 9,702 11,223Short-term debt 271 15 11 7 7 7 7 7Accounts payable 397 385 578 819 866 1,159 1,231 1,589Other current liabilities 387 763 571 814 629 629 629 629Total current liabilities 1,054 1,163 1,160 1,640 1,502 1,794 1,867 2,225Long-term debt 0 516 557 606 640 640 0 0Other non-current liabilities 17 21 24 24 16 16 16 16Total liabilities 1,071 1,699 1,741 2,270 2,158 2,450 1,883 2,241Share capital 164 164 164 164 165 165 443 443Reserves/R.E./others 1,691 2,039 2,961 3,872 4,661 5,451 7,124 8,261Shareholders' equity 1,855 2,203 3,124 4,036 4,825 5,615 7,568 8,704Minority interests 37 39 183 196 211 229 252 278Total equity & liabilities 2,962 3,941 5,049 6,501 7,194 8,294 9,702 11,223EV 16,299 15,161 14,866 15,145 15,497 14,324 13,430 11,858Net debt/(cash) 123 (1,018) (1,456) (1,183) (848) (2,039) (2,954) (4,563)BVPS (HKD) 1.132 1.345 1.908 2.464 2.935 3.416 4.271 4.742
Year to 31 Dec 2008 2009 2010 2011 2012 2013E 2014E 2015ESales (YoY) 37.3 10.3 13.6 29.5 22.8 14.2 19.3 19.4EBITDA (YoY) 25.3 24.9 8.6 38.5 5.9 22.5 18.6 18.7Operating profit (YoY) 26.0 26.6 9.1 39.7 1.3 16.9 17.2 17.9Net profit (YoY) 28.2 66.9 (3.8) 23.6 2.4 19.0 17.1 18.1Core EPS (fully-diluted) (YoY) 28.2 57.3 (10.4) 23.1 1.0 19.0 17.1 18.1Gross-profit margin 52.7 55.0 57.4 61.1 59.2 59.8 60.3 60.7EBITDA margin 15.0 17.0 16.3 17.4 15.0 16.1 16.0 15.9Operating-profit margin 12.8 14.7 14.1 15.2 12.6 12.8 12.6 12.5Net profit margin 9.3 14.1 12.0 11.4 9.5 9.9 9.7 9.6ROAE 30.5 40.5 29.7 27.3 22.6 22.8 21.2 20.3ROAA 18.5 23.8 17.6 16.9 14.6 15.4 15.5 15.7ROCE 35.9 34.7 28.1 29.9 25.1 25.4 25.3 25.4ROIC 29.4 38.2 45.1 38.1 27.2 28.8 31.1 34.3Net debt to equity 6.6 net cash net cash net cash net cash net cash net cash net cashEffective tax rate 25.4 27.8 25.7 28.5 25.4 25.4 25.4 25.4Accounts receivable (days) 11.0 10.8 10.8 10.3 10.8 10.3 10.3 10.3Current ratio (x) 2.0 2.7 3.4 3.1 3.7 3.6 4.2 4.3Net interest cover (x) 63.8 42.6 122.2 n.a. 206.9 n.a. n.a. n.a.Net dividend payout 18.3 20.7 25.6 26.1 26.9 26.9 29.0 30.0Free cash flow yield n.a. 7.5 3.8 n.a. 0.6 9.5 1.7 12.5
Financial summary continued …
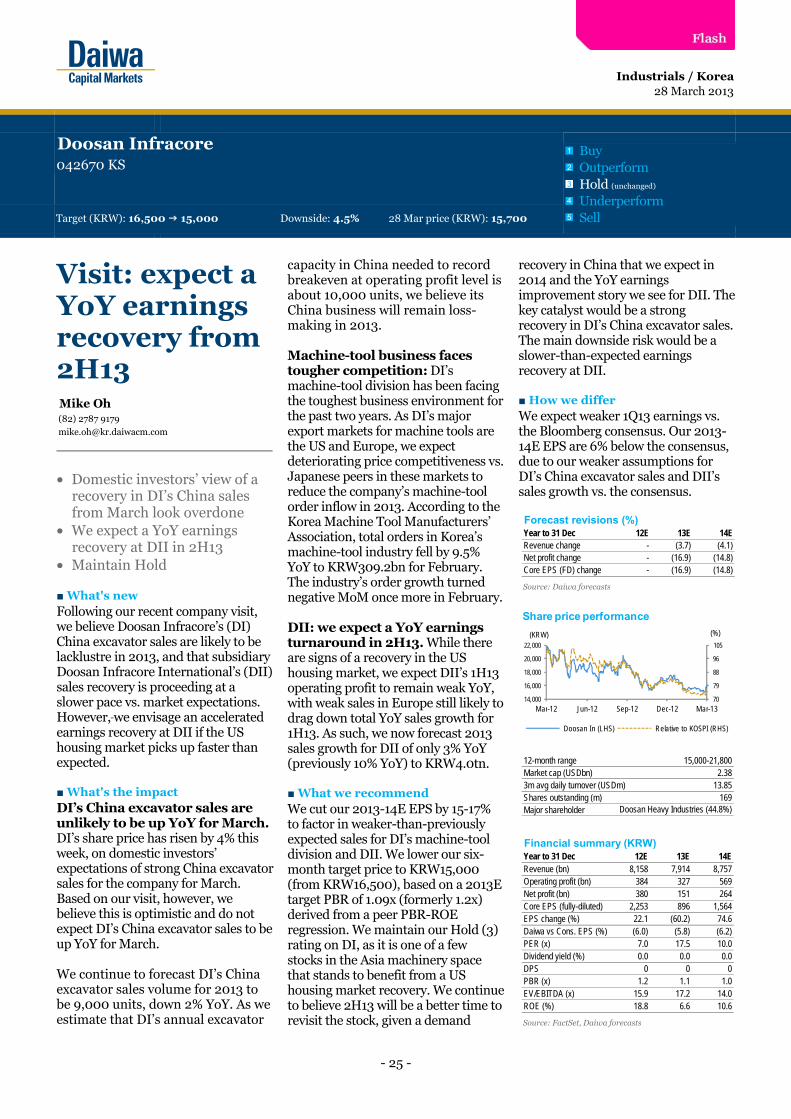
- 25 -
■ What's new Following our recent company visit, we believe Doosan Infracore’s (DI) China excavator sales are likely to be lacklustre in 2013, and that subsidiary Doosan Infracore International’s (DII) sales recovery is proceeding at a slower pace vs. market expectations. However, we envisage an accelerated earnings recovery at DII if the US housing market picks up faster than expected. ■ What's the impact DI’s China excavator sales are unlikely to be up YoY for March. DI’s share price has risen by 4% this week, on domestic investors’ expectations of strong China excavator sales for the company for March. Based on our visit, however, we believe this is optimistic and do not expect DI’s China excavator sales to be up YoY for March. We continue to forecast DI’s China excavator sales volume for 2013 to be 9,000 units, down 2% YoY. As we estimate that DI’s annual excavator
capacity in China needed to record breakeven at operating profit level is about 10,000 units, we believe its China business will remain loss-making in 2013. Machine-tool business faces tougher competition: DI’s machine-tool division has been facing the toughest business environment for the past two years. As DI’s major export markets for machine tools are the US and Europe, we expect deteriorating price competitiveness vs. Japanese peers in these markets to reduce the company’s machine-tool order inflow in 2013. According to the Korea Machine Tool Manufacturers’ Association, total orders in Korea’s machine-tool industry fell by 9.5% YoY to KRW309.2bn for February. The industry’s order growth turned negative MoM once more in February. DII: we expect a YoY earnings turnaround in 2H13. While there are signs of a recovery in the US housing market, we expect DII’s 1H13 operating profit to remain weak YoY, with weak sales in Europe still likely to drag down total YoY sales growth for 1H13. As such, we now forecast 2013 sales growth for DII of only 3% YoY (previously 10% YoY) to KRW4.0tn. ■ What we recommend We cut our 2013-14E EPS by 15-17% to factor in weaker-than-previously expected sales for DI’s machine-tool division and DII. We lower our six-month target price to KRW15,000 (from KRW16,500), based on a 2013E target PBR of 1.09x (formerly 1.2x) derived from a peer PBR-ROE regression. We maintain our Hold (3) rating on DI, as it is one of a few stocks in the Asia machinery space that stands to benefit from a US housing market recovery. We continue to believe 2H13 will be a better time to revisit the stock, given a demand
recovery in China that we expect in 2014 and the YoY earnings improvement story we see for DII. The key catalyst would be a strong recovery in DI’s China excavator sales. The main downside risk would be a slower-than-expected earnings recovery at DII. ■ How we differ We expect weaker 1Q13 earnings vs. the Bloomberg consensus. Our 2013-14E EPS are 6% below the consensus, due to our weaker assumptions for DI’s China excavator sales and DII’s sales growth vs. the consensus.
28 March 2013
Visit: expect a YoY earnings recovery from 2H13
• Domestic investors’ view of a recovery in DI’s China sales from March look overdone
• We expect a YoY earnings recovery at DII in 2H13
• Maintain Hold
Source: Daiwa forecasts
Source: FactSet, Daiwa forecasts
Industrials / Korea
Doosan Infracore042670 KS
BuyOutperformHold (unchanged)
UnderperformSell
1
2
3
4
5Target (KRW): 16,500 15,000 Downside: 4.5% 28 Mar price (KRW): 15,700
Mike Oh(82) 2787 9179
Forecast revisions (%)Year to 31 Dec 12E 13E 14ERevenue change - (3.7) (4.1)Net profit change - (16.9) (14.8)Core EPS (FD) change - (16.9) (14.8)
70
79
88
96
105
14,000
16,000
18,000
20,000
22,000
Mar-12 Jun-12 Sep-12 Dec-12 Mar-13
Share price performance
Doosan In (LHS) Relative to KOSPI (RHS)
(KRW) (%)
12-month range 15,000-21,800Market cap (USDbn) 2.383m avg daily turnover (USDm) 13.85Shares outstanding (m) 169Major shareholder Doosan Heavy Industries (44.8%)
Financial summary (KRW)Year to 31 Dec 12E 13E 14ERevenue (bn) 8,158 7,914 8,757Operating profit (bn) 384 327 569Net profit (bn) 380 151 264Core EPS (fully-diluted) 2,253 896 1,564EPS change (%) 22.1 (60.2) 74.6Daiwa vs Cons. EPS (%) (6.0) (5.8) (6.2)PER (x) 7.0 17.5 10.0Dividend yield (%) 0.0 0.0 0.0DPS 0 0 0PBR (x) 1.2 1.1 1.0EV/EBITDA (x) 15.9 17.2 14.0ROE (%) 18.8 6.6 10.6
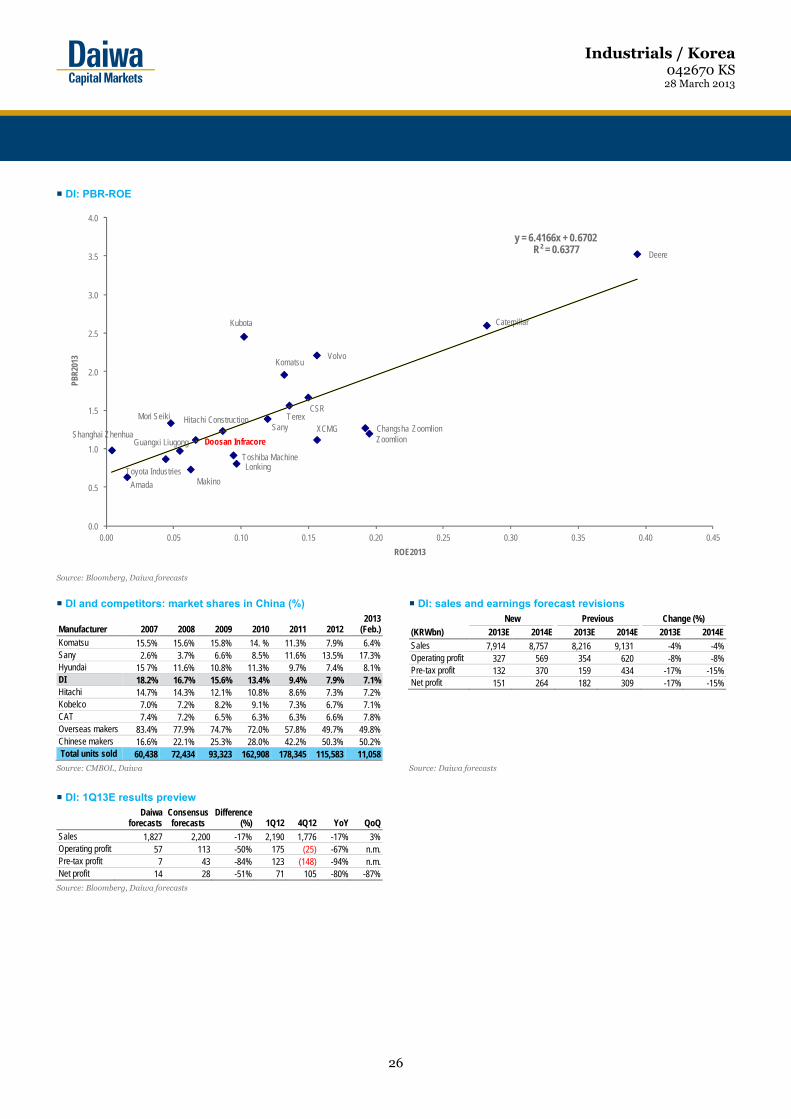
Industrials / Korea 042670 KS 28 March 2013
26
DI: PBR-ROE
Source: Bloomberg, Daiwa forecasts
DI and competitors: market shares in China (%) DI: sales and earnings forecast revisions
Manufacturer 2007 2008 2009 2010 2011 20122013
(Feb.)Komatsu 15.5% 15.6% 15.8% 14. % 11.3% 7.9% 6.4%Sany 2.6% 3.7% 6.6% 8.5% 11.6% 13.5% 17.3%Hyundai 15 7% 11.6% 10.8% 11.3% 9.7% 7.4% 8.1%DI 18.2% 16.7% 15.6% 13.4% 9.4% 7.9% 7.1%Hitachi 14.7% 14.3% 12.1% 10.8% 8.6% 7.3% 7.2%Kobelco 7.0% 7.2% 8.2% 9.1% 7.3% 6.7% 7.1%CAT 7.4% 7.2% 6.5% 6.3% 6.3% 6.6% 7.8%Overseas makers 83.4% 77.9% 74.7% 72.0% 57.8% 49.7% 49.8%Chinese makers 16.6% 22.1% 25.3% 28.0% 42.2% 50.3% 50.2% Total units sold 60,438 72,434 93,323 162,908 178,345 115,583 11,058
New Previous Change (%)
(KRWbn) 2013E 2014E 2013E 2014E 2013E 2014ESales 7,914 8,757 8,216 9,131 -4% -4%Operating profit 327 569 354 620 -8% -8%Pre-tax profit 132 370 159 434 -17% -15%Net profit 151 264 182 309 -17% -15%
Source: CMBOL, Daiwa Source: Daiwa forecasts
DI: 1Q13E results preview
Daiwa
forecasts Consensus forecasts
Difference (%) 1Q12 4Q12 YoY QoQ
Sales 1,827 2,200 -17% 2,190 1,776 -17% 3%Operating profit 57 113 -50% 175 (25) -67% n.m.Pre-tax profit 7 43 -84% 123 (148) -94% n.m.Net profit 14 28 -51% 71 105 -80% -87%
Source: Bloomberg, Daiwa forecasts
Doosan Infracore
Komatsu
Kubota
Toyota Industries
Hitachi Construction
Amada
Mori Seiki
Toshiba Machine
Makino
Caterpillar
Volvo
Deere
Terex
Zoomlion
Lonking
Sany Changsha ZoomlionXCMG
Guangxi Liugong
CSR
Shanghai Zhenhua
y = 6.4166x + 0.6702R² = 0.6377
0.0
0.5
1.0
1.5
2.0
2.5
3.0
3.5
4.0
0.00 0.05 0.10 0.15 0.20 0.25 0.30 0.35 0.40 0.45
PBR2
013
ROE2013

Industrials / Korea 042670 KS 28 March 2013
27
Key assumptions
Profit and loss (KRWbn)
Cash flow (KRWbn)
Source: FactSet, Daiwa forecasts
Year to 31 Dec 2007 2008 2009 2010 2011 2012E 2013E 2014E
Construction machinery demand growth (YoY%)
5.0 5.0 2.2 7.7 7.1 6.7 6.3 5.9
Sales growth (YoY %) – construction equipment (parent-basis)
19.9 3.4 (6.6) 76.0 (28.5) (37.7) (39.1) 5.0
Sales growth (YoY %) – machine tool 27.0 (0.0) (54.9) 111.2 62.7 3.2 4.3 3.8OP margin (%) – construction 9.4 9.5 16.6 18.9 7.5 3.8 4.0 6.7OP margin (%) – machine tools 13.3 12.4 (16.1) 4.1 12.4 10.4 9.0 10.0
Year to 31 Dec 2007 2008 2009 2010 2011 2012E 2013E 2014EConstruction equipment Revenues 1,372 1,419 1,325 2,332 1,666 1,039 632 664Industrial vehicles Revenues 501 461 314 383 42 0 0 0Other Revenue 1,847 2,084 1,024 1,602 6,754 7,120 7,282 8,093Total Revenue 3,720 3,963 2,663 4,318 8,463 8,158 7,914 8,757Other income 0 0 0 0 297 159 156 169COGS (2,843) (3,011) (1,972) (3,118) (6,616) (6,512) (6,409) (6,980)SG&A (555) (605) (466) (657) (1,168) (1,262) (1,178) (1,208)Other op.expenses 0 0 0 0 (268) (159) (156) (169)Operating profit 321 347 225 543 708 384 327 569Net-interest inc./(exp.) (24) (64) (134) (127) (320) (325) (259) (247)Assoc/forex/extraord./others (11) (368) (352) (330) 1 (63) 65 48Pre-tax profit 286 (85) (261) 86 389 (4) 132 370Tax (106) (37) (50) (48) (78) 403 26 (92)Min. int./pref. div./others 0 0 0 0 0 (20) (8) (14)Net profit (reported) 180 (122) (311) 38 311 380 151 264Net profit (adjusted) 180 (122) (311) 38 311 380 151 264EPS (reported)(KRW) 1,072 (724) (1,850) 227 1,844 2,253 896 1,564EPS (adjusted)(KRW) 1,072 (724) (1,850) 227 1,844 2,253 896 1,564EPS (adjusted fully-diluted)(KRW) 1,072 (724) (1,850) 227 1,844 2,253 896 1,564DPS (KRW) 350 150 0 0 0 0 0 0EBIT 321 (79) 225 312 708 362 327 569EBITDA 379 (20) 287 387 921 522 483 569
Year to 31 Dec 2007 2008 2009 2010 2011 2012E 2013E 2014EProfit before tax 286 (85) (261) 86 389 (4) 132 370Depreciation and amortisation 57 59 62 74 212 159 156 169Tax paid (106) (37) (50) (48) (78) 403 26 (92)Change in working capital 5 (156) (316) 159 (567) (349) (159) (44)Other operational CF items (11) 423 (57) 533 161 79 79 74Cash flow from operations 232 204 (622) 804 117 289 234 476Capex (66) (173) (127) (164) (546) (467) (265) (271)Net (acquisitions)/disposals (654) (238) (472) (59) (4) (48) (48) (48)Other investing CF items (84) (91) (47) (32) 259 0 0 0Cash flow from investing (805) (501) (646) (255) (290) (515) (313) (319)Change in debt 608 526 1,039 (541) 4,016 (45) 0 (200)Net share issues/(repurchases) (1) 1 202 12 4 0 0 0Dividends paid (59) (59) (25) 0 0 0 0 0Other financing CF items (9) (157) 64 8 (3,691) 0 0 0Cash flow from financing 540 310 1,280 (521) 329 (45) 0 (200)Forex effect/others 0 0 0 0 0 0 0 0Change in cash (33) 13 12 28 156 (271) (79) (43)Free cash flow 165 32 (749) 640 (428) (178) (31) 205
Financial summary
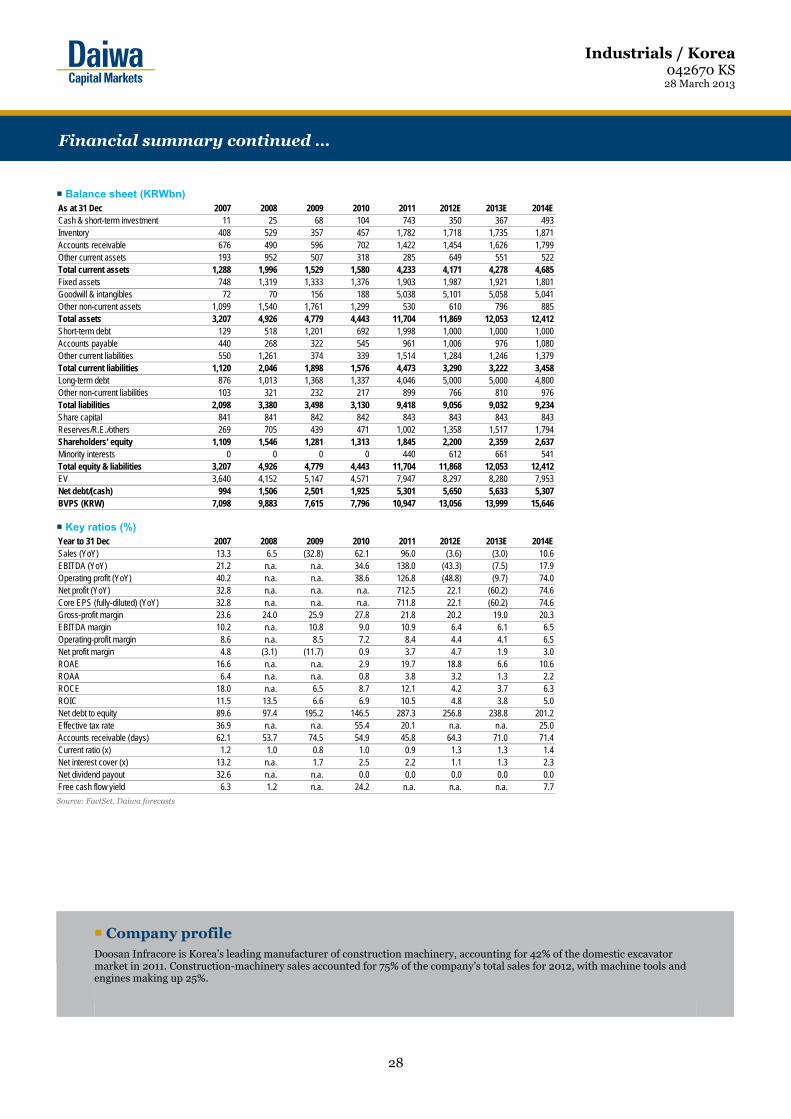
Industrials / Korea 042670 KS 28 March 2013
28
Balance sheet (KRWbn)
Key ratios (%)
Source: FactSet, Daiwa forecasts
Company profile
Doosan Infracore is Korea’s leading manufacturer of construction machinery, accounting for 42% of the domestic excavator market in 2011. Construction-machinery sales accounted for 75% of the company’s total sales for 2012, with machine tools and engines making up 25%.
As at 31 Dec 2007 2008 2009 2010 2011 2012E 2013E 2014ECash & short-term investment 11 25 68 104 743 350 367 493Inventory 408 529 357 457 1,782 1,718 1,735 1,871Accounts receivable 676 490 596 702 1,422 1,454 1,626 1,799Other current assets 193 952 507 318 285 649 551 522Total current assets 1,288 1,996 1,529 1,580 4,233 4,171 4,278 4,685Fixed assets 748 1,319 1,333 1,376 1,903 1,987 1,921 1,801Goodwill & intangibles 72 70 156 188 5,038 5,101 5,058 5,041Other non-current assets 1,099 1,540 1,761 1,299 530 610 796 885Total assets 3,207 4,926 4,779 4,443 11,704 11,869 12,053 12,412Short-term debt 129 518 1,201 692 1,998 1,000 1,000 1,000Accounts payable 440 268 322 545 961 1,006 976 1,080Other current liabilities 550 1,261 374 339 1,514 1,284 1,246 1,379Total current liabilities 1,120 2,046 1,898 1,576 4,473 3,290 3,222 3,458Long-term debt 876 1,013 1,368 1,337 4,046 5,000 5,000 4,800Other non-current liabilities 103 321 232 217 899 766 810 976Total liabilities 2,098 3,380 3,498 3,130 9,418 9,056 9,032 9,234Share capital 841 841 842 842 843 843 843 843Reserves/R.E./others 269 705 439 471 1,002 1,358 1,517 1,794Shareholders' equity 1,109 1,546 1,281 1,313 1,845 2,200 2,359 2,637Minority interests 0 0 0 0 440 612 661 541Total equity & liabilities 3,207 4,926 4,779 4,443 11,704 11,868 12,053 12,412EV 3,640 4,152 5,147 4,571 7,947 8,297 8,280 7,953Net debt/(cash) 994 1,506 2,501 1,925 5,301 5,650 5,633 5,307BVPS (KRW) 7,098 9,883 7,615 7,796 10,947 13,056 13,999 15,646
Year to 31 Dec 2007 2008 2009 2010 2011 2012E 2013E 2014ESales (YoY) 13.3 6.5 (32.8) 62.1 96.0 (3.6) (3.0) 10.6EBITDA (YoY) 21.2 n.a. n.a. 34.6 138.0 (43.3) (7.5) 17.9Operating profit (YoY) 40.2 n.a. n.a. 38.6 126.8 (48.8) (9.7) 74.0Net profit (YoY) 32.8 n.a. n.a. n.a. 712.5 22.1 (60.2) 74.6Core EPS (fully-diluted) (YoY) 32.8 n.a. n.a. n.a. 711.8 22.1 (60.2) 74.6Gross-profit margin 23.6 24.0 25.9 27.8 21.8 20.2 19.0 20.3EBITDA margin 10.2 n.a. 10.8 9.0 10.9 6.4 6.1 6.5Operating-profit margin 8.6 n.a. 8.5 7.2 8.4 4.4 4.1 6.5Net profit margin 4.8 (3.1) (11.7) 0.9 3.7 4.7 1.9 3.0ROAE 16.6 n.a. n.a. 2.9 19.7 18.8 6.6 10.6ROAA 6.4 n.a. n.a. 0.8 3.8 3.2 1.3 2.2ROCE 18.0 n.a. 6.5 8.7 12.1 4.2 3.7 6.3ROIC 11.5 13.5 6.6 6.9 10.5 4.8 3.8 5.0Net debt to equity 89.6 97.4 195.2 146.5 287.3 256.8 238.8 201.2Effective tax rate 36.9 n.a. n.a. 55.4 20.1 n.a. n.a. 25.0Accounts receivable (days) 62.1 53.7 74.5 54.9 45.8 64.3 71.0 71.4Current ratio (x) 1.2 1.0 0.8 1.0 0.9 1.3 1.3 1.4Net interest cover (x) 13.2 n.a. 1.7 2.5 2.2 1.1 1.3 2.3Net dividend payout 32.6 n.a. n.a. 0.0 0.0 0.0 0.0 0.0Free cash flow yield 6.3 1.2 n.a. 24.2 n.a. n.a. n.a. 7.7
Financial summary continued …

- 29 -
■ What's new Loan growth in China over the next few years is likely to be greater than we expected. ■ What's the impact 2012 loan growth stronger than we expected. For 2012, Chailease Holding (Chailease) saw total loan-asset growth of 21% YoY, above our forecast of 19% YoY. Loan asset values in China rose by 30% YoY, in Taiwan by 21% YoY, and Thailand by 26%. For 2013, we forecast total loans to increase by 23% YoY, with China being the driver and seeing a rise of 37% YoY. We forecast loans in Taiwan and Thailand to see solid growth of 15% YoY each. China: driving a long-term rerating. China accounted for 47% of total 2012 revenue (up 3pp YoY) and we forecast it to reach 60% by 2015 backed by the addition of 3-5 branches a year, increasing coverage in coastal cities and expanding further inland.
Decent interest spread. The interest spread for the China operation was maintained at 10-11% for 2012. The company aims to offer more value-added services in China, such as factoring and trade financing, which is likely to increase overall operating efficiency. Taiwan: reviving. Taiwan accounts for 46% of total loan and 49% of total earnings. The company is benefitting from the sharp rise in demand for US Dollars by Taiwan corporate investing overseas. We also expect a rise in local capital demand as the Taiwan Government is actively encouraging more foreign and local companies to invest in Taiwan. Expansion in ASEAN. Looking at the booming ASEAN region, Chailease has expanded its coverage from Thailand and Vietnam to Laos. Thailand (16% of total loans) saw strong 2012 loan growth and we expect the momentum to continue in the years ahead. YTD earnings and asset quality. Backed by the solid core business, Chailease’s earnings for January-February 2013 amounted to TWD846.8m (up 40% YoY). The company announced a cash dividend of TWD2 and a stock dividend of 10%. Its asset quality remained intact, with the 4Q12 delinquency ratio at 3% (flat QoQ) and loan-loss reserves of 3.3% (3Q12: 2.8%). We raise our 2013-14 earnings forecasts by 3-7% as we believe Chailease is well-positioned to benefit from the long-term potential in the China market. The key risk to our view would be a slower economic growth in China than we expect.
■ What we recommend We reiterate our Buy (1) rating, and raise our six-month target price to TWD96 (from TWD83), now based on the average of our 2013-14 BVPS forecasts (2013 BVPS previously) and a new target PBR of 2.8x (from 2.7x), on the back of our higher long-term ROE forecast (to 23% from 22%). ■ How we differ We are more bullish than the market on the company’s earnings growth given the company experience in the sector and the expertise of its staff.
28 March 2013
China the focus
• Strong 2012 loan growth, while asset quality intact
• Company benefiting from booming China and ASEAN
• Raising target price to TWD96
Source: Daiwa forecasts
Source: FactSet, Daiwa forecasts
Financials / Taiwan
Chailease Holding5871 TT
Buy (unchanged)
OutperformHoldUnderperformSell
1
2
3
4
5Target (TWD): 83.00 96.00 Upside: 17.1% 27 Mar price (TWD): 82.00
Rita Hsu(886) 2 8758 [email protected]
Mark Chang, CFA(886) 2 8758 [email protected]
Forecast revisions (%)Year to 31 Dec 13E 14E 15ERevenue change 2.9 2.8 n.a.Net profit change 6.8 3.1 n.a.Core EPS (FD) change 6.8 3.1 n.a.
80
114
148
181
215
30
45
60
75
90
Mar-12 Jun-12 Sep-12 Dec-12 Mar-13
Share price performance
Chailease (LHS)Relative to TWSE Index (RHS)
(TWD) (% )
12-month range 38.80-88.60Market cap (USDbn) 2.493m avg daily turnover (USDm) 19.20Shares outstanding (m) 905Major shareholder Koo Family (30.0%)
Financial summary (TWD)Year to 31 Dec 13E 14E 15ERevenue (m) 27,743 33,303 39,964Operating profit (m) 8,128 9,866 11,832Net profit (m) 5,758 6,927 8,213Core EPS (fully-diluted) 6.360 7.651 9.072EPS change (%) 29.8 20.3 18.6Daiwa vs Cons. EPS (%) 6.0 1.9 n.a.PER (x) 12.9 10.7 9.0Dividend yield (%) 2.7 3.3 3.9DPS 2.2 2.7 3.2PBR (x) 2.6 2.2 1.9EV/EBITDA (x) 16.3 14.2 12.6ROE (%) 21.9 22.4 22.6
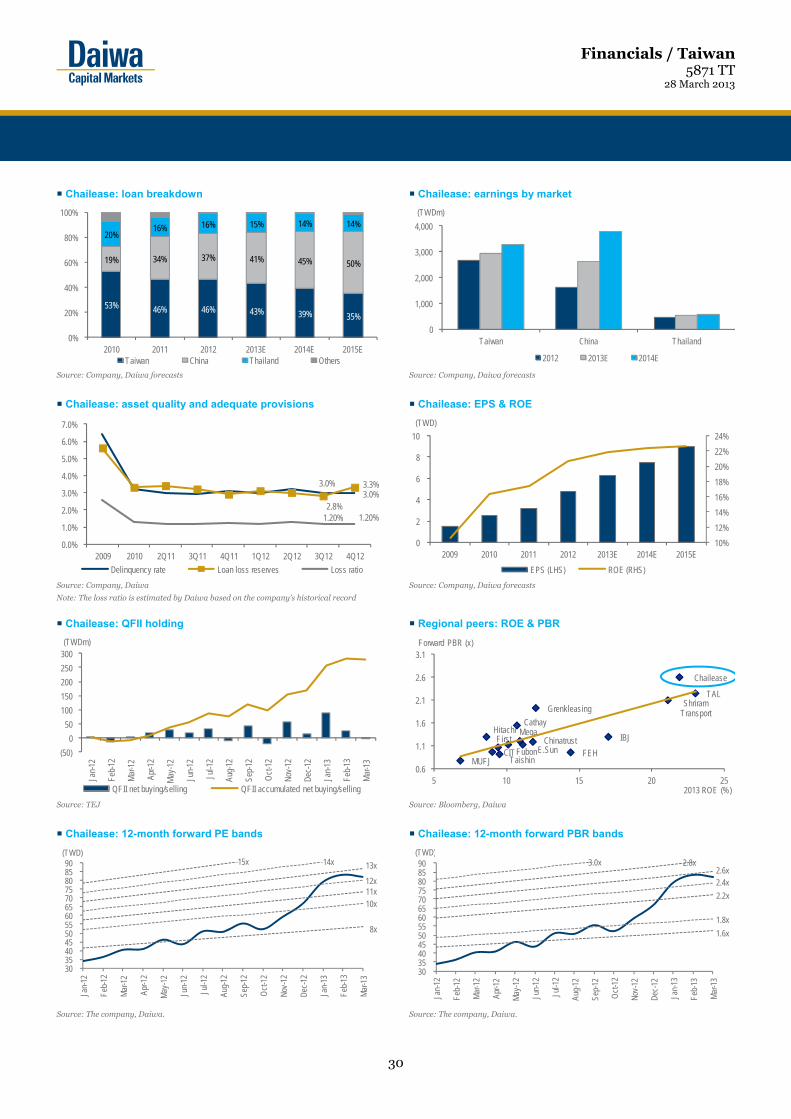
Financials / Taiwan 5871 TT
28 March 2013
30
Chailease: loan breakdown Chailease: earnings by market
Source: Company, Daiwa forecasts Source: Company, Daiwa forecasts
Chailease: asset quality and adequate provisions Chailease: EPS & ROE
Source: Company, Daiwa Source: Company, Daiwa forecasts
Note: The loss ratio is estimated by Daiwa based on the company’s historical record
Chailease: QFII holding Regional peers: ROE & PBR
Source: TEJ Source: Bloomberg, Daiwa
Chailease: 12-month forward PE bands Chailease: 12-month forward PBR bands
Source: The company, Daiwa. Source: The company, Daiwa.
53% 46% 46% 43% 39% 35%
19% 34% 37% 41% 45% 50%
20%16% 16% 15% 14% 14%
0%
20%
40%
60%
80%
100%
2010 2011 2012 2013E 2014E 2015ETaiwan China Thailand Others
0
1,000
2,000
3,000
4,000
Taiwan China Thailand
(TWDm)
2012 2013E 2014E
3.0%3.0%
2.8%
3.3%
1.20% 1.20%
0.0%
1.0%
2.0%
3.0%
4.0%
5.0%
6.0%
7.0%
2009 2010 2Q11 3Q11 4Q11 1Q12 2Q12 3Q12 4Q12
Delinquency rate Loan loss reserves Loss ratio
10%
12%
14%
16%
18%
20%
22%
24%
0
2
4
6
8
10
2009 2010 2011 2012 2013E 2014E 2015E
(TWD)
EPS (LHS) ROE (RHS)
(50)
0
50
100
150
200
250
300
Jan-
12
Feb-
12
Mar
-12
Apr-1
2
May
-12
Jun-
12
Jul-1
2
Aug-
12
Sep-
12
Oct
-12
Nov-
12
Dec-
12
Jan-
13
Feb-
13
Mar
-13
(TWDm)
QFII net buying/selling QFII accumulated net buying/selling
Fubon
Cathay
E.Sun
Mega
Taishin
Chinatrust First
Chailease
FEH
Shriram Transport
IBJ
MUFJ
Hitachi
CIT
TAL
Grenkleasing
0.6
1.1
1.6
2.1
2.6
3.1
5 10 15 20 25
Forward PBR (x)
2013 ROE (%)
30 35 40 45 50 55 60 65 70 75 80 85 90
Jan-
12
Feb-
12
Mar
-12
Apr-1
2
May
-12
Jun-
12
Jul-1
2
Aug-
12
Sep-
12
Oct
-12
Nov-
12
Dec-
12
Jan-
13
Feb-
13
Mar
-13
13x
(TWD)14x
12x
10x11x
8x
15x
30 35 40 45 50 55 60 65 70 75 80 85 90
Jan-
12
Feb-
12
Mar
-12
Apr-1
2
May
-12
Jun-
12
Jul-1
2
Aug-
12
Sep-
12
Oct
-12
Nov-
12
Dec-
12
Jan-
13
Feb-
13
Mar
-13
2.6x
(TWD)2.8x
2.4x
2.2x
1.6x
1.8x
3.0x

Financials / Taiwan 5871 TT
28 March 2013
31
Key assumptions
Profit and loss (TWDm)
Cash flow (TWDm)
Source: FactSet, Daiwa forecasts
Year to 31 Dec 2008 2009 2010 2011 2012 2013E 2014E 2015ETaiwan loan asset growth YoY (%) n.a. n.a. 8.4 31.2 21.0 14.7 9.7 9.6China loan asset growth YoY (%) n.a. n.a. 152.1 164.1 29.6 37.4 35.5 33.4Total loan asset growth YoY (%) n.a. n.a. 10.2 51.2 21.1 23.4 21.2 22.1Credit cost (%) n.a. n.a. 0.7 0.8 1.5 1.5 1.6 1.7Delinquency ratio (%) n.a. n.a. 3.2 3.1 3.1 3.1 3.1 3.1
Provision coverage as % of expectedbad debt
n.a. n.a. 241.7 232.8 253.8 253.2 258.3 270.9
Year to 31 Dec 2008 2009 2010 2011 2012 2013E 2014E 2015ETaiwan n.a. 5,314 5,625 7,371 9,132 9,661 10,545 11,304China n.a. 4,486 5,818 7,362 10,469 14,631 18,758 23,931Other Revenue n.a. 1,377 1,480 2,036 2,484 3,451 4,001 4,729Total Revenue n.a. 11,177 12,924 16,770 22,085 27,743 33,303 39,964Other income n.a. 0 0 0 0 0 0 0COGS n.a. (5,685) (6,571) (8,114) (9,680) (10,690) (12,710) (14,899)SG&A n.a. (5,108) (3,356) (4,785) (7,004) (8,703) (10,514) (13,016)Other op.expenses n.a. (187) (126) (138) (86) (222) (213) (217)Operating profit n.a. 198 2,869 3,733 5,315 8,128 9,866 11,832Net-interest inc./(exp.) n.a. (114) (91) (75) (37) (64) (86) (76)Assoc/forex/extraord./others n.a. (618) 620 180 946 659 713 686Pre-tax profit n.a. (534) 3,399 3,839 6,223 8,723 10,493 12,442Tax n.a. (106) (1,081) (1,202) (1,834) (2,617) (3,148) (3,733)Min. int./pref. div./others n.a. 2,138 (191) (189) (248) (348) (419) (496)Net profit (reported) n.a. 1,498 2,127 2,448 4,141 5,758 6,927 8,213Net profit (adjusted) n.a. 1,498 2,127 2,448 4,141 5,758 6,927 8,213EPS (reported)(TWD) n.a. 1.636 2.650 3.345 4.899 6.360 7.651 9.072EPS (adjusted)(TWD) n.a. 1.636 2.650 3.345 4.899 6.360 7.651 9.072EPS (adjusted fully-diluted)(TWD) n.a. 1.636 2.650 3.345 4.899 6.360 7.651 9.072DPS (TWD) n.a. 0.000 1.190 2.300 2.000 2.226 2.678 3.175EBIT n.a. 198 2,869 3,733 5,315 8,128 9,866 11,832EBITDA n.a. 571 3,122 4,008 5,487 8,571 10,292 12,267
Year to 31 Dec 2008 2009 2010 2011 2012 2013E 2014E 2015EProfit before tax n.a. (534) 3,399 3,839 6,223 8,723 10,493 12,442Depreciation and amortisation n.a. 2,133 2,241 2,198 1,864 4,063 4,210 4,137Tax paid n.a. (106) (1,081) (1,202) (1,834) (2,617) (3,148) (3,733)Change in working capital n.a. 3,904 4,436 7,421 5,795 7,187 7,084 8,456Other operational CF items n.a. 114 91 75 37 64 86 76Cash flow from operations n.a. 5,511 9,086 12,330 12,086 17,420 18,725 21,379Capex n.a. (3,156) (5,811) (1,909) (2,127) (2,000) (3,000) (2,000)Net (acquisitions)/disposals n.a. 1,466 (17,470) (42,284) (33,829) (29,453) (32,986) (44,628)Other investing CF items n.a. 0 (142) (279) (502) 0 0 0Cash flow from investing n.a. (1,689) (23,423) (44,472) (36,458) (31,453) (35,986) (46,628)Change in debt n.a. (7,000) 19,776 32,909 24,230 16,559 18,829 27,773Net share issues/(repurchases) n.a. 0 (3,846) 1,851 5,964 0 0 0Dividends paid n.a. (74) (81) (943) (1,922) (1,811) (2,015) (2,424)Other financing CF items n.a. 2,013 0 0 0 0 0 0Cash flow from financing n.a. (5,060) 15,849 33,816 28,272 14,749 16,814 25,349Forex effect/others n.a. 22 (210) 536 (327) 0 0 0Change in cash n.a. (1,216) 1,302 2,211 3,573 716 (447) 100Free cash flow n.a. 2,356 3,275 10,421 9,959 15,420 15,725 19,379
Financial summary
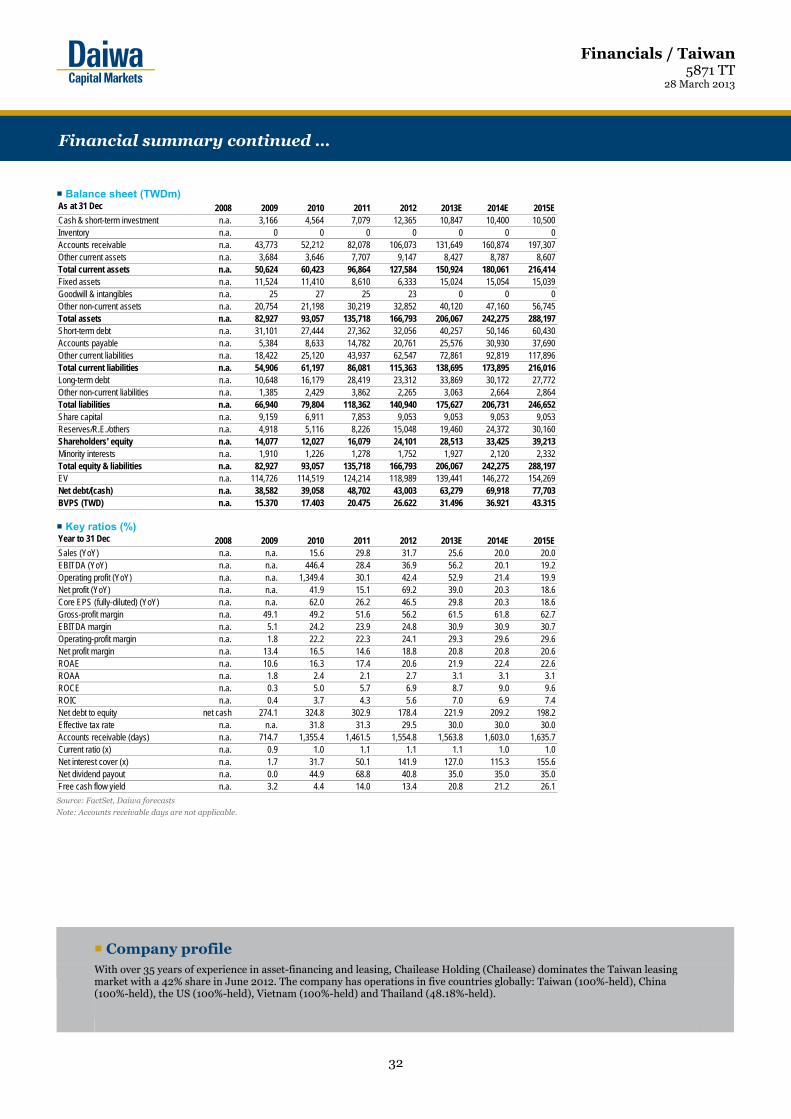
Financials / Taiwan 5871 TT
28 March 2013
32
Balance sheet (TWDm)
Key ratios (%)
Source: FactSet, Daiwa forecasts
Note: Accounts receivable days are not applicable.
Company profile
With over 35 years of experience in asset-financing and leasing, Chailease Holding (Chailease) dominates the Taiwan leasing market with a 42% share in June 2012. The company has operations in five countries globally: Taiwan (100%-held), China (100%-held), the US (100%-held), Vietnam (100%-held) and Thailand (48.18%-held).
As at 31 Dec 2008 2009 2010 2011 2012 2013E 2014E 2015ECash & short-term investment n.a. 3,166 4,564 7,079 12,365 10,847 10,400 10,500Inventory n.a. 0 0 0 0 0 0 0Accounts receivable n.a. 43,773 52,212 82,078 106,073 131,649 160,874 197,307Other current assets n.a. 3,684 3,646 7,707 9,147 8,427 8,787 8,607Total current assets n.a. 50,624 60,423 96,864 127,584 150,924 180,061 216,414Fixed assets n.a. 11,524 11,410 8,610 6,333 15,024 15,054 15,039Goodwill & intangibles n.a. 25 27 25 23 0 0 0Other non-current assets n.a. 20,754 21,198 30,219 32,852 40,120 47,160 56,745Total assets n.a. 82,927 93,057 135,718 166,793 206,067 242,275 288,197Short-term debt n.a. 31,101 27,444 27,362 32,056 40,257 50,146 60,430Accounts payable n.a. 5,384 8,633 14,782 20,761 25,576 30,930 37,690Other current liabilities n.a. 18,422 25,120 43,937 62,547 72,861 92,819 117,896Total current liabilities n.a. 54,906 61,197 86,081 115,363 138,695 173,895 216,016Long-term debt n.a. 10,648 16,179 28,419 23,312 33,869 30,172 27,772Other non-current liabilities n.a. 1,385 2,429 3,862 2,265 3,063 2,664 2,864Total liabilities n.a. 66,940 79,804 118,362 140,940 175,627 206,731 246,652Share capital n.a. 9,159 6,911 7,853 9,053 9,053 9,053 9,053Reserves/R.E./others n.a. 4,918 5,116 8,226 15,048 19,460 24,372 30,160Shareholders' equity n.a. 14,077 12,027 16,079 24,101 28,513 33,425 39,213Minority interests n.a. 1,910 1,226 1,278 1,752 1,927 2,120 2,332Total equity & liabilities n.a. 82,927 93,057 135,718 166,793 206,067 242,275 288,197EV n.a. 114,726 114,519 124,214 118,989 139,441 146,272 154,269Net debt/(cash) n.a. 38,582 39,058 48,702 43,003 63,279 69,918 77,703BVPS (TWD) n.a. 15.370 17.403 20.475 26.622 31.496 36.921 43.315
Year to 31 Dec 2008 2009 2010 2011 2012 2013E 2014E 2015ESales (YoY) n.a. n.a. 15.6 29.8 31.7 25.6 20.0 20.0EBITDA (YoY) n.a. n.a. 446.4 28.4 36.9 56.2 20.1 19.2Operating profit (YoY) n.a. n.a. 1,349.4 30.1 42.4 52.9 21.4 19.9Net profit (YoY) n.a. n.a. 41.9 15.1 69.2 39.0 20.3 18.6Core EPS (fully-diluted) (YoY) n.a. n.a. 62.0 26.2 46.5 29.8 20.3 18.6Gross-profit margin n.a. 49.1 49.2 51.6 56.2 61.5 61.8 62.7EBITDA margin n.a. 5.1 24.2 23.9 24.8 30.9 30.9 30.7Operating-profit margin n.a. 1.8 22.2 22.3 24.1 29.3 29.6 29.6Net profit margin n.a. 13.4 16.5 14.6 18.8 20.8 20.8 20.6ROAE n.a. 10.6 16.3 17.4 20.6 21.9 22.4 22.6ROAA n.a. 1.8 2.4 2.1 2.7 3.1 3.1 3.1ROCE n.a. 0.3 5.0 5.7 6.9 8.7 9.0 9.6ROIC n.a. 0.4 3.7 4.3 5.6 7.0 6.9 7.4Net debt to equity net cash 274.1 324.8 302.9 178.4 221.9 209.2 198.2Effective tax rate n.a. n.a. 31.8 31.3 29.5 30.0 30.0 30.0Accounts receivable (days) n.a. 714.7 1,355.4 1,461.5 1,554.8 1,563.8 1,603.0 1,635.7Current ratio (x) n.a. 0.9 1.0 1.1 1.1 1.1 1.0 1.0Net interest cover (x) n.a. 1.7 31.7 50.1 141.9 127.0 115.3 155.6Net dividend payout n.a. 0.0 44.9 68.8 40.8 35.0 35.0 35.0Free cash flow yield n.a. 3.2 4.4 14.0 13.4 20.8 21.2 26.1
Financial summary continued …
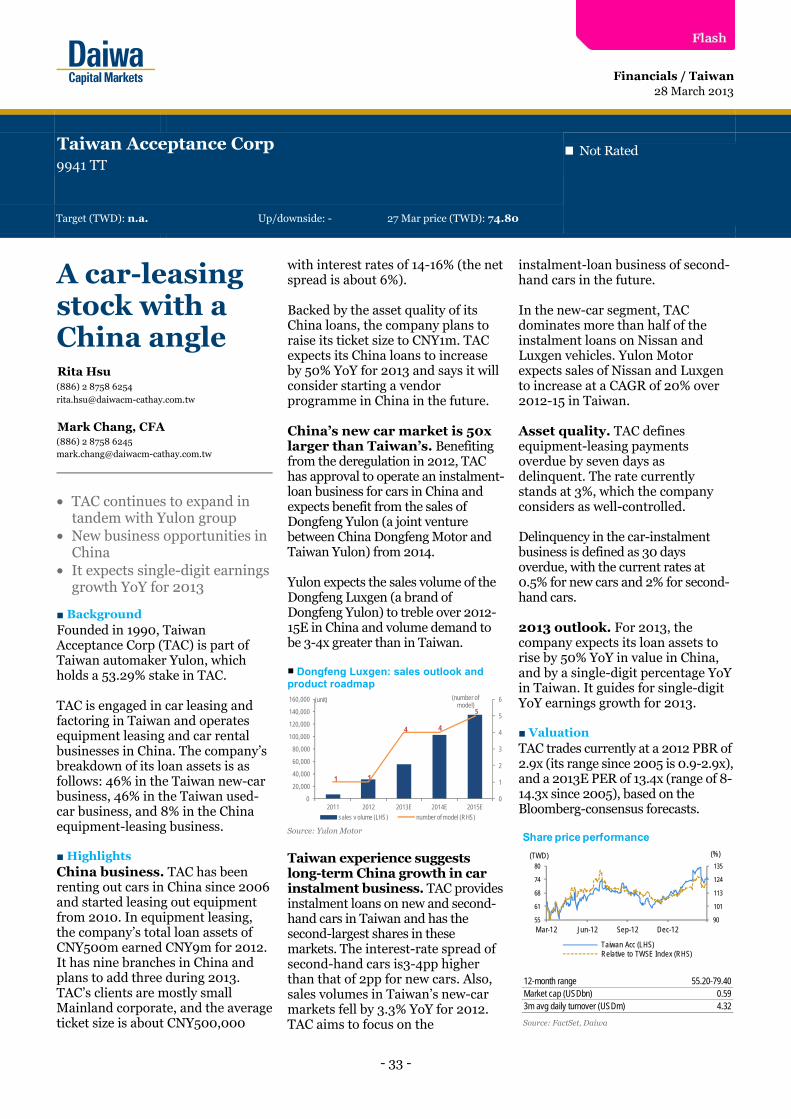
- 33 -
■ Background Founded in 1990, Taiwan Acceptance Corp (TAC) is part of Taiwan automaker Yulon, which holds a 53.29% stake in TAC. TAC is engaged in car leasing and factoring in Taiwan and operates equipment leasing and car rental businesses in China. The company’s breakdown of its loan assets is as follows: 46% in the Taiwan new-car business, 46% in the Taiwan used-car business, and 8% in the China equipment-leasing business. ■ Highlights China business. TAC has been renting out cars in China since 2006 and started leasing out equipment from 2010. In equipment leasing, the company’s total loan assets of CNY500m earned CNY9m for 2012. It has nine branches in China and plans to add three during 2013. TAC’s clients are mostly small Mainland corporate, and the average ticket size is about CNY500,000
with interest rates of 14-16% (the net spread is about 6%). Backed by the asset quality of its China loans, the company plans to raise its ticket size to CNY1m. TAC expects its China loans to increase by 50% YoY for 2013 and says it will consider starting a vendor programme in China in the future. China’s new car market is 50x larger than Taiwan’s. Benefiting from the deregulation in 2012, TAC has approval to operate an instalment-loan business for cars in China and expects benefit from the sales of Dongfeng Yulon (a joint venture between China Dongfeng Motor and Taiwan Yulon) from 2014. Yulon expects the sales volume of the Dongfeng Luxgen (a brand of Dongfeng Yulon) to treble over 2012-15E in China and volume demand to be 3-4x greater than in Taiwan. Dongfeng Luxgen: sales outlook and product roadmap
Source: Yulon Motor
Taiwan experience suggests long-term China growth in car instalment business. TAC provides instalment loans on new and second-hand cars in Taiwan and has the second-largest shares in these markets. The interest-rate spread of second-hand cars is3-4pp higher than that of 2pp for new cars. Also, sales volumes in Taiwan’s new-car markets fell by 3.3% YoY for 2012. TAC aims to focus on the
instalment-loan business of second-hand cars in the future. In the new-car segment, TAC dominates more than half of the instalment loans on Nissan and Luxgen vehicles. Yulon Motor expects sales of Nissan and Luxgen to increase at a CAGR of 20% over 2012-15 in Taiwan. Asset quality. TAC defines equipment-leasing payments overdue by seven days as delinquent. The rate currently stands at 3%, which the company considers as well-controlled. Delinquency in the car-instalment business is defined as 30 days overdue, with the current rates at 0.5% for new cars and 2% for second-hand cars. 2013 outlook. For 2013, the company expects its loan assets to rise by 50% YoY in value in China, and by a single-digit percentage YoY in Taiwan. It guides for single-digit YoY earnings growth for 2013. ■ Valuation TAC trades currently at a 2012 PBR of 2.9x (its range since 2005 is 0.9-2.9x), and a 2013E PER of 13.4x (range of 8-14.3x since 2005), based on the Bloomberg-consensus forecasts.
1 1
4 4
5
0
1
2
3
4
5
6
0
20,000
40,000
60,000
80,000
100,000
120,000
140,000
160,000
2011 2012 2013E 2014E 2015E
(number of model)
(unit)
sales v olume (LHS) number of model (RHS)
28 March 2013
A car-leasing stock with a China angle
• TAC continues to expand in tandem with Yulon group
• New business opportunities in China
• It expects single-digit earnings growth YoY for 2013
Source: FactSet, Daiwa
Financials / Taiwan
Taiwan Acceptance Corp9941 TT
Not Rated
Target (TWD): n.a. Up/downside: - 27 Mar price (TWD): 74.80
Rita Hsu(886) 2 8758 [email protected]
Mark Chang, CFA(886) 2 8758 [email protected]
90
101
113
124
135
55
61
68
74
80
Mar-12 Jun-12 Sep-12 Dec-12
Share price performance
Taiwan Acc (LHS)Relative to TWSE Index (RHS)
(TWD) (%)
12-month range 55.20-79.40Market cap (USDbn) 0.593m avg daily turnover (USDm) 4.32
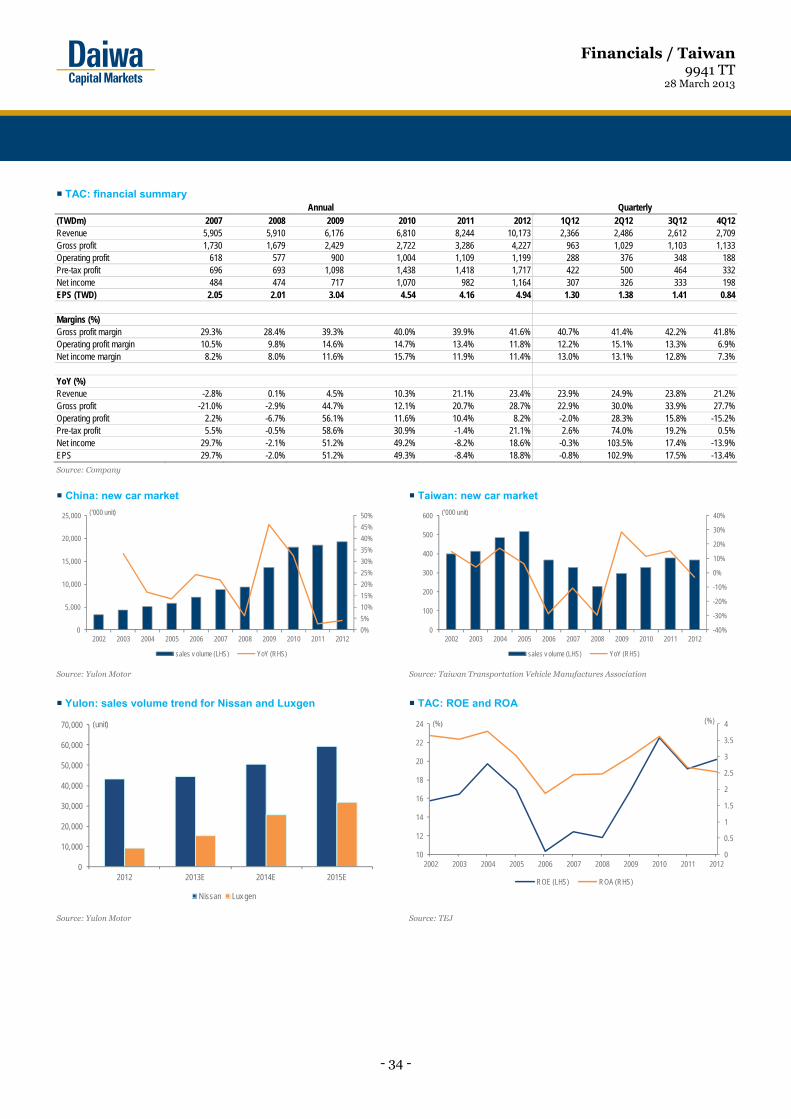
Financials / Taiwan 9941 TT
28 March 2013
- 34 -
TAC: financial summary Annual Quarterly
(TWDm) 2007 2008 2009 2010 2011 2012 1Q12 2Q12 3Q12 4Q12Revenue 5,905 5,910 6,176 6,810 8,244 10,173 2,366 2,486 2,612 2,709 Gross profit 1,730 1,679 2,429 2,722 3,286 4,227 963 1,029 1,103 1,133 Operating profit 618 577 900 1,004 1,109 1,199 288 376 348 188 Pre-tax profit 696 693 1,098 1,438 1,418 1,717 422 500 464 332 Net income 484 474 717 1,070 982 1,164 307 326 333 198 EPS (TWD) 2.05 2.01 3.04 4.54 4.16 4.94 1.30 1.38 1.41 0.84
Margins (%)
Gross profit margin 29.3% 28.4% 39.3% 40.0% 39.9% 41.6% 40.7% 41.4% 42.2% 41.8%Operating profit margin 10.5% 9.8% 14.6% 14.7% 13.4% 11.8% 12.2% 15.1% 13.3% 6.9%Net income margin 8.2% 8.0% 11.6% 15.7% 11.9% 11.4% 13.0% 13.1% 12.8% 7.3%
YoY (%)
Revenue -2.8% 0.1% 4.5% 10.3% 21.1% 23.4% 23.9% 24.9% 23.8% 21.2%Gross profit -21.0% -2.9% 44.7% 12.1% 20.7% 28.7% 22.9% 30.0% 33.9% 27.7%Operating profit 2.2% -6.7% 56.1% 11.6% 10.4% 8.2% -2.0% 28.3% 15.8% -15.2%Pre-tax profit 5.5% -0.5% 58.6% 30.9% -1.4% 21.1% 2.6% 74.0% 19.2% 0.5%Net income 29.7% -2.1% 51.2% 49.2% -8.2% 18.6% -0.3% 103.5% 17.4% -13.9%EPS 29.7% -2.0% 51.2% 49.3% -8.4% 18.8% -0.8% 102.9% 17.5% -13.4%
Source: Company
China: new car market Taiwan: new car market
Source: Yulon Motor Source: Taiwan Transportation Vehicle Manufactures Association
Yulon: sales volume trend for Nissan and Luxgen TAC: ROE and ROA
Source: Yulon Motor Source: TEJ
0%
5%
10%
15%
20%
25%
30%
35%
40%
45%
50%
0
5,000
10,000
15,000
20,000
25,000
2002 2003 2004 2005 2006 2007 2008 2009 2010 2011 2012
('000 unit)
sales v olume (LHS) YoY (RHS)
-40%
-30%
-20%
-10%
0%
10%
20%
30%
40%
0
100
200
300
400
500
600
2002 2003 2004 2005 2006 2007 2008 2009 2010 2011 2012
('000 unit)
sales v olume (LHS) YoY (RHS)
0
10,000
20,000
30,000
40,000
50,000
60,000
70,000
2012 2013E 2014E 2015E
(unit)
Nissan Lux gen
0
0.5
1
1.5
2
2.5
3
3.5
4
10
12
14
16
18
20
22
24
2002 2003 2004 2005 2006 2007 2008 2009 2010 2011 2012
(%)(%)
ROE (LHS) ROA (RHS)

- 35 -
■ What's new We visited the CapitaGreen show suite on 28 March 2013. CapitaGreen is a grade-A office building with 700,000 sq ft of net-lettable area (on the site of the former Market Street Car Park) scheduled for completion in 4Q14. CapitaCommercial Trust (CCT) owns a 40% stake in CapitaGreen. ■ What's the impact Some of the major selling points of CapitaGreen are its double-skinned facade (consisting of vertical glass louvers and a 3.2m floor-to-ceiling glass panel on each floor), green features (including a green planter area between the two glass skins), and cool-void technology (iconic red wind-scoops on the roof of the building capture and direct wind down into the central core of the building, creating naturally pre-cooled air for further processing in the air-handling system). It will have floor plates of 12,000 sq ft, 22,000 sq ft, and 26,000 sq ft, with the smallest non-subdivided space of 6,000 sq ft. CapitaGreen is probably more flexible than Asia Square Tower 2 (with average floor plates of 30,000 sq ft) in accommodating smaller occupiers. According to
management, prospective tenants were most impressed with the sustainability and green features of the building as well as the better-than-expected efficiency of its floor plates. CCT will also try to offset the disadvantage of limited car park spaces (only 180) by giving tenants a priority in the queue for car park lots in its other properties (particularly Golden Shoe Car Park). CapitaGreen appears to be the only major CBD office development that will be completed in 2014. For now, the show suite is being used to create market awareness, as it is still too early for many prospective tenants to commit. CCT expects more activity 6-9 months before completion (in 4Q14). It has no leasing targets except that it wants to secure at least one anchor tenant before completion. We believe the rationale for not signing up tenants too quickly is that the office market is still soft, and rents are likely to be higher than current levels by the time CapitaGreen is operational. After declining by about 15% from the previous peak in 3Q11, we expect office rents to bottom out in 2Q13 before recovering gradually through 2016. The current asking rent for Republic Plaza, an older, but better-located building, is SGD10-12/sq ft, according to management at City Developments (CIT SP, SGD11.33, Sell [5]). We make negligible changes to our distribution-per-unit (DPU) forecasts. We assume a passing rent of SGD12/sq ft for CapitaGreen by the time it opens (with an average occupancy rate of 90% for 2015), but there could be some downside risk if the office market does not recover. On the back of these minor revisions, we raise our DDM-derived six-month target price to SGD1.61 (from SGD1.59).
■ What we recommend We maintain our Hold (3) rating. CCT trades at the lowest yields among the office S-REITs, though its gearing is the lowest (30.1% as at the end of December 2012) among its peers. A negative risk to our call would be an unexpected deterioration in the office market, while a positive risk would be further sector yield compression. ■ How we differ Our preferred office play is still Suntec REIT (SUN SP, SGD1.80, Outperform [2]).
28 March 2013
Showcasing CapitaGreen
• Pre-marketing in a soft office market
• CapitaGreen boasts green features, floor plate efficiency
• Maintain Hold rating
Source: Daiwa forecasts
Source: FactSet, Daiwa forecasts
Financials / Singapore
CapitaCommercial TrustCCT SP
BuyOutperformHold (unchanged)
UnderperformSell
1
2
3
4
5Target (SGD): 1.590 1.610 Upside: 0.6% 27 Mar price (SGD): 1.600
David Lum, CFA(65) 6329 2102
Forecast revisions (%)Year to 31 Dec 13E 14E 15ERevenue change - (1.1) (1.2)Net-property-income chg - (1.1) (1.3)DPU change 1.3 (0.3) (0.7)
95
106
118
129
140
1.1
1.3
1.4
1.6
1.8
Mar-12 Jun-12 Sep-12 Dec-12 Mar-13
Share price performance
Capitacom (LHS) Relative to FSSTI (RHS)
(SGD) (%)
12-month range 1.175-1.705Market cap (USDbn) 3.673m avg daily turnover (USDm) 10.20Shares outstanding (m) 2,849Major shareholder CapitaLand (32.0%)
Financial summary (SGD)Year to 31 Dec 13E 14E 15ERevenue (m) 387 402 457Net property income (m) 303 313 357Distribution (m) 226 234 273DPU 0.079 0.082 0.095DPU change (%) (1.4) 3.4 16.5Daiwa vs Cons. EPS (%) (2.1) 1.2 8.5DPU yield (%) 5.0 5.1 6.0PER (x) 18.3 7.7 10.7Core EPU (fully-diluted) 0.087 0.207 0.149P/BV (x) 1.0 0.9 0.9ROE (%) 5.3 12.0 8.2

Financials / Singapore CCT SP
28 March 2013
36
We believe Singapore’s office rents are nearing the bottom of the current office cycle. Using the Jones Lang LaSalle prime grade-A office rent series, we expect rents to bottom out at SGD8.65/sq ft/month for 2Q13. The outlook for new office-space supply for 2013-16 looks encouraging, with less than 1m sq ft of new office space annually for the next four years. Nonetheless, we only expect a gradual recovery in rents due to the relatively high overall vacancy rate (11% as at the end of 2012) in the downtown core, a considerable amount of new decentralised office space available in 2013-14, and a potential spike in new downtown core supply in 2017 (led by Marina One and DUO). Singapore: prime grade-A office rents (SGD/sq ft/month) Downtown core pipeline
Scheduled Office NLAcompletion development (sq ft)2013 Asia Square Tower 2 784,651
2013 subtotal 784,651 2014 CapitaGreen 700,000
2014 subtotal 700,000 2015 5 Shenton Way 285,000
South Beach Development* 501,943 2015 subtotal 786,943
2016 Peck Seah St/ Choon Guan St 800,000 EON Shenton 103,021 Robinson Square 35,355
2016 subtotal 938,376 2017 and after DUO - Ophir Rochor (M+S)* 580,000
Marina One (M+S) 1,835,262 Oxley Tower 111,713 IFB and Robinson Towers 215,283 Marina View/Union Street 764,022
2017 and after subtotal 3,506,280 Grand total 6,716,250
Source: Jones Lang LaSalle, Daiwa forecasts Source: Jones Lang LaSalle, Daiwa estimates; *Not part of downtown core, but we expect the property to compete with CBD office space for new tenants
One unique aspect of CapitaGreen and its contribution to the Singapore skyline will be its bright red wind-scoops. CapitaGreen’s unobstructed 3.2m floor-to-ceiling windows will be one of its attractive features. CapitaGreen building model (with red wind-scoops) A simulated floor-to-ceiling view from one of CapitaGreen’s
offices
Source: Daiwa Source:Daiwa
0
2
4
6
8
10
12
14
16
18
20
1Q04
3Q04
1Q05
3Q05
1Q06
3Q06
1Q07
3Q07
1Q08
3Q08
1Q09
3Q09
1Q10
3Q10
1Q11
3Q11
1Q12
3Q12
1Q13
3Q13
1Q14
3Q14
1Q15
3Q15
1Q16
3Q16
10.20
8.657.75
18.40
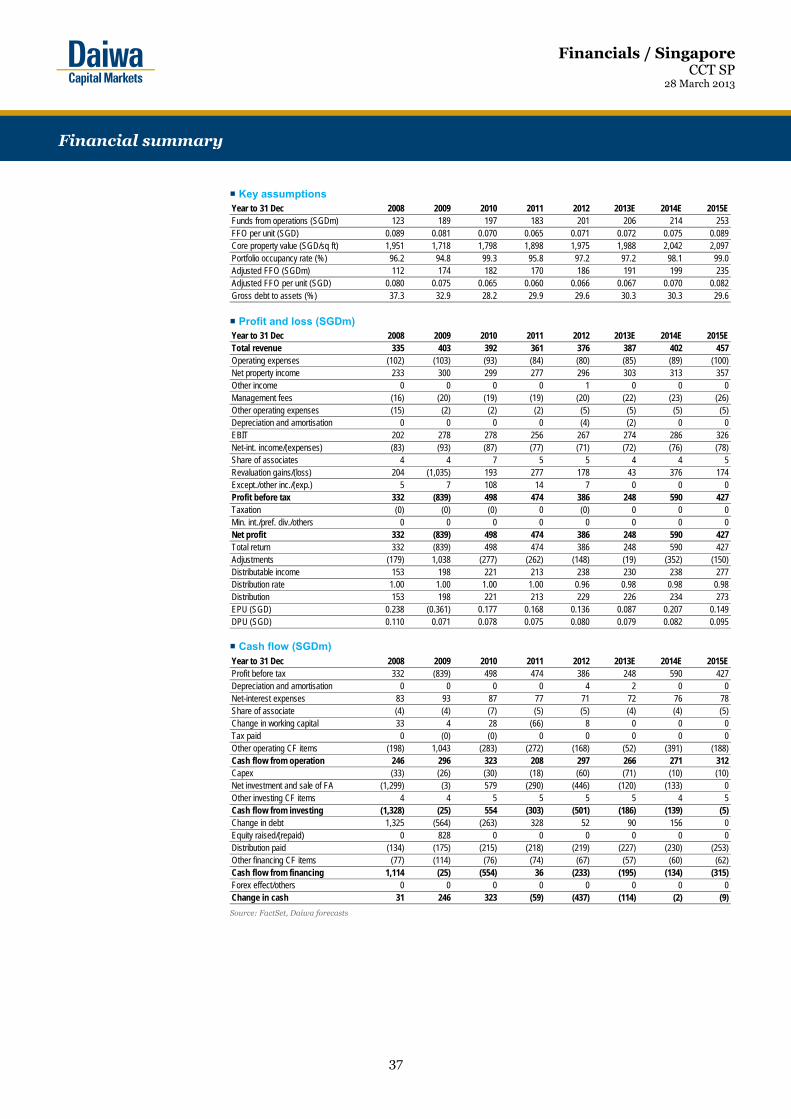
Financials / Singapore CCT SP
28 March 2013
37
Key assumptions
Profit and loss (SGDm)
Cash flow (SGDm)
Source: FactSet, Daiwa forecasts
Year to 31 Dec 2008 2009 2010 2011 2012 2013E 2014E 2015EFunds from operations (SGDm) 123 189 197 183 201 206 214 253FFO per unit (SGD) 0.089 0.081 0.070 0.065 0.071 0.072 0.075 0.089Core property value (SGD/sq ft) 1,951 1,718 1,798 1,898 1,975 1,988 2,042 2,097Portfolio occupancy rate (%) 96.2 94.8 99.3 95.8 97.2 97.2 98.1 99.0Adjusted FFO (SGDm) 112 174 182 170 186 191 199 235Adjusted FFO per unit (SGD) 0.080 0.075 0.065 0.060 0.066 0.067 0.070 0.082Gross debt to assets (%) 37.3 32.9 28.2 29.9 29.6 30.3 30.3 29.6
Year to 31 Dec 2008 2009 2010 2011 2012 2013E 2014E 2015ETotal revenue 335 403 392 361 376 387 402 457Operating expenses (102) (103) (93) (84) (80) (85) (89) (100)Net property income 233 300 299 277 296 303 313 357Other income 0 0 0 0 1 0 0 0Management fees (16) (20) (19) (19) (20) (22) (23) (26)Other operating expenses (15) (2) (2) (2) (5) (5) (5) (5)Depreciation and amortisation 0 0 0 0 (4) (2) 0 0EBIT 202 278 278 256 267 274 286 326Net-int. income/(expenses) (83) (93) (87) (77) (71) (72) (76) (78)Share of associates 4 4 7 5 5 4 4 5Revaluation gains/(loss) 204 (1,035) 193 277 178 43 376 174Except./other inc./(exp.) 5 7 108 14 7 0 0 0Profit before tax 332 (839) 498 474 386 248 590 427Taxation (0) (0) (0) 0 (0) 0 0 0Min. int./pref. div./others 0 0 0 0 0 0 0 0Net profit 332 (839) 498 474 386 248 590 427Total return 332 (839) 498 474 386 248 590 427Adjustments (179) 1,038 (277) (262) (148) (19) (352) (150)Distributable income 153 198 221 213 238 230 238 277Distribution rate 1.00 1.00 1.00 1.00 0.96 0.98 0.98 0.98Distribution 153 198 221 213 229 226 234 273EPU (SGD) 0.238 (0.361) 0.177 0.168 0.136 0.087 0.207 0.149DPU (SGD) 0.110 0.071 0.078 0.075 0.080 0.079 0.082 0.095
Year to 31 Dec 2008 2009 2010 2011 2012 2013E 2014E 2015EProfit before tax 332 (839) 498 474 386 248 590 427Depreciation and amortisation 0 0 0 0 4 2 0 0Net-interest expenses 83 93 87 77 71 72 76 78Share of associate (4) (4) (7) (5) (5) (4) (4) (5)Change in working capital 33 4 28 (66) 8 0 0 0Tax paid 0 (0) (0) 0 0 0 0 0Other operating CF items (198) 1,043 (283) (272) (168) (52) (391) (188)Cash flow from operation 246 296 323 208 297 266 271 312Capex (33) (26) (30) (18) (60) (71) (10) (10)Net investment and sale of FA (1,299) (3) 579 (290) (446) (120) (133) 0Other investing CF items 4 4 5 5 5 5 4 5Cash flow from investing (1,328) (25) 554 (303) (501) (186) (139) (5)Change in debt 1,325 (564) (263) 328 52 90 156 0Equity raised/(repaid) 0 828 0 0 0 0 0 0Distribution paid (134) (175) (215) (218) (219) (227) (230) (253)Other financing CF items (77) (114) (76) (74) (67) (57) (60) (62)Cash flow from financing 1,114 (25) (554) 36 (233) (195) (134) (315)Forex effect/others 0 0 0 0 0 0 0 0Change in cash 31 246 323 (59) (437) (114) (2) (9)
Financial summary

Financials / Singapore CCT SP
28 March 2013
38
Balance sheet (SGDm)
Key ratios (%)
Source: FactSet, Daiwa forecasts
Company profile
CapitaCommercial Trust (CCT) owns a portfolio of ten properties in Singapore’s downtown core. For 2012, 64% of CCT's gross rental income came from offices, 21% from retail and 15% from hotels and convention centre. As at the end of December 2012, CCT's investment property portfolio was valued at SGD6.38bn (excluding properties under construction).
As at 31 Dec 2008 2009 2010 2011 2012 2013E 2014E 2015ECash & cash equivalent 67 312 636 577 140 25 24 15Accounts receivable 19 9 6 25 23 23 23 23Other current assets 0 0 0 0 0 0 0 0Total current assets 85 322 642 602 163 49 47 38Investment properties 6,711 5,702 5,475 5,730 6,380 6,494 7,463 7,657Fixed assets 1 1 1 1 1 1 1 1Associates 64 63 67 67 66 66 66 66Goodwill and intangible assets 0 0 0 0 13 11 11 11Other long-term assets 10 12 11 354 380 505 65 65Total assets 6,871 6,100 6,196 6,754 7,003 7,125 7,652 7,838Short-term debt 0 0 0 0 0 0 0 0Accounts payable 97 91 122 88 105 105 105 105Other current liabilities 27 20 27 14 15 15 15 15Total current liabilities 124 111 148 102 120 120 120 120Long-term debt 2,562 2,004 1,747 2,018 2,072 2,162 2,318 2,318Other non-current liabilities 31 29 27 93 96 96 96 96Total liabilities 2,717 2,144 1,922 2,212 2,288 2,378 2,534 2,534Unitholders' funds 4,155 3,956 4,274 4,541 4,715 4,747 5,118 5,304Minority interests 0 0 0 0 0 0 0 0Total equity & liabilities 6,871 6,100 6,196 6,754 7,003 7,125 7,652 7,838Book Value per unit 2.974 1.406 1.514 1.603 1.658 1.666 1.792 1.853
Year to 31 Dec 2008 2009 2010 2011 2012 2013E 2014E 2015ETotal revenue (YoY) 39.7 20.3 (2.8) (7.8) 4.0 3.1 3.7 13.7Net property income (YoY) 34.2 28.6 (0.4) (7.2) 6.6 2.5 3.3 14.0Net profit (YoY) (76.6) n.a. n.a. (4.7) (18.7) (35.6) 137.6 (27.6)Distribution (YoY) 27.1 29.7 11.3 (3.7) 7.4 (1.2) 3.6 16.7EPU (YoY) (76.7) n.a. n.a. (5.0) (18.9) (35.8) 137.0 (27.8)DPU (YoY) 26.4 (35.8) 10.9 (4.0) 6.9 (1.4) 3.4 16.5ROE 8.2 n.a. 12.1 10.8 8.3 5.3 12.0 8.2ROA 5.5 n.a. 8.1 7.3 5.6 3.5 8.0 5.5ROCE 3.4 4.4 4.7 4.1 4.0 4.0 4.0 4.4ROIC 3.4 4.5 5.1 4.5 4.2 4.0 4.0 4.3Debt to asset 36.3 27.7 17.9 21.3 27.6 30.0 30.0 29.4Net debt to equity 60.0 42.8 26.0 31.7 41.0 45.0 44.8 43.4Effective tax rate 0.0 n.a. 0.0 0.0 0.0 0.0 0.0 0.0
Financial summary continued …
Please see the important notice on the back page
BUY (Unchanged) TP: Bt 100.00 (Unchanged) 28 MARCH 2013
Company Update Upside : 43.9%
PTT Global Chemical (PTTGC TB)
SUPANNA SUWANKIRD
662 – 617 4900 [email protected]
WARAYUT LUANGMETTAKUL
Assistant [email protected]
Tokyo NDR Feedback
Following our NDR with PTTGC in Tokyo we reaffirm our positive view on the company’s near- to long-term strategic plans. Management believes the industry already bottomed in 2012 and expects a mild recovery in 2013. Given the recent share sell-off, PTTGC’s valuation looks even more attractive at 2013F PE of 8.4x.
PTTGC’s NDR in Tokyo Thanachart and Daiwa Securities hosted PTTGC’s two-day NDR trip in Tokyo on 18-19 March 2013. Ten leading Japanese funds signed up to meet with management, including CFO Patiparn Sukorndhamarn and VP Corporate Finance Thitipong Jurapornsiridee. Investors asked a variety of questions ranging from the short- to long-term investment plan, feedstock cost from PTT Pcl (PTT TB) and the petrochemical spread outlook to the baht appreciation impact and dividend payout policies. Overall, most focused on the company’s long-term value and ability to generate/raise enough cash flows to maintain its dividend payout while financing its five-year investment budget of US$4.5bn.
Improving industry outlook PTTGC believes the market for HDPE, its key product, hit the trough stage in 2012 given an average HDPE-Naphtha spread of US$430/tonne. This level already implies the cash cost of naphtha crackers which comprises over 50% of market supply. Thus, management expects some mild improvement driven by the supply factor in 2013 from the low level last year. PTTGC sees the petrochemical price/spread from the start of this year as being overly optimistic and that it will likely cool down via supply adjustment after this period. A stronger demand-driven recovery should be seen in 2014, from the company’s point of view.
Three value creation growth phases Management laid out its growth roadmap in three phases. In the near term, it believes hidden values remain to be unlocked from internal improvement and synergies among its integrated facilities. These projects are relatively low risk and their returns all pass the company’s ROIC requirement of 14%. Some even have IRR as high as 40%. In the medium term, PTTGC sees growth coming from additional capacities through debottlenecking of its gas cracker and aromatics units. The company expects the new capacities to come on stream in 2015-16. PTTGC says long-term growth will be derived from areas close to its existing business; new geographical penetration, a new production complex and specialty chemical products. This is also where PTTGC allocates the majority of its five-year investment budget.
Valuation more enticing after share fall Despite the recent share price fall (down 11% over the past 3 weeks), the NDR has given us comfort that PTTGC’s fundamentals remain intact. Our HDPE-Naphtha assumption of US$450/tonne is lower than the average YTD of US$500/tonne. We see PTTGC’s valuation as even more attractive at 2013F PE of 8.4x with a 5% dividend yield. We reaffirm our BUY call and 12-month DCF TP of Bt100.00/share.
Th
an
ach
art
Sec
uri
ties
Th
an
ach
art
Sec
uri
ties
COMPANY VALUATION
Y/E Dec (Bt m) 2012A 2013F 2014F 2015F
Sales 565,617 550,144 506,010 542,855
Net profit 34,001 37,169 41,425 45,551
Consensus NP ⎯ 35,332 37,933 39,303
Diff frm cons (%) ⎯ 5.2 9.2 15.9
Norm profit 32,236 37,169 41,425 45,551
Prev. Norm profit ⎯ 37,169 41,425 45,551
Chg frm prev (%) ⎯ 0.0 0.0 0.0
Norm EPS (Bt) 7.1 8.2 9.2 10.1
Norm EPS grw (%) 4.8 15.3 11.4 10.0
Norm PE (x) 9.7 8.4 7.6 6.9
EV/EBITDA (x) 7.8 6.7 5.9 5.3
P/BV (x) 1.4 1.3 1.2 1.1
Div yield (%) 4.3 5.3 5.9 6.5
ROE (%) 15.3 15.9 16.2 16.2
Net D/E (%) 44.4 35.6 25.0 18.6
PRICE PERFORMANCE
COMPANY INFORMATION
Price as of 28-Mar-13 (Bt) 69.50
Market cap (US$ m) 10,547.5
Listed shares (m shares) 4,508.8
Free float (%) 51.1
Avg daily turnover (US$ m) 31.6
12M price H/L (Bt) 81.8/53.3
Sector Petrochem
Major shareholder PTT Pcl 48.9%
Sources: Bloomberg, Company data, Thanachart estimates
20.030.040.050.0
60.070.080.090.0
M ar-12 Jul-12 Nov-12 M ar-13
(Bt /shr)
(30)
(20)
(10)
0
10
20
(%)PTTGC
Rel to SET Index
- 40 -
Hirokazu Miyagi (81) 3 5555-7104 [email protected]
What’s new On 21-22 March, we visited the Chinese operational bases of five Japanese firms. We have not changed our investment opinions for each firm in this report. Firms we visited: 1. Hitachi Construction Machinery
(6305): Construction machinery 2. Komatsu (6301): Construction
machinery 3. Yaskawa Electric (6506):
FA equipment 4. NSK (6471): Bearings 5. Makita (6586): Electric tools What’s the impact In our view, the Chinese capital goods sector market is bottoming out overall, although momentum remains weak. Many company officials suggested that orders have recovered vs. late 2012, although they are still far below the historical peak. Backed by the change in the leadership and other factors, new projects have gradually started to progress, mainly (1) infrastructure including railways, ports, and roads, and (2) eco-friendly facilities and new agricultural land. Construction machinery makers state that sales were stronger than expected since the Chinese New Year holidays, with sales volume
likely to advance in the double digits y/y in 2013. That said, the problem of excessive inventory among many local and overseas makers persists, and such firms continue to implement aggressive sales promotions, indicating that a meaningful recovery is not yet on the horizon. Yaskawa Electric company officials commented that sales to the local machine tool makers have yet to recover due to low capacity utilization at their clients. Meanwhile, the firm is seeing brisk inquiries for smartphone-related orders, enjoying relatively favorable sales of AC servo motors. Overall, the firm is seeing a moderate recovery in demand. Orders have recovered somewhat for industrial bearings, but inventory cutbacks will probably take time. We are also cautious on financial conditions of sales agencies. Meanwhile, sales for the automotive industry are relatively encouraging. With the effects of worsened Japan-China relationships playing out, sales by Japanese makers are on a recovery trajectory. We see great growth potential in China on the back of makers’ expanded local production. Worthy of mention is that several firms call for increased market share. A sharp slowdown in demand has largely run its course, and each firm seems to be focusing on medium-term initiatives.
We expect Japanese firms to increase market share not only via discounts, but by (1) launching high-quality but affordable products, (2) enhancing after-sales service, and (3) strengthening production and development locally. In the following pages, we present an overview of our interview with each firm.
Capital goods / Japan
28 March 2013Japanese report: 27 Mar 13
China research trip
• Momentum weak but construction machinery demand bottoming out
• Smartphone-related orders still backing FA demand • Firms call for higher market share
Capital Goods Sector Update Volume 16
How do we justify our view?How do we justify our view?
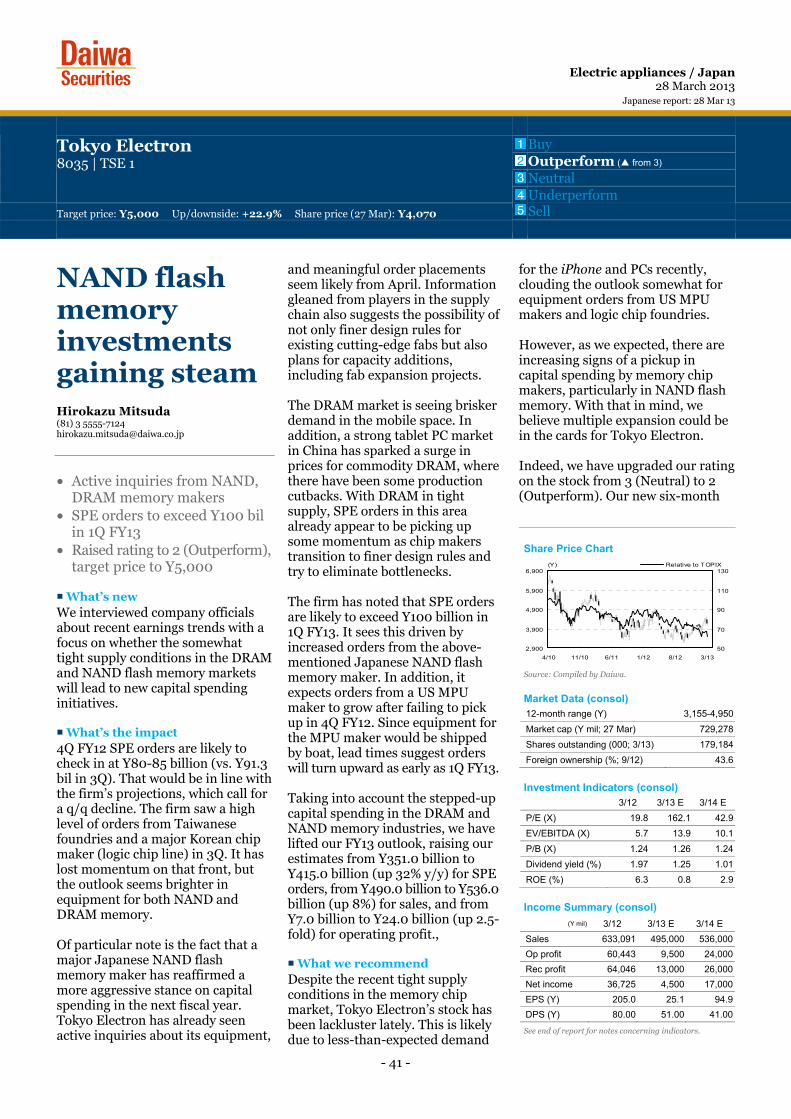
- 41 -
NAND flash memory investments gaining steam Hirokazu Mitsuda (81) 3 5555-7124 [email protected]
• Active inquiries from NAND,
DRAM memory makers • SPE orders to exceed Y100 bil
in 1Q FY13 • Raised rating to 2 (Outperform),
target price to Y5,000 What’s new We interviewed company officials about recent earnings trends with a focus on whether the somewhat tight supply conditions in the DRAM and NAND flash memory markets will lead to new capital spending initiatives. What’s the impact 4Q FY12 SPE orders are likely to check in at Y80-85 billion (vs. Y91.3 bil in 3Q). That would be in line with the firm’s projections, which call for a q/q decline. The firm saw a high level of orders from Taiwanese foundries and a major Korean chip maker (logic chip line) in 3Q. It has lost momentum on that front, but the outlook seems brighter in equipment for both NAND and DRAM memory. Of particular note is the fact that a major Japanese NAND flash memory maker has reaffirmed a more aggressive stance on capital spending in the next fiscal year. Tokyo Electron has already seen active inquiries about its equipment,
and meaningful order placements seem likely from April. Information gleaned from players in the supply chain also suggests the possibility of not only finer design rules for existing cutting-edge fabs but also plans for capacity additions, including fab expansion projects. The DRAM market is seeing brisker demand in the mobile space. In addition, a strong tablet PC market in China has sparked a surge in prices for commodity DRAM, where there have been some production cutbacks. With DRAM in tight supply, SPE orders in this area already appear to be picking up some momentum as chip makers transition to finer design rules and try to eliminate bottlenecks. The firm has noted that SPE orders are likely to exceed Y100 billion in 1Q FY13. It sees this driven by increased orders from the above-mentioned Japanese NAND flash memory maker. In addition, it expects orders from a US MPU maker to grow after failing to pick up in 4Q FY12. Since equipment for the MPU maker would be shipped by boat, lead times suggest orders will turn upward as early as 1Q FY13. Taking into account the stepped-up capital spending in the DRAM and NAND memory industries, we have lifted our FY13 outlook, raising our estimates from Y351.0 billion to Y415.0 billion (up 32% y/y) for SPE orders, from Y490.0 billion to Y536.0 billion (up 8%) for sales, and from Y7.0 billion to Y24.0 billion (up 2.5-fold) for operating profit., What we recommend Despite the recent tight supply conditions in the memory chip market, Tokyo Electron’s stock has been lackluster lately. This is likely due to less-than-expected demand
for the iPhone and PCs recently, clouding the outlook somewhat for equipment orders from US MPU makers and logic chip foundries. However, as we expected, there are increasing signs of a pickup in capital spending by memory chip makers, particularly in NAND flash memory. With that in mind, we believe multiple expansion could be in the cards for Tokyo Electron. Indeed, we have upgraded our rating on the stock from 3 (Neutral) to 2 (Outperform). Our new six-month
Electric appliances / Japan28 March 2013
Japanese report: 28 Mar 13
Tokyo Electron 8035 | TSE 1
Buy Outperform (▲ from 3) Neutral Underperform
Target price: Y5,000 Up/downside: +22.9% Share price (27 Mar): Y4,070 Sell
Share Price Chart
Source: Compiled by Daiwa.
Market Data (consol) 12-month range (Y) 3,155-4,950
Market cap (Y mil; 27 Mar) 729,278
Shares outstanding (000; 3/13) 179,184
Foreign ownership (%; 9/12) 43.6
Investment Indicators (consol)
3/12 3/13 E 3/14 E
P/E (X) 19.8 162.1 42.9
EV/EBITDA (X) 5.7 13.9 10.1
P/B (X) 1.24 1.26 1.24
Dividend yield (%) 1.97 1.25 1.01
ROE (%) 6.3 0.8 2.9
Income Summary (consol)
(Y mil) 3/12 3/13 E 3/14 E
Sales 633,091 495,000 536,000
Op profit 60,443 9,500 24,000
Rec profit 64,046 13,000 26,000
Net income 36,725 4,500 17,000
EPS (Y) 205.0 25.1 94.9
DPS (Y) 80.00 51.00 41.00
See end of report for notes concerning indicators.
2,900
3,900
4,900
5,900
6,900
4/10 11/10 6/11 1/12 8/12 3/13
(Y)
50
70
90
110
130Relative to TOPIX

Tokyo Electron (8035) 28 March 2013
- 42 -
target price of Y5,000 is based on our end-FY12 book value estimate of Y3,242 per share and a 10% premium to the stock’s three-year
average P/B of 1.4X. The applied premium reflects potential for increased order momentum.
Chart 1: Earnings (Y mil)
FY06 07 08 09 10 11 12 E 13 E 14 E 12 CP Sales 851,975 906,091 508,082 418,636 668,722 633,091 495,000 536,000 577,000 495,000
SPE 642,625 726,439 325,383 262,391 511,331 477,873 393,000 416,000 452,000 393,000 FPD/PV production equipment 100,766 68,016 88,107 71,361 66,721 69,888 19,000 34,000 35,000 19,000
Other 107,462 111,181 94,207 84,473 90,216 84,867 83,000 86,000 90,000 83,000 Operating profit 143,978 168,498 14,710 -2,180 97,870 60,443 9,500 24,000 39,000 9,500 Recurring profit 143,940 172,713 20,555 2,558 101,919 64,046 13,000 26,000 41,000 - Pretax income 144,414 169,219 9,636 -7,767 99,579 60,602 14,000 26,000 41,000 -
SPE NA NA NA NA 120,845 89,019 46,500 61,000 74,500 - FPD/PV production equipment NA NA NA NA 6,640 2,271 -7,700 -11,700 -10,100 -
Other, eliminations NA NA NA NA -27,906 -30,688 -24,800 -23,300 -23,400 - Net income 91,262 106,271 7,543 -9,033 71,924 36,725 4,500 17,000 28,000 4,500
EPS (Y) 511.27 594.01 42.15 -50.46 401.73 205.04 25.11 94.87 156.26 25.11 DPS (Y) 103.0 125.0 24.0 12.0 114.0 80.0 51.0 41.0 46.0 51.0
Book value per share (Y) 2,573.72 2,989.70 2,896.55 2,859.37 3,198.66 3,275.14 3,242.73 3,293.20 3,397.66 - ROE (%) 21.8 21.4 1.4 -1.8 13.3 6.3 0.8 2.9 4.7 -
Depreciation 18,820 21,400 23,000 20,000 17,700 24,197 26,000 25,000 25,000 26,000 Capex 27,100 22,700 18,100 14,900 39,100 39,500 22,000 20,000 20,000 22,000
R&D 56,961 66,072 60,900 54,000 70,500 81,500 74,000 70,000 70,000 74,000 Y/y %
Sales 26 6 -44 -18 60 -5 -22 8 8 -22 Operating profit 90 17 -91 Loss Profit -38 -84 153 63 -84 Recurring profit 90 20 -88 -88 3,884 -37 -80 100 58 -
Net income 90 16 -93 Loss Profit -49 -88 278 65 -88
Orders 867,342 634,022 275,096 389,480 643,404 456,213 334,868 447,000 444,000 - SPE 800,434 504,116 214,517 360,914 567,971 437,615 314,281 415,000 410,000 -
FPD/PV production equipment 66,908 129,906 60,579 28,566 75,433 18,598 20,587 32,000 34,000 - Source: Company materials; compiled by Daiwa. E: Daiwa estimates. CP: Company projections.
Tokyo Electron (8035): Income Summary (Y mil; y/y %)
Year to Sales Op profit Rec profit Net income EPS (Y) CFPS (Y) DPS (Y) Consol 3/10 418,636 (-18) -2,180 (loss) 2,558 (-88) -9,033 (loss) -50.5 61.3 12.00 3/11 668,722 (60) 97,870 (profit) 101,919 (NA) 71,924 (profit) 401.7 500.6 114.00 3/12 633,091 (-5) 60,443 (-38) 64,046 (-37) 36,725 (-49) 205.0 340.1 80.00 3/13 E 495,000 (-22) 9,500 (-84) 13,000 (-80) 4,500 (-88) 25.1 170.2 51.00 3/14 E 536,000 (8) 24,000 (153) 26,000 (100) 17,000 (278) 94.9 234.4 41.00 3/15 E 577,000 (8) 39,000 (63) 41,000 (58) 28,000 (65) 156.3 295.8 46.00 3/13 PE 495,000 (-22) 9,500 (-84) 13,000 (-80) 4,500 (-88) 25.1 170.2 51.00 3/14 PE 490,000 (-1) 7,000 (-26) 9,000 (-31) 5,000 (11) 27.9 167.4 23.00 3/15 PE 519,000 (6) 17,000 (143) 19,000 (111) 13,000 (160) 72.6 212.1 30.00 3/13 CP 495,000 (-22) 9,500 (-84) - (-) 4,500 (-88) 25.1 - 51.00
E: Daiwa estimates. PE: Previous Daiwa estimates. CP: Company projections.

Tokyo Electron (8035) 28 March 2013
- 43 -
Chart 2: Quarterly Earnings (Y mil)
FY11 12 13 E 1Q 2Q 3Q 4Q 1Q 2Q 3Q 4Q E 1Q 2Q Sales 153,117 173,233 129,164 177,577 134,179 132,421 91,910 136,490 106,000 116,000 SPE 120,836 127,558 91,596 137,883 108,703 105,963 68,056 110,278 77,000 88,000
FPD/PV production equipment 12,536 24,141 16,633 16,578 4,769 4,460 4,682 5,089 8,000 7,000 Other 19,744 21,533 20,933 23,115 20,706 21,997 19,171 21,123 21,000 21,000 Operating profit 23,088 13,771 6,094 17,490 9,283 2,918 -6,865 4,164 -600 2,300 Recurring profit 23,751 15,971 6,998 17,326 11,248 4,211 -6,654 4,195 -100 2,800 Pretax income 23,423 15,802 6,754 14,623 11,231 4,308 -6,190 4,651 -100 2,800 SPE 28,330 21,941 13,614 25,134 16,798 13,984 2,844 12,874 8,200 11,400
FPD/PV production equipment 859 2,073 623 -1,284 -1,685 -1,681 -2,023 -2,311 -2,400 -2,700 Other, eliminations -5,766 -8,212 -7,483 -9,227 -3,882 -7,995 -7,011 -5,912 -5,900 -5,900 Net income 16,636 10,022 756 9,313 5,720 370 -7,026 5,436 -270 1,760 Y/y % Sales 6 0 -19 -7 -12 -24 -29 -23 -21 -12 Operating profit 26 -43 -76 -41 -60 -79 Loss -76 Loss -21 Recurring profit 25 -39 -74 -43 -53 -74 Loss -76 Loss -34 Net income 13 -46 -96 -53 -66 -96 Loss -42 Loss 376 Orders 121,612 75,245 150,049 109,307 78,858 75,013 94,997 86,000 109,000 122,000 Y/y % -16 -56 4 -40 -35 0 -37 -21 38 63
Q/q % -33 -38 99 -27 -28 -5 27 -9 27 12 SPE 112,692 73,532 144,971 106,420 76,029 66,928 91,324 80,000 101,000 114,000
FPD/PV production equipment 8,920 1,713 5,078 2,887 2,829 8,085 3,673 6,000 8,000 8,000 Source: Company materials; compiled by Daiwa E: Daiwa estimates. Chart 3: Consolidated Balance Sheet (Y mil)
FY03 04 05 06 07 08 09 10 11
Current assets 402,974 495,185 517,487 610,363 640,233 505,687 552,939 644,231 607,050 Cash and cash equivalents 42,649 115,420 140,023 134,389 67,540 51,156 56,939 52,992 35,834 Notes and accounts receivable 231,044 172,487 169,038 228,688 224,170 119,687 124,462 136,385 150,305 Securities - - - - 136,022 159,001 187,000 232,057 211,790 Inventories 105,186 161,489 163,745 194,840 161,151 134,240 138,449 168,924 149,468 Other 24,095 45,789 44,681 52,446 51,350 41,603 46,089 53,873 59,653 Fixed assets 158,657 149,133 145,755 160,150 152,584 163,311 143,412 164,973 176,560 Tangible fixed assets 108,788 98,416 94,738 104,930 104,105 99,906 92,127 112,551 126,885 Intangible fixed assets 21,512 18,611 16,709 19,399 13,253 10,760 5,586 4,212 4,703 Investments and other 28,356 32,106 34,307 35,821 35,224 52,644 45,698 48,209 44,971 Total assets 561,631 644,319 663,242 770,513 792,817 668,998 696,351 809,205 783,610 Current liabilities 141,472 206,611 201,627 225,854 198,820 89,272 119,161 168,038 124,794 Notes and accounts payable 65,419 58,229 65,816 83,837 55,332 24,393 52,359 53,612 46,986 Short-term borrowings 8,569 6,451 2,100 - - - - - - Other 67,484 141,931 133,711 142,017 143,488 64,879 66,802 114,426 77,808 Long-term liabilities 140,412 101,132 79,993 74,848 48,752 50,460 53,820 56,365 60,213 Straight and convertible bonds 90,000 60,000 35,500 30,000 - - - - - Long-term borrowings 8,475 3,000 3,000 - - - - - - Other 41,937 38,132 41,493 44,848 48,752 50,460 53,820 56,365 60,213 Total liabilities 281,885 307,743 281,621 300,702 247,572 139,732 172,982 224,403 185,007 Noncontrolling interests 3,946 4,410 4,721 - - - - - - Total shareholders’ equity 275,799 332,165 376,900 - - - - - - Total net assets - - - 469,810 545,244 529,265 523,369 584,801 598,602 Total liabilities and net assets 561,631 644,319 663,242 770,513 792,817 668,998 696,351 809,205 783,610 Source: Company materials; compiled by Daiwa
Translation: M.G. Style check: K.R. Accuracy check: M.G.
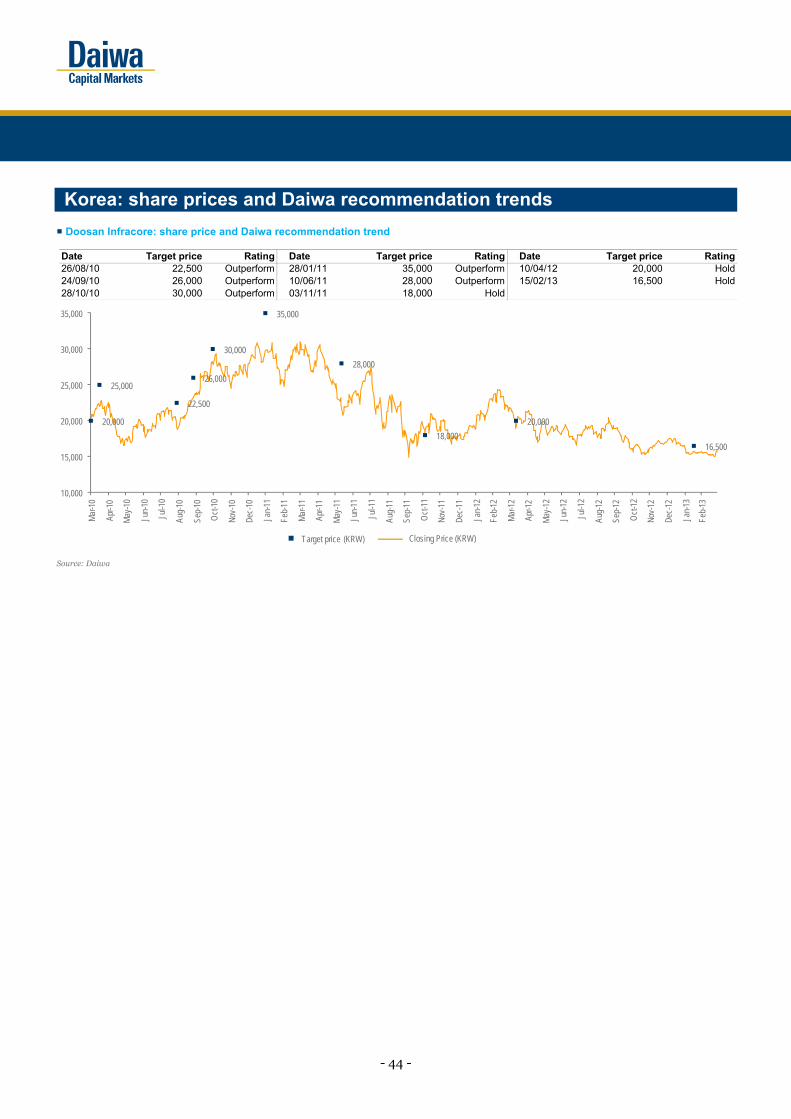
- 44 -
Korea: share prices and Daiwa recommendation trends Doosan Infracore: share price and Daiwa recommendation trend
Source: Daiwa
Date Target price Rating Date Target price Rating Date Target price Rating26/08/10 22,500 Outperform 28/01/11 35,000 Outperform 10/04/12 20,000 Hold24/09/10 26,000 Outperform 10/06/11 28,000 Outperform 15/02/13 16,500 Hold28/10/10 30,000 Outperform 03/11/11 18,000 Hold
20,000
25,000
22,500
26,000
30,000
35,000
28,000
18,000
20,000
16,500
10,000
15,000
20,000
25,000
30,000
35,000
Mar
-10
Apr-1
0
May
-10
Jun-
10
Jul-1
0
Aug-
10
Sep-
10
Oct
-10
Nov-
10
Dec-
10
Jan-
11
Feb-
11
Mar
-11
Apr-1
1
May
-11
Jun-
11
Jul-1
1
Aug-
11
Sep-
11
Oct
-11
Nov-
11
Dec-
11
Jan-
12
Feb-
12
Mar
-12
Apr-1
2
May
-12
Jun-
12
Jul-1
2
Aug-
12
Sep-
12
Oct
-12
Nov-
12
Dec-
12
Jan-
13
Feb-
13
Target price (KRW) Closing Price (KRW)

- 45 -
Company Visit / interviews Results (results announcement conf calls) Others (Factory visits, etc)
Mon Tue Wed Thur Fri 25-Mar-13 26-Mar-13 27-Mar-13 28-Mar-13 29-Mar-13
HK/CN
Jerry Yang CPIC (2601 HK) Jerry Yang
PICC Group, PICC P&C (1339 HK, 2328 HK)
Leon Qi Haitong Securities (6837 HK) Jerry Yang China Life (2628 HK) Grace Wu Citic Bank (998 HK)
Leon Qi CRCB (3618 HK) Grace Wu BoC, BOCHK (3988 HK, 2388 HK) Jerry Yang New China Life
(1336 HK) Leon Qi Citic Securities (6030 HK)
Grace Wu CCB (939 HK) Leon Qi ABC (1288 HK) Grace Wu ICBC (1398 HK)
John Choi Chaowei Power (951 HK)
Grace Wu BoCom (3328 HK)
Kelvin Lau Anhui Expressway (995 HK)
Kelvin Lau Shenzhen Expressway (548 HK)
John Choi Shenzhou Int'l (2313 HK)
SG
David Lum
Global Logistic Property (GLP SP)
David Lum City Development (CT SP)
David Lum CapitaLand (CL SP) David Lum Capital Commercial (CCT SP)
David Lum
Ezion Holdings (EZI SP) David Lum Singapore Press
Holdings (SP SG) Srikanth Vadlamani DBS (DBS SP)
Rama Maruvada M1 (M1 SP) David Lum Keppel Land (KP SP) Srikanth Vadlamani Wing Tai Holdings
(WINGT SP)
Rama Maruvada Starhub (STH SP)
Rama Maruvada
Venture Corp (VMS SP)
Rama Maruvada
PT Global MediaCom (BMTR IJ)
KR
Thomas Y Kwon
SK Communication (066270 KS)
Mike Oh Samsung Engineering (028050 KS)
Thomas Y Kwon
S1 (012750 KS)
Thomas Y Kwon
SFM (000810KS)
TW
IN
Navin Matta
Exide Industries (EXID IN)
Punit Srivastava
State Bank of India (SBI IN)
PH
1-Apr-13 2-Apr-13 3-Apr-13 4-Apr-13 5-Apr-13
HK/CN Grace Wu CMB (3968 HK) SG KR TW IN PH
Analysts’ company visits
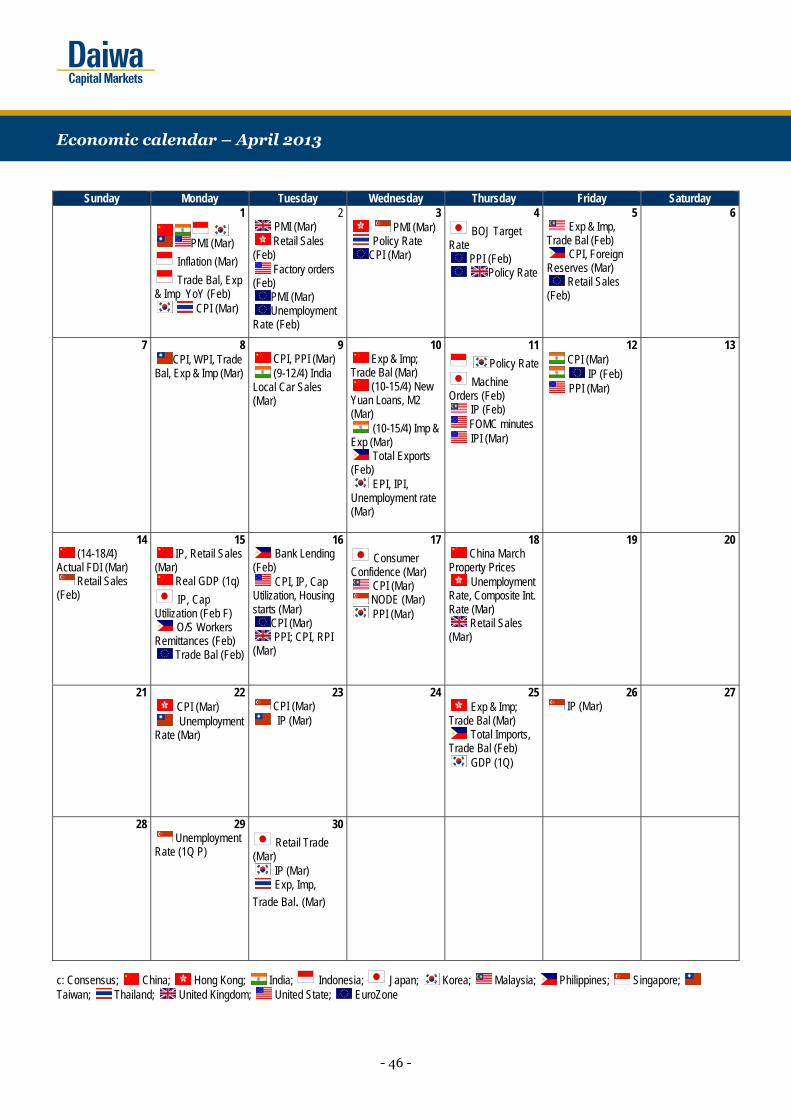
- 46 -
Sunday Monday Tuesday Wednesday Thursday Friday Saturday
1
PMI (Mar)
Inflation (Mar)
Trade Bal, Exp & Imp YoY (Feb)
CPI (Mar)
2 PMI (Mar) Retail Sales
(Feb) Factory orders
(Feb) PMI (Mar) Unemployment
Rate (Feb)
3 PMI (Mar) Policy Rate CPI (Mar)
4
BOJ Target Rate
PPI (Feb) Policy Rate
5 Exp & Imp,
Trade Bal (Feb) CPI, Foreign
Reserves (Mar) Retail Sales
(Feb)
6
7 8CPI, WPI, Trade
Bal, Exp & Imp (Mar)
9 CPI, PPI (Mar) (9-12/4) India
Local Car Sales (Mar)
10 Exp & Imp;
Trade Bal (Mar) (10-15/4) New
Yuan Loans, M2 (Mar)
(10-15/4) Imp & Exp (Mar)
Total Exports (Feb)
EPI, IPI, Unemployment rate (Mar)
11
Policy Rate
Machine Orders (Feb)
IP (Feb) FOMC minutes IPI (Mar)
12 CPI (Mar) IP (Feb) PPI (Mar)
13
14 (14-18/4)
Actual FDI (Mar) Retail Sales
(Feb)
15 IP, Retail Sales
(Mar) Real GDP (1q)
IP, Cap Utilization (Feb F)
O/S Workers Remittances (Feb)
Trade Bal (Feb)
16 Bank Lending
(Feb) CPI, IP, Cap
Utilization, Housing starts (Mar)
CPI (Mar) PPI; CPI, RPI
(Mar)
17
Consumer Confidence (Mar)
CPI (Mar) NODE (Mar) PPI (Mar)
18 China March
Property Prices Unemployment
Rate, Composite Int. Rate (Mar)
Retail Sales (Mar)
19 20
21 22 CPI (Mar) Unemployment
Rate (Mar)
23 CPI (Mar) IP (Mar)
24 25 Exp & Imp;
Trade Bal (Mar) Total Imports,
Trade Bal (Feb) GDP (1Q)
26 IP (Mar)
27
28 29 Unemployment
Rate (1Q P)
30
Retail Trade (Mar)
IP (Mar) Exp, Imp,
Trade Bal. (Mar)
c: Consensus; China; Hong Kong; India; Indonesia; Japan; Korea; Malaysia; Philippines; Singapore; Taiwan; Thailand; United Kingdom; United State; EuroZone
Economic calendar – September 2011 Economic calendar – April 2013

- 47 -
Rating and target-price information Bloomberg 6M rating 6M target price* Company name code Country Previous Latest Previous Latest DateChina COSCO 1919 HK China Buy – Buy 5.6 ↓ 4.5 28-Mar-13Air China 753 HK China Buy – Buy 8.6 ↓ 8.0 28-Mar-13Doosan Infracore 042670 KS Korea Hold – Hold 16,500 ↓ 15,000 28-Mar-13Daphne International 210 HK China Outperform – Outperform 11.4 ↓ 11.1 28-Mar-13CapitaCommercial Trust CCT SP Singapore Hold – Hold 1.59 ↑ 1.61 28-Mar-13Chailease Holding 5871 TT Taiwan Buy – Buy 83 ↑ 96 28-Mar-13China Communications Construction 1800 HK China Hold ↑ Outperform 7.21 ↑ 8.06 27-Mar-13AviChina Industry & Technology 2357 HK China Buy – Buy 4.7 ↑ 5.0 27-Mar-13ENN Energy 2688 HK China Buy – Buy 43.0 ↑ 48.5 27-Mar-13Jiangsu Expressway 177 HK China Outperform – Outperform 7.7 ↑ 8.4 26-Mar-13Wharf Holdings 4 HK Hong Kong Buy – Buy 72.4 ↑ 78.0 26-Mar-13Belle International 1880 HK China Underperform – Underperform 15.6 ↓ 12.5 26-Mar-13S1 Corporation 012750 KS Korea Outperform – Outperform 73,000 ↓ 70,000 26-Mar-13Hon Hai Precision Industry 2317 TT Taiwan Buy – Buy 127 ↓ 112 26-Mar-13Sheng Siong Group SSG SP Singapore n.a. → Buy n.a. → 0.8 25-Mar-13E.Sun Financial 2884 TT Taiwan Buy – Buy 18 ↑ 21 25-Mar-13Fubon Financial Holding 2881 TT Taiwan Buy – Buy 42.2 ↑ 49.2 25-Mar-13Mega Financial 2886 TT Taiwan Buy – Buy 26 ↑ 28 25-Mar-13Sinopec Corp 386 HK China Underperform – Underperform 7.6 ↑ 7.8 25-Mar-13Hyundai Department Store 069960 KS Korea Buy – Buy 180,000 ↑ 190,000 25-Mar-13China State Construction International 3311 HK China Buy – Buy 12.3 ↑ 12.47 22-Mar-13SK Hynix 000660 KS Korea Buy – Buy 32,000 ↑ 35,000 22-Mar-13
Note: Daiwa’s 20 most recent rating/target-price changes *Local currency; D: delisted
Recently published reports
Research reports* Subtitle No. of pages
Date of publication
Discovery Asia small-cap weekly 14 28-Mar-13Taiwan Strategy Positioning for a better 2Q13 11 27-Mar-13Regional Economy QE uncertainty, China’s import shortfall and other crosswinds 15 26-Mar-13Sheng Siong Group Initiation: leading Singapore supermarket player 27 25-Mar-13China Cement and Steel Weekly Seasonal boost starts to kick in 9 25-Mar-13Taiwan Financial Sector Silver lining in prospect 27 25-Mar-13Hong Kong Strategy Is Hong Kong Inc. ready to make the jump? 127 22-Mar-13Discovery Asia small-cap weekly 18 22-Mar-13China State Construction International Positive prospects ahead 13 22-Mar-13Korea Construction Sector Still cold in the suburbs… 19 21-Mar-13Talking Tech Three key growth themes 11 20-Mar-13Global Logistic Properties The song remains the same 13 20-Mar-13India Power Utilities & Capital Goods Sectors
Cutting through the noise 74 18-Mar-13
China Cement and Steel Weekly Cement facing some headwinds 9 18-Mar-13Coal India Pessimism looks overdone 25 18-Mar-13China Strategy National People's Congress: a new direction 18 18-Mar-13Discovery Asia small-cap weekly 17 15-Mar-13Iskandar Industrial-Property Market The lure of Iskandar for SMEs 10 12-Mar-13China Cement and Steel Weekly Seeing upward momentum – steel 9 11-Mar-13Hindalco Industries Share-price correction offers a good entry point 19 11-Mar-13
*The 20 most recent reports published by Daiwa
Asia Pacific Markets Closed
Hong Kong
China Singapore Malaysia Korea Taiwan AustraliaNew
ZealandIndia Thailand Philippines Indonesia
Apr 13 1, 4 4-5 4-5 1, 25 1, 25 19, 24 8, 15-16 9
- 48 -
Daiwa’s Asia Pacific Research Directory
SOUTH KOREA
Chang H LEE (82) 2 787 9177 [email protected] Head of Korea Research; Strategy; Banking/Finance
Sung Yop CHUNG (82) 2 787 9157 [email protected] Pan-Asia Co-head/Regional Head of Automobiles and Components; Automobiles; Shipbuilding; Steel
Jun Yong BANG (82) 2 787 9168 [email protected] Automobiles and Components; Chemical
Anderson CHA (82) 2 787 9185 [email protected] Banking/Finance
Mike OH (82) 2 787 9179 [email protected] Capital Goods (Construction and Machinery)
Sang Hee PARK (82) 2 787 9165 [email protected] Consumer/Retail
Jae H LEE (82) 2 787 9173 [email protected] IT/Electronics (Tech Hardware and Memory Chips)
Joshua OH (82) 2 787 9176 [email protected] IT/Electronics (Handset Components)
Thomas Y KWON (82) 2 787 9181 [email protected] Pan-Asia Head of Internet & Telecommunications; Software (Korea) – Internet/On-line Game
TAIWAN
Mark CHANG (886) 2 8758 6245 [email protected] Head of Research; Regional Head of Small/Medium Cap; Small/Medium Cap (Regional)
Birdy LU (886) 2 8758 6248 [email protected] IT/Technology Hardware (Handsets and Components)
Steven TSENG (886) 2 8758 6252 [email protected] IT/Technology Hardware (PC Hardware)
Christine WANG (886) 2 8758 6249 [email protected] IT/Technology Hardware (Automation); Cement
Lynn CHENG (886) 2 8758 6253 [email protected] IT/Electronics (Semiconductor)
Rita HSU (886) 2 8758 6254 [email protected] Small/Mid Cap
INDIA
Punit SRIVASTAVA (91) 22 6622 1013 [email protected] Head of Research; Strategy; Banking/Finance
Navin MATTA (91) 22 6622 8411 [email protected] Automobiles and Components
Saurabh MEHTA (91) 22 6622 1009 [email protected] Capital Goods; Utilities
Mihir SHAH (91) 22 6622 1020 [email protected] FMCG/Consumer
Deepak PODDAR (91) 22 6622 1016 [email protected]
Materials
Nirmal RAGHAVAN (91) 22 6622 1018 [email protected] Oil and Gas; Utilities
SINGAPORE
Adrian LOH (65) 6499 6548 [email protected] Head of Singapore Research, Regional Head of Oil and Gas; Oil and Gas (ASEAN and China); Capital Goods (Singapore)
Srikanth VADLAMANI (65) 6499 6570 [email protected] Banking (ASEAN)
David LUM (65) 6329 2102 [email protected] Property and REITs
Ramakrishna MARUVADA (65) 6499 6543 [email protected] Head of ASEAN & India Telecommunications; Telecommunications (ASEAN & India)
HONG KONG
Hiroaki KATO (852) 2532 4121 [email protected] Regional Research Head
John HETHERINGTON (852) 2773 8787 [email protected] Regional Deputy Head of Asia Pacific Research; Regional Head of Product Management
Pranab Kumar SARMAH (852) 2848 4441 [email protected] Regional Head of Research Promotion
Mingchun SUN (852) 2773 8751 [email protected] Head of China Research; Chief Economist (Regional)
Dave DAI (852) 2848 4068 [email protected] Deputy Head of Hong Kong and China Research; Pan-Asia/Regional Head of Clean Energy and Utilities; Utilities; Power Equipment; Renewables (Hong Kong, China)
Kevin LAI (852) 2848 4926 [email protected] Deputy Head of Regional Economics; Macro Economics (Regional)
Chi SUN (852) 2848 4427 [email protected] Macro Economics (China)
Christie CHIEN (852) 2848 4482 [email protected] Macro Economics (Taiwan)
Jonas KAN (852) 2848 4439 [email protected] Head of Hong Kong Research; Head of Hong Kong and China Property; Regional Property Coordinator; Property Developers (Hong Kong)
Jeff CHUNG (852) 2773 8783 [email protected] Automobiles and Components (China)
Grace WU (852) 2532 4383 [email protected] Head of Greater China FIG; Banking (Hong Kong, China)
Jerry YANG (852) 2773 8842 [email protected] Banking (Taiwan)/Diversified Financials (Taiwan and China)
Leon QI (852) 2532 4381 [email protected] Banking (Hong Kong, China)
Joseph HO (852) 2848 4443 [email protected] Head of Industrials and Machineries (Hong Kong, China); Capital Goods –Electronics Equipments and Machinery (Hong Kong, China)
Winston CAO (852) 2848 4469 [email protected] Capital Goods – Machinery (China)
Bing ZHOU (852) 2773 8782 [email protected] Consumer/Retail (Hong Kong, China); Hotels, Restaurants and Leisure - Casinos and Gaming (Hong Kong, Macau)
Cris XU (852) 2773 8736 [email protected] Household & Personal Products (China)
Eric CHEN (852) 2773 8702 [email protected] Pan-Asia/Regional Head of IT/Electronics; Semiconductor/IC Design (Regional)
Felix LAM (852) 2532 4341 [email protected] Head of Materials (Hong Kong, China); Cement and Building Materials (China, Taiwan); Property (China)
John CHOI (852) 2773 8730 [email protected] Head of Multi-Industries (Hong Kong, China); Small/Mid Cap (Regional); Internet (China)
Joey CHEN (852) 2848 4483 [email protected] Steel (China)
Kelvin LAU (852) 2848 4467 [email protected] Head of Transportation (Hong Kong, China); Hong Kong and China Research Coordinator; Transportation (Regional)
Jibo MA (852) 2848 4489 [email protected] Head of Custom Products Group; Custom Products Group
Thomas HO (852) 2773 8716 [email protected] Custom Products Group
PHILIPPINES
Rommel RODRIGO (63) 2 813 7344 ext 302
Head of Philippines Research; Strategy; Capital Goods; Materials
- 49 -
Daiwa’s Offices
Office / Branch / Affiliate Address Tel Fax
DAIWA SECURITIES GROUP INC
HEAD OFFICE Gran Tokyo North Tower, 1-9-1, Marunouchi, Chiyoda-ku, Tokyo, 100-6753 (81) 3 5555 3111 (81) 3 5555 0661
Daiwa Securities Trust Company One Evertrust Plaza, Jersey City, NJ 07302, U.S.A. (1) 201 333 7300 (1) 201 333 7726
Daiwa Securities Trust and Banking (Europe) PLC (Head Office) 5 King William Street, London EC4N 7JB, United Kingdom (44) 207 320 8000 (44) 207 410 0129
Daiwa Europe Trustees (Ireland) Ltd Level 3, Block 5, Harcourt Centre, Harcourt Road, Dublin 2, Ireland (353) 1 603 9900 (353) 1 478 3469
Daiwa Capital Markets America Inc Financial Square, 32 Old Slip, New York, NY10005, U.S.A. (1) 212 612 7000 (1) 212 612 7100
Daiwa Capital Markets America Inc. San Francisco Branch 555 California Street, Suite 3360, San Francisco, CA 94104, U.S.A. (1) 415 955 8100 (1) 415 956 1935
Daiwa Capital Markets Europe Limited 5 King William Street, London EC4N 7AX, United Kingdom (44) 20 7597 8000 (44) 20 7597 8600
Daiwa Capital Markets Europe Limited, Frankfurt Branch Trianon Building, Mainzer Landstrasse 16, 60325 Frankfurt am Main, Federal Republic of Germany
(49) 69 717 080 (49) 69 723 340
Daiwa Capital Markets Europe Limited, Paris Representative Office 36, rue de Naples, 75008 Paris, France (33) 1 56 262 200 (33) 1 47 550 808
Daiwa Capital Markets Europe Limited, London, Geneva Branch 50 rue du Rhône, P.O.Box 3198, 1211 Geneva 3, Switzerland (41) 22 818 7400 (41) 22 818 7441
Daiwa Capital Markets Europe Limited, Moscow Representative Office
Midland Plaza 7th Floor, 10 Arbat Street, Moscow 119002, Russian Federation
(7) 495 641 3416 (7) 495 775 6238
Daiwa Capital Markets Europe Limited, Bahrain Branch 7th Floor, The Tower, Bahrain Commercial Complex, P.O. Box 30069, Manama, Bahrain
(973) 17 534 452 (973) 17 535 113
Daiwa Capital Markets Hong Kong Limited Level 28, One Pacific Place, 88 Queensway, Hong Kong (852) 2525 0121 (852) 2845 1621
Daiwa Capital Markets Singapore Limited 6 Shenton Way #26-08, DBS Building Tower Two, Singapore 068809, Republic of Singapore
(65) 6220 3666 (65) 6223 6198
Daiwa Capital Markets Australia Limited Level 34, Rialto North Tower, 525 Collins Street, Melbourne, Victoria 3000, Australia
(61) 3 9916 1300 (61) 3 9916 1330
DBP-Daiwa Capital Markets Philippines, Inc 18th Floor, Citibank Tower, 8741 Paseo de Roxas, Salcedo Village, Makati City, Republic of the Philippines
(632) 813 7344 (632) 848 0105
Daiwa-Cathay Capital Markets Co Ltd 14/F, 200, Keelung Road, Sec 1, Taipei, Taiwan, R.O.C. (886) 2 2723 9698 (886) 2 2345 3638
Daiwa Securities Capital Markets Korea Co., Ltd. One IFC, 10 Gukjegeumyung-Ro, Yeouido-dong, Yeongdeungpo-gu, Seoul, 150-876, Korea
(82) 2 787 9100 (82) 2 787 9191
Daiwa Securities Capital Markets Co Ltd, Beijing Representative Office
Room 3503/3504, SK Tower, No.6 Jia Jianguomen Wai Avenue, Chaoyang District, Beijing 100022, People’s Republic of China
(86) 10 6500 6688 (86) 10 6500 3594
Daiwa SSC Securities Co Ltd 45/F, Hang Seng Tower, 1000 Lujiazui Ring Road, Pudong, Shanghai 200120, People’s Republic of China
(86) 21 3858 2000 (86) 21 3858 2111
Daiwa Securities Capital Markets Co. Ltd, Bangkok Representative Office
18th Floor, M Thai Tower, All Seasons Place, 87 Wireless Road, Lumpini, Pathumwan, Bangkok 10330, Thailand
(66) 2 252 5650 (66) 2 252 5665
Daiwa Capital Markets India Private Ltd 10th Floor, 3 North Avenue, Maker Maxity, Bandra Kurla Complex, Bandra East, Mumbai – 400051, India
(91) 22 6622 1000 (91) 22 6622 1019
Daiwa Securities Capital Markets Co. Ltd, Hanoi Representative Office
Suite 405, Pacific Palace Building, 83B, Ly Thuong Kiet Street, Hoan Kiem Dist. Hanoi, Vietnam
(84) 4 3946 0460 (84) 4 3946 0461
DAIWA INSTITUTE OF RESEARCH LTD
HEAD OFFICE 15-6, Fuyuki, Koto-ku, Tokyo, 135-8460, Japan (81) 3 5620 5100 (81) 3 5620 5603
MARUNOUCHI OFFICE Gran Tokyo North Tower, 1-9-1, Marunouchi, Chiyoda-ku, Tokyo, 100-6756 (81) 3 5555 7011 (81) 3 5202 2021
New York Research Center 11th Floor, Financial Square, 32 Old Slip, NY, NY 10005-3504, U.S.A. (1) 212 612 6100 (1) 212 612 8417
London Research Centre 3/F, 5 King William Street, London, EC4N 7AX, United Kingdom (44) 207 597 8000 (44) 207 597 8550

- 50 -
Notes concerning market data and investment indicators Estimates by Daiwa Shares outstanding: Common shares outstanding (excl. treasury stock) Market cap: Based on shares outstanding and closing price as of indicated date EV: Market cap + interest-bearing debt – liquidity on hand EBITDA: Operating profit + depreciation ROE: Net income / average of start-FY and end-FY shareholders’ equity (for SEC-reporting firms net income attributable to shareholders
of the parent / average of start-FY and end-FY shareholders’ equity) Share Price Chart and per-share figures retroactively adjusted to reflect stock splits/reverse stock splits

- 51 -
Disclaimer This publication is produced by Daiwa Securities Group Inc. and/or its non-U.S. affiliates, and distributed by Daiwa Securities Group Inc. and/or its non-U.S. affiliates, except to the extent expressly provided herein. This publication and the contents hereof are intended for information purposes only, and may be subject to change without further notice. Any use, disclosure, distribution, dissemination, copying, printing or reliance on this publication for any other purpose without our prior consent or approval is strictly prohibited. Neither Daiwa Securities Group Inc. nor any of its respective parent, holding, subsidiaries or affiliates, nor any of its respective directors, officers, servants and employees, represent nor warrant the accuracy or completeness of the information contained herein or as to the existence of other facts which might be significant, and will not accept any responsibility or liability whatsoever for any use of or reliance upon this publication or any of the contents hereof. Neither this publication, nor any content hereof, constitute, or are to be construed as, an offer or solicitation of an offer to buy or sell any of the securities or investments mentioned herein in any country or jurisdiction nor, unless expressly provided, any recommendation or investment opinion or advice. Any view, recommendation, opinion or advice expressed in this publication may not necessarily reflect those of Daiwa Securities Capital Markets Co. Ltd., and/or its affiliates nor any of its respective directors, officers, servants and employees except where the publication states otherwise. This research report is not to be relied upon by any person in making any investment decision or otherwise advising with respect to, or dealing in, the securities mentioned, as it does not take into account the specific investment objectives, financial situation and particular needs of any person.
Daiwa Securities Group Inc., its subsidiaries or affiliates, or its or their respective directors, officers and employees from time to time have trades as principals, or have positions in, or have other interests in the securities of the company under research including derivatives in respect of such securities or may have also performed investment banking and other services for the issuer of such securities. The following are additional disclosures.
IMPORTANT This report is provided as a reference for making investment decisions and is not intended to be a solicitation for investment. Investment decisions should be made at your own discretion and risk. Content herein is based on information available at the time the report was prepared and may be amended or otherwise changed in the future without notice. We make no representations as to the accuracy or completeness. Daiwa Securities Co. Ltd. retains all rights related to the content of this report, which may not be redistributed or otherwise transmitted without prior consent. Ratings Issues are rated 1, 2, 3, 4, or 5 as follows:
1: Outperform TOPIX/benchmark index by more than 15% over the next six months. 2: Outperform TOPIX/benchmark index by 5-15% over the next six months. 3: Out/underperform TOPIX/benchmark index by less than 5% over the next six months. 4: Underperform TOPIX/benchmark index by 5-15% over the next six months. 5: Underperform TOPIX/benchmark index by more than 15% over the next six months.
Benchmark index: TOPIX for Japan, S&P 500 for US, DJ STOXX 600 for Europe, HSI for Hong Kong, STI for Singapore, KOSPI for Korea, TWII for Taiwan, and S&P/ASX 200 for Australia.
Japan
Conflicts of Interest: Daiwa Securities Co. Ltd. may currently provide or may intend to provide investment banking services or other services to the company referred to in this report. In such cases, said services could give rise to conflicts of interest for Daiwa Securities Co. Ltd. Daiwa Securities Co. Ltd. and Daiwa Securities Group Inc.: Daiwa Securities Co. Ltd. is a subsidiary of Daiwa Securities Group Inc. Ownership of Securities: Daiwa Securities Co. Ltd. may currently, or in the future, own or trade either securities issued by the company referred to in this report or other securities based on such financial instruments. Daiwa Securities Group has filed major shareholding reports for the following companies of which it owns over 5% (as of 15 October 2012): Sumitomo Mitsui Construction (1821); Enigmo (3665); Septeni Holdings (4293); Take And Give. Needs (4331); RaQualia Pharma (4579); Mebiopharm (4580); Okabe (5959); Okada Aiyon (6294); SNT (6319); MCJ (6670); Meisei Electric (6709); MegaChips (6875); Sansha Electric Mfg. (6882); Astmax (7162); Shinseido (7415); Daiko Denshi Tsushin (8023); Money Partners Group (8732); Daiwa Office Investment Corporation (8976); Kadokawa Group Holdings (9477); Imperial Hotel (9708); Valor (9956). Lead Management: Daiwa Securities Co. Ltd. has lead-managed public offerings and/or secondary offerings (excluding straight bonds) in the past twelve months for the following companies: Nihon M&A Center (2127); SMS (2175); DAIYU EIGHT CO. (2662); BRONCO BILLY (3091); Yashima Denki (3153); Aisei Pharmacy (3170); Poletowin Pitcrew Holdings (3657); m-up, (3661); Ateam (3662); Enigmo (3665); Awa Paper MFG Co. (3896); Chiome Bioscience (4583); Livesense (6054); UCHIYAMA HOLDINGS Co. (6059); Cocolonet Co. (6060); UNIVERSAL ENGEISHA CO. (6061); CHARM CARE CORPORATION (6062); Trenders (6069); Anritsu (6754); Financial Products Group Co. (7148); Takasho Co. (7590); Wakita & Co. (8125); eGuarantee (8771); Frontier Real Estate Investment Corporation (8964); Japan Hotel REIT Investment Corporation (8985); Japan Airlines (9201); Star Flyer (9206); STEP CO. (9795). (list as of 1 November 2012) Notification items pursuant to Article 37 of the Financial Instruments and Exchange Law
(This Notification is only applicable to where report is distributed by Daiwa Securities Co. Ltd.) If you decide to enter into a business arrangement with our company based on the information described in this report, we ask you to pay close attention to the following items. In addition to the purchase price of a financial instrument, our company will collect a trading commission* for each transaction as agreed beforehand with you. Since commissions may be
included in the purchase price or may not be charged for certain transactions, we recommend that you confirm the commission for each transaction. In some cases, our company also may charge a maximum of ¥ 2 million (including tax) per year as a standing proxy fee for our deposit of your securities, if you are a non-resident.
For derivative and margin transactions etc., our company may require collateral or margin requirements in accordance with an agreement made beforehand with you. Ordinarily in such cases, the amount of the transaction will be in excess of the required collateral or margin requirements.
There is a risk that you will incur losses on your transactions due to changes in the market price of financial instruments based on fluctuations in interest rates, exchange rates, stock prices, real estate prices, commodity prices, and others. In addition, depending on the content of the transaction, the loss could exceed the amount of the collateral or margin requirements.
There may be a difference between bid price etc. and ask price etc. of OTC derivatives handled by our company. Before engaging in any trading, please thoroughly confirm accounting and tax treatments regarding your trading in financial instruments with such experts as certified public accountants. * The amount of the trading commission cannot be stated here in advance because it will be determined between our company and you based on current market conditions and the content of each transaction etc. When making an actual transaction, please be sure to carefully read the materials presented to you prior to the execution of agreement, and to take responsibility for your own decisions regarding the signing of the agreement with our company.
Corporate Name: Daiwa Securities Co. Ltd. Financial instruments firm: chief of Kanto Local Finance Bureau (Kin-sho) No.108 Memberships: Japan Securities Dealers Association, The Financial Futures Association of Japan, Japan Investment Advisers Association, Type II Financial Instruments Firms Association
Disclosure of Interest of Thanachart Securities
Investment Banking Relationship
Within the preceding 12 months, Thanachart Securities has lead-managed public offerings and/or secondary offerings (excluding straight bonds) of the securities of the following companies: OfficeMate Pcl (OFM TB); Asia Aviation Pcl (AAV TB).
Hong Kong
This research is distributed in Hong Kong by Daiwa Capital Markets Hong Kong Limited (“DHK”) which is regulated by the Hong Kong Securities and Futures Commission. Recipients of this research in Hong Kong may contact DHK in respect of any matter arising from or in connection with this research. Ownership of Securities For “Ownership of Securities” information, please visit BlueMatrix disclosure Link at https://daiwa3.bluematrix.com/sellside/Disclosures.action. Investment Banking Relationship For “Investment Banking Relationship”, please visit BlueMatrix disclosure Link at https://daiwa3.bluematrix.com/sellside/Disclosures.action. Relevant Relationship (DHK) DHK may from time to time have an individual employed by or associated with it serves as an officer of any of the companies under its research coverage. DHK market making DHK may from time to time make a market in securities covered by this research.
- 52 -
Korea
The developing analyst of this research and analysis material hereby states and confirms that the contents of this material correctly reflect the analyst’s views and opinions and that the analyst has not been placed under inappropriate pressure or interruption by an external party. Name of Analyst: Mike Oh Disclosure of Analysts’ Interests If an analyst engaging in or a person who exercises influences on the preparation or publication of a Research Report containing recommendations for general investors to trade financial investment instruments with regard to which the analyst or the influential person has personal interests and if the recommendations contained in the Report may have impacts on the personal interests, Daiwa Securities Capital Markets Korea Co., Ltd.(“Daiwa Securities Korea”)shall ensure that the Analyst or the influential person notifies that he/she has personal interests with regard to: 1. The equity, the equity-linked bonds and the instruments with the subscription right to the equity issued by the legal entity covered in the Research Report (or the legal entity subject to the
investment recommendations); 2. The stock option granted by the legal entity covered in the Research Report (or the legal entity subject to the investment recommendations); or 3. The equity futures, the equity options and the equity-linked warrants backed by the equity prescribed in the preceding Paragraph 1 as the underlying assets. Legal Entities subject to Research Report Coverage Restrictions Daiwa Securities Korea hereby states and confirms that Daiwa Securities Korea has no conflicts of interests with the legal entity covered in this Research Report: 1. In that Daiwa Securities Korea does NOT offer direct or indirect payment guarantee for the legal entity by means of, for instance, guarantee, endorsement, provision of collaterals or the
acquisition of debts; 2. In that Daiwa Securities Korea does NOT own one-hundredth (or 1/100) or more of the total number of outstanding equities issued by the legal entity; 3. In that The legal entity is NOT an affiliated company of Daiwa Securities Korea pursuant to Sub-paragraph 3, Article 2 of the Monopoly Regulation and Fair Trade Act of Korea; 4. In that, although Daiwa Securities Korea offers advisory services for the legal entity with regard to an M&A deal, the size of the M&A deal does NOT exceed five-hundredths (or 5/100) of
the total asset size or the total number of equities issued and outstanding of the legal entity; 5. In that, although Daiwa Securities Korea acted in the capacity of a Lead Underwriter for the initial public offering of the legal entity, more than one-year has passed since the IPO date; 6. In that Daiwa Securities Korea is NOT designated by the legal entity as the ‘tender offer agent’ pursuant to the Paragraph 2, Article 133 of the Financial Services and Capital Market Act or
the legal entity is NOT the issuer of the equity subject to the proposed tender offer; this requirement, however applies until the maturity of the tender offer period; or 7. In that Daiwa Securities Korea does NOT have significant or material interests with regard to the legal entity. Disclosure of Prior Distribution to Third Party This report has not been distributed to the third party in advance prior to public release. The following explains the rating system in the report as compared to KOSPI, based on the beliefs of the author(s) of this report. "1": the security could outperform the KOSPI by more than 15% over the next six months. "2": the security is expected to outperform the KOSPI by 5-15% over the next six months. "3": the security is expected to perform within 5% of the KOSPI (better or worse) over the next six months. "4": the security is expected to underperform the KOSPI by 5-15% over the next six months. "5": the security could underperform the KOSPI by more than 15% over the next six months. “Positive” means that the analyst expects the sector to outperform the KOSPI over the next six months. “Neutral” means that the analyst expects the sector to be in-line with the KOSPI over the next six months “Negative” means that the analyst expects the sector to underperform the KOSPI over the next six months Additional information may be available upon request.
Singapore
This research is distributed in Singapore by Daiwa Capital Markets Singapore Limited and it may only be distributed in Singapore to accredited investors, expert investors and institutional investors as defined in the Financial Advisers Regulations and the Securities and Futures Act (Chapter 289), as amended from time to time. By virtue of distribution to these category of investors, Daiwa Capital Markets Singapore Limited and its representatives are not required to comply with Section 36 of the Financial Advisers Act (Chapter 110) (Section 36 relates to disclosure of Daiwa Capital Markets Singapore Limited’s interest and/or its representative’s interest in securities). Recipients of this research in Singapore may contact Daiwa Capital Markets Singapore Limited in respect of any matter arising from or in connection with the research.
Australia
This research is distributed in Australia by Daiwa Capital Markets Stockbroking Limited and it may only be distributed in Australia to wholesale investors within the meaning of the Corporations Act. Recipients of this research in Australia may contact Daiwa Capital Markets Stockbroking Limited in respect of any matter arising from or in connection with the research.
Ownership of Securities For “Ownership of Securities” information, please visit BlueMatrix disclosure Link at https://daiwa3.bluematrix.com/sellside/Disclosures.action.
India
This research is distributed by Daiwa Capital Markets India Private Limited (DAIWA) which is an intermediary registered with Securities & Exchange Board of India. This report is not to be considered as an offer or solicitation for any dealings in securities. While the information in this report has been compiled by DAIWA in good faith from sources believed to be reliable, no representation or warranty, express of implied, is made or given as to its accuracy, completeness or correctness. DAIWA its officers, employees, representatives and agents accept no liability whatsoever for any loss or damage whether direct, indirect, consequential or otherwise howsoever arising (whether in negligence or otherwise) out of or in connection with or from any use of or reliance on the contents of and/or omissions from this document. Consequently DAIWA expressly disclaims any and all liability for, or based on or relating to any such information contained in or errors in or omissions in this report. Accordingly, you are recommended to seek your own legal, tax or other advice and should rely solely on your own judgment, review and analysis, in evaluating the information in this document. The data contained in this document is subject to change without any prior notice DAIWA reserves its right to modify this report as maybe required from time to time. DAIWA is committed to providing independent recommendations to its Clients and would be happy to provide any information in response to any query from its Clients. This report is strictly confidential and is being furnished to you solely for your information. The information contained in this document should not be reproduced (in whole or in part) or redistributed in any form to any other person. We and our group companies, affiliates, officers, directors and employees may from time to time, have long or short positions, in and buy sell the securities thereof, of company(ies) mentioned herein or be engaged in any other transactions involving such securities and earn brokerage or other compensation or act as advisor or have the potential conflict of interest with respect to any recommendation and related information or opinion. DAIWA prohibits its analyst and their family members from maintaining a financial interest in the securities or derivatives of any companies that the analyst cover. This report is not intended or directed for distribution to, or use by any person, citizen or entity which is resident or located in any state or country or jurisdiction where such publication, distribution or use would be contrary to any statutory legislation, or regulation which would require DAIWA and its affiliates/ group companies to any registration or licensing requirements. The views expressed in the report accurately reflect the analyst’s personal views about the securities and issuers that are subject of the Report, and that no part of the analyst’s compensation was, is or will be directly or indirectly, related to the recommendations or views expressed in the Report. This report does not recommend to US recipients the use of Daiwa Capital Markets India Private Limited or any of its non – US affiliates to effect trades in any securities and is not supplied with any understanding that US recipients will direct commission business to Daiwa Capital Markets India Private Limited.
Taiwan
This research is distributed in Taiwan by Daiwa-Cathay Capital Markets Co., Ltd and it may only be distributed in Taiwan to institutional investors or specific investors who have signed recommendation contracts with Daiwa-Cathay Capital Markets Co., Ltd in accordance with the Operational Regulations Governing Securities Firms Recommending Trades in Securities to Customers. Recipients of this research in Taiwan may contact Daiwa-Cathay Capital Markets Co., Ltd in respect of any matter arising from or in connection with the research.
Philippines
This research is distributed in the Philippines by DBP-Daiwa Capital Markets Philippines, Inc. which is regulated by the Philippines Securities and Exchange Commission and the Philippines Stock Exchange, Inc. Recipients of this research in the Philippines may contact DBP-Daiwa Capital Markets Philippines, Inc. in respect of any matter arising from or in connection with the research. DBP-Daiwa Capital Markets Philippines, Inc. recommends that investors independently assess, with a professional advisor, the specific financial risks as well as the legal, regulatory, tax, accounting, and other consequences of a proposed transaction. DBP-Daiwa Capital Markets Philippines, Inc. may have positions or may be materially interested in the securities in any of the markets mentioned in the publication or may have performed other services for the issuers of such securities.
For relevant securities and trading rules please visit SEC and PSE Link at http://www.sec.gov.ph/irr/AmendedIRRfinalversion.pdf and http://www.pse.com.ph/ respectively.

- 53 -
United Kingdom
This research report is produced by Daiwa Securities Capital Markets Co., Ltd and/or its affiliates and is distributed by Daiwa Capital Markets Europe Limited in the European Union, Iceland, Liechtenstein, Norway and Switzerland. Daiwa Capital Markets Europe Limited is authorised and regulated by The Financial Services Authority (“FSA”) and is a member of the London Stock Exchange, Chi-X, Eurex and NYSE Liffe. Daiwa Capital Markets Europe Limited and its affiliates may, from time to time, to the extent permitted by law, participate or invest in other financing transactions with the issuers of the securities referred to herein (the “Securities”), perform services for or solicit business from such issuers, and/or have a position or effect transactions in the Securities or options thereof and/or may have acted as an underwriter during the past twelve months for the issuer of such securities. In addition, employees of Daiwa Capital Markets Europe Limited and its affiliates may have positions and effect transactions in such securities or options and may serve as Directors of such issuers. Daiwa Capital Markets Europe Limited may, to the extent permitted by applicable UK law and other applicable law or regulation, effect transactions in the Securities before this material is published to recipients.
This publication is intended for investors who are not Retail Clients in the United Kingdom within the meaning of the Rules of the FSA and should not therefore be distributed to such Retail Clients in the United Kingdom. Should you enter into investment business with Daiwa Capital Markets Europe’s affiliates outside the United Kingdom, we are obliged to advise that the protection afforded by the United Kingdom regulatory system may not apply; in particular, the benefits of the Financial Services Compensation Scheme may not be available.
Daiwa Capital Markets Europe Limited has in place organisational arrangements for the prevention and avoidance of conflicts of interest. Our conflict management policy is available at http://www.uk.daiwacm.com/about-us/corporate-governance-and-regulatory. Regulatory disclosures of investment banking relationships are available at https://daiwa3.bluematrix.com/sellside/Disclosures.action.
Germany
This document has been approved by Daiwa Capital Markets Europe Limited and is distributed in Germany by Daiwa Capital Markets Europe Limited, Niederlassung Frankfurt which is regulated by BaFin (Bundesanstalt fuer Finanzdienstleistungsaufsicht) for the conduct of business in Germany.
Bahrain
This research material is issued/compiled by Daiwa Capital Markets Europe Limited, Bahrain Branch, regulated by The Central Bank of Bahrain and holds Investment Business Firm – Category 2 license and having its official place of business at the Bahrain World Trade Centre, South Tower, 7th floor, P.O. Box 30069, Manama, Kingdom of Bahrain. Tel No. +973 17534452 Fax No. +973 535113
This material is provided as a reference for making investment decisions and is not intended to be a solicitation for investment. Investment decisions should be made at your own discretion and risk. Accordingly, no representation or warranty, express or implied, is made as to and no reliance should be placed on the fairness, accuracy, completeness or correctness of the information and opinions contained in this document, Content herein is based on information available at the time the research material was prepared and may be amended or otherwise changed in the future without notice. All information is intended for the private use of the person to whom it is provided without any liability whatsoever on the part of Daiwa Capital Markets Europe Limited, Bahrain Branch, any associated company or the employees thereof. If you are in doubt about the suitability of the product or the research material itself, please consult your own financial adviser. Daiwa Capital Markets Europe Limited, Bahrain Branch retains all rights related to the content of this material, which may not be redistributed or otherwise transmitted without prior consent.
United States
This report is distributed in the U.S. by Daiwa Capital Markets America Inc. (DCMA). It may not be accurate or complete and should not be relied upon as such. It reflects the preparer’s views at the time of its preparation, but may not reflect events occurring after its preparation; nor does it reflect DCMA’s views at any time. Neither DCMA nor the preparer has any obligation to update this report or to continue to prepare research on this subject. This report is not an offer to sell or the solicitation of any offer to buy securities. Unless this report says otherwise, any recommendation it makes is risky and appropriate only for sophisticated speculative investors able to incur significant losses. Readers should consult their financial advisors to determine whether any such recommendation is consistent with their own investment objectives, financial situation and needs. This report does not recommend to U.S. recipients the use of any of DCMA’s non-U.S. affiliates to effect trades in any security and is not supplied with any understanding that U.S. recipients of this report will direct commission business to such non-U.S. entities. Unless applicable law permits otherwise, non-U.S. customers wishing to effect a transaction in any securities referenced in this material should contact a Daiwa entity in their local jurisdiction. Most countries throughout the world have their own laws regulating the types of securities and other investment products which may be offered to their residents, as well as a process for doing so. As a result, the securities discussed in this report may not be eligible for sales in some jurisdictions. Customers wishing to obtain further information about this report should contact DCMA: Daiwa Capital Markets America Inc., Financial Square, 32 Old Slip, New York, New York 10005 (telephone 212-612-7000).
Ownership of Securities
For “Ownership of Securities” information please visit BlueMatrix disclosure Link at https://daiwa3.bluematrix.com/sellside/Disclosures.action.
Investment Banking Relationships
For “Investment Banking Relationships” please visit BlueMatrix disclosure link at https://daiwa3.bluematrix.com/sellside/Disclosures.action.
DCMA Market Making
For “DCMA Market Making” please visit BlueMatrix disclosure link at https://daiwa3.bluematrix.com/sellside/Disclosures.action.
Research Analyst Conflicts
For updates on “Research Analyst Conflicts” please visit BlueMatrix disclosure link at https://daiwa3.bluematrix.com/sellside/Disclosures.action. The principal research analysts who prepared this report have no financial interest in securities of the issuers covered in the report, are not (nor are any members of their household) an officer, director or advisory board member of the issuer(s) covered in the report, and are not aware of any material relevant conflict of interest involving the analyst or DCMA, and did not receive any compensation from the issuer during the past 12 months except as noted: no exceptions.
Research Analyst Certification
For updates on “Research Analyst Certification” and “Rating System” please visit BlueMatrix disclosure link at https://daiwa3.bluematrix.com/sellside/Disclosures.action. The views about any and all of the subject securities and issuers expressed in this Research Report accurately reflect the personal views of the research analyst(s) primarily responsible for this report (or the views of the firm producing the report if no individual analysts[s] is named on the report); and no part of the compensation of such analyst(s) (or no part of the compensation of the firm if no individual analyst[s)] is named on the report) was, is, or will be directly or indirectly related to the specific recommendations or views contained in this Research Report. The following explains the rating system in the report as compared to relevant local indices, based on the beliefs of the author of the report. "1": the security could outperform the local index by more than 15% over the next six months. "2": the security is expected to outperform the local index by 5-15% over the next six months. "3": the security is expected to perform within 5% of the local index (better or worse) over the next six months. "4": the security is expected to underperform the local index by 5-15% over the next six months. "5": the security could underperform the local index by more than 15% over the next six months.
For stocks in Thailand covered by Thanachart Securities, the following rating system is in effect:
Ratings are based on absolute upside or downside, which is the difference between the target price and the current market price. If the upside is 10% or more, the rating is BUY. If the downside is 10% or more, the rating is SELL. For stocks where the upside or downside is less than 10%, the rating is HOLD. Unless otherwise specified, these ratings are set with a 12-month horizon. Thus, it is possible that future price volatility may cause a temporary mismatch between upside/downside for a stock based on the market price and the formal rating.
For the sector, Thanachart looks at two areas, ie, the sector outlook and the sector weighting. For the sector outlook, an arrow pointing up, or the word “Positive”, is used when Thanachart sees the industry trend improving. An arrow pointing down, or the word “Negative”, is used when Thanachart sees the industry trend deteriorating. A double-tipped horizontal arrow, or the word “Unchanged”, is used when the industry trend does not look as if it will alter. The industry trend view is Thanachart’s top-down perspective on the industry rather than a bottom-up interpretation from the stocks that Thanachart covers. An “Overweight” sector weighting is used when Thanachart has BUYs on majority of the stocks under its coverage by market cap. “Underweight” is used when Thanachart has SELLs on majority of the stocks it covers by market cap. “Neutral” is used when there are relatively equal weightings of BUYs and SELLs.
Ownership of Securities
For “Ownership of Securities” information, please visit BlueMatrix disclosure Link at https://daiwa3.bluematrix.com/sellside/Disclosures.action.
Investment Banking Relationships
For “Investment Banking Relationship”, please visit BlueMatrix disclosure Link at https://daiwa3.bluematrix.com/sellside/Disclosures.action.
Relevant Relationships (TNS)
TNS may from time to time have an individual employed by or associated with it serves as an officer of any of the companies under its research coverage.
TNS market making
TNS may from time to time make a market in securities covered by this research. Additional information may be available upon request.