asia pacific petroleum conference - platts · asia pacific petroleum conference ... middle east...
TRANSCRIPT

© OECD/IEA - 2016
Asia Pacific Petroleum Conference
“Where are oil prices headed"
Singapore, 7 September 2016
Mr. Keisuke Sadamori
Director, Directorate of Energy Markets and Security
© OECD/IEA - 2016
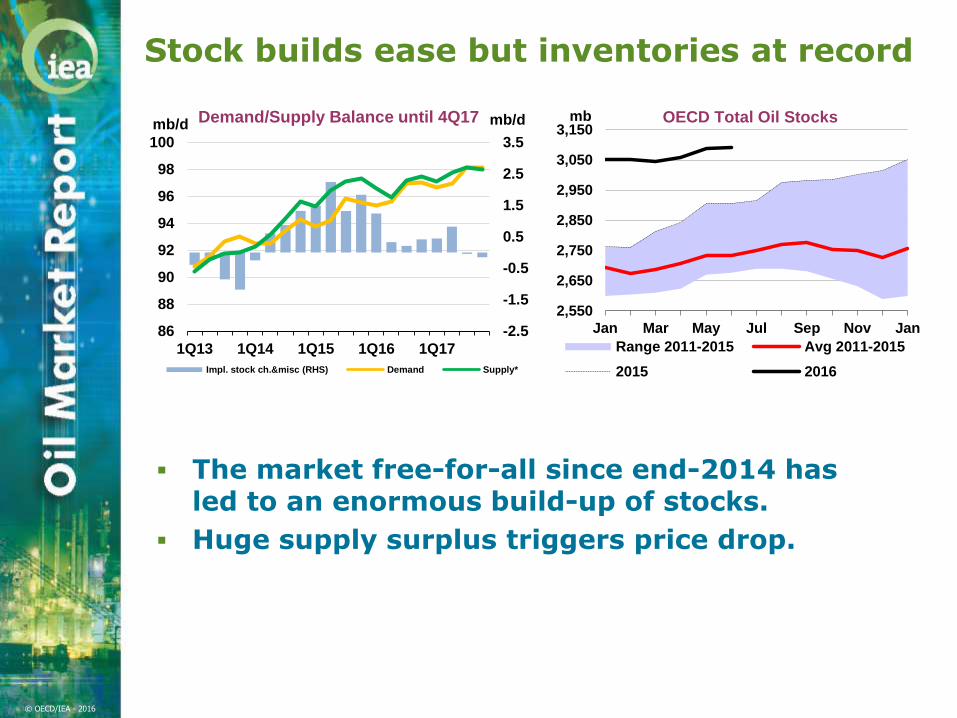
Stock builds ease but inventories at record
The market free-for-all since end-2014 has led to an enormous build-up of stocks.
Huge supply surplus triggers price drop.
-2.5
-1.5
-0.5
0.5
1.5
2.5
3.5
86
88
90
92
94
96
98
100
1Q13 1Q14 1Q15 1Q16 1Q17
mb/dmb/d Demand/Supply Balance until 4Q17
Impl. stock ch.&misc (RHS) Demand Supply*
2,550
2,650
2,750
2,850
2,950
3,050
3,150
Jan Mar May Jul Sep Nov Jan
mb OECD Total Oil Stocks
Range 2011-2015 Avg 2011-2015
2015 2016

© OECD/IEA - 2016
2016 demand growth eases from recent highs – but remains robust
-500
0
500
1000
1500
2000
2500
1Q2014 3Q2014 1Q2015 3Q2015 1Q2016
kb/d Global Oil Demand Growth, y-o-y
Japan China India US Total

© OECD/IEA - 2016
Chinese slowdown key to lower demand growth
-750
-500
-250
0
250
500
750
1000
1250
1500
Jan-14 Jul-14 Jan-15 Jul-15 Jan-16
kb/d Chinese Oil Demand Growth, y-o-y
Gasoline/Jet/Kerosene Gasoil
FO/other LPG/naphtha
Total

© OECD/IEA - 2016
India’s rapid demand growth eases
0
100
200
300
400
500
600
Jan-14 Jul-14 Jan-15 Jul-15 Jan-16
kb/d Indian Demand Growth, y-o-y
Gasoline/Jet/Kerosene Gasoil
FO/other LPG/naphtha
Total

© OECD/IEA - 2016
Global oil supply growth grinds to halt
-1.5-1.0-0.50.00.51.01.52.02.53.03.54.04.5
Jan 14 Jul 14 Jan 15 Jul 15 Jan 16 Jul 16
mb/d
Thousands
OPEC and Non-OPEC Oil Supply Year-on-Year Change
OPEC Crude Non-OPEC
OPEC NGLs Total Supply

© OECD/IEA - 2016
Record Mideast output boosts OPEC
-2.0
-1.5
-1.0
-0.5
0.0
0.5
1.0
1.5
2.0
Jan 14 Jun 14 Nov 14 Apr 15 Sep 15 Feb 16 Jul 16
mb/d OPEC Growth y-o-y
Other OPEC Iraq Saudi Arabia
Iran OPEC

© OECD/IEA - 2016
Middle East share rises to highest since 1970s
0%
10%
20%
30%
40%
0
20
40
60
80
100
mb/d Middle East Share of Global Supply*
Middle East Other
Middle East Share
*Excl. Biofuels and refinery processing gains

© OECD/IEA - 2016
Non-OPEC plunges but recovery on horizon
-1.5
-1.0
-0.5
0.0
0.5
1.0
1.5
2.0
2.5
3.0
1Q13 1Q14 1Q15 1Q16 1Q17
mb/d
Other North America Total
Total Non-OPEC Supply, y-o-y Change

© OECD/IEA - 2016
US producers turn corner in 2017
-1.0
-0.5
0.0
0.5
1.0
1.5
2.0
1Q13 1Q14 1Q15 1Q16 1Q17
mb/d US Total Oil Supply - Yearly Change
Alaska California Texas
Gulf of Mexico NGLs North Dakota
Other Total

© OECD/IEA 2016
Looking further ahead
Demand growth solid at 1.2 mb/d through 2021
Production growth slashed as investment cuts bite
Crude trade shifts more and more eastwards
Huge uncertainties
OPEC production policy
Non-OPEC
World economy
Efficiency gains

© OECD/IEA 2016
World oil demand growth slows
Cools from 1.7%/yr in 2009-15 to 1.2%/yr in 2016-2021
2009-15
2015-21
© OECD/IEA, 2016(kb/d)
-179 -76138 52
283
27
164 215
104 155
Americas
Africa
Middle East
Europe
FSU
969826
Asia/Pacific

© OECD/IEA 2016
World supply growth plunges
2015-21 growth slows to 4.1 mb/d vs 11 mb/d in 2009-15
-1.0
-0.5
0.0
0.5
1.0
1.5
2.0
2.5
3.0
2014 2015 2016 2017 2018 2019 2020 2021
mb/d
OPEC Non-OPEC
*2014 -15 shows actual output growth. 2016 assumes Iran ramp-up. OPEC capacity increases thereafter.
-1.0
-0.5
0.0
0.5
1.0
1.5
2.0
2.5
3.0
2014 2015 2016 2017 2018 2019 2020 2021
mb/d
OPEC Non-OPEC World
*2014 -15 shows actual output growth. 2016 assumes Iran ramp-up. OPEC capacity increases thereafter.
© OECD/IEA 2016
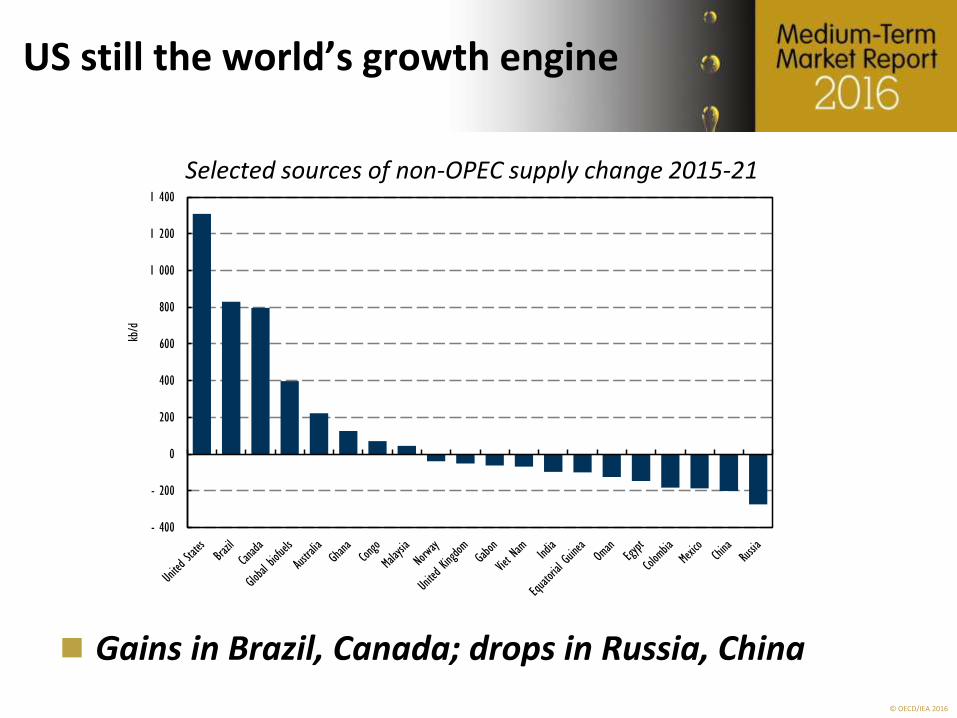
US still the world’s growth engine
Gains in Brazil, Canada; drops in Russia, China
Selected sources of non-OPEC supply change 2015-21
- 400
- 200
0
200
400
600
800
1 000
1 200
1 400
kb/d

© OECD/IEA 2016
Middle East leads OPEC growth
-0.10
-0.05
0.00
0.05
0.10
0.15
0.20
0.25
2016 2017 2018 2019 2020 2021
mb/d
Iran Iraq UAE Other Total OPEC

© OECD/IEA 2016
Crude trade to shift eastwards
Crude Exports in 2021 and Growth in 2015-21 for Key Trade Routes1
(million barrels per day)
0.1
(+0)
0.3 0.2
(+0) 2.2 (+0.2)
(-0.5) 4.0 0.1(-1) (+0)
0.3
(-0.1) 4.7
1.5 (+1.1)
1.8 (+0.2)
-0.2
1.0
1.4 (+0.1)
(-0.1)
0.4(+0)
Red number in brackets denotes growth in period 2015-21 0.81Excludes Intra-Regional Trade (+0)2 Includes Chile3 Includes Israel
6.1
(+0.9)
Other Asia
China
OECD Europe
2.4(+0.0)
1.2 (+0.3)
OECD Asia
Oceania3
0.5 (-0.2)
0.8(+0.3)
3.9 (-0.3)
OECDAmericas2

© OECD/IEA 2016
Oil markets return to balance
In 2014 and 2015, oil supply greatly exceeded demand; the oil market is likely to return to balance in 2017, with high stock levels dampening any price recovery
-2
-1
0
1
2
3
2014 2015 2016 2017 2018 2019 2020 2021
mb/d
Demand Growth Supply Growth Stock change

© OECD/IEA 2016
IEA Oil Market Analysis
Thank you for listening!