asian american center for advancing justice a … american center for advancing justice, 1140...
TRANSCRIPT

Asian American Center for Advancing Justice
A Community of ContrastsAsian Americans in the United States: 2011
Co-authorPrincipal Researcher and Co-author
Asian
Am
erican C
enter fo
r Ad
vancin
g Ju
stice A C
om
mu
nity o
f Co
ntrasts A
sian A
merican
s in th
e Un
ited S
tates: 2011
This report was made possible by the following sponsors: the Wallace H. Coulter Foundation, Cyrus Chung Ying Tang Foundation, and Bank of America.
The statements made and views expressed are solely the responsibility of the authors.
Cyrus Chung Ying Tang Foundation
order form
Publications are available in print or on the Asian American Center for Advancing Justice website (www.aajc.advancingjustice.org) where they can be downloaded or printed free of charge. All orders for paid copies must be prepaid. Sorry, but we cannot process orders or invoice for future payments. For questions about ordering reports, please call (202) 296-2300.
Asian American Center for Advancing Justice, 1140 Connecticut Ave., Suite 1200, NW, Washington, dC 20036
order INformAtIoN
title ordered Quantity Cost PostageAmount enclosed
A Community of Contrasts Asian American in the United States: 2011 $10 ea. $4 ea. $
donation:
q included with credit card billing
q check included
total $
Name:
Organization:
Address:
City: State: ZiP:
Phone Number: E-mail:
FedEx Number (if applicable):
Please select method of payment (prepayment is required for all orders):
q Check enclosed, payable to: Asian American Justice Center
q Bill my credit card: q Visa q MasterCard
Credit Card Number:
Name
Expiration Date Amount $
AsiAn AmericAn center for AdvAncing Justice
The Asian American Center for Advancing Justice (Advancing Justice) is a leading Asian American civil rights and social justice organization comprising four equal and independent affiliates: the Asian American Justice Center (AAJC) , Asian Pacific American Legal Center (APALC), Asian American Institute (AAI), and Asian Law Caucus (ALC). Its mission is to promote a fair and equitable society for all by working for civil and human rights and empowering Asian Americans and Native Hawaiians and Pacific Islanders (NHPIs) and other under-served communities.
Each affiliate’s staff has valuable expertise and deep experience. AAJC is one of the nation’s leading experts on issues of importance to the Asian American community and has enacted a sweeping range of programs on critical national concerns. APALC is the nation’s largest legal organ-ization addressing the needs of Asian Americans and NHPIs by advocating for civil rights, provid-ing legal services and education, and building coalitions. AAI is the Midwest’s leading pan-Asian organization dedicated to empowering the Asian American
community through advocacy, research, education, and coali-tion building. ALC is the oldest legal organization in the country defending the civil rights of Asian American and NHPI communi-ties and focuses on the needs of low-income, immigrant, and underserved communities.
While well known in their indi-vidual spheres for their work and expertise, the affiliates of Advancing Justice have come together to build a stronger, more cohesive regional and national civil and human rights infra-structure for the Asian American community. We use our resources to provide valuable information to the community, work to address more issues in more places, impact a greater number of public debates, and help the voices of Asian Americans, NHPIs, and other marginalized and under-served communities be heard.
Please email any questions regarding the report to: [email protected].
Welcome 1
introduction 2
Executive Summary 3
Population 6
Economic Contributions 11
Civic Engagement 13
immigration 17
Age 23
Language 24
Education 30
income 33
Employment 39
Housing 43
Health 46
Policy Recommendations 50
Ethnic Group Highlights 55
Glossary 58
Appendix A: Race & Ethnicity 59
Appendix B: Asian Americans by State 60
Appendix C: Asian Americans by County 61
Appendix D: Socioeconomic Status 62
Technical Notes 64
Order Form 65

For decades, Asian Americans have been among the fastest growing racial groups in the United States. The Asian American population is larger today than it has ever been in our nation’s history, growing both in places like California and New York, where large Asian American communities have existed for decades, and in parts of the coun-try like the South, where smaller communities have more recently grown to a critical mass.
As our communities grow, Asian Americans are making significant contributions to the economy and developing greater political power. At the same time, our population is incredibly diverse. With parts of the community thriving, those who struggle seem invisible. Many Asian Americans con-tinue to face language barriers and struggle economically. The current recession poses even greater challenges to this vulner-able population.
At this time of both challenge and opportunity, four organi-zations—the Asian American Institute, Asian American Justice Center, Asian Law Caucus, and Asian Pacific American Legal Center—have deepened their affiliation and come together to
form the Asian American Center for Advancing Justice. As inde-pendent organizations under one umbrella, we will continue to advance the goals we have always worked toward—promot-ing a fair and equitable society for all, strengthening civil and human rights, and empowering Asian American, Native Hawaiian and Pacific Islander (NHPI), and other vulnerable communities.
A publication of the Asian American Center for Advancing Justice, A Community of Contrasts: Asian Americans in the United States 2011 draws upon data from the 2010 Census, American Community Survey, and other sources to provide a detailed portrait of the Asian American community in the United States. The report also includes a number of policy recommendations based on the data that address critical con-cerns facing Asian Americans throughout the country.
This national report is the second in a series and will be followed by regional reports on Asian American and NHPI com-munities in California, the West, the Midwest, the South, and the Northeast. Additional reports are also planned, including one focused on the NHPI community
and another on the economic contributions of Asian Americans and NHPIs.
We would like to thank the sponsors who made this report possible, including the Wallace H. Coulter Foundation, the Cyrus Chung Ying Tang Foundation, and Bank of America.
We would also like to thank those who contributed to this report, including staff at the Asian Pacific American Legal Center (Deisy Del Real, Victoria Wilson, Dan Ichinose, and Karin Wang) and Asian American Justice Center (Marita Etcubañez, Terry Ao-Minnis, and Olivia Chow). Special thanks to the National Coalition of Asian Pacific Americans (NCAPA) and our colleagues in Congress and philanthropy, who provided criti-cal guidance on the content and structure of this report.
Karen K. Narasaki President and Executive Director AAJC
Stewart Kwoh President and Executive Director APALC
welcome

Asian American Center for Advancing Justice2
Asian Americans come from all walks of life. Some are doc-tors or lawyers; others work in restaurants or nail salons. Many were born in the United States; most are immigrants. Our ancestors hail from many countries, including Bangladesh, Burma, Cambodia, China, India, Indonesia, Japan, Korea, Laos, Malaysia, Nepal, Pakistan, the Philippines, Sri Lanka, Taiwan, Thailand, and Vietnam. We are Americans.
Asian Americans have been among our nation’s fastest growing racial groups since dis-criminatory immigration quotas were eliminated in 1965 and now make up 6% of the country’s total population. This rapid growth, coupled with significant social and economic diversity, make Asian Americans a complicated group to understand and serve.
A Community of Contrasts: Asian Americans in the United States 2011 is the second in an ongoing series of reports that attempt to promote a bet-ter understanding of Asian American communities through-out the country by compiling the latest data on Asian Americans.
It not only includes data on population, but key socioeco-nomic characteristics such as age, immigration, language, education, income, employ-ment, housing, and health. In gathering these data at the national level, this report has two main goals.
First, it works to provide dis-aggregated data on discrete Asian American ethnic groups. Given the social and economic diversity within Asian American communities, these data are criti-cal to understanding and serving a population that includes both affluent, third-generation English speakers and low-income refu-gees, many among the poorest in our nation.
Second, it presents these data in a way that is accessible to community organizations, elected and appointed officials, government agencies, founda-tions, and corporations looking to better understand and serve Asian American communities. Because quantitative data on Asian Americans can be difficult to access and interpret, compil-ing this important information in a user-friendly manner makes it
more manageable and likely to be used.
The report draws these data from numerous sources. While data from the U.S. Census Bureau, including the 2010 Census, American Community Survey, Survey of Business Owners, Current Population Survey, and American Housing Survey, provide a wealth of information on Asian American communi-ties, they are not comprehensive. This report supplements Census Bureau data with data from other sources, including the Centers for Disease Control and Prevention, U.S. Department of Education, U.S. Department of Homeland Security, and U.S. Department of State.
Together, these data paint a fuller, more nuanced picture of one of our country’s most diverse and rapidly changing racial groups. They will help stakeholders across the nation better respond to and serve our community of contrasts.
The statements and recommen-dations expressed in this report are solely the responsibility of the authors.
introduction

A Community of Contrasts: Asian Americans in the United States 2011 compiles the latestdata on Asian Americans at the national level. Produced by the Asian American Center for Advancing Justice, the report is a valuable resource to commu-nity organizations, elected and appointed officials, government agencies, foundations, corpo-rations, and others looking to better understand and serve one of this country’s fastest growing and most diverse racial groups. While A Community of Contrasts includes many findings, this Executive Summary highlights some of them.
Asian Americans are the country’s fastest growing racial group.According to the 2010 Census, the Asian American popula-tion in the United States grew 46% between 2000 and 2010, faster than any other racial group nationwide, includ-ing Latinos. While large Asian American communities in California, New York, Texas, and New Jersey continue to grow, less established communities in Nevada, Arizona, North Carolina, and Georgia grew fastest over the past decade. Among ethnic
groups, South Asians, including Bangladeshis, Pakistanis, Sri Lankans, and Indians, saw the highest rates of growth. Policy makers and service pro-viders in areas with established Asian American communities should determine whether exist-ing services need to be modified to accommodate changing ethnic compositions. Those in areas with less established but growing Asian American communities should work to improve their capacity to serve these emerging populations.
Asian Americans make significant contributions to the economy through entrepreneurial activity, job creation, and consumer spending.Asian American entrepreneurs own over 1.5 million businesses, employing about 3 million people with an annual payroll of nearly $80 billion. According to the Census Bureau’s 2002 and 2007 Survey of Business Owners, Asian American firms were more likely than other firms to create jobs. The buying power of Asian American communities is also growing dramatically. Between 2000 and 2009, the buy-ing power of Asian Americans
and Native Hawaiians and Pacific Islanders (NHPIs) increased 89%, from $269 billion to $509 billion, contributing to economic growth in the United States. The Asian American and NHPI population is roughly one-third the size of the Latino population nationwide yet has half the buying power.
Asian Americans are becoming citizens, registering to vote, and casting ballots.According to the Census Bureau’s November 2008 Current Population Survey, approximately 69% of Asian Americans old enough to vote are U.S. citizens. Of those eli-gible to register to vote, 55% have done so. Once registered, the rate of Asian American voter turnout still lags behind that of non-Hispanic Whites. Greater naturalization, voter registration, and Get Out the Vote (GOTV) efforts are needed if Asian Americans are to realize their untapped political poten-tial. Bilingual voter assistance required under the federal Voting Rights Act remains critical to ensuring Asian American voters have full access to the ballot.
executive SummAry
NatioNal RepoRt oN Native HawaiiaNs aNd pacific islaNdeRs
In 1997, revisions to Office of Management and Budget (OMB) Statistical Policy Directive 15 called for the disaggregation of data on Asian
Americans and Pacific Islanders, establishing Native Hawaiian and Pacific Islanders as a distinct racial category for the purposes of data
collection and reporting. Honoring the spirit of this directive and recognizing the importance of data that capture the unique needs and
concerns of Pacific Islander communities, the Asian American Center for Advancing Justice will release a separate national report in 2012
dedicated to Pacific Islanders.
Asian American Center for Advancing Justice4
immigration policies disproportionately impact Asian Americans.Proportionately, Asian Americans are more likely than any other racial group to be foreign-born. According to the U.S. Census Bureau’s 2007–2009 American Community Survey 3-Year Estimates, approximately 60% of Asian Americans were born outside the United States, a rate significantly higher than that of Latinos. Immigrants con-tinue to enter the United States from Asia in large numbers using almost every pathway. The largest number come as the immediate relatives of U.S. citizens, while equal numbers come under family-sponsored and employment-based prefer-ences. Immigrants from certain Asian countries wait decades to enter, contributing to an Asian American undocumented popu-lation bordering one million. From 2001 to 2010, Asians made up 26% of refugee arrivals and 33% of people granted asylum. Impacting millions of Asian Americans, immigration policy should promote family unity, provide a path to legalization and citizenship for the undocu-mented, and create a process for immigrant students who have lived in the United States for most of their lives to obtain legal residency. Efforts to revoke the rights of noncitizens and harsh immigration enforcement measures have extremely dispro-portionate impacts on the Asian American community.
language barriers continue to limit opportunities for millions of Asian Americans.According to 2007–2009 American Community Survey 3-Year Estimates, roughly one out of every three Asian Americans are limited-English proficient (LEP) and experience some difficulty communicating in English. This impacts their ability to integrate fully into American society or access critical ser-vices needed to survive. Rates of limited-English proficiency vary by ethnic group, with a rough majority of Vietnamese and Bangladeshi Americans being LEP. Even among the most English-proficient Asian American ethnic groups, roughly one in five Japanese, Filipino, and Indian Americans are LEP. In addition, roughly one in five Asian American households is linguistically isolated, where all members of the household 14 years or older are LEP. Providing assistance in Asian languages and greater opportunities to learn English promotes better access to good jobs, citizenship, voting, healthcare, social ser-vices, and the judicial system for millions of Asian Americans.
Asian American educational attainment varies widely among ethnic groups.With disproportionate numbers of Asian immigrants entering the country as professionals under employment-based preferences, Asian American educational attainment generally approaches or exceeds that of non-Hispanic
Whites. Yet disaggregated 2007–2009 American Community Survey 3-Year Estimates data show that the educational attainment of Cambodians, Laotian, Hmong, and Vietnamese Americans is similar to African Americans and Latinos, limiting employment opportunities for many in Southeast Asian com-munities. Job training programs and vocational English language instruction should be targeted to Asian Americans with lower levels of educational attainment in an effort to increase access to good jobs.
Some Asian Americans struggle economically.While some in Asian American communities enjoy economic success and stability, others struggle through severe pov-erty. According to 2007–2009 American Community Survey 3-Year Estimates, poverty rates have fallen for all Asian American ethnic groups since 2000. Yet challenges persist. Hmong Americans have the lowest per capita income of any racial or ethnic group nation-wide, while Hmong, Bangladeshi, and Cambodian Americans have poverty rates that approach those of African Americans and Latinos. Federal, state, and local governments should establish or expand culturally and linguisti-cally accessible public assistance programs to meet these needs, particularly in light of the on-going economic recession.

A Community of Contrasts 5
unemployment has impacted Southeast Asian American communities.With disproportionate num-bers in management and professional fields, many Asian Americans have been better situated than others to weather the current financial crisis. While the unemployment rate of Asian Americans is low rela-tive to other groups, 2007–2009 American Community Survey 3-Year Estimates shows that the most vulnerable in our community face high rates of joblessness. Hmong, Laotian, and Cambodian Americans have unemployment rates higher than the national average. Job training, adult English lan-guage learning, unemployment benefits, and other safety net programs should be made acces-sible to these workers as they struggle to get back on their feet.
Asian Americans continue to face housing concerns.According to 2007–2009 American Community Survey 3-Year Estimates, 59% of Asian Americans own homes nationwide. Yet this rate of home-ownership lags significantly behind that of non-Hispanic Whites, with a majority of Bangladeshi, Hmong, and Korean Americans renting rather than owning their own homes. The problem is compounded by large numbers of Asian Americans living in overcrowded housing. Approximately 7% live in over-crowded housing, twice the national average. Like other
communities continuing to face recession, Asian Americans would greatly benefit from expanding affordable housing and homeownership opportunities.
Access to affordable healthcare coverage is critical for Asian Americans.Data from the Centers for Disease Control’s 2008 National Health Interview Survey show that Asian Americans are twice as likely than both non-Hispanic Whites and African Americans to have seen a doctor in the past five years, despite being more likely to develop hepatitis, stomach and liver cancer, and
other diseases. Asian Americans are also more likely than non-Hispanic Whites to be unin-sured, with one in four Korean Americans being without health insurance. The federal govern-ment should work with insurance companies and employers to expand access to affordable healthcare coverage for all U.S. residents, including immigrants.
Social and economic data on Asian Americans, particularly those disaggregated by Asian American ethnic group, provide policymakers and service provid-ers with critical information to guide sound decision making.
Asian American Center for Advancing Justice6
PoPulAtion
Population by Race and Hispanic Origin, United States 2010
race and Hispanic origin number Percent
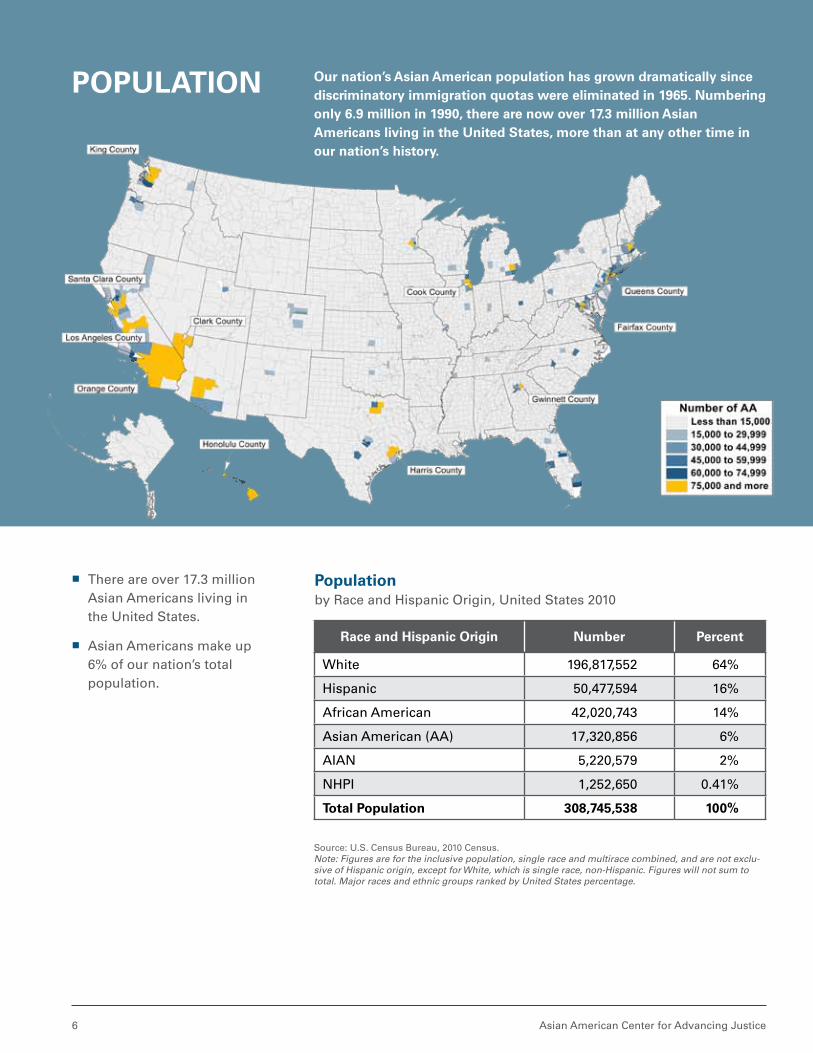
White 196,817,552 64%
Hispanic 50,477,594 16%
African American 42,020,743 14%
Asian American (AA) 17,320,856 6%
AIAN 5,220,579 2%
NHPI 1,252,650 0.41%
total Population 308,745,538 100%
Source: U.S. Census Bureau, 2010 Census.Note: Figures are for the inclusive population, single race and multirace combined, and are not exclu-sive of Hispanic origin, except for White, which is single race, non-Hispanic. Figures will not sum to total. Major races and ethnic groups ranked by United States percentage.
our nation’s Asian American population has grown dramatically since discriminatory immigration quotas were eliminated in 1965. numbering only 6.9 million in 1990, there are now over 17.3 million Asian Americans living in the united States, more than at any other time in our nation’s history.
� There are over 17.3 million Asian Americans living in the United States.
� Asian Americans make up 6% of our nation’s total population.
7
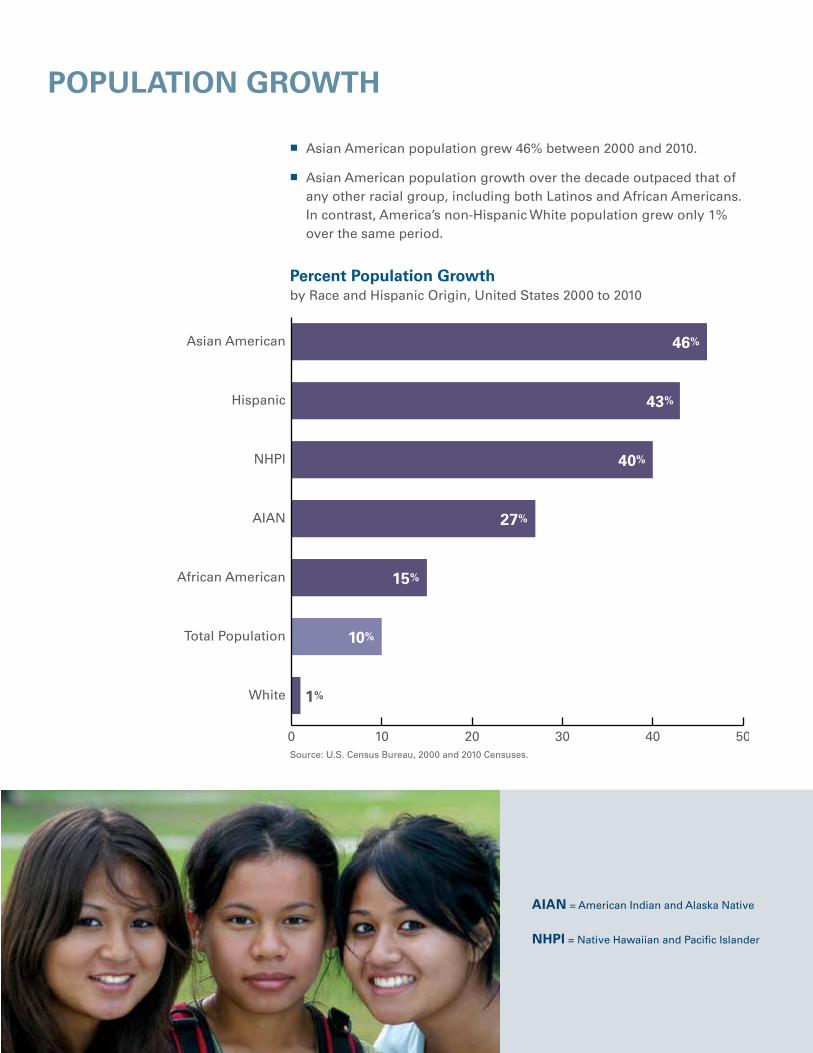
AiAn = American Indian and Alaska Native
nHPi = Native Hawaiian and Pacific Islander
� Asian American population grew 46% between 2000 and 2010.
� Asian American population growth over the decade outpaced that of any other racial group, including both Latinos and African Americans. In contrast, America’s non-Hispanic White population grew only 1% over the same period.
Percent Population Growth by Race and Hispanic Origin, United States 2000 to 2010
Asian American
Hispanic
NHPI
AIAN
Total Population
African American
White
0 10 20 30 40 50
46%
43%
40%
27%
15%
10%
1%
Source: U.S. Census Bureau, 2000 and 2010 Censuses.
PoPulAtion GrowtH

Asian American Center for Advancing Justice8
GeoGrAPHic diStribution
States with Highest number of Asian AmericansUnited States 2010
u.S. States number %
California 5,556,592 14.9%
New York 1,549,494 8.2%
Texas 1,110,666 4.4%
New Jersey 795,163 9.0%
Hawaii 780,968 57.4%
Illinois 668,694 5.2%
Washington 604,251 9.0%
Florida 573,083 3.0%
Virginia 522,199 6.5%
Pennsylvania 402,587 3.2%
Massachusetts 394,211 6.0%
Maryland 370,044 6.4%
Georgia 365,497 3.8%
Michigan 289,607 2.9%
North Carolina 252,585 2.6%
States with Highest Growth of Asian AmericansUnited States 2000 to 2010
u.S. States % Growth
Nevada 116%
Arizona 95%
North Carolina 85%
Georgia 83%
New Hampshire 80%
Delaware 78%
North Dakota 85%
Arkansas 77%
Indiana 74%
Texas 72%
Florida 72%
Virginia 71%
Idaho 71%
South Dakota 70%
Alabama 70%
� Asian American populations in Nevada, Arizona, North Carolina, and Georgia were the fastest growing nationwide between 2000 and 2010. Nevada’s Asian American population more than doubled over the decade.
� California’s Asian American population remained by far the country’s largest, numbering over 5.5 million in 2010. Asian American populations in New York, Texas, New Jersey, and Hawai’i followed California in size.
� Of 19 states home to more than 225,000 Asian Americans, six are in the South (Texas, Florida, Virginia, Maryland, Georgia, and North Carolina) and four are in the Midwest (Illinois, Michigan, Minnesota, and Ohio).
� Over 57% of Hawai’i’s total population is Asian American, making it the country’s only majority Asian American state.
Source: U.S. Census Bureau, 2010 Census.

A Community of Contrasts 9
Asian American ethnic GroupsUnited States 2010, Ranked in Order of Population
ethnic Group number ethnic Group number
Chinese (except Taiwanese)
3,794,673 Laotian 232,130
Filipino 3,416,840 Taiwanese 230,382
Indian 3,183,063 Burmese 100,200
Vietnamese 1,737,433 Bangladesh 147,300
Korean 1,706,822 Indonesian 95,270
Japanese 1,304,286 Napalese 59,490
Pakistani 409,163 Sri Lankan 45,381
Cambodian 276,667 Malaysian 26,179
Hmong 260,073 Bhutanese 19,439
Thai 237,583
� The country’s fastest growing Asian American ethnic groups were South Asian. Bangla-deshi and Pakistani American populations doubled in size between 2000 and 2010.
� Chinese Americans continue to be the largest Asian Ameri-can ethnic group, numbering nearly 3.8 million nationwide. They are followed in size by Filipinos, Indians, Vietnamese, and Korean Americans.
� Vietnamese Americans now outnumber both Korean and Japanese Americans nationwide.
Vietnamese
Taiwanese
Filipino
Cambodian
Laotian
Chinese (except Taiwanese)
Pakistani
Hmong
Total Population
Korean
Bangladeshi
Thai
Indian
Sri Lankan
Indonesian
Japanese
Malaysian
0 50 100 150 200
10%
14%
17%
34%
39%
39%
40%
41%
42%
44%
51%
58%
59%
68%
85%
100%
157%
etHnic GrouPS
Source: U.S. Census Bureau, 2010 Census.
Source: U.S. Census Bureau, 2000 and 2010 Censuses. Note: Population growth percentages for Burmese, Nepalese, and Bhutanese excluded because these groups did not meet 2000 Census population thresholds to be counted as an ethnic category.
Population Growth by Ethnic Group, United States 2000 to 2010

Asian American Center for Advancing Justice10
mixed-race Population Growth by Ethnic Group, United States 2010
0 5 10 15 20 25 30 35
Vietnamese
Taiwanese
Filipino
Cambodian
Laotian
Chinese (except Taiwanese)
Pakistani
Burmese
Nepalese
Bhutanese
Hmong
Korean
Bangladeshi
Total Population
Thai
Indian
Sri Lankan
Indonesian
Japanese
Malaysian
35%
27%
23%
22%
16%
14%
12%
10%
9%
8%
8%
8%
6%
6%
5%
4%
4%
3%
3%
3%
Source: U.S. Census Bureau, 2010 Census.
� More than 15% of Asian Americans are of mixed race. Only 3% of all Americans are multiracial.
� Among Asian American ethnic groups, Japanese Americans are most likely be of mixed race. More than one-third of Japanese Americans are multiracial, followed by 27% of Indonesian, 23% of Thai, 22% of Filipinos, and 16% of Malaysian Americans.
� Fewer than 5% of Burmese, Nepalese, Bangladeshi, Hmong, and Bhutanese Americans are of mixed race. Among larger ethnic groups, only 6% of Vietnamese and 8% of Indians are multiracial.
mixed-rAce PoPulAtion
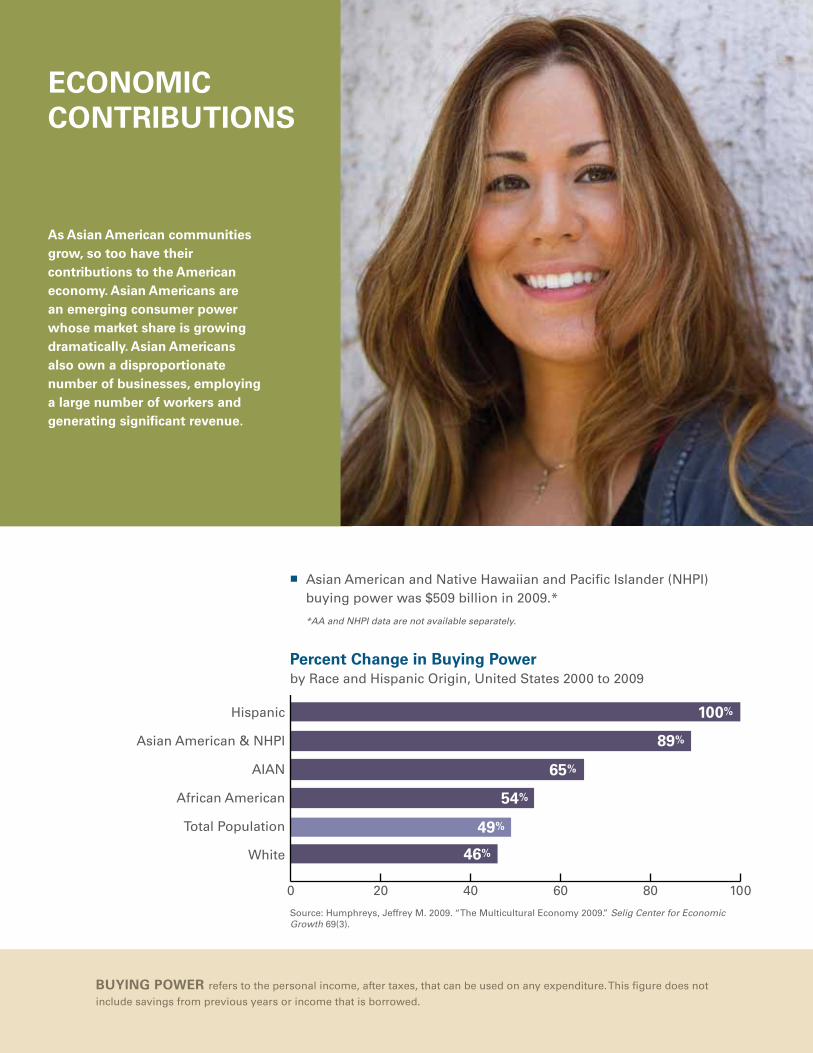
As Asian American communities grow, so too have their contributions to the American economy. Asian Americans are an emerging consumer power whose market share is growing dramatically. Asian Americans also own a disproportionate number of businesses, employing a large number of workers and generating significant revenue.
economic contributionS
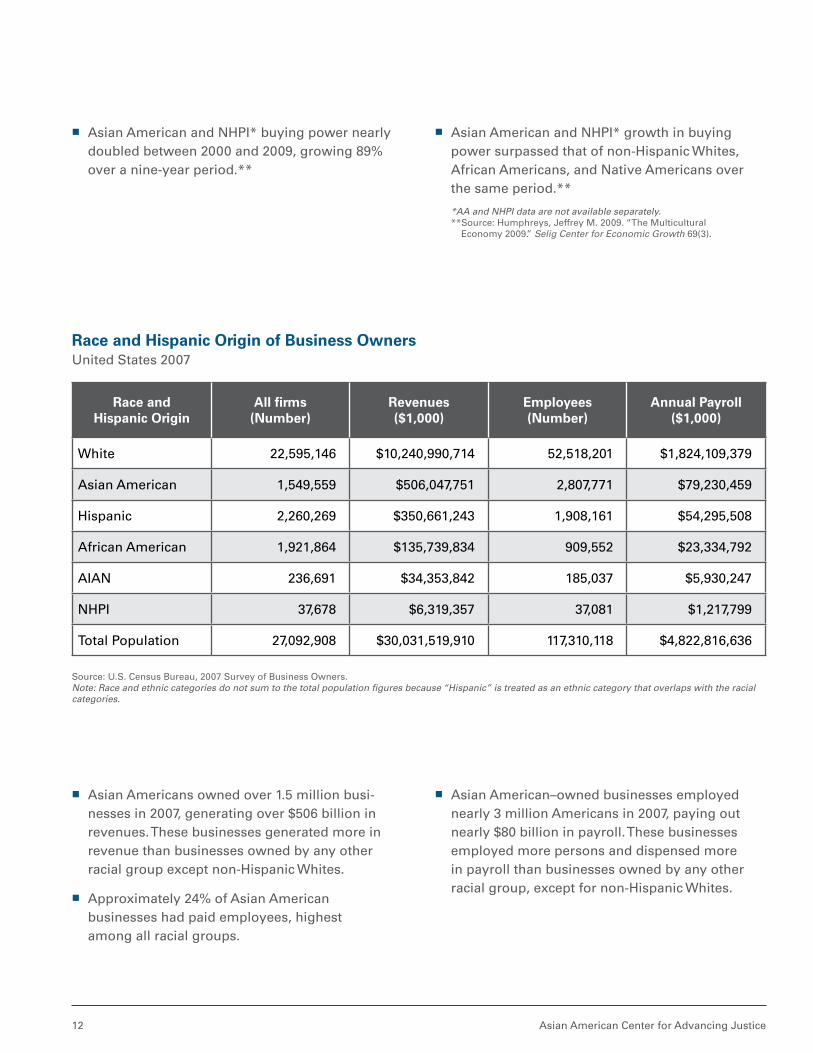
� Asian American and Native Hawaiian and Pacific Islander (NHPI) buying power was $509 billion in 2009.*
*AA and NHPI data are not available separately.
buyinG Power refers to the personal income, after taxes, that can be used on any expenditure. This figure does not
include savings from previous years or income that is borrowed.
African American
Total Population
White
Hispanic
Asian American & NHPI
AIAN
0 20 40 60 80 100
100%
89%
65%
54%
46%
49%
Source: Humphreys, Jeffrey M. 2009. “The Multicultural Economy 2009.” Selig Center for Economic Growth 69(3).
Percent change in buying Power by Race and Hispanic Origin, United States 2000 to 2009
Asian American Center for Advancing Justice12
race and Hispanic origin
All firms (number)
revenues ($1,000)
employees (number)
Annual Payroll ($1,000)
White 22,595,146 $10,240,990,714 52,518,201 $1,824,109,379
Asian American 1,549,559 $506,047,751 2,807,771 $79,230,459
Hispanic 2,260,269 $350,661,243 1,908,161 $54,295,508
African American 1,921,864 $135,739,834 909,552 $23,334,792
AIAN 236,691 $34,353,842 185,037 $5,930,247
NHPI 37,678 $6,319,357 37,081 $1,217,799
Total Population 27,092,908 $30,031,519,910 117,310,118 $4,822,816,636
race and Hispanic origin of business ownersUnited States 2007
Source: U.S. Census Bureau, 2007 Survey of Business Owners. Note: Race and ethnic categories do not sum to the total population figures because “Hispanic” is treated as an ethnic category that overlaps with the racial categories.
� Asian American and NHPI* buying power nearly doubled between 2000 and 2009, growing 89% over a nine-year period.**
� Asian American and NHPI* growth in buying power surpassed that of non-Hispanic Whites, African Americans, and Native Americans over the same period.**
*AA and NHPI data are not available separately.** Source: Humphreys, Jeffrey M. 2009. “The Multicultural
Economy 2009.” Selig Center for Economic Growth 69(3).
� Asian Americans owned over 1.5 million busi-nesses in 2007, generating over $506 billion in revenues. These businesses generated more in revenue than businesses owned by any other racial group except non-Hispanic Whites.
� Approximately 24% of Asian American businesses had paid employees, highest among all racial groups.
� Asian American–owned businesses employed nearly 3 million Americans in 2007, paying out nearly $80 billion in payroll. These businesses employed more persons and dispensed more in payroll than businesses owned by any other racial group, except for non-Hispanic Whites.

A Community of Contrasts 13
Source: U.S. Census Bureau, 2007–2009 American Community Survey, 3-Year Estimates.Note: The foreign-born population includes both those eligible and ineligible to naturalize.
0 20 40 60 80 100
Naturalized
Not Naturalized
58% 42%
57% 43%
46% 54%
43% 57%
32% 68%
29% 71%
40% 60%
Asian American
NHPI
TotaI Population
AIAN
Hispanic
African American
White
Percent of Foreign-born Population who Have naturalized by Race and Hispanic Origin, United States 2007 to 2009
Asian Americans are becoming a powerful political voice. they are becoming citizens, registering to vote, and voicing their concerns at the ballot box. despite this, language and cost barriers to citizenship remain significant hurdles to full civic engagement. language barriers and voter identification requirements also affect voter registration and access to the polls.
civic enGAGement

Asian American Center for Advancing Justice14
0 20 40 60 80 100
Vietnamese
Taiwanese
Filipino
Cambodian
Laotian
Chinese (except Taiwanese)
Pakistani
Hmong
Korean
Bangladeshi
Thai
Indian
Sri Lankan
Total Population
Indonesian
Japanese
Malaysian
73%
67%
64%
63%
62%
60%
57%
57%
54%
50%
49%
47%
43%
43%
35%
33%
27%
27%
33%
36%
37%
38%
40%
43%
43%
46%
50%
51%
53%
57%
57%
65%
67%
73%
Naturalized
Not Naturalized
Source: U.S. Census Bureau, 2007–2009 American Community Survey, 3-Year Estimates.
Percent of Foreign-born Population who Have naturalizedby Ethnic Group, United States 2007 to 2009
� Approximately 57% of Asian American immi-grants are U.S. citizens, an increase from 50% in 2000.
� Nearly three out of four Vietnamese American immigrants are U.S. citizens. Approximately 60% or more Taiwanese, Filipino, Cambodian, Laotian, and Chinese American immigrants are citizens.
� Fewer than half of Malaysian, Japanese, Indonesian, Sri Lankan, Indian, and Thai American immigrants are citizens.
� In 2010, more than 250,000 Asian American immigrants became U.S. citizens.*
* Source: Jeanne Batalova, “Asian Immigrants in the United States,” Migration Policy Institute, May 2011.

A Community of Contrasts 15
country of birthlegal Permanent
residentsnumber eligible
to naturalizePercent eligible
to naturalize
Philippines 550,000 280,000 51%
China 530,000 190,000 36%
India 500,000 200,000 40%
Vietnam 320,000 200,000 63%
Korea* 240,000 140,000 58%
Japan 130,000 110,000 85%
Pakistan 120,000 50,000 42%
*Korea includes North and South Korea.
Source: U.S. Department of Homeland Security, “Estimates of the Legal Permanent Resident Population in 2009.” Note: Estimates assume that immigrants are required to reside in the U.S. 5 years after obtaining Legal Permanent Resident (LPR) status except for the fol-lowing immigrant categories: Spouses of U.S. citizens (3 years), asylees (4 years), and refugees, Lautenberg parolees, and those who adjusted to LPR status through cancelation of removal (2 years).
Asian American legal Permanent residents eligible to naturalize by Country of Birth, United States 2008
� The greatest number of legal permanent residents eligible to become citizens are from the Philippines, India, and Vietnam.
� Approximately 85% of Japanese American legal permanent residents are eligible to naturalize. In contrast, only 36% of Chinese American legal permanent residents are eligible to become citizens.
A leGAl PermAnent reSident is generally eligible to naturalize once
she or he has held that status for five years. However, additional criteria, such as
“good moral character” and basic English literacy, must also be met.

Asian American Center for Advancing Justice16
African AmericanWhite Asian American Total PopulationHispanic
Percent of Voting-Age Population Who Were Citizens
Percent of Registered Voters Who Voted
Percent of Citizens Voting Age Population Who Registered to Vote
0
20
40
60
80
100
63%
84%
59%
98%
90%
74%
94% 93%
70%68%
86%
55%
91% 90%
71%
Source: U.S. Census Bureau, November 2008 Current Population Survey.“Reported Voting and Registration of the Voting-Age Population, by Sex, Race, and Hispanic Origin, for States: November 2008.”
citizenship, voter registration, and votingby Race and Hispanic Origin, United States—November 2008
� Only 68% of Asian Americans old enough to vote are citizens.
� Approximately 86% of Asian American registered voters cast ballots in the 2008 General Election, a rate lower than that of non-Hispanic Whites.
� Only 55% of Asian Americans eligible to register to vote have registered.
� In both 2004 and 2008 General Elections, roughly 30% of Asian American voters were voting for the first time.*
*Source: Project Vote, April 2011.
A Community of Contrasts 17
African American
White
NHPI
Total Population
AIAN
Asian American
Hispanic
0 10 20 30 40 50 60
60%
38%
14%
13%
8%
5%
4%
Source: U.S. Census Bureau, 2007–2009 American Community Survey, 3-Year Estimates.
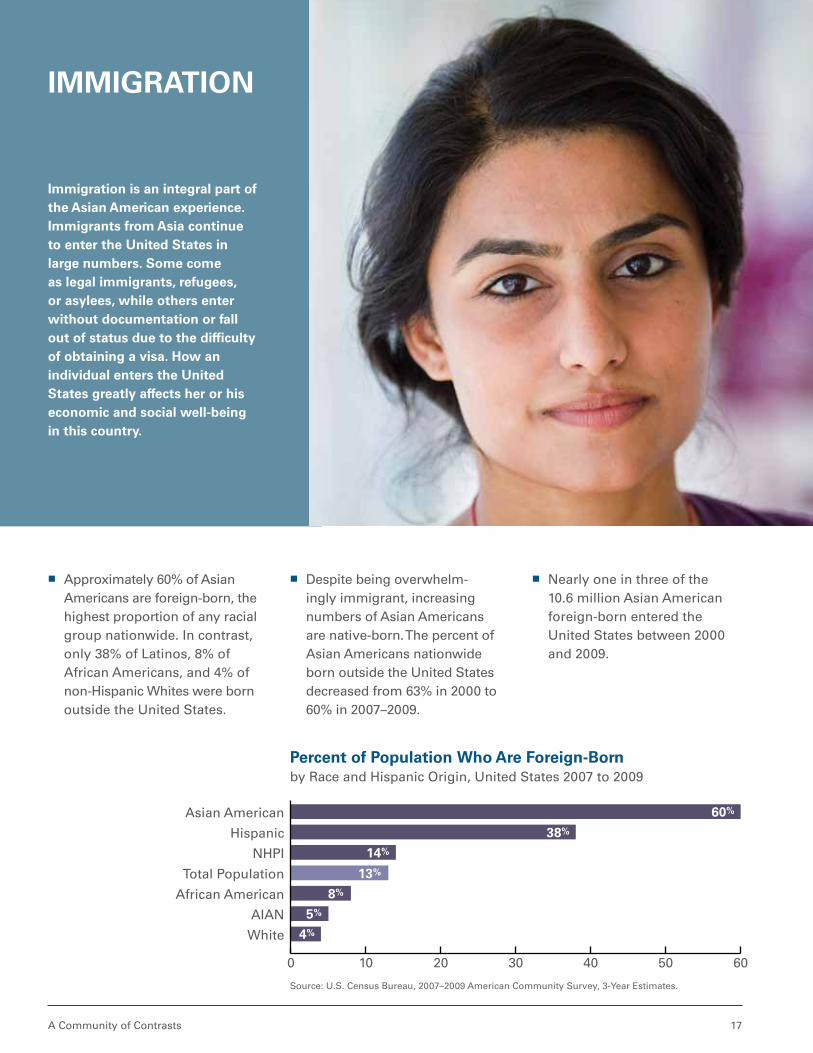
immigration is an integral part of the Asian American experience. immigrants from Asia continue to enter the united States in large numbers. Some come as legal immigrants, refugees, or asylees, while others enter without documentation or fall out of status due to the difficulty of obtaining a visa. How an individual enters the united States greatly affects her or his economic and social well-being in this country.
immiGrAtion
� Approximately 60% of Asian Americans are foreign-born, the highest proportion of any racial group nationwide. In contrast, only 38% of Latinos, 8% of African Americans, and 4% of non-Hispanic Whites were born outside the United States.
� Despite being overwhelm-ingly immigrant, increasing numbers of Asian Americans are native-born. The percent of Asian Americans nationwide born outside the United States decreased from 63% in 2000 to 60% in 2007–2009.
� Nearly one in three of the 10.6 million Asian American foreign-born entered the United States between 2000 and 2009.
Percent of Population who Are Foreign-bornby Race and Hispanic Origin, United States 2007 to 2009
Asian American Center for Advancing Justice18
Source: U.S. Census Bureau, 2007–2009 American Community Survey, 3-Year Estimates.
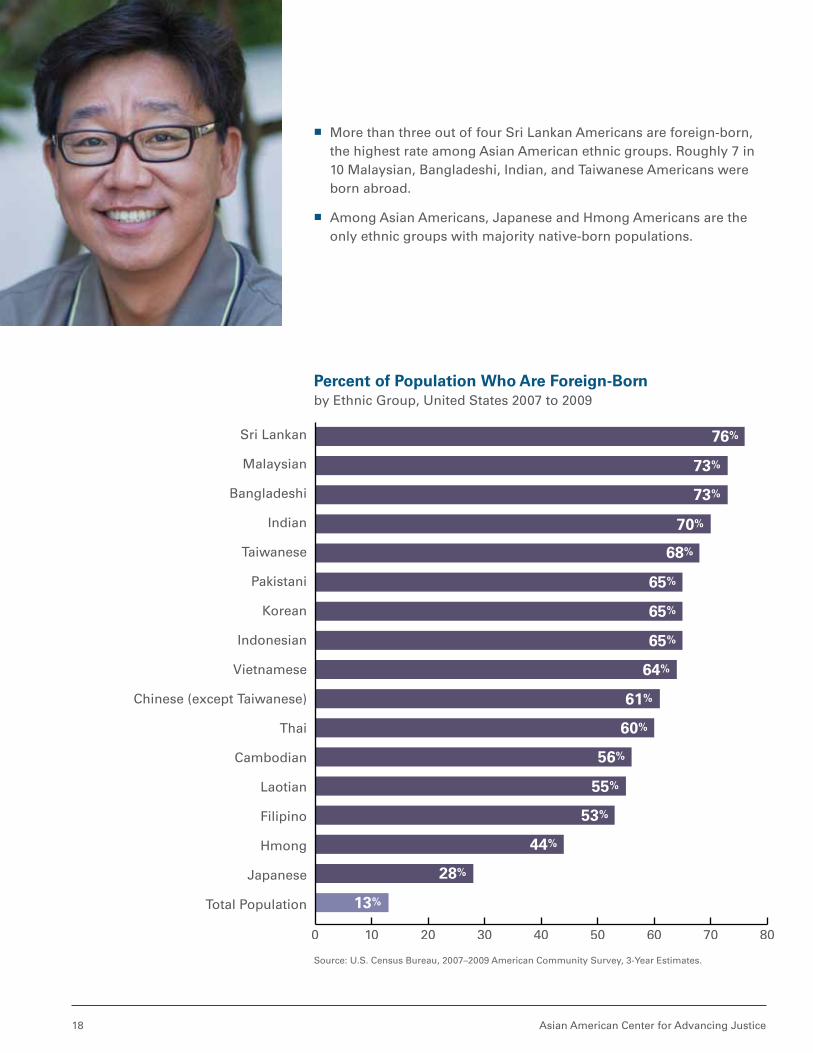
Percent of Population who Are Foreign-bornby Ethnic Group, United States 2007 to 2009
0 10 20 30 40 50 60 70 80
Sri Lankan
Malaysian
Bangladeshi
Indian
Vietnamese
Taiwanese
Pakistani
Korean
Indonesian
Thai
Chinese (except Taiwanese)
Cambodian
Laotian
Filipino
Hmong
Japanese
Total Population
76%
73%
73%
70%
68%
65%
65%
65%
64%
61%
60%
56%
55%
53%
44%
28%
13%
� More than three out of four Sri Lankan Americans are foreign-born, the highest rate among Asian American ethnic groups. Roughly 7 in 10 Malaysian, Bangladeshi, Indian, and Taiwanese Americans were born abroad.
� Among Asian Americans, Japanese and Hmong Americans are the only ethnic groups with majority native-born populations.

Source: U.S. Department of State, “The Report of the Visa Office 2010.”* FY2010 data are preliminary and are subject to change. Any changes would not be statistically
significant. Chart includes all visas issued to both permanent and nonpermanent immigrants, and also includes replaced visas.
Yea
r Im
mig
ran
t V
isa
Was
Issu
ed2010
2009
2008
2007
2006
2005
2004
2003
2002
2001
159,871
0 100,000 200,000 300,000 400,000 500,000
169,380
157,385
156,025
171,775
180,769
150,179
159,871
138,080
144,465
144,465
144,590
364,813
408,774
389,529
379,426
402,248
449,103
434,412
470,100
468,770
482,053
Total All Immigrant Admissions
Total All Asian Immigrant Admissions
wAitinG PeriodS For viSAS*The waiting period for visas under both family-sponsored and employment-based preferences can vary widely depending on country.
Asian Americans sponsor more than one-third of all family-based immigrants and have some of the longest wait times.
FAmily-SPonSored viSAS: Immigrants born in mainland China and India must wait between 3 and 11 years. Immigrants born in
the Philippines must wait between 3 and 23 years.
emPloyment-bASed viSAS: Immigrants born in mainland China and India wait for up to 9 years, the longest wait time for any
nation besides Mexico. Immigrants born in the Philippines must wait up to 7 years.
*Source: U.S. Department of State, “Visa Bulletin: Immigrant Numbers for July 2011.”
demAnd For viSAS
immigrant visas issued by the united States2001 to 2010

immigrant visas issued by the united States in Asian countries2001 to 2010
Source: U.S. Department of State, “The Report of the Visa Office 2010.”* FY2010 data are preliminary and are subject to change. Any changes would not be statistically signifi-cant. Immigrant visas include any visas issued under the auspices of immediate relative and family sponsorship, employer sponsorship, the Special Immigrants program (Iraqi and Afghan translators, government workers, and religious workers), and the Diversity Visa program. This chart does not contain data on temporary visitors.
0 50000 100,000 150000 200,000 250000 300,000 350000 400,000
Philippines
Co
un
try
Wh
ere
U.S
. Vis
a W
as Is
sued
China
India
Vietnam
Pakistan
Bangladesh
South Korea
Hong Kong
Taiwan
Japan
Thailand
Nepal
Cambodia
Burma
Sri Lanka
Indonesia
Malaysia
Singapore
Laos
Mongolia
350,694
286,008
267,403
193,049
84,643
69,202
59,057
45,809
42,367
34,599
21,147
18,880
8,896
7,045
8,129
5,837
4,183
3,870
1,843
388
reFuGeeS And ASyleeS are persons who came to the United States to escape persecution in their country of origin. Refugees
are immigrants who applied for admission while living abroad, while asylees are immigrants who applied for admission at either a port of
entry or within the United States.
From 2001 to 2010, those from Asian countries made up 26% of all refugee arrivals and 33% of all persons granted asylum.*
From 2001 to 2010, 52% of refugee arrivals from Asian countries were from Burma, and 68% of asylees born in Asia were from China.*
*Source: The U.S. Department of Homeland Security’s Yearbooks of Immigration Statistics, 2010.
� Among Asian countries, the Philippines, China, and India sent the most immigrants to the United States over the past decade.
� Between 2001 and 2010, 1.6 million immigrants entered the United States from Asian countries.
� Bangladesh sent more immigrants to the United States than South Korea or Japan over the same period.

Persons obtaining legal Permanent resident Status by Class of Admissions, Asian Country of Birth, 2010
D = Data withheld to limit disclosure. Source: U.S. Department of Homeland Security’s Yearbook of Immigration Statistics, 2010.
leGAl PermAnent reSidentS � While the largest number of Asian-born persons
obtaining legal permanent resident (LPR) status in 2010 entered as the immediate relatives of U.S. citizens, those born in Asia were more likely than other immigrants to enter under family-sponsored or employment-based immigration preferences.
� Over half of Macau- and Vietnamese- and nearly half of Hong Kong–born persons obtaining LPR sta-tus in 2010 entered under family-based preferences.
� A majority of Cambodian, Japanese, Laotian, Mongolian, and Philippine and nearly half of Indonesian and Pakistani-born persons obtaining LPR status in 2010 entered as the immediate rela-tives of U.S. citizens.
� A majority of South Korean and nearly half of Indian- and Singapore-born persons obtaining LPR status in 2010 entered under employment-based preferences.
country of birth
Family- Sponsored Preferences
employment- based
Preferences
immediate relatives of u.S. citizens
diversity refugees and Asylees
other
% no. % no. % no. % no. % no. % no.
Bangladesh 41% 6,006 6% 827 33% 4,935 19% 2,800 1% 171 0.5% 80
Bhutan D D 0% 6 0.5% 28 D 99% 6071 0% 0
Burma 4% 459 1% 86 5% 604 3% 329 89% 11,445 0% 2
Cambodia 14% 418 2% 59 76% 2,266 4% 115 4% 113 1% 15
China 19% 13,610 25% 17,949 34% 24,198 0% 23 21% 14,943 0% 140
Hong Kong 49% 1,196 19% 464 30% 731 1% 30 0% 7 0% 4
India 21% 14,636 45% 31,118 32% 21,831 0% 58 2% 1,324 0% 195
Indonesia 10% 306 17% 515 48% 1,461 5% 138 19% 573 1% 39
Japan 2% 120 32% 1,973 63% 3,916 4% 218 0% 12 0% 25
South Korea 11% 2,351 52% 11,642 37% 8,128 0% 6 0% 7 4% 93
Laos 9% 113 5% 59 71% 847 0% 4 14% 172 0% 5
Macau 59% 84 13% 18 24% 34 5% 7 0% 0 0% 0
Malaysia 9% 149 30% 508 41% 704 2% 40 18% 301 0% 12
Mongolia 1% 5 11% 66 54% 320 14% 80 20% 121 1% 2
Nepal 4% 269 11% 788 18% 1,312 23 1,644 44% 3,093 0% 9
Pakistan 34% 6,247 16% 2,896 47% 8,522 0% 14 3% 507 0% 72
Philippines 31% 17,849 11% 6,423 58% 33,746 0% 14 0% 55 0% 86
Singapore 8% 65 49% 377 37% 289 2% 14 2% 18 1% 11
Sri Lanka 10% 195 26% 530 32% 645 19% 394 13% 258 1% 14
Taiwan 26% 1,729 31% 2,090 40% 2,691 3% 196 0% 6 0% 20
Thailand 4% 345 6% 530 44% 4,126 1% 43 46% 4,276 1% 64
Vietnam 59% 18,027 1% 360 36% 11,091 0% 0 3% 1,032 0% 122
total 24% 84,179 23% 79,284 38% 132,425 2% 6,167 13% 44,525 0.3% 1,010

dreAm Act StudentSAmong the 2.1 million undocumented youth who would qualify for legalization through the DREAM Act, 1 in 10 is of Asian origin.**
**Source: Batalova, Jeanne, and Margie McHugh. July 2010.
undocumented Asian American immigrant Population in the united Statesby Country of Birth, 2005 to 2010
Source: U.S. Department of Homeland Security, “Estimates of Unauthorized Immigrant Population residing in the United States: January 2010.” Note: Estimates of the unauthorized resident population are the remainder after estimates of the legally resident foreign-born population are subtracted from estimates of the total foreign-born population.
2005 2006 2007 2008 2009 2010100,000
150,000
200,000
250,000
300,000
China130,000
India200,000
Korea170,000
Philippines280,000
nu
mb
er o
f u
nd
ocu
men
ted
imm
igra
nts
� Approximately 1 million undocumented immigrants in the United States are from Asia.
� More undocumented immigrants were born in the Philippines than any other Asian country.
undocumented PoPulAtion

A Community of Contrasts 23
race and Hispanic origin median Age 0–17 18–64 65+
African American 30 30% 62% 8%
AIAN 31 30% 62% 8%
Asian American 33 26% 65% 9%
Hispanic 27 35% 60% 6%
NHPI 26 35% 60% 6%
White 41 21% 63% 16%
total Population 37 24% 62% 13%
median Age and Age Group by raceUnited States 2007 to 2009
Source: U.S. Census Bureau, 2007–2009 American Community Survey, 3-Year Estimates.
ethnic Group median Age 0–17 18–64 65+
Bangladesh 31 33% 64% 3%
Cambodian 27 32% 63% 5%
Chinese (except Taiwanese) 35 25% 65% 13%
Taiwanese 35 19% 59% 9%
Filipino 34 28% 63% 10%
Hmong 20 45% 52% 3%
Indian 32 26% 68% 6%
Indonesian 33 24% 70% 6%
Japanese 38 24% 61% 15%
Korean 33 26% 66% 8%
Laotian 28 32% 63% 5%
Malaysian 33 22% 74% 5%
Pakistani 29 34% 63% 4%
Sri Lankan 36 24% 68% 8%
Thai 32 26% 70% 4%
Vietnamese 34 28% 64% 8%
total Population 37 24% 63% 13%
median Age and Age Group by ethnic GroupUnited States 2007 to 2009
AGeAge affects both an individual’s opportunities and social service needs. Asian Americans are younger on average and have a higher proportion of working-age adults compared to other major racial groups.
� Approximately 65% of Asian Americans are working-age adults between the ages of 18 and 64, a greater proportion than any other racial group.
� The median age of Asian Americans is 33, making them younger than both the overall U.S. population (37) and non-Hispanic Whites (41).
� Over one-quarter of Asian Americans are children under the age of 18.
� Among Asian American ethnic groups, Japanese Americans have the oldest median age (38), while Hmong Americans have the youngest (20).

Asian American Center for Advancing Justice24
Percent of Population who Speak a language other than english at Home for those 5 years of Age and olderby Race and Hispanic Origin, United States 2007 to 2009
African American
TotalPopulation
WhiteHispanic or Latino
Asian American
NHPI AIAN0
10
20
30
40
50
60
70
80
77%
71%
29%
20% 20%
8% 6%
Source: U.S. Census Bureau, 2007–2009 American Community Survey, 3-Year Estimates.
Asian Americans speak dozens of languages and dialects, reflecting the community’s rich immigrant character and diversity. nearly three out of four Asian Americans speak a language other than english at home, and roughly one-third is limited-english proficient (leP). coupled with a lack of available english classes, language is a formidable barrier impacting access to a range of vital services, such as healthcare, social services, housing, courts, and education.
lAnGuAGe

A Community of Contrasts 25
Percent of Population who Speak a language other than english at Home for those 5 years and olderby Ethnic Group, United States 2007 to 2009
0 20 40 60 80 100
Sri Lankan
Malaysian
Bangladeshi
Hmong
Indian
Vietnamese
Taiwanese
Pakistani
Korean
Indonesian
Thai
Chinese (including Taiwanese)
Cambodian
Laotian
Filipino
Japanese
Total Population
92%
91%
86%
84%
82%
81%
81%
77%
72%
75%
71%
67%
66%
65%
57%
36%
20%
Source: U.S. Census Bureau, 2007–2009 American Community Survey, 3-Year Estimates.
� Approximately 71% of Asian Americans speak a language other than English at home.
� More than 80% of Bangladeshi, Hmong, Pakistani, Vietnamese, Taiwanese, Laotian, and Cambodian Americans speak a language other than English at home.
� Despite being disproportionately native-born relative to other Asian American ethnic groups, more than one in three Japanese Americans continue to speak a language other than English at home.

Asian American Center for Advancing Justice26
number of Asian language Speakers in the united Statesby Language, 2005 to 2009
Source: U.S. Census Bureau, 2007–2009 American Community Survey, 5-Year Estimates.*Includes Pakistani along with other languages spoken in Pakistan.
lAnGuAGeS SPoken
language number
Chinese 2,380,453
Tagalog 1,441,799
Vietnamese 1,200,709
Korean 1,041,030
Hindi 527,481
Japanese 457,540
Urdu 326,310
Gujarati 304,102
Punjabi 209,835
Bengali 188,452
Mon-Khmer, Cambodian 185,311
Hmong 181,770
Telugu 171,015
Laotian 148,186
Thai 142,045
Tamil 132,573
Malayalam 116,486
Formosan 76,822
Ilocano 74,547
Indonesian 57,504
Marathi 53,436
Kannada 37,377
Nepali 37,240
Burmese 34,758
Visayan (not including Cebuano) 23,119
Sinhalese 22,336
Pakistan N.E.C.* 13,840
Malay 13,319
Cebuano 11,501
� Approximately 10 million Americans speak one of the 33 Asian languages cat-egorized by the U.S. Census.
� The largest group of languages spoken by Asian Americans is composed of languages from China.
� Over two-thirds of Asian Americans speak a language originating from China, India, or the Philippines.

A Community of Contrasts 27
African American
White
Hispanic
Total Population
Asian American
NHPI
AIAN
0 5 10 15 20 25 30 35 40
38%
32%
9%
8%
6%
3%
2%
Percent of Population who Are limited english Proficientfor those 5 years of Age and older by Race and Hispanic Origin, 2007 to 2009
Source: U.S. Census Bureau, 2007–2009 American Community Survey, 3-Year Estimates.
limited enGliSH ProFiciency
� Approximately 32% of Asian Americans are limited-English proficient (LEP) and experience some difficulty communicating in English.
� Despite continued immigration, rates of limited-English proficiency among Asian Americans have fallen since 2000, when 36% of Asian Americans were LEP. Rates of limited-English proficiency among Latinos have seen a similar decline, from 41% in 2000 to 38% in 2007–2009.

Asian American Center for Advancing Justice28
Percent of Population who Are limited english Proficientfor those 5 years of Age and older by Ethnic Group, 2007 to 2009
Sri Lankan
Malaysian
Bangladeshi
Indian
Vietnamese
Taiwanese
Hmong
Pakistani
Korean
Indonesian
Thai
Chinese (except Taiwanese)
Cambodian
Laotian
Filipino
Japanese
Total Population
0 10 20 30 40 50 60
51%
46%
43%
43%
43%
42%
41%
40%
36%
30%
28%
23%
22%
22%
19%
18%
9%
Source: U.S. Census Bureau, 2007–2009 American Community Survey, 3-Year Estimates.
� Among Asian American ethnic groups, over half of Vietnamese and nearly half of Bangladeshi Americans are LEP.
� Even among the most English proficient Asian American ethnic groups, including Japanese and Filipino Americans, nearly one in five are LEP.
� Among Asian American ethnic groups, only Sri Lankan Americans have seen an increase in limited English proficiency since 2000. Limited English proficiency among Sri Lankan Americans increased from 18% in 2000 to 22% in 2007–2009.
� Over 40% of Cambodian, Hmong, Taiwanese, Chinese, Korean, and Laotian Americans are LEP.
A Community of Contrasts 29
Percent of linguistically isolated Householdsby Ethnic Group, 2005 to 2009
Source: U.S. Census Bureau, 2005–2009 American Community Survey, 5-Year Estimates. Note: The ethnic group percentages included in this graph do not include mixed-ethnicity and mixed-race people.
Sri Lankan
Malaysian
Bangladeshi
Indian
Vietnamese
Hmong
Pakistani
Korean
Indonesian
Thai
Chinese (except Taiwanese)
Cambodian
Laotian
Filipino
Total Population
Japanese
0 5 10 15 20 25 30 35
35%
31%
29%
25%
22%
21%
21%
20%
20%
19%
16%
12%
12%
11%
8%
5%
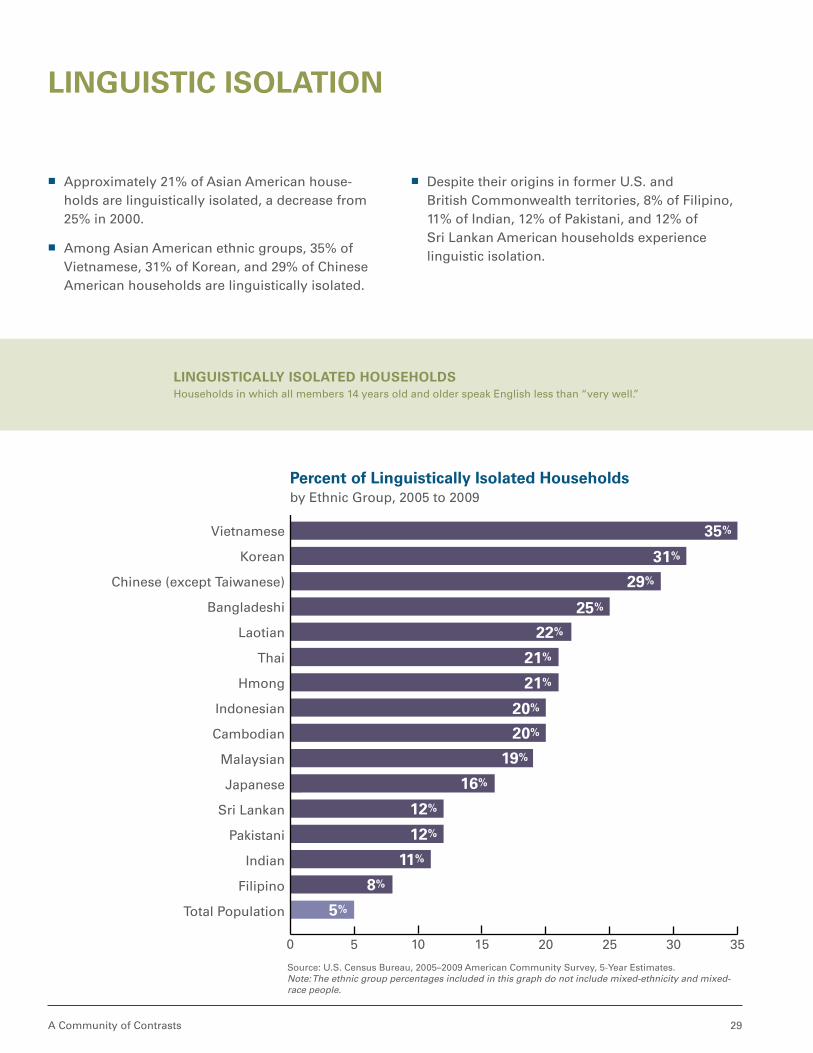
linGuiSticAlly iSolAted HouSeHoldSHouseholds in which all members 14 years old and older speak English less than “very well.”
linGuiStic iSolAtion
� Approximately 21% of Asian American house-holds are linguistically isolated, a decrease from 25% in 2000.
� Among Asian American ethnic groups, 35% of Vietnamese, 31% of Korean, and 29% of Chinese American households are linguistically isolated.
� Despite their origins in former U.S. and British Commonwealth territories, 8% of Filipino, 11% of Indian, 12% of Pakistani, and 12% of Sri Lankan American households experience linguistic isolation.

Asian American Center for Advancing Justice30
educational Attainmentby Race and Hispanic Origin, United States 2009
Source: U.S. Census Bureau, 2007–2009 American Community Survey, 3-Year Estimates.
0 20 40 60 80 100
Asian American
White
African American
Total Population
NHPI
AIAN
Hispanic 61%
13%
80%
16%
85%
81%
18%
28%
85%
90%
31%
86%
49%
17%
Bachelor’s Degree or Higher
High School Degree or Higher
Asian Americans are often thought of as having high levels of formal education. while this is generally true, a closer look at data from the u.S. census bureau reveals large disparities between Asian American ethnic groups, with the educational profiles of some communities similar to latinos and African Americans. this suggests that many Asian Americans lack the credentials necessary to access secure and living wage jobs, employer-provided healthcare, and opportunities to build assets.
educAtion
� Asian Americans are less likely than non-Hispanic Whites to hold a high school degree.

A Community of Contrasts 31
educational Attainmentby Ethnic Group, United States 2007 to 2009
Source: U.S. Census Bureau, 2007–2009 American Community Survey, 3-Year Estimates.
Vietnamese
Taiwanese
Filipino
Cambodian
Laotian
Total Population
Chinese (except Taiwanese)
Pakistani
Hmong
Korean
Bangladeshi
Thai
Indian
Sri Lankan
Indonesian
Japanese
Malaysian
0 20 40 60 80 100
High School Degree or Higher
Bachelor’s Degree or Higher
96%
94%
94%
93%
93%
92%
92%
91%
87%
85%
84%
82%
81%
72%
66%
62%
61%
14%
14%
12%
27%
47%
50%
28%
42%
55%
68%
46%
52%
56%
57%
46%
47%
73%
educAtionAl AttAinment � The educational attainment of Hmong, Cambodi-
an, Laotian, and Vietnamese Americans is lowest among Asian American ethnic groups and similar to those of Latinos and African Americans. Only 61% of Hmong Americans hold a high school diploma, while only 12% of Laotian Americans have graduated from college.
� In contrast, eight Asian American ethnic groups, including Taiwanese, Indonesian, Japanese, Sri Lankan, Malaysian, Korean, Filipino, and Indian Americans, are more likely than non- Hispanic Whites to hold a high school degree.
White
African American
American Indian
Asian American & NHPI
Hispanic
0 5 10 15 20 25 30 35
34%
16%
8%
1%
1%
Source: U.S. Department of Education, Institute of Education Sciences, National Center of Education Statistics, National Assessment of Education Progress (NAEP), 2009 Reading Assessment.
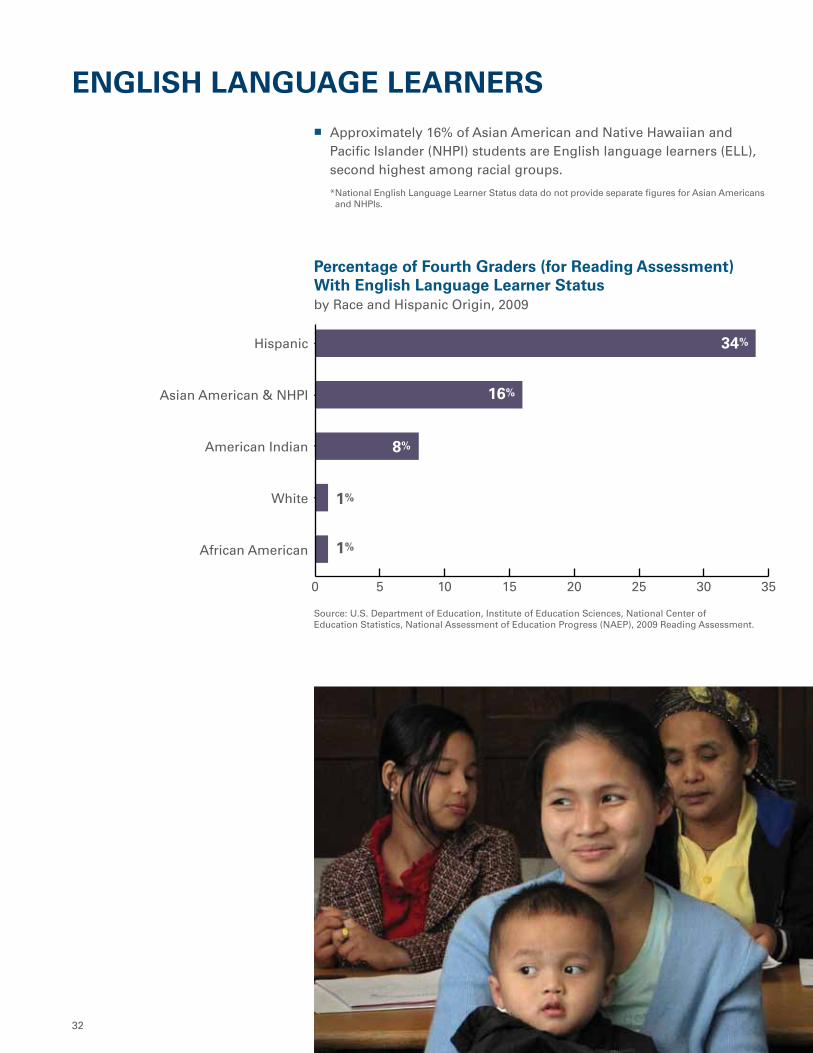
Percentage of Fourth Graders (for reading Assessment) with english language learner Status by Race and Hispanic Origin, 2009
enGliSH lAnGuAGe leArnerS � Approximately 16% of Asian American and Native Hawaiian and
Pacific Islander (NHPI) students are English language learners (ELL), second highest among racial groups.
* National English Language Learner Status data do not provide separate figures for Asian Americans and NHPIs.
32
White
Asian American
Total Population
NHPI
AIAN
African American
Latino
Household Income
Per Capita
0 $20K $40K $60K $80K
$31,735
$28,342
$27,100
$19,020
$17,933
$17,549
$15,506
$55,906
$68,549
$57,664
$51,369
$38,515
$34,585
$40,920
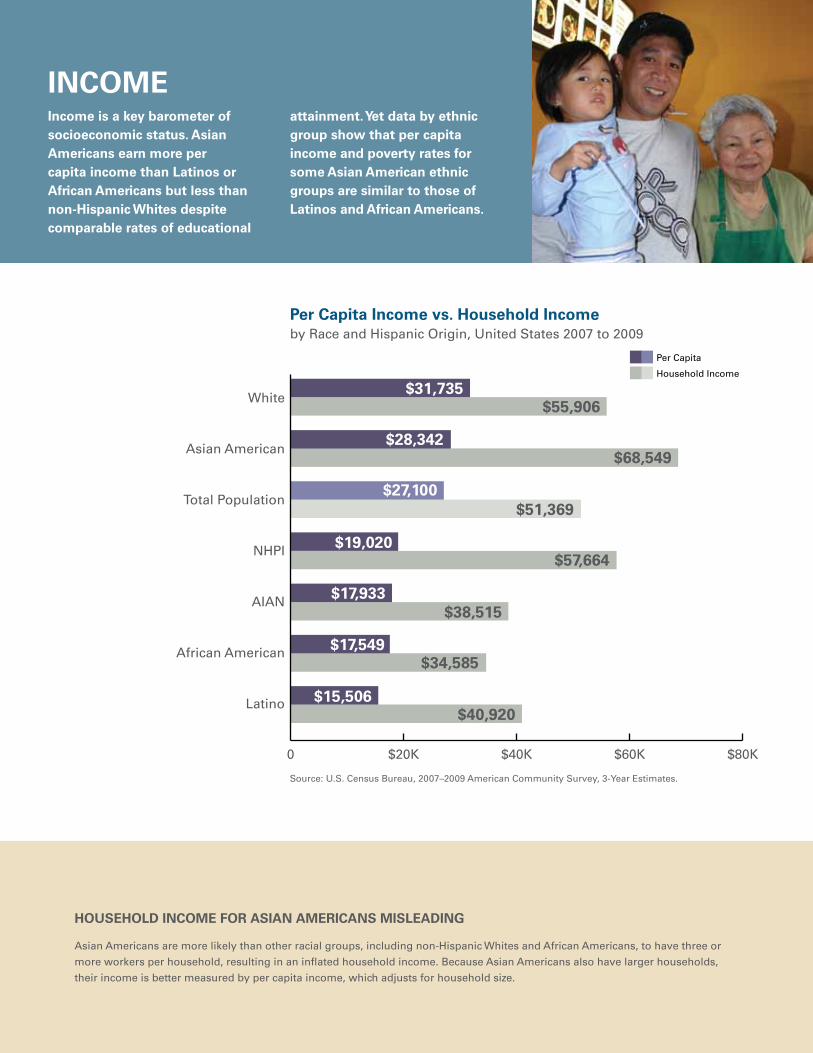
Per capita income vs. Household income by Race and Hispanic Origin, United States 2007 to 2009
Source: U.S. Census Bureau, 2007–2009 American Community Survey, 3-Year Estimates.
incomeincome is a key barometer of socioeconomic status. Asian Americans earn more per capita income than latinos or African Americans but less than non-Hispanic whites despite comparable rates of educational
attainment. yet data by ethnic group show that per capita income and poverty rates for some Asian American ethnic groups are similar to those of latinos and African Americans.
HouSeHold income For ASiAn AmericAnS miSleAdinG
Asian Americans are more likely than other racial groups, including non-Hispanic Whites and African Americans, to have three or
more workers per household, resulting in an inflated household income. Because Asian Americans also have larger households,
their income is better measured by per capita income, which adjusts for household size.

Sri Lankan
Malaysian
Bangladeshi
Asian Indian
Vietnamese
Taiwanese
Pakistani
Korean
Indonesian
Thai
Hmong
Chinese (including Taiwanese)
Total Population
Cambodian
Laotian
Filipino
Japanese
0 10K 20K 30K 40K
$38,312
$36,533
$33,264
$32,480
$31,831
$27,100
$30,061
$26,118
$25,799
$25,729
$24,663
$21,708
$21,542
$16,784
$16,585
$15,940
$10,949
Per capita income by Ethnic Group, United States 2007 to 2009
Source: U.S. Census Bureau, 2007–2009 American Community Survey, 3-Year Estimates.
Per cAPitA income � Asian American per capita income falls below that
of non-Hispanic Whites but exceeds that of every other racial group. Per capita incomes vary con-siderably by Asian American ethnic group.
� Hmong Americans have a per capita income lower than any racial group nationwide, falling below even that of Latinos.
� The per capita incomes of Hmong, Cambodian, Laotian, and Bangladeshi Americans fall below that of African Americans.
� Per capita incomes of Taiwanese, Indian, Malaysian, Sri Lankan, and Japanese Americans exceed that of non-Hispanic Whites.
Per cAPitA income is the mean income computed for every man, woman, and child in a particular group. It is derived by
dividing the total income of a particular group by the total population of that group.
mediAn HouSeHold income divides the income distribution of households (all persons living in the same residence)
into two equal parts, half falling below and half above the median household income.

A Community of Contrasts 35
0 5 10 15 20 25
African American
AIAN
Hispanic
Total Population
NHPI
Asian American
White
25%
23%
22%
14%
14%
11%
10%
Poverty ratesby Race and Hispanic Origin, United States 2007 to 2009
Source: U.S. Census Bureau, 2007–2009 American Community Survey, 3-Year Estimates.Note: Chart contains data for all individuals living beneath the federal poverty line, not family poverty.
The Poverty tHreSHold used by the Census Bureau
in 2009 was an annual income of $21,954 for a family of four.
Poverty by rAce � Approximately 11% of Asian Americans live below the federal pov-
erty line, a rate that exceeds that of non-Hispanic Whites but falls below the national average.
� While poverty among all Americans has increased, the percentage of Asian Americans living beneath the federal poverty line decreased slightly from 2000, when 13% of Asian Americans were poor.
� Poverty varies considerably among Asian American ethnic groups, with some among the most impoverished in the country.
Asian American Center for Advancing Justice36
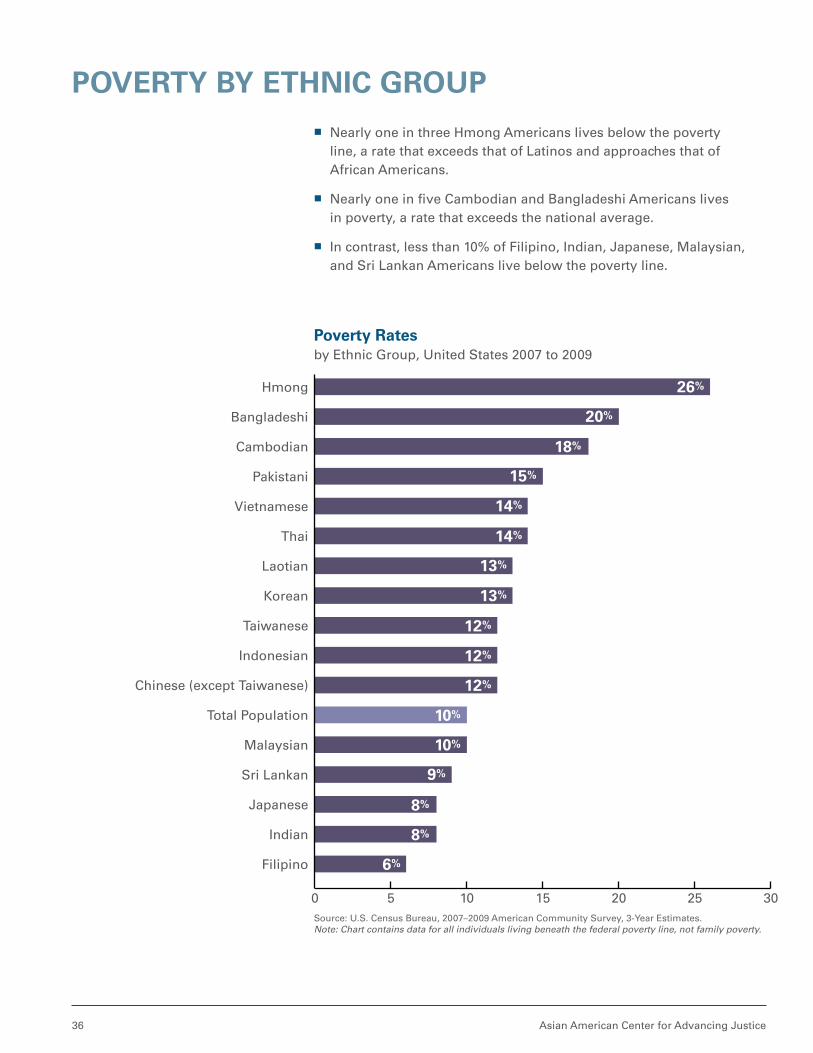
Poverty ratesby Ethnic Group, United States 2007 to 2009
Sri Lankan
Malaysian
Bangladeshi
Indian
Vietnamese
Taiwanese
Pakistani
Korean
Indonesian
Thai
Hmong
Chinese (except Taiwanese)
Cambodian
Total Population
Laotian
Filipino
Japanese
0 5 10 15 20 25 30
26%
20%
18%
15%
14%
14%
13%
13%
12%
12%
12%
10%
10%
9%
8%
8%
6%
Poverty by etHnic GrouP � Nearly one in three Hmong Americans lives below the poverty
line, a rate that exceeds that of Latinos and approaches that of African Americans.
� Nearly one in five Cambodian and Bangladeshi Americans lives in poverty, a rate that exceeds the national average.
� In contrast, less than 10% of Filipino, Indian, Japanese, Malaysian, and Sri Lankan Americans live below the poverty line.
Source: U.S. Census Bureau, 2007–2009 American Community Survey, 3-Year Estimates.Note: Chart contains data for all individuals living beneath the federal poverty line, not family poverty.
A Community of Contrasts 37
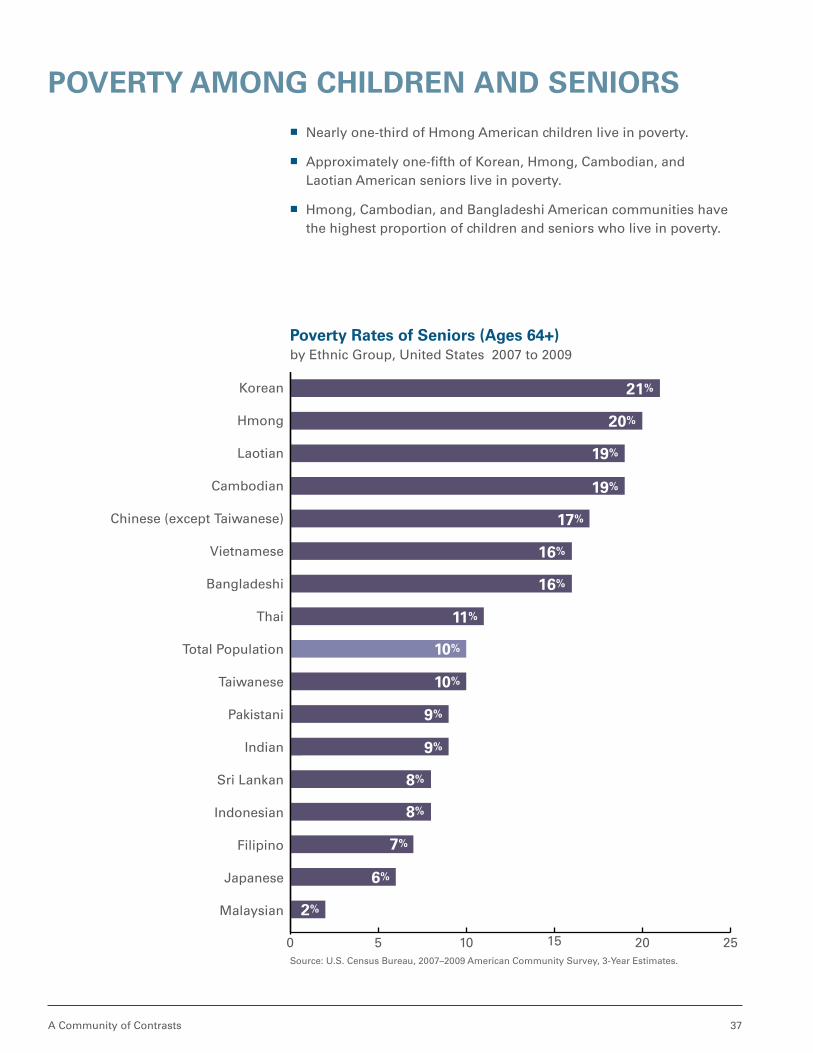
Poverty rates of Seniors (Ages 64+)by Ethnic Group, United States 2007 to 2009
Source: U.S. Census Bureau, 2007–2009 American Community Survey, 3-Year Estimates.
Sri Lankan
Malaysian
Bangladeshi
Indian
Vietnamese
Taiwanese
Pakistani
Korean
Indonesian
Thai
Total Population
Hmong
Chinese (except Taiwanese)
Cambodian
Laotian
Filipino
Japanese
0 5 10 15 20 25
21%
20%
19%
19%
17%
16%
16%
11%
10%
10%
9%
9%
8%
8%
7%
6%
2%
Poverty AmonG cHildren And SeniorS � Nearly one-third of Hmong American children live in poverty.
� Approximately one-fifth of Korean, Hmong, Cambodian, and Laotian American seniors live in poverty.
� Hmong, Cambodian, and Bangladeshi American communities have the highest proportion of children and seniors who live in poverty.

Asian American Center for Advancing Justice38
Percent of Population who receive cash Public Assistanceby Ethnic Group, United States 2007 to 2009
Source: U.S. Census Bureau, 2007–2009 American Community Survey, 3-Year Estimates.Note: Data on Malaysian Americans not reported.
cASH Public ASSiStAnce � Hmong, Cambodian, and Laotian Americans are
more likely than any racial group to access cash public assistance. In 2007–2009, approximately 13% of Hmong, 8% of Cambodian, and 6% of Laotian Americans accessed cash public assis-tance, compared to 5% of African Americans and 4% of Latinos.
� Other Asian American ethnic groups are far less likely to access cash public assistance. Roughly 1% of Indian, Japanese, Pakistani, Sri Lankan, Taiwanese, and Thai Americans access cash public assistance.
� Only 2% of all Asian Americans access cash public assistance, the lowest rate among racial groups.
Sri Lankan
Bangladeshi
Indian
Vietnamese
Taiwanese
Pakistani
Korean
Indonesian
Thai
Hmong
Chinese (except Taiwanese)
Cambodian
Total Population
Laotian
Filipino
Japanese
0 3 6 9 12 15
13%
8%
6%
4%
3%
2%
2%
2%
2%
2%
1%
1%
1%
1%
1%
1%

A Community of Contrasts 39
unemployment rateby Race and Hispanic Origin, United States 2007 to 2009
Source: U.S. Census Bureau, 2007–2009 American Community Survey, 3-Year Estimates.
African American
White
NHPI
AIAN
Asian American
Total Population
Hispanic
0 3 6 9 12 15
13%
13%
10%
9%
8%
6%
6%
� While Asian Americans have lower unemployment rates relative to other racial groups, some Asian American ethnic groups have unemployment rates similar to Latinos and African Americans.
� During the second quarter of 2010, 52% of unem-ployed Asian Americans had been unemployed for more than six months, while 39% had been unemployed for more than a year. Both rates exceeded those of any other racial group.
Source: Economic Policy Institute, February 2011.
An individual’s employment affects her or his standing on a number of key economic indicators, including income and whether one has health insurance. because the majority of Asian Americans are working-age adults, employment is particularly important. while Asian Americans as a group have low unemployment rates
and are disproportionately employed in managerial or professional occupations, some Asian American ethnic groups suffer unemployment rates similar to latinos and African Americans. once unemployed, Asian Americans are likely to be unemployed for longer periods than any other racial group.
emPloyment

unemployment rate for those 16 years of Age and olderby Ethnic Group, United States 2007 to 2009
Source: U.S. Census Bureau, 2007–2009 American Community Survey, 3-Year Estimates.Note: Chart contains data for civilian labor force only.
Sri Lankan
Malaysian
Bangladeshi
Indian
Vietnamese
Taiwanese
Pakistani
Korean
Indonesian
Thai
Hmong
Chinese (except Taiwanese)
Cambodian
Total Population
Laotian
Filipino
Japanese
0 2 4 6 8 10 12
11%
10%
10%
8%
8%
7%
7%
6%
6%
6%
6%
6%
6%
6%
5%
5%
4%
unemPloyment � Hmong, Laotian, and Cambodian Americans have unemployment
rates higher than Latinos and similar to African Americans. Roughly 1 in 10 Hmong, Laotian, and Cambodian Americans in the civilian labor force are without work.
union memberSHiP
• From 2003 to 2007, Asian American workers who were unionized earned 14% more than nonunionized Asian American workers.*
• At 12%, Asian Americans and NHPIs unionized at a slightly higher rate than workers overall (11%).*
*AA and NHPI data are not available separately. Source: Schmitt, John, Hye Jin Rho, and Nicole Woo. January 2011. “Unions and Upward Mobility for Asian Pacific American Workers.” The Center for Economic and Policy Research.
A Community of Contrasts 41
Source: U.S. Census Bureau, 2007–2009 American Community Survey, 3-Year Estimates.Note: Chart contains data for civilian labor force only.
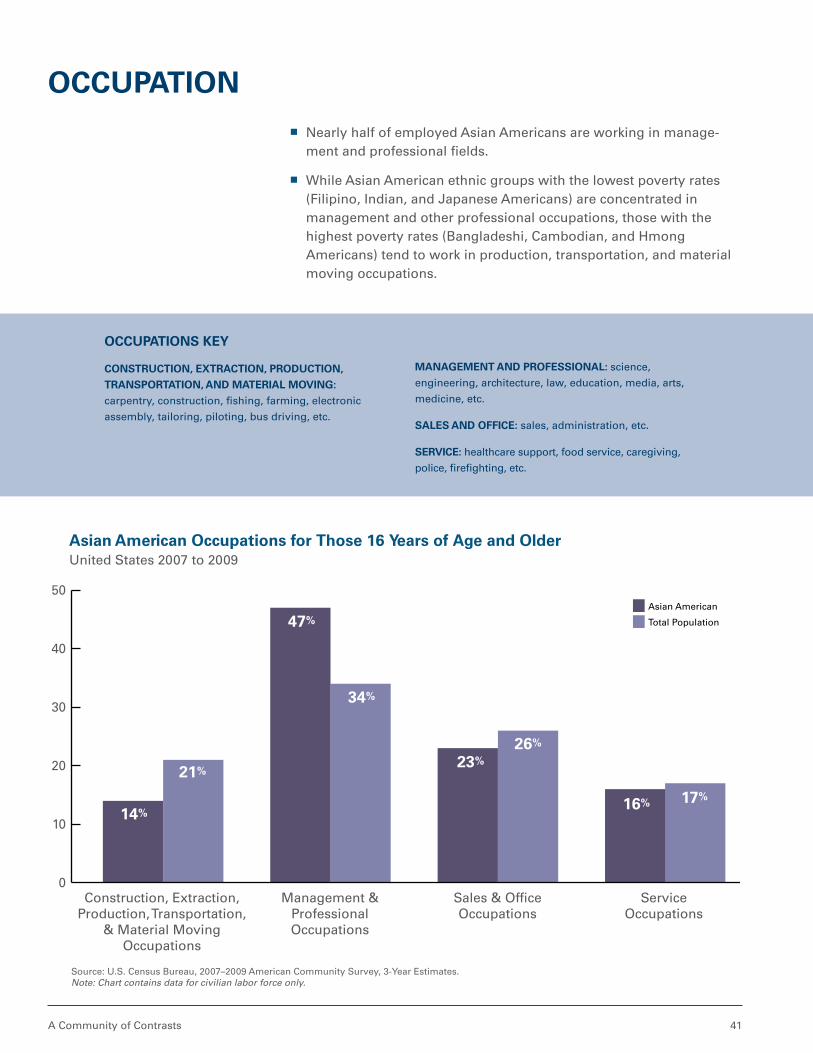
Asian American occupations for those 16 years of Age and olderUnited States 2007 to 2009
Management &ProfessionalOccupations
Sales & Of�ceOccupations
ServiceOccupations
Construction, Extraction,Production, Transportation,
& Material MovingOccupations
0
10
20
30
40
50
Total Population
Asian American
17%16%
26%
23%
34%
47%
21%
14%
occuPAtionS key
conStruction, extrAction, Production,
trAnSPortAtion, And mAteriAl movinG:
carpentry, construction, fishing, farming, electronic
assembly, tailoring, piloting, bus driving, etc.
mAnAGement And ProFeSSionAl: science,
engineering, architecture, law, education, media, arts,
medicine, etc.
SAleS And oFFice: sales, administration, etc.
Service: healthcare support, food service, caregiving,
police, firefighting, etc.
occuPAtion � Nearly half of employed Asian Americans are working in manage-
ment and professional fields.
� While Asian American ethnic groups with the lowest poverty rates (Filipino, Indian, and Japanese Americans) are concentrated in management and other professional occupations, those with the highest poverty rates (Bangladeshi, Cambodian, and Hmong Americans) tend to work in production, transportation, and material moving occupations.

Asian American Center for Advancing Justice42
occupation for ethnic Groups with low Poverty ratesUnited States 2007 to 2009
occupation for ethnic Groups with High Poverty ratesUnited States 2007 to 2009
Filipino Indian Japanese Total Population0
10
20
30
40
50
60
70
41%
14%
26%
20%
64%
9%
20%
7%
49%
11%
27%
14%
35%
22%25%
17%
Bangladeshi Cambodian Hmong Total Population0
5
10
15
20
25
30
35
40
32%
17%17%
33%
21%
19%
36%
24%
20%19%
36%
24%
35%
17%
22%
25%
Source: U.S. Census Bureau, 2007–2009 American Community Survey, 3-Year Estimates.Note: Charts exclude percentages of workers active in the farming, fishing, and forestry industries.
occuPAtion And Poverty
Sales & Of�ce
Service
Construction, Extraction, Production, Transportation, and Material Moving
TYPES OF OCCUPATIONS
Management & Professional

A Community of Contrasts 43
Source: U.S. Census Bureau, 2007–2009 American Community Survey, 3-Year Estimates.
African American
White
Hispanic
Asian American
Total Population
NHPI
AIAN
RenterOwner
0 20 40 60 80 100
45%
49%
48%
56%
59%
66%
73%
55%
51%
52%
44%
41%
34%
27%
Housing is a fundamental human need. Asian Americans are much less likely than non-Hispanic whites to own their own home and often live in overcrowded conditions. despite these challenges, Asian Americans are less likely to utilize government-subsidized housing programs.
HouSinG
� Approximately 59% of Asian Americans are homeowners, while 41% rent their homes. While rates of homeownership among Asian Americans exceed those of Latinos and African Americans, they fall well below those of non-Hispanic Whites. Rates of homeownership vary by Asian American ethnic group.
Percent of Population who Are Homeowners vs. rentersby Race and Hispanic Origin, United States 2007 to 2009

Asian American Center for Advancing Justice44
Percent of Population who Are Homeowners vs. rentersby Ethnic Group, United States 2007 to 2009
Source: U.S. Census Bureau, 2007–2009 American Community Survey, 3-Year Estimates.
Sri Lankan
Malaysian
Bangladeshi
Indian
Vietnamese
Taiwanese
Total Population
Pakistani
Korean
Indonesian
Thai
Hmong
Chinese (except Taiwanese)
Cambodian
Laotian
Filipino
Japanese
0 20 40 60 80 100
44%
48%
49%
51%
53%
55%
55%
55%
56%
61%
62%
63%
63%
63%
64%
66%
66%
56%
52%
51%
49%
47%
45%
45%
45%
44%
39%
38%
37%
37%
37%
36%
34%
34%
RenterOwner
HomeownerSHiP � Over 60% of Taiwanese, Vietnamese, Filipino, Japanese, Laotian,
Chinese, and Sri Lankan Americans are homeowners.
� However, less than half of Bangladeshi, Hmong, and Korean Americans own their homes.
A Community of Contrasts 45
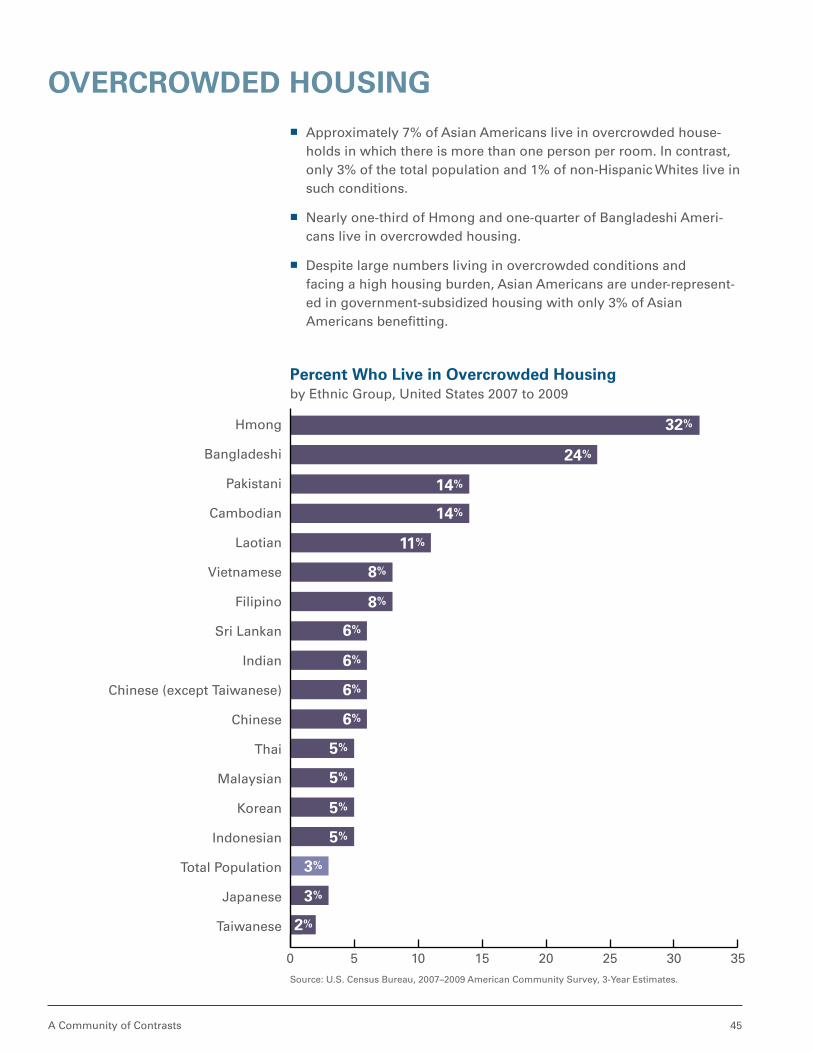
Percent who live in overcrowded Housingby Ethnic Group, United States 2007 to 2009
Sri Lankan
Malaysian
Bangladeshi
Indian
Vietnamese
Taiwanese
Pakistani
Korean
Indonesian
Thai
Hmong
Chinese (except Taiwanese)
Chinese
Cambodian
Total Population
Laotian
Filipino
Japanese
0 5 10 15 20 25 30 35
32%
24%
14%
14%
11%
8%
8%
6%
6%
6%
6%
5%
5%
5%
5%
3%
3%
2%
Source: U.S. Census Bureau, 2007–2009 American Community Survey, 3-Year Estimates.
overcrowded HouSinG � Approximately 7% of Asian Americans live in overcrowded house-
holds in which there is more than one person per room. In contrast, only 3% of the total population and 1% of non-Hispanic Whites live in such conditions.
� Nearly one-third of Hmong and one-quarter of Bangladeshi Ameri-cans live in overcrowded housing.
� Despite large numbers living in overcrowded conditions and facing a high housing burden, Asian Americans are under-represent-ed in government-subsidized housing with only 3% of Asian Americans benefitting.
Asian American Center for Advancing Justice46
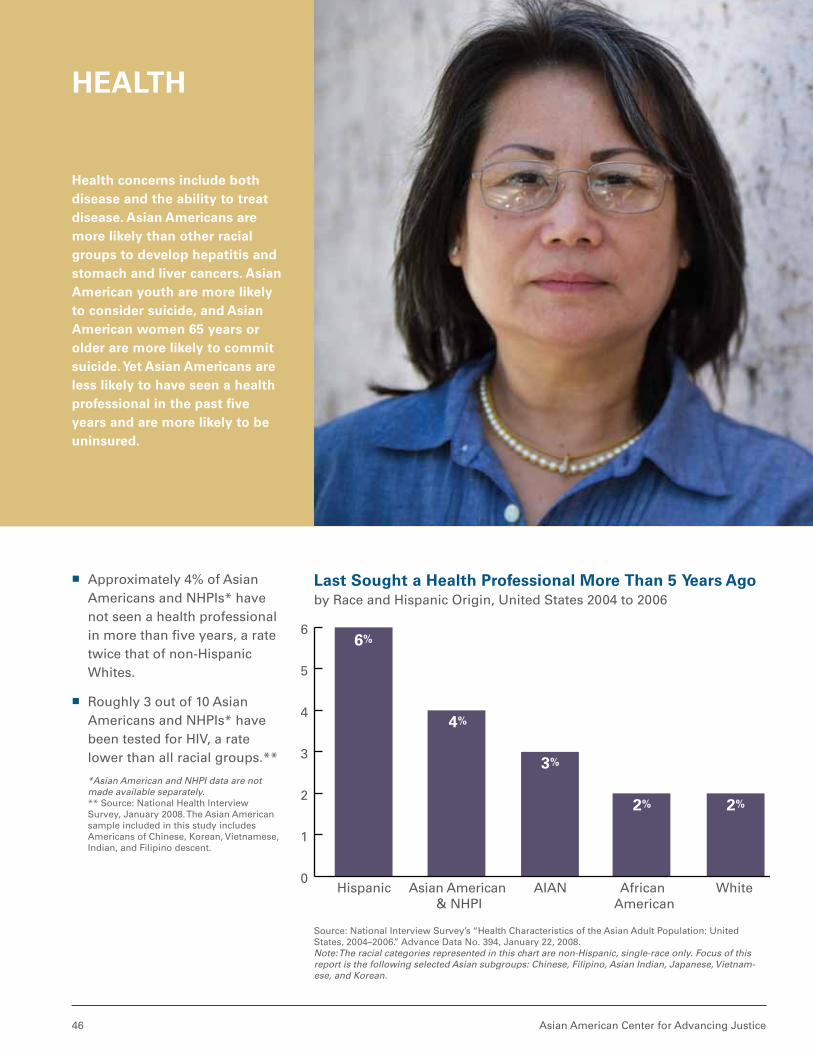
last Sought a Health Professional more than 5 years Agoby Race and Hispanic Origin, United States 2004 to 2006
Source: National Interview Survey’s “Health Characteristics of the Asian Adult Population: United States, 2004–2006.” Advance Data No. 394, January 22, 2008. Note: The racial categories represented in this chart are non-Hispanic, single-race only. Focus of this report is the following selected Asian subgroups: Chinese, Filipino, Asian Indian, Japanese, Vietnam-ese, and Korean.
African American
Hispanic Asian American & NHPI
AIAN White0
1
2
3
4
5
66%
4%
3%
2% 2%
Health concerns include both disease and the ability to treat disease. Asian Americans are more likely than other racial groups to develop hepatitis and stomach and liver cancers. Asian American youth are more likely to consider suicide, and Asian American women 65 years or older are more likely to commit suicide. yet Asian Americans are less likely to have seen a health professional in the past five years and are more likely to be uninsured.
HeAltH
� Approximately 4% of Asian Americans and NHPIs* have not seen a health professional in more than five years, a rate twice that of non-Hispanic Whites.
� Roughly 3 out of 10 Asian Americans and NHPIs* have been tested for HIV, a rate lower than all racial groups.**
*Asian American and NHPI data are not made available separately.** Source: National Health Interview Survey, January 2008. The Asian American sample included in this study includes Americans of Chinese, Korean, Vietnamese, Indian, and Filipino descent.
A Community of Contrasts 47
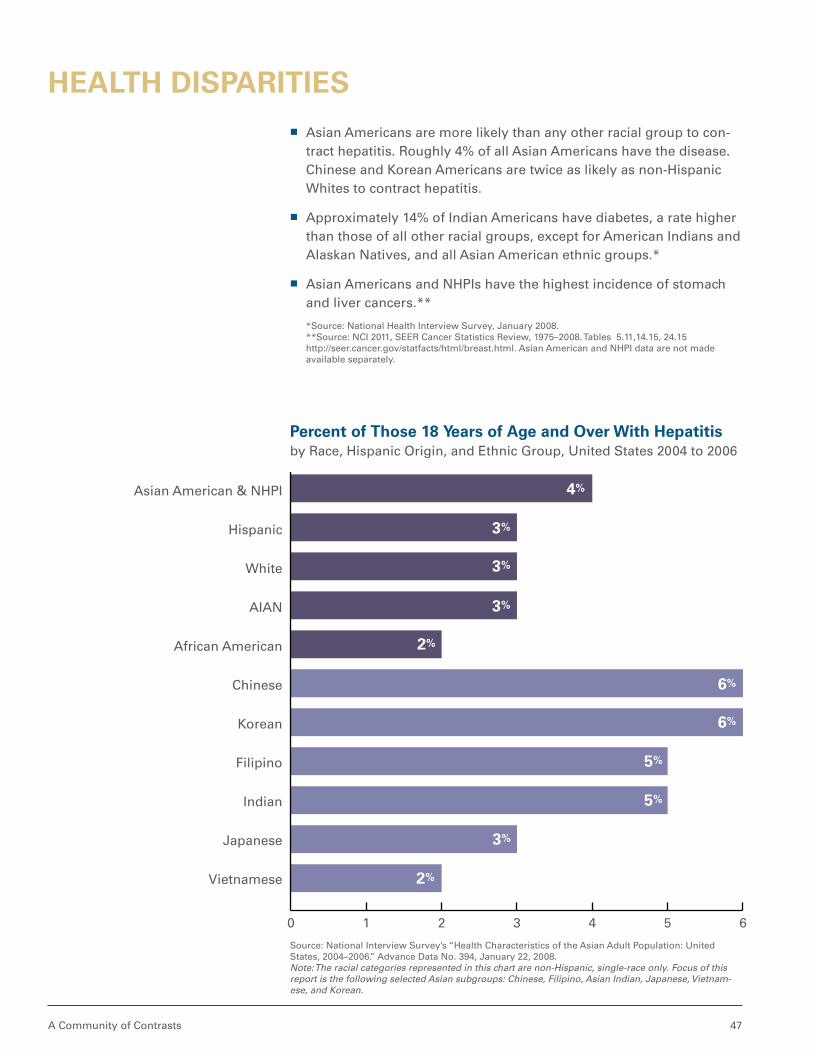
Source: National Interview Survey’s “Health Characteristics of the Asian Adult Population: United States, 2004–2006.” Advance Data No. 394, January 22, 2008. Note: The racial categories represented in this chart are non-Hispanic, single-race only. Focus of this report is the following selected Asian subgroups: Chinese, Filipino, Asian Indian, Japanese, Vietnam-ese, and Korean.
HeAltH diSPAritieS � Asian Americans are more likely than any other racial group to con-
tract hepatitis. Roughly 4% of all Asian Americans have the disease. Chinese and Korean Americans are twice as likely as non-Hispanic Whites to contract hepatitis.
� Approximately 14% of Indian Americans have diabetes, a rate higher than those of all other racial groups, except for American Indians and Alaskan Natives, and all Asian American ethnic groups.*
� Asian Americans and NHPIs have the highest incidence of stomach and liver cancers.**
*Source: National Health Interview Survey, January 2008.**Source: NCI 2011, SEER Cancer Statistics Review, 1975–2008. Tables 5.11,14.15, 24.15 http://seer.cancer.gov/statfacts/html/breast.html. Asian American and NHPI data are not made available separately.
Percent of those 18 years of Age and over with Hepatitisby Race, Hispanic Origin, and Ethnic Group, United States 2004 to 2006
Indian
Vietnamese
Korean
Asian American & NHPI
Hispanic
White
AIAN
African American
Chinese
Filipino
Japanese
0 1 2 3 4 5 6
4%
3%
3%
3%
2%
6%
6%
5%
5%
3%
2%

Percentage of High School Students who Attempted or Seriously considered Suicideby Race and Hispanic Origin, United States 2009
NHPI Hispanic WhiteAIAN Asian American
African American
Seriously Considered Attempting Suicide
Attempted Suicide
0
5
10
15
20
19%
12%
10%
8% 8%
4%5%
19%
15% 15%
13% 13%
Source: The Asian and Pacific Islander American Health Forum’s tabulation of the 2009; Youth Risk Behavior Surveillance System data reported in CDC, 2009.
reFuGee And ASylee mentAl HeAltH
• Approximately 62% of Cambodian Americans in Long Beach, California, report symptoms of post-traumatic stress disorder (PTSD), and 51% reported major depression.*
• A 1998 study of 51 Vietnamese ex-political detainees found higher rates of PTSD and depression than in a comparison group.**
*Source: Marshall et al., 2005. “Mental Health of Cambodian Refugees 2 Decades After Resettlement in the United States,” Journal of the American Medical Association.**Source: Mollica et al., 1998. “The Dose-Effect Relationships between Torture and Psychiatric Symptoms in Vietnamese Ex-Political Detainees and a Comparison Group,” The Journal of Nervous and Mental Disease. Vol. 9 (2).
Suicide � Approximately 15% of Asian American high school students have
seriously considered attempting suicide, a rate higher than both African Americans and non-Hispanic Whites.
� From 2002 to 2006, the highest suicide rates for women ages 65 and older were among Asian Americans and NHPIs, with 6.4 suicides per 100,000.*
*Centers for Disease Control and Prevention. 2009. “National Suicide Statistics at a Glance: Suicide Rates Among Persons Ages 65 Years and Older, by Race/Ethnicity and Sex, United States, 2002–2006.”

medicAre And medicAid
• Approximately 34% of Asian Americans over the age of 65 only have Medicare coverage. In comparison, 29% of non-Hispanic Whites rely solely on Medicare.
• Approximately 74% of Asian Americans under the age of 65 have private health insurance, and only 10% have Medicaid coverage.*
*Source: The Asian and Pacific Islander American Health Forum Tabulation of the 2008 NHIS reported data in CDC, 2010.
inSurAnce � More than one in five Pakistani, Bangladeshi, Korean, and Cambodian
Americans is uninsured.
� Among Asian American ethnic groups, Japanese Americans are most likely to have health insurance.
Percent uninsuredby Ethnic Group, 2007 to 2009
Bangladeshi
Indian
Vietnamese
Taiwanese
Pakistani
Korean
Indonesian
Thai
Hmong
Total Population
Chinese (except Taiwanese)
Cambodian
Laotian
Filipino
Japanese
0 5 10 15 20 25
23%
23%
22%
21%
19%
19%
19%
16%
15%
15%
14%
12%
12%
11%
8%
Source: U.S. Census Bureau, 2007–2009 American Community Survey, 1-Year Estimates.

Asian American Center for Advancing Justice50
civic enGAGementAsian Americans are increasingly becoming citizens, registering to vote, and casting ballots. But significant hurdles hindering full political participation and civic engagement remain. Many of the over 1 million Asian American noncitizens who have met the residency requirements to naturalize will need assistance to become U.S. citizens. Only 55% of Asian Americans eligible to register to vote have registered. Asian American voter turnout still lags behind that of non-Hispanic Whites.
� Corporations, foundations, and the government should promote citizenship through greater investment in civics courses, adult English language learning, and naturalization assistance.
� The federal government should make naturalization and immigration fees affordable and ensure sufficient funding to USCIS to expeditiously process citizenship applications.
� Foundations, political parties, candidates, and other stakeholders should increase their investment in voter registration and mobiliza-tion efforts targeting Asian American communities, including voters who are not fully fluent in English.
� Federal, state, and local agencies and elected officials should guarantee equal access to voting by combating discriminatory voting practices that deny or abridge the right of Asian Americans and others to vote. Voter protection laws should be vigorously enforced and policies and practices that impose additional barriers to voting should be opposed.
� The Department of Justice and state and local voting officials must ensure compliance with and enforcement of Section 203 of the Voting Rights Act, which provides for language assistance to communities that meet certain requirements. Communities with significant popula-tions of Asian American voters should consider providing voluntary language assistance.
immiGrAtionEvery aspect of immigration policy affects Asian Americans. Nearly 60% of Asian Americans are foreign-born, yet there is insufficient public and private investment in programs supporting immigrant integration. The fate of aspiring new Americans hinges on a broken immigration system. Approximately one million Asian Americans are undocumented. Waiting times for family visas range from 2 to 23 years. Under the cur-rent system, immigrants are separated from their families, exploited by unscrupulous employers, denied meaningful educational and employ-ment opportunities, and prevented from contributing fully to American society. In the absence of immigration reform at the federal level, many states have attempted their own “fixes” to immigration law, resulting in a patchwork of laws, many of which are harmful to communities and undermine America’s most fundamental values.
Policy recommendAtionS

A Community of Contrasts 51
� Congress and the President need to address every aspect of the bro-ken immigration system, preferably through comprehensive reform.
� Our system of family immigration provides new immigrants with an integration network and safety net. Repairs to our employment immigration system should not come at the expense of family unity, a cornerstone of U.S. immigration law and policy.
� Women are more reliant on family-based immigration than men, which means that women are overrepresented in visa backlogs. Congress should support changes to the visa system, including reclassifying spouses and minor children of permanent residents as “immediate relatives” to allow families to reunite without having to endure years of separation.
� Congress should amend immigration laws to allow U.S. citizens and permanent residents to sponsor their same-sex, foreign-born partners.
� Congress should provide a path to legalization and citizenship for undocumented immigrants, including immigrant youth who have lived in the United States most of their lives.
� Congress and the courts should preserve the long-established consti-tutional rule that children born in the United States are U.S. citizens. The guarantee of “birthright citizenship” is found in the Fourteenth Amendment, which contains many important civil rights protections.
� Congress should expand legal channels for workers to come to the United States by raising the number of employment-based visas for high-skilled and less-skilled workers, while also guaranteeing full labor and immigration protections.
� Congress should restore judicial discretion, fairness, and due process in immigration hearings and overhaul the immigration detention system.
lAnGuAGeMany Asian Americans are recent immigrants: 1.7 million Asian immi-grants arrived in the United States within the last decade. About one-third of Asian Americans have limited proficiency in English, and in some communities, nearly half are LEP. Both public and private institu-tions must dismantle the barriers that prevent limited-English proficient individuals from accessing safety net services and the justice system. Asian Americans recognize that English is a gateway to citizenship and upward mobility, but many who seek to learn find the demand for English courses greater than the supply.
� Public and private institutions need to ensure meaningful access to programs and services for limited-English proficient individuals, including ensuring adequate funding, supporting the hiring of bilin-gual staff and translation of materials, and actively enforcing Title VI requirements and Executive Order 13166.

Asian American Center for Advancing Justice52
� Government, corporations, foundations, and other stakeholders need to invest in high-quality bilingual K–12 education that promotes English language acquisition as well as academic achievement.
� Both the public and private sectors need to provide sufficient funding to meet the demand for English language programs for adults. The Workforce Investment Act (WIA) and adult educational systems need to be reformed and better funded to provide for this need.
educAtionIt is in the education context that the term “model minority” is most often used to describe Asian Americans. While many in the Asian American community are well educated, others do not complete high school. Many Asian Americans who came as refugees have levels of educational attainment similar to Latinos and African Americans.
� Government, corporations, foundations, and other stakeholders should improve K–12 programs to better address the cultural and linguistic barriers that contribute to educational disparities, including improving programs for English language learners.
� Government agencies and educational institutions should protect and promote affirmative action programs in education. Asian Americans should be included in affirmative action programs, particularly under-represented groups such as Southeast Asians.
income and emPloymentAsian Americans occupy both ends of the socioeconomic spectrum. The per capita income of Asian Americans approaches that of non-Hispanic Whites, but more than 1 in 10 Asian Americans live in poverty. While almost half of Asian Americans work in management and professional fields, Asian Americans work in all occupations, including sales, services, construction, and production.
� Federal, state, and local governments need to strengthen and expand access to safety net programs, including public assistance and un- employment benefits, particularly during times of recession when needs are especially acute. Public benefits must be culturally and linguistically accessible.
� While many Asian Americans have high educational attainment and work in professional fields, some face a “glass ceiling” that blocks their professional advancement. Corporations, law firms, government agencies, academic institutions, and other employers should imple-ment equal opportunity programs that remove barriers to advance-ment in the workplace.
� Federal, state, and local agencies should include Asian Americans in equal opportunity programs, including minority contracting programs. Asian Americans face ongoing discrimination in public contracting and

A Community of Contrasts 53
should be included in minority set-aside programs and allowed to com-plete for government contracts on an equal footing.
� Government agencies at all levels need to ensure vigorous enforce-ment of employment and labor laws, including antidiscrimination provisions and protection against retaliation for workers who assert their rights. This enforcement must extend to workers regardless of immigration status and ensure that all workers are protected.
� Government agencies, unions, and employers should protect collec-tive bargaining rights and support workers’ rights to unionize and organize to challenge unfair employment practices.
HouSinGAccess to quality affordable housing, whether rented or owned, is key to economic stability. Asian American homeownership rates are lower than those of non-Hispanic Whites. A significant percentage of Asian Americans live in overcrowded housing, but only 3% of Asian Americans live in government-subsidized housing.
� Federal, state, and local agencies and private companies need to expand affordable housing and homeownership opportunities for Asian American families.
� All levels of government should vigorously enforce laws prohibit-ing predatory lending practices that target immigrant communities, individuals with limited-English proficiency, and other vulnerable communities.
� With many people losing their homes in the foreclosure crisis, fed-eral, state, and local governments need to fund and expand housing counseling services and consumer protection agencies, such as the Consumer Financial Protection Bureau.
HeAltHHaving access to affordable quality healthcare is a basic human need. Asian Americans need access to quality, affordable health care that is linguistically and culturally appropriate. Asian Americans face specific health disparities, including high rates of hepatitis, liver cancer, and stomach cancer.
� Federal, state, and local governments and private entities such as insurance companies and employers should expand access to afford-able healthcare coverage for all U.S. residents, including immigrants.
� All levels of government, community-based organizations, and those in the health industry should outreach to and educate Asian Ameri-cans about the Patient Protection Affordable Care Act so they can benefit from the expanded availability of healthcare insurance.
Asian American Center for Advancing Justice54
� The federal government and courts should broadly interpret and fully enforce the antidiscrimination provisions of the Patient Protection Affordable Care Act.
� Those in the healthcare industry and federal, state, and local govern-ments need to ensure meaningful access to quality healthcare for persons who are not fluent in English. They can accomplish this by supporting efforts to provide health services in a linguistically and cul-turally appropriate manner and by removing barriers to enrollment.
� The federal government should fully fund or expand programs such as Medicaid and the Children’s Health Insurance Program to ensure Asian Americans with low incomes are able to access basic health-care services, providing a vital lifeline for the most vulnerable mem-bers of our communities.
dAtA collection and reSeArcHSocially and economically diverse and growing dramatically, Asian American communities are complicated to understand and serve. Data collection and research play a critical role in providing policy makers and service providers the information they need to identify community needs and target programs in the most cost-effective manner pos-sible. While the Census Bureau has provided a wealth of disaggregated data on Asian American communities, few other federal, state, or local agencies collect or disseminate disaggregated data, address language barriers in the Asian American community’s ability to participate in research efforts, or reach sufficient sample size in surveys of smaller ethnic groups to provide meaningful findings.
� Data and research produced by both governmental and nongovern-mental entities must include data on Asian Americans, disaggregated by ethnic group where possible. Researchers should work to improve the quantity and quality of survey data on Asian Americans by con-ducting outreach, translating and administering survey instruments, and providing assistance to respondents in Asian languages and oversampling Asian American ethnic groups.
� Federal, state, and local governments and private foundations should re-examine whether adequate resources are being directed to study-ing and serving the needs of Asian American communities, particular-ly Southeast Asians. Government can draw upon the knowledge and experience of community members through the formation of Asian American advisory groups. In many areas, government programs and social service agencies are faced with having to serve greater numbers even as funding is cut. In some areas, Asian American populations may be without linguistically and culturally appropriate programs altogether. It is critical that sufficient funding is directed to meet the needs of diverse Asian American communities.

A Community of Contrasts 55
cHineSe AmericAnSChinese Americans are the largest Asian American ethnic group nation-wide. Approximately 61% are foreign-born. One of the oldest Asian American ethnic groups, Chinese immigrants continue to arrive on American shores at a steady pace, with 29% entering between 2000 and 2010. The majority of Chinese American legal permanent residents (64%) obtained immigrant visas as the immediate relatives of a U.S. citizen or under family-sponsored preferences, while 25% obtained employment-based visas. Chinese Americans are nearly twice as likely as the total population to live in overcrowded housing. Forty-two per-cent of Chinese Americans are limited-English proficient, and 29% are linguistically isolated.
FiliPino AmericAnSFilipino Americans are the second largest Asian American ethnic group nationwide. Approximately 53% of the population is foreign-born. Twenty-seven percent of the foreign-born Filipino American population entered the United States between 2000 and 2010. The vast major-ity of Filipino American legal permanent residents (81%) immigrated as the immediate relatives of U.S. citizens or under family-sponsored preferences. The remaining 11% entered the United States under employment-based preferences. Filipino Americans are nearly three times as likely to live in overcrowded housing than the total U.S. popu-lation. Nearly one in five are limited-English proficient.
indiAn AmericAnSIndian Americans are the third largest and fourth fastest growing Asian American ethnic group, having grown by 68% between 2000 and 2010. Approximately 70% of Indian Americans are foreign-born, and 40% of the foreign-born population entered the United States between 2000 and 2010. Approximately 45% of Indian American legal permanent residents immigrated to the United States under employment-based preferences, and 53% came as the immediate relatives of U.S. citi-zens or under family-sponsored preferences. Indian Americans have generally achieved professional and economic success. The majority (64%) works in a management or professional occupation and their household, median, and per capita income exceeds those of the total population. Despite their material success, over one in five Indian Americans is limited-English proficient.
vietnAmeSe AmericAnSVietnamese Americans are the fourth largest Asian American ethnic group. Approximately 68% are foreign-born, and 19% entered the United States between 2000 and 2010. While the largest number entered before 1990, Vietnam remains the fourth largest sender of immigrants among Asian countries. The vast majority of Vietnamese American legal permanent residents (95%) entered the United States as the immediate relatives of U.S. citizens or under family-sponsored
toP Five lArGeSt GrouPS

Asian American Center for Advancing Justice56
bAnGlAdeSHi AmericAnSBangladeshi Americans are the fastest growing Asian American ethnic group over the past decade, having grown 157% from 2000 to 2010. Approximately 73% are foreign-born, and 41% of the foreign-born popu-lation entered the United States between 2000 and 2010. Nearly three out of four Bangladeshi American legal permanent residents entered as the immediate relatives of U.S. citizens or under family-sponsored preferences. A large minority (19%) entered through the Diversity Visa program. Language barriers pose a significant problem to many Bangladeshi Americans. Nearly half (46%) are limited-English proficient, and one-quarter live in linguistically isolated households. Among Asian American ethnic groups, Bangladeshi Americans are least likely to own their own home. Nearly one in four are without health insurance.
PAkiStAni AmericAnSHaving doubled in size from 2000 to 2010, Pakistani Americans are the second fastest growing and seventh largest Asian American ethnic
toP Five FASteSt GrowinG GrouPS
preferences. Only 1% entered under employment-based preferences. Nearly three out of four Vietnamese American immigrants have become U.S. citizens, highest among Asian American ethnic groups. Approximately 8% live in overcrowded housing, making them twice as likely as the total population to do so. Over half of Vietnamese Americans are limited-English proficient and over one in three are lin-guistically isolated, both highest among Asian American ethnic groups.
koreAn AmericAnSKorean Americans are the fifth largest Asian American ethnic group. Approximately 65% are foreign-born, and 29% of the foreign-born population entered between 2000 and 2010. The majority (53%) entered under employment-based preferences, while 48% entered as the imme-diate relatives of U.S. citizens or under family-sponsored preferences. Approximately 71% of Korean Americans speak a language other than English at home, 41% are limited-English proficient, and 31% live in linguistically isolated households. One in four Korean Americans are without health insurance, highest among Asian American ethnic groups.

A Community of Contrasts 57
group. Approximately 65% are foreign-born, and 34% of the foreign-born population entered between 2000 and 2010. Roughly 81% of Pakistani American legal permanent residents entered the country as the immediate relatives of U.S. citizens or under family-sponsored preferences. A substantial minority (19%) entered under the Diversity Visa program, and 6% entered under employment-based preferences. Approximately 14% of Pakistani Americans live in overcrowded housing, making them over three times as likely as the general population to do so. Roughly one-third is limited-English proficient.
Sri lAnkAn AmericAnSSri Lankan Americans were the third fastest growing Asian American ethnic group between 2000 and 2010, having grown 85% over the decade. Approximately 76% are foreign-born, and 41% of the foreign-born population entered the United States between 2000 and 2010. Approximately 42% of Sri Lankan American legal permanent resi-dents immigrated as the immediate relatives of U.S. citizens or under family-sponsor preferences, 26% entered under employment-based pref-erences, and the remaining 33% entered under diversity, refugee, and asylee preferences. Sri Lankan Americans are three times as likely as the average American to hold an advanced degree and almost twice as likely to work in a management or professional occupation. Sri Lankan Americans are one of the few Asian American ethnic groups whose household, median, and per capita incomes exceed those of the average American. Despite their origins in a former British commonwealth, 72% of Sri Lankan Americans report speaking a language other than English at home, and more than one in five is limited-English proficient.
indiAn AmericAnSSee page 55.
tAiwAneSe AmericAnSTaiwanese Americans were the fifth fastest growing Asian American ethnic group between 2000 and 2010. Approximately 68% are foreign-born, and 24% of the foreign-born population entered between 2000 and 2010. Sixty-six percent arrived as the immediate relatives arrived as the immediate relatives of U.S. citizens or under family-sponsored preferences. Thirty-one percent arrived under employment-based pref-erences. Among Asian American ethnic groups, Taiwanese Americans have the highest educational attainment, with 96% holding a high school degree and 72% holding a bachelor’s degree. They have the highest rates of homeownership and are the least likely to live in over-crowded housing. Language access remains a pressing issue, however, as 43% are limited-English proficient.

Asian American Center for Advancing Justice58
GloSSAry
Asian countries: Defined by the U.S. Department of Homeland Security as including Bangladesh, Bhutan, Burma, Cambodia, China, East Timor, Hong Kong, India, Indonesia, Japan, Laos, Macau, Malaysia, Mal-dives, Mongolia, Nepal, North Korea, Pakistan, Philippines, Singapore, South Korea, Sri Lanka, Taiwan, Thailand, and Vietnam.
buying powerThe “total personal income of residents that is available, after taxes, for spending on virtually everything that they buy, but it does not include dollars that are borrowed or that were saved in previous years.” (Humphreys, 2009)
diversity visa (dv)Type of visa drawn from countries with low rates of immigration to the United States. Unlike other immigrant types, Diversity visas do not require a U.S. sponsor, and therefore a petition is not needed.
family-sponsored preferencesType of visa based on family relationships. Family preference categories include sons and daughters (over the age of 21) of U.S. citizens, the spouses and children of legal permanent residents (LPRs), and the siblings of U.S. citizens.
foreign-bornPeople not born in the United States, Puerto Rico, or the U.S. Island Areas (such as Guam, the U.S. Virgin Islands, or the Northern Mariana Islands).
immediate relatives of u.S. citizens Type of visa based on a close family relationship with a U.S. citizen. Immediate relative is defined as being a spouse, an unmarried child under 21 years of age, an adopted orphan, or parent of a U.S. citizen.
limited-english proficientPersons who speak English less than “very well.”
linguistically isolated householdsHouseholds in which all members 14 years of age and older speak English less than “very well.”
median household incomeA measurement of income that divides the income distribution of households (all persons living in the same residence) into two equal parts, half falling below and half above the median household income.
naturalizationRefers to the process through which a foreign-born individual becomes a citizen of a new coun-try; in this report we refer only to foreign-born individuals who have obtained citizenship in the United States.
overcrowded housingHaving more than one person per room.
per capita incomeThe mean income computed for every man, wom-an, and child in a particular group. It is derived by dividing the total income of a particular group by the total population of that group.
povertyA measure of income relative to the federal pov-erty threshold (the poverty line). Adjusted for fam-ily size, the 2009 Census Bureau poverty thresh-old was $21,954 annually for a family of four.
public assistance incomeIncome that includes general assistance and Temporary Assistance to Needy Families (TANF). Separate payments received for hospital or other medical care (vendor payments) are excluded. This does not include Supplemental Security Income (SSI) or noncash benefits such as food stamps. The terms “public assistance income” and “cash public assistance” are used inter-changeably in the 2009 American Community Survey (ACS) data products.
refugees and asyleesPersons who moved to the United States to escape persecution in their country of origin. Refugees are those who applied for admission while living outside the United States; asylees are those who applied at either a port of entry or while residing in the United States.
removalThe expulsion of an unauthorized immigrant from the United States either because of inadmissibil-ity or deportability.
returnsVoluntary returns, voluntary departures and with-drawals under docket control.

APPendix A: rAce And etHnicity
race and Hispanic origin2000 2010 % Growth
2000 to 2010number % of total number % of total
White, Non-Hispanic 194,552,774 69% 196,817,552 64% 1%
Hispanic 35,305,818 13% 50,477,594 16% 43%
African American 36,419,434 13% 42,020,743 14% 15%
Asian American 11,898,828 4% 17,320,856 6% 46%
American Indian Alaskan Native 4,119,301 1% 5,220,579 2% 27%
Native Hawaiian Pacific Islander 874,414 0% 1,252,650 0% 40%
total 281,421,906 100% 308,745,538 100% 10%
Asian American ethnic Groups2000 2010 % Growth
2000 to 2010number % of AA total number % of AA total
Chinese (except Taiwanese) 2,734,841 23% 3,794,673 22% 39%
Filipino 2,364,815 20% 3,416,840 20% 44%
Asian Indian 1,899,599 16% 3,183,063 18% 68%
Vietnamese 1,223,736 10% 1,737,433 10% 42%
Korean 1,228,427 10% 1,706,822 10% 39%
Japanese 1,148,932 10% 1,304,286 8% 14%
Pakistani 204,309 2% 409,163 2% 100%
Cambodian 206,052 2% 276,667 2% 34%
Hmong 186,310 2% 260,073 2% 40%
Thai 150,283 1% 237,583 1% 58%
Laotian 198,203 2% 232,130 1% 17%
Taiwanese 144,795 1% 230,382 1% 59%
Bangladeshi 57,412 0% 147,300 1% 157%
Burmese NR NR 100,200 1% NR
Indonesian 63,073 1% 95,270 1% 51%
Nepalese NR NR 59,490 0% NR
Sri Lankan 24,587 0.2% 45,381 0% 85%
Malaysian 18,566 0.2% 26,179 0% 41%
Bhutanese NR NR 19,439 0% NR
Asian American total 11,898,828 100% 17,320,856 100% 46%

APPendix b: AA PoPulAtion by StAte
States
2000 2010 % Growth2000 to
2010AA
Population% of Total
AA Popula-
tion
% of Total
California 4,155,685 12% 5,556,592 15% 34%
New York 1,169,200 6% 1,579,494 8% 33%
Texas 644,193 3% 1,110,666 4% 72%
New Jersey 524,356 6% 795,163 9% 52%
Hawaii 703,232 58% 780,968 57% 11%
Illinois 473,649 4% 668,694 5% 41%
Washington 395,741 7% 604,251 9% 53%
Florida 333,013 2% 573,083 3% 72%
Virginia 304,559 4% 522,199 7% 71%
Pennsylvania 248,601 2% 402,587 3% 62%
Massachusetts 264,814 4% 394,211 6% 49%
Maryland 238,408 5% 370,044 6% 55%
Georgia 199,812 2% 365,497 4% 83%
Michigan 208,329 2% 289,607 3% 39%
North Carolina 136,212 2% 252,585 3% 85%
Minnesota 162,414 3% 247,132 5% 52%
Nevada 112,456 6% 242,916 9% 116%
Ohio 159,776 1% 238,292 2% 49%
Arizona 118,672 2% 230,907 4% 95%
Oregon 127,339 4% 186,281 5% 46%
Colorado 120,779 3% 185,589 4% 54%
Connecticut 95,368 3% 157,088 4% 65%
Wisconsin 102,768 2% 151,513 3% 47%
Indiana 72,839 1% 126,750 2% 74%
Missouri 76,210 1% 123,571 2% 62%
Tennessee 68,918 1% 113,398 2% 65%
States
2000 2010 % Growth2000 to
2010AA
Population% of Total
AA Popula-
tion
% of Total
Louisiana 64,350 1% 84,335 1.9% 31%
Oklahoma 58,723 1.7% 84,170 2.2% 43%
Kansas 56,049 2.1% 83,930 2.9% 50%
Utah 48,692 2.2% 77,748 2.8% 60%
South Carolina 44,931 1.1% 75,674 1.6% 68%
Alabama 39,458 0.9% 67,036 1.4% 70%
Iowa 43,119 1.5% 64,512 2.1% 50%
Kentucky 37,062 0.9% 62,029 1.4% 67%
Alaska 32,686 5.2% 50,402 7.1% 54%
Arkansas 25,401 1.0% 44,943 1.5% 77%
Nebraska 26,809 1.6% 40,561 2.2% 51%
New Mexico 26,619 1.5% 40,456 2.0% 52%
Rhode Island 28,290 2.7% 36,763 3.5% 30%
New Hampshire 19,219 1.6% 34,522 2.6% 80%
Delaware 18,944 2.4% 33,701 3.8% 78%
Mississippi 23,281 0.8% 32,560 1.1% 40%
Idaho 17,390 1.3% 29,698 1.9% 71%
District of Columbia 17,956 3.1% 26,857 4.5% 50%
Maine 11,827 0.9% 18,333 1.4% 55%
West Virginia 11,873 0.7% 16,465 0.9% 39%
Montana 7,101 0.8% 10,482 1.1% 48%
Vermont 6,622 1.1% 10,463 1.7% 58%
South Dakota 6,009 0.8% 10,216 1.3% 70%
North Dakota 4,967 0.80% 9,193 1.4% 85%
Wyoming 4,107 0.80% 6,729 1.2% 64%
Total 11,898,828 100% 17,320,856 100% 30%
Asian American Center for Advancing Justice60
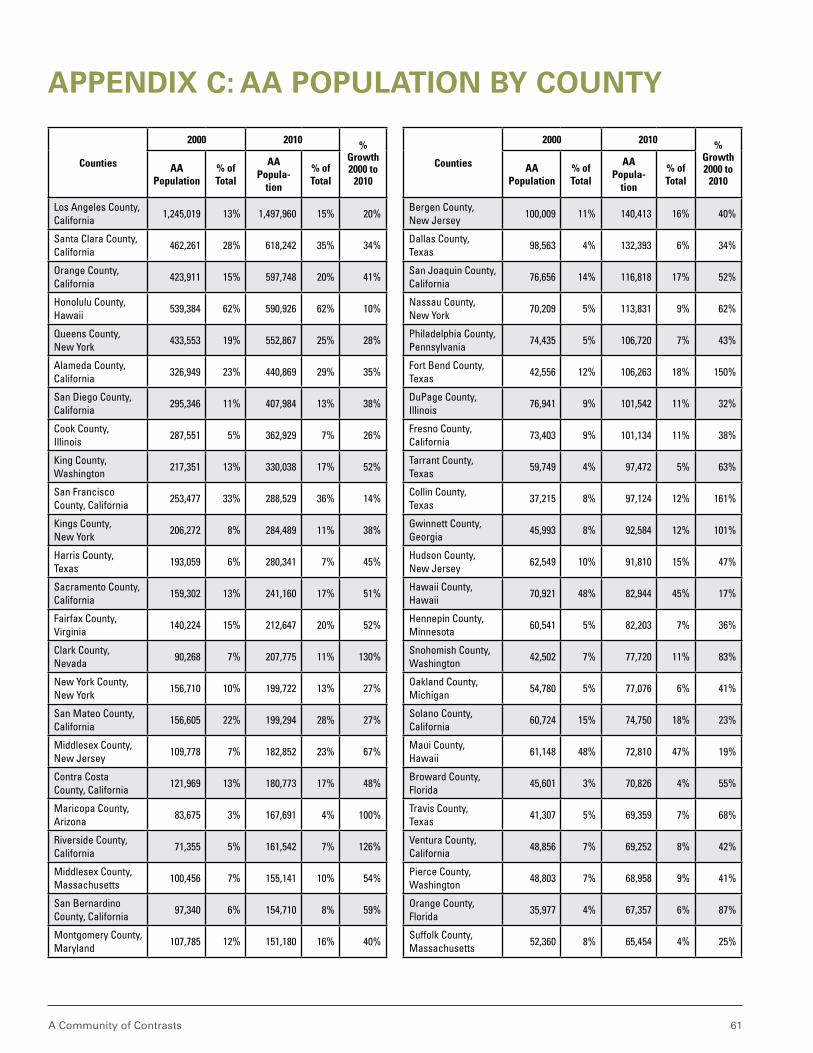
APPendix c: AA PoPulAtion by county
Counties
2000 2010 % Growth2000 to
2010AA
Population% of Total
AA Popula-
tion
% of Total
Los Angeles County, California
1,245,019 13% 1,497,960 15% 20%
Santa Clara County, California
462,261 28% 618,242 35% 34%
Orange County, California
423,911 15% 597,748 20% 41%
Honolulu County, Hawaii
539,384 62% 590,926 62% 10%
Queens County, New York
433,553 19% 552,867 25% 28%
Alameda County, California
326,949 23% 440,869 29% 35%
San Diego County, California
295,346 11% 407,984 13% 38%
Cook County, Illinois
287,551 5% 362,929 7% 26%
King County, Washington
217,351 13% 330,038 17% 52%
San Francisco County, California
253,477 33% 288,529 36% 14%
Kings County, New York
206,272 8% 284,489 11% 38%
Harris County, Texas
193,059 6% 280,341 7% 45%
Sacramento County, California
159,302 13% 241,160 17% 51%
Fairfax County, Virginia
140,224 15% 212,647 20% 52%
Clark County, Nevada
90,268 7% 207,775 11% 130%
New York County, New York
156,710 10% 199,722 13% 27%
San Mateo County, California
156,605 22% 199,294 28% 27%
Middlesex County, New Jersey
109,778 7% 182,852 23% 67%
Contra Costa County, California
121,969 13% 180,773 17% 48%
Maricopa County, Arizona
83,675 3% 167,691 4% 100%
Riverside County, California
71,355 5% 161,542 7% 126%
Middlesex County, Massachusetts
100,456 7% 155,141 10% 54%
San Bernardino County, California
97,340 6% 154,710 8% 59%
Montgomery County, Maryland
107,785 12% 151,180 16% 40%
Counties
2000 2010 % Growth2000 to
2010AA
Population% of Total
AA Popula-
tion
% of Total
Bergen County, New Jersey
100,009 11% 140,413 16% 40%
Dallas County, Texas
98,563 4% 132,393 6% 34%
San Joaquin County, California
76,656 14% 116,818 17% 52%
Nassau County, New York
70,209 5% 113,831 9% 62%
Philadelphia County, Pennsylvania
74,435 5% 106,720 7% 43%
Fort Bend County, Texas
42,556 12% 106,263 18% 150%
DuPage County, Illinois
76,941 9% 101,542 11% 32%
Fresno County, California
73,403 9% 101,134 11% 38%
Tarrant County, Texas
59,749 4% 97,472 5% 63%
Collin County, Texas
37,215 8% 97,124 12% 161%
Gwinnett County, Georgia
45,993 8% 92,584 12% 101%
Hudson County, New Jersey
62,549 10% 91,810 15% 47%
Hawaii County, Hawaii
70,921 48% 82,944 45% 17%
Hennepin County, Minnesota
60,541 5% 82,203 7% 36%
Snohomish County, Washington
42,502 7% 77,720 11% 83%
Oakland County, Michigan
54,780 5% 77,076 6% 41%
Solano County, California
60,724 15% 74,750 18% 23%
Maui County, Hawaii
61,148 48% 72,810 47% 19%
Broward County, Florida
45,601 3% 70,826 4% 55%
Travis County, Texas
41,307 5% 69,359 7% 68%
Ventura County, California
48,856 7% 69,252 8% 42%
Pierce County, Washington
48,803 7% 68,958 9% 41%
Orange County, Florida
35,977 4% 67,357 6% 87%
Suffolk County, Massachusetts
52,360 8% 65,454 4% 25%
A Community of Contrasts 61

Asian American Center for Advancing Justice62
APPendix d: Socioeconomic indicAtorS,
median Age Homeownership (%)
crowded Housing (%)
below Federal Poverty line (%)
cash Public Assistance (%)
High School degree (%)
NHPI 26 African American 45 NHPI 13 African American 25 AIAN 6 Hispanic 61
Hispanic 27 Hispanic 49 Hispanic 13 AIAN 23 NHPI 6 AIAN 80
African American 30 NHPI 48 Asian American 7 Hispanic 22 African American 5 African American 81
AIAN 31 AIAN 56 AIAN 6 NHPI 14 Hispanic 4 Asian American 86
Asian American 33 Asian American 59 African American 4 Asian American 11 Asian American 2 NHPI 85
White 41 White 73 White 1 White 10 White 2 White 90
total Population 37 total Population 66 total Population 3 total Population 14 total Population 2 total Population 85
median Age Homeownership (%)
crowded Housing (%)
below Federal Poverty line (%)
cash Public Assistance (%)
High School degree (%)
Hmong 20 Bangladeshi 44 Hmong 32 Hmong 26 Hmong 13 Hmong 61
Cambodian 27 Hmong 48 Bangladeshi 24 Bangladeshi 20 Cambodian 8 Cambodian 62
Laotian 28 Korean 49 Pakistani 14 Cambodian 18 Laotian 6 Laotian 66
Pakistani 29 Cambodian 51 Cambodian 14 Pakistani 15 Vietnamese 4 Vietnamese 72
Bangladeshi 31 Malaysian 53 Laotian 11 Vietnamese 14 Bangladeshi 3 Bangladeshi 81
Indian 32 Pakistani 55 Vietnamese 8 Thai 14 Filipino 2 Chinese (except Taiwanese)
82
Thai 32 Indonesian 55 Filipino 8 Korean 13 Chinese (except Taiwanese)
2 Thai 84
Korean 33 Thai 55 Chinese(except Taiwanese)
6 Laotian 13 Korean 2 Pakistani 87
Malaysian 33 Indian 56 Sri Lankan 6 Chinese(except Taiwanese)
12 Indonesian 2 Indian 91
Indonesian 33 Sri Lankan 61 Indian 6 Taiwanese 12 Pakistani 1 Korean 92
Filipino 34 Chinese(except Taiwanese)
62 Indonesian 5 Indonesian 12 Thai 1 Filipino 92
Vietnamese 34 Laotian 63 Korean 5 Malaysian 10 Indian 1 Malaysian 93
Chinese(except Taiwanese)
35 Filipino 63 Malaysian 5 Sri Lankan 9 Japanese 1 Sri Lankan 93
Taiwanese 35 Japanese 63 Thai 5 Indian 8 Sri Lankan 1 Indonesian 94
Sri Lankan 36 Vietnamese 64 Japanese 3 Japanese 8 Taiwanese 1 Japanese 94
Japanese 38 Taiwanese 66 Taiwanese 2 Filipino 6 Malaysian NR Taiwanese 96
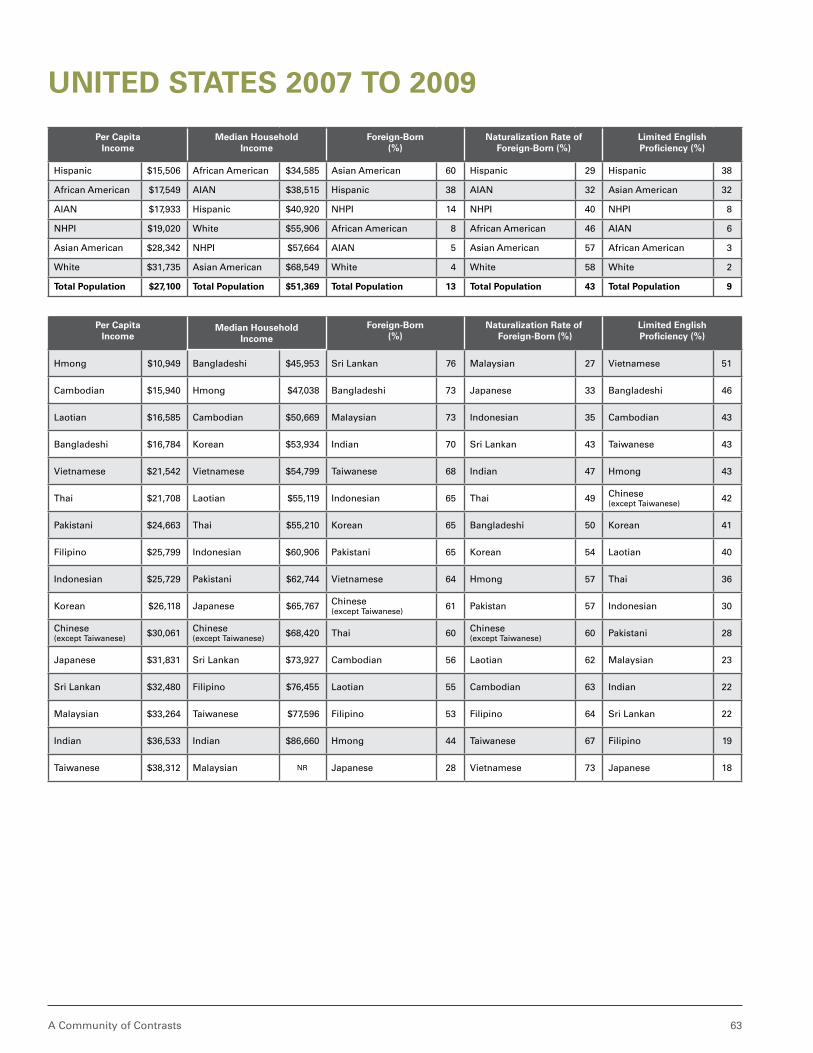
A Community of Contrasts 63
united StAteS 2007 to 2009
Per capita income
median Household income
Foreign-born (%)
naturalization rate of Foreign-born (%)
limited english Proficiency (%)
Hispanic $15,506 African American $34,585 Asian American 60 Hispanic 29 Hispanic 38
African American $17,549 AIAN $38,515 Hispanic 38 AIAN 32 Asian American 32
AIAN $17,933 Hispanic $40,920 NHPI 14 NHPI 40 NHPI 8
NHPI $19,020 White $55,906 African American 8 African American 46 AIAN 6
Asian American $28,342 NHPI $57,664 AIAN 5 Asian American 57 African American 3
White $31,735 Asian American $68,549 White 4 White 58 White 2
total Population $27,100 total Population $51,369 total Population 13 total Population 43 total Population 9
Per capita income
median Household income
Foreign-born (%)
naturalization rate of Foreign-born (%)
limited english Proficiency (%)
Hmong $10,949 Bangladeshi $45,953 Sri Lankan 76 Malaysian 27 Vietnamese 51
Cambodian $15,940 Hmong $47,038 Bangladeshi 73 Japanese 33 Bangladeshi 46
Laotian $16,585 Cambodian $50,669 Malaysian 73 Indonesian 35 Cambodian 43
Bangladeshi $16,784 Korean $53,934 Indian 70 Sri Lankan 43 Taiwanese 43
Vietnamese $21,542 Vietnamese $54,799 Taiwanese 68 Indian 47 Hmong 43
Thai $21,708 Laotian $55,119 Indonesian 65 Thai 49 Chinese (except Taiwanese)
42
Pakistani $24,663 Thai $55,210 Korean 65 Bangladeshi 50 Korean 41
Filipino $25,799 Indonesian $60,906 Pakistani 65 Korean 54 Laotian 40
Indonesian $25,729 Pakistani $62,744 Vietnamese 64 Hmong 57 Thai 36
Korean $26,118 Japanese $65,767 Chinese (except Taiwanese)
61 Pakistan 57 Indonesian 30
Chinese(except Taiwanese)
$30,061 Chinese (except Taiwanese)
$68,420 Thai 60 Chinese (except Taiwanese)
60 Pakistani 28
Japanese $31,831 Sri Lankan $73,927 Cambodian 56 Laotian 62 Malaysian 23
Sri Lankan $32,480 Filipino $76,455 Laotian 55 Cambodian 63 Indian 22
Malaysian $33,264 Taiwanese $77,596 Filipino 53 Filipino 64 Sri Lankan 22
Indian $36,533 Indian $86,660 Hmong 44 Taiwanese 67 Filipino 19
Taiwanese $38,312 Malaysian NR Japanese 28 Vietnamese 73 Japanese 18
Asian American Center for Advancing Justice64
tecHnicAl noteS
measuring the characteristics of racial and ethnic groupsSince 2000, the United States Census Bureau has allowed those responding to its questionnaires to report one or more racial or ethnic backgrounds. While this better reflects America’s diversity and improves data available on multiracial populations, it complicates the use of data on racial and ethnic groups.
Data on race are generally available from the Census Bureau in two forms, for those of a single racial back-ground (referred to as “alone”), with multiracial people captured in an independent category, and for those of either single or multiple racial backgrounds (referred to as “alone or in combination with one or more other races”). Similarly, data on ethnic groups are generally available as “alone” or “alone or in any combination.” In this report, population, population growth, and population characteristics by racial and ethnic group are measured for the “alone or in combination” population unless otherwise noted. Exceptions include the mea-surement of the White population, which is defined here as non-Hispanic White “alone.”
Sources of data used in this reportMost of the data included in this report are drawn from the United States Census Bureau, including the 2010 Census, American Community Survey (ACS) 2009 1-Year Estimates, American Community Survey (ACS) 2007–2009 3-Year Estimates, American Community Survey (ACS) 2005–2009 5-Year Estimates, 2007 Survey of Business Owners, 2008 Current Population Survey (CPS), and 2008 American Housing Survey. Other data included in the report include the Centers for Disease Control and Prevention’s 2008 National Health Interview Survey, U.S. Department of Education’s 2009 National Assessment of Educational Progress (NAEP), U.S. Department of Homeland Security data on legal permanent residents, refugees, asylees, and the undocu-mented population, and U.S. Department of State data on visas issued. Various reports are also cited. Where data on population characteristics are available from multiple sources, data from the American Community Survey (ACS) were preferred, given its inclusion of disaggregated data by Asian American ethnic group.
workS cited
Barnes, Patricia M., Patricia F. Adams, and Eve Powell-Griner. January 22, 2008. “Health Characteristics of the Asian Adult Population: United States, 2004–2006.” The National Health Interview Survey’s Advance Data from Vital and Health Statistics No. 394: 1-22.
Center for Disease Control and Prevention. 2009. “National Suicide Statistics at a Glance: Suicide Rates Among Persons Ages 65 Years and Older, by Race/Ethnicity and Sex, United States, 2002–2006.”
Economic Policy Institute. February 2011. Written Testimony of Algernon Austin, Ph.D., to the U.S. Equal Employment Opportunity Commission. http://www.eeoc.gov/eeoc/meetings/2-16-11/austin.cfm
Economic Policy Institute. May 2010. “Hidden Disadvantage: Asian American Unemployment and the Great Recession” http://www.epi.org/publication /hidden_disadvantage/
Hoefer, Michael, Nancy Rytina, and Bryan C. Baker. January 2010. “Estimates of the Unauthorized Immigrant Population Residing in the United States.” The U.S. Department of Homeland Security’s Population Estimates February 2011: 1-7.
Humphreys, Jeffrey M. Third Quarter 2009. “The Multicultural Economy.” Georgia Business and Economic Conditions 69 (3).
Migration Policy Institute. July 2010. “Dream vs. Reality: An Analysis of Potential DREAM Act Beneficiaries.” http://www.migrationpolicy.org/pubs /DREAM-Insight-July2010.pdf
Migration Policy Institute. May 2011. “Asian Immigrants in the United States.” http://www.migrationinformation.org/USfocus/display.cfm?ID=841
National Health Interview Survey. January 2008. “Health Characteristics of the Asian Adult Population: United States, 2004–2006,” Advance Data No. 394.
Project Vote. April 2011. “First-Time Voters in the 2008 Election.” http://www.projectvote.org/images/publications/Reports%20on%20the%20Electorate /FINAL%20First-Time-Voters-in-2008-Election.pdf
Schmitt, John, Hye Jin Rho, and Nicole Woo. November 2009. “Unions and Upward Mobility for Asian Pacific American Workers. Center for Economic and Policy Research: 1–11.
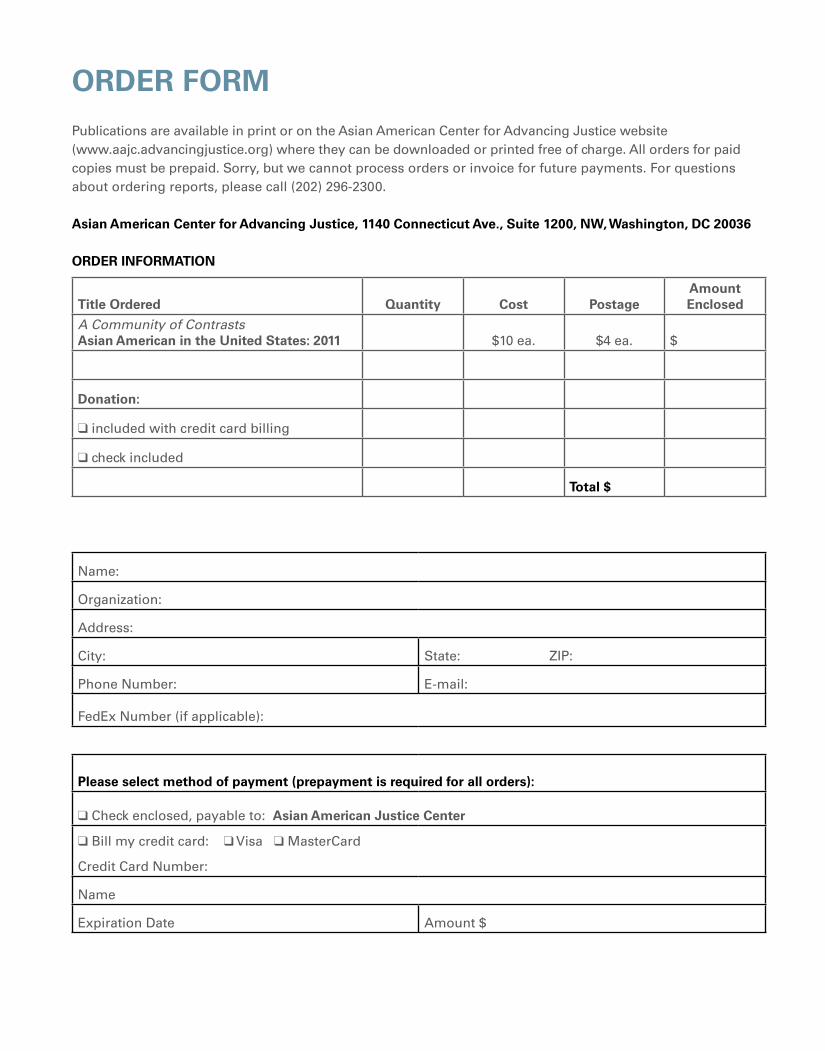
order form
Publications are available in print or on the Asian American Center for Advancing Justice website (www.aajc.advancingjustice.org) where they can be downloaded or printed free of charge. All orders for paid copies must be prepaid. Sorry, but we cannot process orders or invoice for future payments. For questions about ordering reports, please call (202) 296-2300.
Asian American Center for Advancing Justice, 1140 Connecticut Ave., Suite 1200, NW, Washington, dC 20036
order INformAtIoN
title ordered Quantity Cost PostageAmount enclosed
A Community of Contrasts Asian American in the United States: 2011 $10 ea. $4 ea. $
donation:
q included with credit card billing
q check included
total $
Name:
Organization:
Address:
City: State: ZiP:
Phone Number: E-mail:
FedEx Number (if applicable):
Please select method of payment (prepayment is required for all orders):
q Check enclosed, payable to: Asian American Justice Center
q Bill my credit card: q Visa q MasterCard
Credit Card Number:
Name
Expiration Date Amount $
AsiAn AmericAn center for AdvAncing Justice
The Asian American Center for Advancing Justice (Advancing Justice) is a leading Asian American civil rights and social justice organization comprising four equal and independent affiliates: the Asian American Justice Center (AAJC) , Asian Pacific American Legal Center (APALC), Asian American Institute (AAI), and Asian Law Caucus (ALC). Its mission is to promote a fair and equitable society for all by working for civil and human rights and empowering Asian Americans and Native Hawaiians and Pacific Islanders (NHPIs) and other under-served communities.
Each affiliate’s staff has valuable expertise and deep experience. AAJC is one of the nation’s leading experts on issues of importance to the Asian American community and has enacted a sweeping range of programs on critical national concerns. APALC is the nation’s largest legal organ-ization addressing the needs of Asian Americans and NHPIs by advocating for civil rights, provid-ing legal services and education, and building coalitions. AAI is the Midwest’s leading pan-Asian organization dedicated to empowering the Asian American
community through advocacy, research, education, and coali-tion building. ALC is the oldest legal organization in the country defending the civil rights of Asian American and NHPI communi-ties and focuses on the needs of low-income, immigrant, and underserved communities.
While well known in their indi-vidual spheres for their work and expertise, the affiliates of Advancing Justice have come together to build a stronger, more cohesive regional and national civil and human rights infra-structure for the Asian American community. We use our resources to provide valuable information to the community, work to address more issues in more places, impact a greater number of public debates, and help the voices of Asian Americans, NHPIs, and other marginalized and under-served communities be heard.
Please email any questions regarding the report to: [email protected].
Welcome 1
introduction 2
Executive Summary 3
Population 6
Economic Contributions 11
Civic Engagement 13
immigration 17
Age 23
Language 24
Education 30
income 33
Employment 39
Housing 43
Health 46
Policy Recommendations 50
Ethnic Group Highlights 55
Glossary 58
Appendix A: Race & Ethnicity 59
Appendix B: Asian Americans by State 60
Appendix C: Asian Americans by County 61
Appendix D: Socioeconomic Status 62
Technical Notes 64
Order Form 65

Asian American Center for Advancing Justice
A Community of ContrastsAsian Americans in the United States: 2011
Co-authorPrincipal Researcher and Co-author
Asian
Am
erican C
enter fo
r Ad
vancin
g Ju
stice A C
om
mu
nity o
f Co
ntrasts A
sian A
merican
s in th
e Un
ited S
tates: 2011
This report was made possible by the following sponsors: the Wallace H. Coulter Foundation, Cyrus Chung Ying Tang Foundation, and Bank of America.
The statements made and views expressed are solely the responsibility of the authors.
Cyrus Chung Ying Tang Foundation