asian and pacific islander health assessment limitations and more information, please review the...
TRANSCRIPT
Asian and Pacific Islander Health Assessment
Santa Clara County 2017
EXECUTIVE SUMMARY

Executive summary
1
EXECUTIVE SUMMARY The following document summarizes the key data findings of the Asian/Pacific Islander Health Assessment report by Asian subgroups (Asian Indian, Chinese, Filipino, Japanese, Korean and Vietnamese), and Hawaiian and Pacific Islander group (referred to as Pacific Islander group in the document). The key findings include demographic highlights, health disparities and population distribution by subgroups. This information is vital for identifying salient issues and supporting community outreach and engagement. This information may also help in targeting resources for specific Asian/Pacific Islander subgroups.
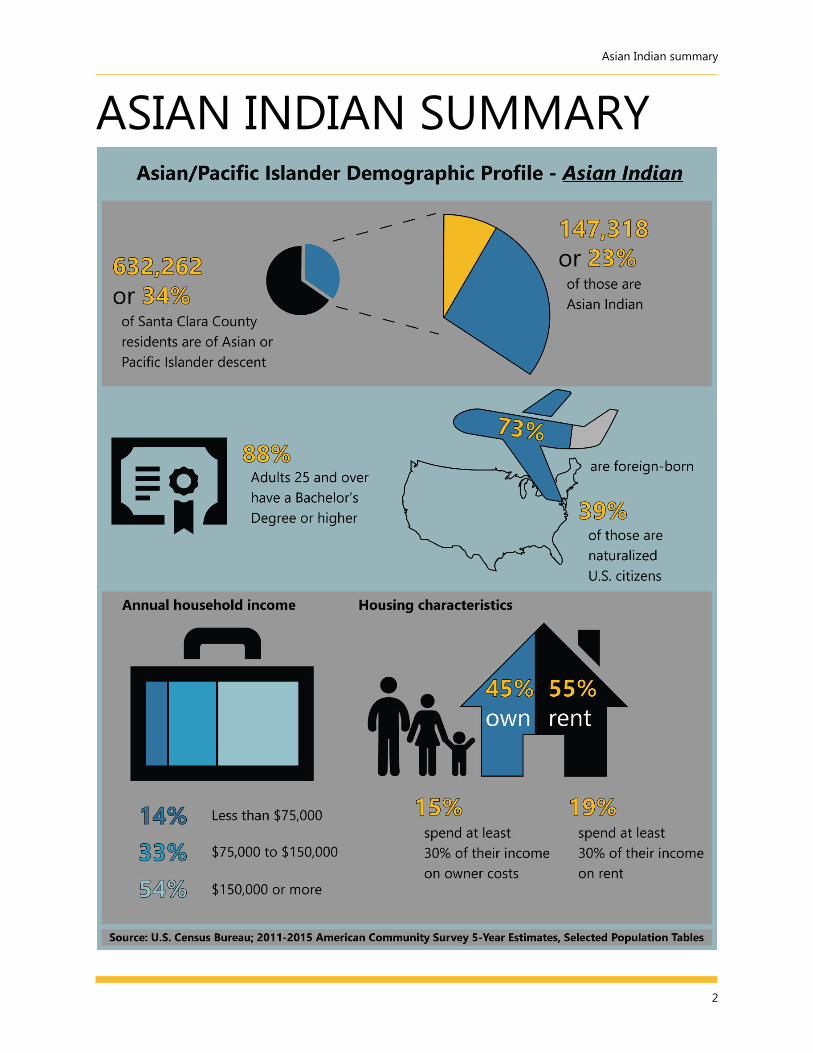
Asian/Pacific Islanders comprise more than a third of Santa Clara County’s population. Even though Asian/Pacific Islanders overall tend to experience better health outcomes than other racial/ethnic groups, noteworthy disparities exist in the health outcomes and health risk behaviors when data are parsed by Asian/Pacific Islander subgroups.
The Asian/Pacific Islander population is integrally present in most of the cities in the county, however, geographical distribution of specific Asian/Pacific Islander subgroups shows segmented population distribution. This information is relevant for addressing the subgroup-specific needs at a community level in order to achieve the goal of health for all.
Asian/Pacific Islander population distribution, Santa Clara County
Source: U.S. Census Bureau, 2010-2014 American Community Survey 5-year estimates.
Asian Indian summary
2
ASIAN INDIAN SUMMARY

Asian Indian summary
3
Asian Indian population distr ibution, Santa Clara County
Source: U.S. Census Bureau, 2010-2014 American Community Survey 5-year estimates.
ASIAN INDIAN KEY FINDINGS • Almost three-quarters (73%) of Asian Indian residents are foreign-
born. • Among Asian/Pacific Islander subgroups, Asian Indians have the
highest birth rate (26.6 births per 1,000 people). • Asian Indians and Japanese have the lowest percentage of
mothers who received inadequate prenatal care (3% each). • Tuberculosis case rate is high among Asian Indians (30.6 cases per
100,000 people). • Among Asian/Pacific Islander subgroups, Asian Indian females
have the highest age-adjusted breast cancer incidence rate (127.8 per 100,000 females).
• Among Asian/Pacific Islander subgroups, Asian Indians have the highest life expectancy at birth (90.9 years).
A higher percentage of Asian Indians reside in areas near Cities of Sunnyvale, and Cupertino.

Asian Indian summary
4
Comparison of select data indicators, Santa Clara County
Notes: Students refer to middle and high school students; seniors refer to adults ages 65 years and older; poverty data are only for Asians. For data sources, limitations and more information, please review the Asian and Pacific Islander Health Assessment report.
Select indicators Asian
Indians Asian/Pacific
Islanders
Santa Clara
County
People ages 5 and older who do not speak English 'very well' (%) 14 35 21
Individuals who are living below 100% Federal Poverty Level (%) 3 8 10
Seniors who are living below 100% Federal Poverty Level (%) 5 13 9
Occupied housing units which are overcrowded (%) 10 9 8
Birth rate per 1,000 people 26.6 15.5 13.1
Teenage birth rate per 1,000 females ages 15 to 19 years 0.5 3.6 19.9
Mothers who received inadequate prenatal care (%) 3 5 8
Adults who are overweight/obese (%) 42 37 --
Students who are overweight/obese (%) 18 21 31
Adults who are current smokers (%) 3 6 --
Students who used electronic cigarette in the past 30 days (%) 1 4 6
Adults who binge drank in the past 30 days (%) 10 13 --
Students who binge drank in the past 30 days (%) 1 2 5
Tuberculosis case rate per 100,000 people 30.6 20.4 8.3
Age-adjusted cancer incidence rate per 100,000 people (all-sites) 315.1 345.4 426.6
Age-adjusted cancer death rate per 100,000 people (all-sites) 72.7 120.5 142.2
Age-adjusted breast cancer incidence rate per 100,000 females 127.8 102.2 125.3
Adults who are ever diagnosed with high blood pressure (%) 18 31 --
Adults who are ever diagnosed with high blood cholesterol (%) 21 29 --
Adults who are ever diagnosed with diabetes (%) 9 11 --
Students who felt sad or hopeless for 2 weeks or more in the past 12 months (%)
31 29 --
Adults who felt they always or usually received social and emotional support (%)
65 52 --
Adults who have health insurance (%) 95 94 --
Adults who needed to see a doctor in the past 12 months but could not because of cost (%)
9 12 --
Adults who did not take medication as prescribed in the past 12 months because of cost (%)
7 9 --
Adults who have dental insurance (%) 90 83 --
Age-adjusted death rate per 100,000 people (all-causes) 625.4 504.9 593.8
Life expectancy at birth (years) 90.9 86.9 83.2
Age-adjusted death rate per 100,000 seniors due to falls -- 29.7 40.7

Chinese summary
5
CHINESE SUMMARY

Chinese summary
6
Chinese population distribution, Santa Clara County
Source: U.S. Census Bureau, 2010-2014 American Community Survey 5-year estimates.
CHINESE KEY FINDINGS • Chinese represent the largest Asian subgroup residing in the
county; accounting for over 1 in 4 Asians (27%). • Sixteen percent (16%) of Chinese seniors ages 65 years and older
are living under 100% Federal Poverty Level. • Chinese have the highest percentage of owner-occupied housing
units (70%) compared to other Asian/Pacific Islander subgroups. • Among Asian/Pacific Islander middle and high school students,
Chinese have the lowest percentage of overweight or obese students (15%).
• More than 4 in 10 Chinese ages 5 years and older (41%) do not speak English 'very well'.
• More than 1 in 3 Chinese survey respondents (34%) reported having a hard time understanding the doctor and needed someone to help them understand the doctor.
• Life expectancy at birth among Chinese residents is 90.5 years; the second highest among Asian/Pacific Islander subgroups.
A higher percentage of Chinese reside in areas near City of Cupertino.

Chinese summary
7
Comparison of select data indicators, Santa Clara County
Select indicators Chinese Asian/Pacific Islanders
Santa Clara
County
People ages 5 and older who do not speak English 'very well' (%) 41 35 21
Individuals who are living below 100% Federal Poverty Level (%) 8 8 10
Seniors who are living below 100% Federal Poverty Level (%) 16 13 9
Occupied housing units which are overcrowded (%) 4 9 8
Birth rate per 1,000 people 15.1 15.5 13.1
Teenage birth rate per 1,000 females ages 15 to 19 years 0.2 3.6 19.9
Mothers who received inadequate prenatal care (%) 5 5 8
Adults who are overweight/obese (%) 28 37 --
Students who are overweight/obese (%) 15 21 31
Adults who are current smokers (%) 3 6 --
Students who used electronic cigarette in the past 30 days (%) 1 4 6
Adults who binge drank in the past 30 days (%) 8 13 --
Students who binge drank in the past 30 days (%) 6 2 5
Tuberculosis case rate per 100,000 people 21.9 20.4 8.3
Age-adjusted cancer incidence rate per 100,000 people (all-sites) 295.5 345.4 426.6
Age-adjusted cancer death rate per 100,000 people (all-sites) 116.7 120.5 142.2
Age-adjusted breast cancer incidence rate per 100,000 females 84.6 102.2 125.3
Adults who are ever diagnosed with high blood pressure (%) 28 31 --
Adults who are ever diagnosed with high blood cholesterol (%) 28 29 --
Adults who are ever diagnosed with diabetes (%) 9 11 --
Students who felt sad or hopeless for 2 weeks or more in the past 12 months (%)
24 29 --
Adults who felt they always or usually received social and emotional support (%)
58 52 --
Adults who have health insurance (%) 94 94 --
Adults who needed to see a doctor in the past 12 months but could not because of cost (%)
11 12 --
Adults who did not take medication as prescribed in the past 12 months because of cost (%)
7 9 --
Adults who have dental insurance (%) 84 83 --
Age-adjusted death rate per 100,000 people (all-causes) 389.5 504.9 593.8
Life expectancy at birth (years) 90.5 86.9 83.2
Age-adjusted death rate per 100,000 seniors due to falls 25.5 29.7 40.7
Notes: Students refer to middle and high school students; seniors refer to adults ages 65 years and older; poverty data are only for Asians. For data sources, limitations and more information, please review the Asian and Pacific Islander Health Assessment report.

Filipino summary
8
FILIPINO SUMMARY
Filipino summary
9
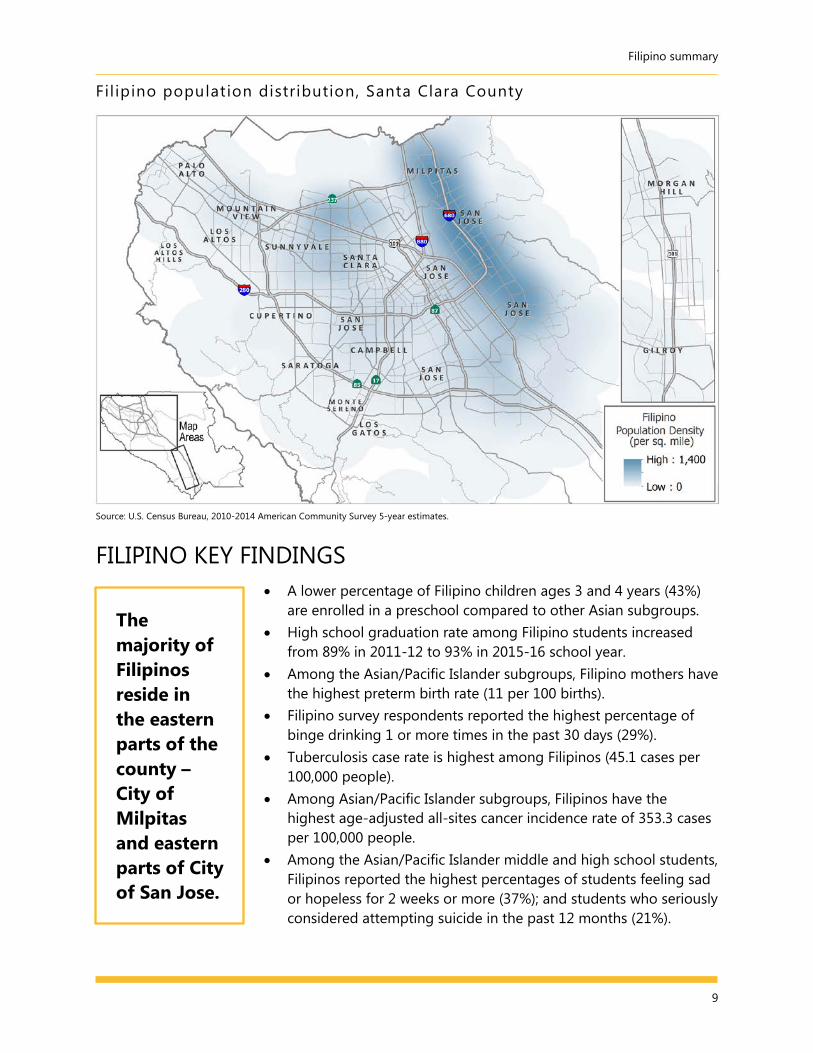
Fil ipino population distribution, Santa Clara County
Source: U.S. Census Bureau, 2010-2014 American Community Survey 5-year estimates.
FILIPINO KEY FINDINGS • A lower percentage of Filipino children ages 3 and 4 years (43%)
are enrolled in a preschool compared to other Asian subgroups. • High school graduation rate among Filipino students increased
from 89% in 2011-12 to 93% in 2015-16 school year. • Among the Asian/Pacific Islander subgroups, Filipino mothers have
the highest preterm birth rate (11 per 100 births). • Filipino survey respondents reported the highest percentage of
binge drinking 1 or more times in the past 30 days (29%). • Tuberculosis case rate is highest among Filipinos (45.1 cases per
100,000 people). • Among Asian/Pacific Islander subgroups, Filipinos have the
highest age-adjusted all-sites cancer incidence rate of 353.3 cases per 100,000 people.
• Among the Asian/Pacific Islander middle and high school students, Filipinos reported the highest percentages of students feeling sad or hopeless for 2 weeks or more (37%); and students who seriously considered attempting suicide in the past 12 months (21%).
The majority of Filipinos reside in the eastern parts of the county – City of Milpitas and eastern parts of City of San Jose.

Filipino summary
10
Comparison of select data indicators, Santa Clara County
Select indicators Filipinos Asian/Pacific Islanders
Santa Clara
County
People ages 5 and older who do not speak English 'very well' (%) 26 35 21
Individuals who are living below 100% Federal Poverty Level (%) 5 8 10
Seniors who are living below 100% Federal Poverty Level (%) 6 13 9
Occupied housing units which are overcrowded (%) 15 9 8
Birth rate per 1,000 people 10.3 15.5 13.1
Teenage birth rate per 1,000 females ages 15 to 19 years 8.3 3.6 19.9
Mothers who received inadequate prenatal care (%) 8 5 8
Adults who are overweight/obese (%) 54 37 --
Students who are overweight/obese (%) 32 21 31
Adults who are current smokers (%) 10 6 --
Students who used electronic cigarette in the past 30 days (%) 8 4 6
Adults who binge drank in the past 30 days (%) 29 13 --
Students who binge drank in the past 30 days (%) 5 2 5
Tuberculosis case rate per 100,000 people 45.1 20.4 8.3
Age-adjusted cancer incidence rate per 100,000 people (all-sites) 353.3 345.4 426.6
Age-adjusted cancer death rate per 100,000 people (all-sites) 133.5 120.5 142.2
Age-adjusted breast cancer incidence rate per 100,000 females 102.0 102.2 125.3
Adults who are ever diagnosed with high blood pressure (%) 33 31 --
Adults who are ever diagnosed with high blood cholesterol (%) 26 29 --
Adults who are ever diagnosed with diabetes (%) 13 11 --
Students who felt sad or hopeless for 2 weeks or more in the past 12 months (%)
37 29 --
Adults who felt they always or usually received social and emotional support (%)
58 52 --
Adults who have health insurance (%) 94 94 --
Adults who needed to see a doctor in the past 12 months but could not because of cost (%)
12 12 --
Adults who did not take medication as prescribed in the past 12 months because of cost (%)
11 9 --
Adults who have dental insurance (%) 91 83 --
Age-adjusted death rate per 100,000 people (all-causes) 487.3 504.9 593.8
Life expectancy at birth (years) 86.3 86.9 83.2
Age-adjusted death rate per 100,000 seniors due to falls 27.9 29.7 40.7
Notes: Students refer to middle and high school students; seniors refer to adults ages 65 years and older; poverty data are only for Asians. For data sources, limitations and more information, please review the Asian and Pacific Islander Health Assessment report.

Japanese summary
11
JAPANESE SUMMARY

Japanese summary
12
Japanese population distribution, Santa Clara County
Source: U.S. Census Bureau, 2010-2014 American Community Survey 5-year estimates.
JAPANESE KEY FINDINGS • Japanese have the highest proportion of seniors, people ages 65
years and older, (21%) compared to population composition of other Asian/Pacific Islander subgroups.
• Among the Asian/Pacific Islander subgroups, Japanese have the lowest percentage of foreign-born residents who are naturalized U.S. citizens (21%).
• Japanese survey respondents reported the highest percentages of adults ever diagnosed with high blood pressure (48%); and adults ever diagnosed with high blood cholesterol (43%).
• Japanese survey respondents reported the highest percentage of adults with healthcare coverage (98%).
• Age-adjusted death rate due to unintentional falls among Japanese seniors ages 65 and older (41.6 per 100,000 people) is higher than other Asian/Pacific Islander subgroups.
• Japanese residents have the lowest age-adjusted all-cause death rate (358.2 deaths per 100,000 people) compared to other Asian/Pacific Islander subgroups.
A higher percentage of Japanese reside in areas near western parts of City of San Jose and cities of Cupertino and Sunnyvale.

Japanese summary
13
Comparison of select data indicators, Santa Clara County
Select indicators Japanese Asian/Pacific Islanders
Santa Clara
County
People ages 5 and older who do not speak English 'very well' (%) 25 35 21
Individuals who are living below 100% Federal Poverty Level (%) 5 8 10
Seniors who are living below 100% Federal Poverty Level (%) 4 13 9
Occupied housing units which are overcrowded (%) 3 9 8
Birth rate per 1,000 people 11.1 15.5 13.1
Teenage birth rate per 1,000 females ages 15 to 19 years -- 3.6 19.9
Mothers who received inadequate prenatal care (%) 3 5 8
Adults who are overweight/obese (%) 37 37 --
Students who are overweight/obese (%) 23 21 31
Adults who are current smokers (%) 3 6 --
Students who used electronic cigarette in the past 30 days (%) 6 4 6
Adults who binge drank in the past 30 days (%) 9 13 --
Students who binge drank in the past 30 days (%) 3 2 5
Tuberculosis case rate per 100,000 people -- 20.4 8.3
Age-adjusted cancer incidence rate per 100,000 people (all-sites) 293.7 345.4 426.6
Age-adjusted cancer death rate per 100,000 people (all-sites) 108.7 120.5 142.2
Age-adjusted breast cancer incidence rate per 100,000 females 100.7 102.2 125.3
Adults who are ever diagnosed with high blood pressure (%) 48 31 --
Adults who are ever diagnosed with high blood cholesterol (%) 43 29 --
Adults who are ever diagnosed with diabetes (%) 13 11 --
Students who felt sad or hopeless for 2 weeks or more in the past 12 months (%)
21 29 --
Adults who felt they always or usually received social and emotional support (%)
65 52 --
Adults who have health insurance (%) 98 94 --
Adults who needed to see a doctor in the past 12 months but could not because of cost (%)
10 12 --
Adults who did not take medication as prescribed in the past 12 months because of cost (%)
5 9 --
Adults who have dental insurance (%) 78 83 --
Age-adjusted death rate per 100,000 people (all-causes) 358.2 504.9 593.8
Life expectancy at birth (years) 88.0 86.9 83.2
Age-adjusted death rate per 100,000 seniors due to falls 41.6 29.7 40.7
Notes: Students refer to middle and high school students; seniors refer to adults ages 65 years and older; poverty data are only for Asians. For data sources, limitations and more information, please review the Asian and Pacific Islander Health Assessment report.

Korean summary
14
KOREAN SUMMARY

Korean summary
15
Korean population distribution, Santa Clara County
Source: U.S. Census Bureau, 2010-2014 American Community Survey 5-year estimates.
KOREAN KEY FINDINGS • More than 7 in 10 (71%) Korean residents are foreign-born. • More than 4 in 10 Koreans ages 5 years and older (43%) do not
speak English 'very well'. • A higher percentage of Korean (38%) and Vietnamese survey
respondents (41%) reported having a hard time understanding the doctor and needed someone to help them understand the doctor.
• A higher percentage of Korean seniors, ages 65 years and older, (18%) are living under 100% Federal Poverty Level.
• Among the Asian/Pacific Islander subgroups, Koreans have the lowest age-adjusted all-sites cancer incidence rate (252.5 cases per 100,000 people), but the highest age-adjusted all-sites cancer death rate (155.3 deaths per 100,000 people).
• Korean survey respondents reported the highest percentage of adults ever diagnosed with diabetes (16%).
• Suicide is the leading cause of injury deaths among Koreans (40%); accounting for the highest age-adjusted suicide rate (8 deaths per 100,000 people) among Asian/Pacific Islander subgroups.
A higher percentage of Koreans reside near areas of western parts of City of San Jose and adjoining areas.

Korean summary
16
Comparison of select data indicators, Santa Clara County
Select indicators Koreans Asian/Pacific Islanders
Santa Clara
County
People ages 5 and older who do not speak English 'very well' (%) 43 35 21
Individuals who are living below 100% Federal Poverty Level (%) 8 8 10
Seniors who are living below 100% Federal Poverty Level (%) 18 13 9
Occupied housing units which are overcrowded (%) 7 9 8
Birth rate per 1,000 people 12.7 15.5 13.1
Teenage birth rate per 1,000 females ages 15 to 19 years -- 3.6 19.9
Mothers who received inadequate prenatal care (%) 4 5 8
Adults who are overweight/obese (%) 30 37 --
Students who are overweight/obese (%) 24 21 31
Adults who are current smokers (%) 7 6 --
Students who used electronic cigarette in the past 30 days (%) 1 4 6
Adults who binge drank in the past 30 days (%) 18 13 --
Students who binge drank in the past 30 days (%) 2 2 5
Tuberculosis case rate per 100,000 people -- 20.4 8.3
Age-adjusted cancer incidence rate per 100,000 people (all-sites) 252.5 345.4 426.6
Age-adjusted cancer death rate per 100,000 people (all-sites) 155.3 120.5 142.2
Age-adjusted breast cancer incidence rate per 100,000 females 49.4 102.2 125.3
Adults who are ever diagnosed with high blood pressure (%) 36 31 --
Adults who are ever diagnosed with high blood cholesterol (%) 27 29 --
Adults who are ever diagnosed with diabetes (%) 16 11 --
Students who felt sad or hopeless for 2 weeks or more in the past 12 months (%)
33 29 --
Adults who felt they always or usually received social and emotional support (%)
23 52 --
Adults who have health insurance (%) 94 94 --
Adults who needed to see a doctor in the past 12 months but could not because of cost (%)
15 12 --
Adults who did not take medication as prescribed in the past 12 months because of cost (%)
8 9 --
Adults who have dental insurance (%) 64 83 --
Age-adjusted death rate per 100,000 people (all-causes) 430.7 504.9 593.8
Life expectancy at birth (years) 90.0 86.9 83.2
Age-adjusted death rate per 100,000 seniors due to falls -- 29.7 40.7
Notes: Students refer to middle and high school students; seniors refer to adults ages 65 years and older; poverty data are only for Asians. For data sources, limitations and more information, please review the Asian and Pacific Islander Health Assessment report.
Vietnamese summary
17
VIETNAMESE SUMMARY

Vietnamese summary
18
Vietnamese population distr ibution, Santa Clara County
Source: U.S. Census Bureau, 2010-2014 American Community Survey 5-year estimates.
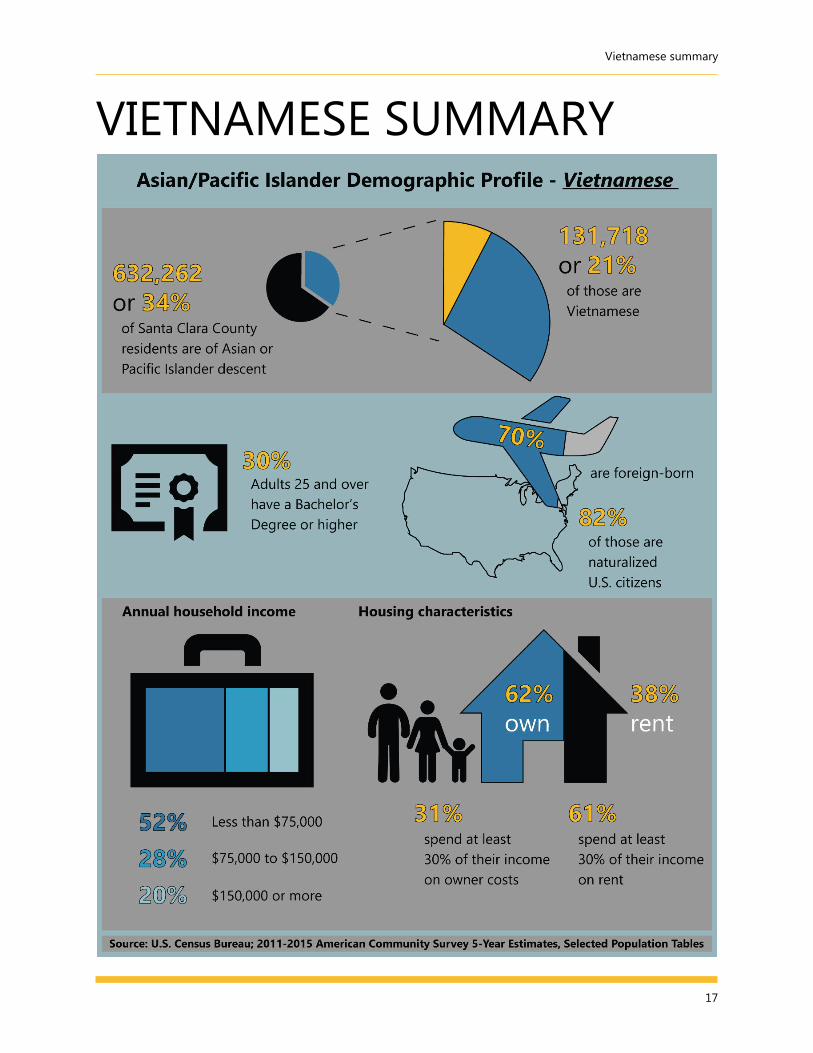
VIETNAMESE KEY FINDINGS • More than 4 in 5 foreign-born Vietnamese (82%) are naturalized U.S.
citizens. • Among the Asian/Pacific Islander subgroups, Vietnamese ages 5 years
and older have the highest percentage of people who do not speak English 'very well' (57%).
• Vietnamese have the lowest percentage of children ages 3 and 4 years enrolled in a preschool compared to other Asian subgroups (40%).
• Among the Asian/Pacific Islander subgroups, Vietnamese have the lowest median annual household income of $71,758 and the highest percentage of people (14%) and seniors, ages 65 years and older, (19%) living below 100% Federal Poverty Level.
• Tuberculosis case rate is high among Vietnamese (37.7 cases per 100,000 people).
• Vietnamese have the highest age-adjusted liver cancer incidence and death rates (37.9 cases and 24.4 deaths per 100,000 people).
• Vietnamese survey respondents reported the highest percentage of adults not taking medication as prescribed in the past 12 months because of cost (17%).
The majority of Vietnamese reside in areas near eastern and south-eastern parts of City of San Jose.

Vietnamese summary
19
Comparison of select data indicators, Santa Clara County
Select indicators Vietnamese Asian/Pacific
Islanders
Santa Clara
County
People ages 5 and older who do not speak English 'very well' (%) 57 35 21
Individuals who are living below 100% Federal Poverty Level (%) 14 8 10
Seniors who are living below 100% Federal Poverty Level (%) 19 13 9
Occupied housing units which are overcrowded (%) 12 9 8
Birth rate per 1,000 people 10.8 15.5 13.1
Teenage birth rate per 1,000 females ages 15 to 19 years 3.4 3.6 19.9
Mothers who received inadequate prenatal care (%) 8 5 8
Adults who are overweight/obese (%) 31 37 --
Students who are overweight/obese (%) 20 21 31
Adults who are current smokers (%) 8 6 --
Students who used electronic cigarette in the past 30 days (%) 4 6 4
Adults who binge drank in the past 30 days (%) 16 13 --
Students who binge drank in the past 30 days (%) 3 2 5
Tuberculosis case rate per 100,000 people 37.7 20.4 8.3
Age-adjusted cancer incidence rate per 100,000 people (all-sites) 315.6 345.4 426.6
Age-adjusted cancer death rate per 100,000 people (all-sites) 131.3 120.5 142.2
Age-adjusted breast cancer incidence rate per 100,000 females 70.6 102.2 125.3
Adults who are ever diagnosed with high blood pressure (%) 36 31 --
Adults who are ever diagnosed with high blood cholesterol (%) 37 29 --
Adults who are ever diagnosed with diabetes (%) 11 11 -- Students who felt sad or hopeless for 2 weeks or more in the past 12 months (%)
31 29 --
Adults who felt they always or usually received social and emotional support (%)
34 52 --
Adults who have health insurance (%) 91 94 -- Adults who needed to see a doctor in the past 12 months but could not because of cost (%)
16 12 --
Adults who did not take medication as prescribed in the past 12 months because of cost (%)
17 9 --
Adults who have dental insurance (%) 84 83 --
Age-adjusted death rate per 100,000 people (all-causes) 544.6 504.9 593.8
Life expectancy at birth (years) 88.6 86.9 83.2
Age-adjusted death rate per 100,000 seniors due to falls 18.6 29.7 40.7
Notes: Students refer to middle and high school students; seniors refer to adults ages 65 years and older; poverty data are only for Asians. For data sources, limitations and more information, please review the Asian and Pacific Islander Health Assessment report.

Pacific Islanders summary
20
PACIFIC ISLANDERS SUMMARY

Pacific Islanders summary
21
Pacif ic Islander population distr ibution, Santa Clara County
Source: U.S. Census Bureau, 2010-2014 American Community Survey 5-year estimates.
PACIFIC ISLANDER KEY FINDINGS • Among the Asian/Pacific Islander subgroups, Pacific Islanders ages 25
years and older have the lowest percentage of having attained a Bachelor’s degree or higher (19%).
• Pacific Islanders have the highest unemployment rate (16%). • Among Asian/Pacific Islander subgroups, Pacific Islander mothers have
the poorest birth outcomes: highest inadequate prenatal care (21%), teenage birth rate (20.3 births per 1,000 females ages 15 to 19 years), and infant mortality rate (10.5 per 1,000 live births).
• Overweight or obesity is the highest among Pacific Islanders: 77% adult survey respondents and 49% middle and high school students.
• A higher percentage of Pacific Islander middle and high school students reported feeling sad or hopeless for 2 weeks or more in the past 12 months (34%).
• Pacific Islander survey respondents reported the lowest percentage of adults with healthcare coverage (79%) and highest percentage of adults who needed to see a doctor in the past 12 months but could not because of cost (35%).
• Pacific Islanders have the lowest life expectancy at birth (78.7 years).
A higher percentage of Pacific Islanders reside in areas near City of Sunnyvale and parts of City of San Jose.

Pacific Islanders summary
22
Comparison of select data indicators, Santa Clara County
Select indicators Pacific
Islanders Asian/Pacific
Islanders
Santa Clara
County
People ages 5 and older who do not speak English ‘very well' (%) 12 35 21
Individuals who are living below 100% Federal Poverty Level (%) 9 8 10
Seniors who are living below 100% Federal Poverty Level (%) 6 13 9
Occupied housing units which are overcrowded (%) 18 9 8
Birth rate per 1,000 people 11.6 15.5 13.1
Teenage birth rate per 1,000 females ages 15 to 19 years 20.3 3.6 19.9
Mothers who received inadequate prenatal care (%) 21 5 8
Adults who are overweight/obese (%) 77 37 --
Students who are overweight/obese (%) 49 21 31
Adults who are current smokers (%) 26 6 --
Students who used electronic cigarette in the past 30 days (%) 14 4 6
Adults who binge drank in the past 30 days (%) 16 13 --
Students who binge drank in the past 30 days (%) 9 2 5
Tuberculosis case rate per 100,000 people -- 20.4 8.3
Age-adjusted cancer incidence rate per 100,000 people (all-sites) -- 345.4 426.6
Age-adjusted cancer death rate per 100,000 people (all-sites)
Age-adjusted breast cancer incidence rate per 100,000 females -- 102.2 125.3
Adults who are ever diagnosed with high blood pressure (%) 44 31 --
Adults who are ever diagnosed with high blood cholesterol (%) 29 29 --
Adults who are ever diagnosed with diabetes (%) -- 11 --
Students who felt sad or hopeless for 2 weeks or more in the past 12 months (%)
43 29 --
Adults who felt they always or usually received social and emotional support (%)
55 52 --
Adults who have health insurance (%) 79 94 --
Adults who needed to see a doctor in the past 12 months but could not because of cost (%)
35 12 --
Adults who did not take medication as prescribed in the past 12 months because of cost (%)
-- 9 --
Adults who have dental insurance (%) 74 83 --
Age-adjusted death rate per 100,000 people (all-causes) 949.2 504.9 593.8
Life expectancy at birth (years) 78.7 86.9 83.2
Age-adjusted death rate per 100,000 seniors due to falls -- 29.7 40.7
Notes: Students refer to middle and high school students; seniors refer to adults ages 65 years and older; poverty data are only for Asians. For data sources, limitations and more information, please review the Asian and Pacific Islander Health Assessment report.
