asian development bank institute · adbi working paper series . performance differential between...
TRANSCRIPT
ADBI Working Paper Series
PERFORMANCE DIFFERENTIAL BETWEEN PRIVATE AND STATE-OWNED ENTERPRISES: AN ANALYSIS OF PROFITABILITY AND LEVERAGE
Nguyet Thi Minh Phi, Farhad Taghizadeh-Hesary, Chuc Anh Tu, Naoyuki Yoshino, and Chul Ju Kim
No. 950 May 2019
Asian Development Bank Institute

The Working Paper series is a continuation of the formerly named Discussion Paper series; the numbering of the papers continued without interruption or change. ADBI’s working papers reflect initial ideas on a topic and are posted online for discussion. Some working papers may develop into other forms of publication.
Suggested citation:
Phi, N. T. M., F. Taghizadeh-Hesary, C. A. Tu, N. Yoshino, and C. J. Kim. 2019. Performance Differential between Private and State-owned Enterprises: An Analysis of Profitability and Leverage. ADBI Working Paper 950. Tokyo: Asian Development Bank Institute. Available: https://www.adb.org/publications/performance-differential-between-private-state-owned-enterprises Please contact the authors for information about this paper.
Email: [email protected]
Nguyet Thi Minh Phi is a Lecturer at the Academy of Finance, Ha Noi, Viet Nam and an associate researcher at Centre for Applied Economics and Business Research, Ha Noi, Viet Nam. Farhad Taghizadeh-Hesary is an Assistant Professor, Faculty of Political Science and Economics, Waseda University, Tokyo. Chuc Anh Tu is an Associate Professor, Academy of Finance, Ha Noi. Naoyuki Yoshino is Dean and CEO, ADBI, Tokyo. Chul Ju Kim is Deputy Dean, ADBI, Tokyo. The views expressed in this paper are the views of the author and do not necessarily reflect the views or policies of ADBI, ADB, its Board of Directors, or the governments they represent. ADBI does not guarantee the accuracy of the data included in this paper and accepts no responsibility for any consequences of their use. Terminology used may not necessarily be consistent with ADB official terms. Working papers are subject to formal revision and correction before they are finalized and considered published.
Asian Development Bank Institute Kasumigaseki Building, 8th Floor 3-2-5 Kasumigaseki, Chiyoda-ku Tokyo 100-6008, Japan Tel: +81-3-3593-5500 Fax: +81-3-3593-5571 URL: www.adbi.org E-mail: [email protected] © 2019 Asian Development Bank Institute

ADBI Working Paper 950 Phi et al.
Abstract The purpose of this paper is to empirically investigate the relationship between ownership identity and the performance of firms in terms of profitability and solvency. Using cross-sectional data covering over 25,000 firms worldwide and by employing various empirical methods, we find robust support for the inferior performance of government enterprises over privately owned firms. Specifically, state-owned enterprises (SOEs) tend to be less profitable than private-owned enterprises. However, they appear to be more dependent on debt for their financial need and are, thus, better leveraged. Additionally, SOEs are more labor intensive and have higher labor costs. Thus, evidence from this study could be interpreted to mean that privatization could improve the performance of public firms. However, a study over a longer period is needed before these results can be considered conclusive. Keywords: performance, ownership, solvency, state-owned enterprises, private-owned enterprises JEL Classification: G32, G341

ADBI Working Paper 950 Phi et al.
Contents 1. INTRODUCTION AND LITERATURE REVIEW .......................................................... 1
2. DATA AND METHODOLOGY ..................................................................................... 4
2.1 Data and Sample Overview ............................................................................. 4 2.2 Methodology .................................................................................................... 7
3. EMPIRICAL RESULTS................................................................................................ 8
3.1 Does Ownership Identity Affect the Profitability of Firms? ............................... 8 3.2 Does Ownership Identity Affect Firm Solvency? ........................................... 11 3.3 Robustness Tests .......................................................................................... 13
4. ADDITIONAL ANALYSIS: OWNERSHIP IDENTITY, LABOR SIZE, LABOR INTENSITY, AND FIRM PERFORMANCE .................................................. 14
5. DISCUSSION AND CONCLUSION ........................................................................... 16
REFERENCES ..................................................................................................................... 17

ADBI Working Paper 950 Phi et al.
1
1. INTRODUCTION AND LITERATURE REVIEW Throughout history, and especially since the end of World War II, state-owned enterprises (SOEs) have been created in much of the world (Megginson and Netter, 2001). Although private companies play a dominant role in market-based societies, enterprises with government ownership are still key players in the global economy, making their performance important for economic growth and competitiveness (Kowalski et al. 2013). Figure 1 shows the importance of SOEs among the top 10 firms in selected economies, especially in Asian economies.
Figure 1: State-owned Enterprises’ Shares among Top 10 Firms in Selected Economies, 2013
(%)
PRC = People’s Republic of China. Source: Kowalski et al. (2013).
However, there has been an overheating debate among academics and policymakers over the effect of government ownership on firms’ performance. State ownership has been regarded as an instrument through which governments can regulate natural monopolies, public goods provision, regional policies, and employment or social issues (Grout and Stevens 2003), as well as reduce market failures (Briggs 1961). Their ultimate goal is not to maximize profit (Pratuckchai and Patanapongse 2012). The contrasting views, nonetheless, are that state ownership is mainly used for the interests of the ruling elite (Goldeng et al. 2008) and that even in the case of market failure, state ownership proves to be inefficient (Megginson and Netter 2001). In addition, the performance of SOEs has shown signs of deterioration in much of the world over the last few decades (Garkhar and Phukon 2017). Thus, scholars and policymakers around the world have been left with a task of reassessing the efficiency of state ownership. To achieve this, one popular method has been to compare the performance of SOEs with that of private-owned enterprises (POEs). If POEs are superior to SOEs in terms of financial performance, it is plausible to expect that massive structural reforms of SOEs and perhaps an ownership switch are essential for enhancing the performance of such enterprises. However, one may

ADBI Working Paper 950 Phi et al.
2
fear that such an ownership shift could eventually result in negative externalities, such as a scarcity of resources, price escalations, and, more importantly, the possibility of transformations from public monopolies to private monopolies, which are of greater danger since they may reduce the social welfare (Gakhar and Phukon 2017). Therefore, ownership reform of SOEs can be seen as a drive for development but not an end in itself; and policymakers are recommended to take a cautious stand on the matter. Although much attention has been paid to this topic (see Djankov and Murrell [2002]), no consensus has been reached, and further research is required. In this paper, we aim to investigate whether certain ownership types consistently show superior economic performance relative to others when controlling for other economic factors. Our study is framed within the vibrant literature on the impacts of public ownership on the performance of firms. Indeed, the belief in public ownership inefficiency is underlined by the agency theory, property rights theory, and public choice theory. Agency theory (Eisenhardt 1989) states that in a corporation, managers (or agents) may follow a personal agenda rather than work on behalf of, and for the interest of, the principals who own the corporation. Within a SOE, in particular, ownership is in the hands of the state with legitimized political, social, and economic goals. Meanwhile, the managers of SOEs are those who are appointed by the government (Sun, Tong, and Tong 2002) and seek firm-specific rents, such as high pay, fringe benefits, and low effort levels. Unlike their peers who operate in private-owned enterprises and may face the risk of replacement and dismissal due to their firms’ low performance (Nguyen and Do 2007), the chief executive officers (CEOs) of SOEs are put under little financial constraint, and their compensation is not necessarily linked to firm performance (Perkin 1994). They, therefore, have few incentives to enhance their corporations’ efficiency. In addition, property rights theory (Hart and Moore 1990) argues that the variation and separation of property rights in the context of public firms are also to be blamed for SOEs’ inefficiency. Shleifer (1998) explains that even if the state and its citizens, who are the ultimate owners of SOEs, agree that profit maximization is the goal of the firm, they are less able to write complete contracts that adequately tie agents’ incentives to that goal due to diffuse ownership, making it difficult to incentivize the public managers to pursue the most efficient outcome. However, such rights in private sectors could be more explicitly defined, and, thus, the incentive for seeking profits stimulates private owners to monitor their managers more effectively (McCormick and Meiners 1988). Public choice theory (Krueger 1990) also provides a cornerstone conceptual framework on which SOEs’ underperformance can be explained. This framework assumes that there presents special interests affecting governments’ own objectives. Under SOE structures, boards and CEOs are appointed through political offices. They have been blamed for intervening in industry regulation (Hill 1999) with an aim to crafting legislation favoring their political interests (Mbo and Adjasi 2017), making their objectives being too far from efficient outcomes. The subject of state ownership has inspired many empirical studies. Recent empirical studies have shown that ownership identity affects firms’ performance. However, they remain skeptical of which ownership type consistently shows superior economic performance relative to the others. For some (i.e., Kole and Mulherin [1997]; Omran [2004]; Gupta [2005]; Poczter [2016]), government ownership is better than private ownership and SOE reforms fail to have any impacts on firms’ performance. Kole and Mulherin (1997), when examining the postwar performance of 17 German and Japanese ownership firms, found no significant difference between government-owned and private-owned enterprises.

ADBI Working Paper 950 Phi et al.
3
According to them, in a competitive environment, even SOEs are forced to operate efficiently, and factors other than ownership have the final say over firm performance. Omran (2004) investigates 54 Egyptian firms over a rather short period from 1994 to 1998 and concludes that privatized firms do not exhibit a significant enhancement in performance relative to SOEs. Despite that, the author also adds that the privatization process could have important spillover effects on SOEs. Scholars in support of state ownership argue that the real problem of the public sector does not lie in efficiency deficiency, questioning the real benefits of the privatization trend occurring in much of the world. On the other hand, another group of researchers (i.e., Boardman and Vining [1989]; Megginson et al. [1994]; DeWenter and Malatesta [2001]; Truong et al. [2006]) claim that government-owned enterprises are less efficient or at least less profitable than their private peers. Boardman and Vining (1989) documents that state-owned and even mixed-owned (state and private) enterprises fall short of privately owned ones in terms of profitability and efficiency. However, this, from the authors’ perspectives, does not necessarily mean that private ownership is always preferable to public ownership. Public ownership may prevail in the markets where there are high entry barriers and externalities. Similarly, Megginson et al. (1994) depict that privatization economically and significantly leads to an increase in output, operating efficiency, profitability, capital investment spending, dividend paying, and a decrease in leverage, implying that private ownership is more advantageous. DeWenter and Malatesta (2001) find that an ownership switch from state to private ownership could raise the profitability of firms, supporting the idea that SOEs are less profitable. Interestingly, another strand of empirical works (i.e., Parker and Hartley [1991]; Castro and Uhlenbruck [1997]; Parker [2004]) takes a rather neutral view on the investigated topic. Parker (2004) argues that the performance of firms is independent of ownership identity and that the fruits of SOEs restructuring could be actualized only if reforms in corporate governance, transparency and accountability, shared responsibility, and ethical business practices are to be achieved. Meanwhile, some other academics are of the view that a reduction in state ownership is not the sole remedy for worse performance in SOEs. They stress the importance of a competitive environment and capital market discipline in the improvement of firms’ efficiency (Castro and Uhlenbruck 1997) since competition could greatly lead to the enhancement of monitoring possibilities and incentives for production efficiency (Vickers and Yarrow 1991). When both POEs and SOEs are exposed to the same competitive pressures, they tend to generate similar yield (Parker and Hartley 1991). To this end, it follows from the above discussion that whether state-owned firms are outperformed by private ones is an open empirical question. Unfortunately, to the best of our knowledge, to date, prior studies investigating this topic are either out of date or were conducted in a single country and group of countries (mainly the PRC) or for specific sectors such as oil, gas, energy, or transportation. Furthermore, these studies are unable to provide a consensus on the empirical evidence. Thus, more attempts are required to cast further light on this issue. In this paper, we aim to fill in this gap and report further empirical evidence on the relative efficiency of public and private companies. Our study is built on previous studies by Boardman and Vining (1989) and Dewenter and Malatesta (2001) and extends them in a number of ways. For instance, we rely on accounting numbers and conduct cross-sectional comparisons of SOEs and POEs. This research design is similar to that of Boardman and Vining (1989) and Dewenter and Malatesta (2001), but our sample is of much larger size of around 25,000 firms doing business worldwide. In addition, instead of implementing time-series analyses as in Dewenter and Malatesta

ADBI Working Paper 950 Phi et al.
4
(2001), we focus on cross-sectional comparisons and use the propensity score matching method to ascertain our results from univariate tests and OLS regressions. This method is considered to be effective in amending some bias by multivariate regressions. Details of this method are discussed later in this paper. As such, we find significant evidence that SOEs are outperformed by their POEs counterparts. The findings are consistent over both simple univariate comparisons and multivariate regressions. Government firms appear to be less profitable than POEs. They are also more dependent on debt and financial support from outside sources rather than equity. Hence, we provide support for the view that public firms are less efficient than private firms, at least in terms of profitability. The cross-sectional comparisons also show that government firms tend to be more labor intensive and have higher labor costs than non-government ones. Thus, our test results tend to confirm the findings from a number of prior studies (i.e., Megginson et al. [1994]; DeWenter and Malatesta [2001]) In this context, the main contribution of this paper is to revisit this issue with a relatively accountable and sizeable dataset, using various methods to ascertain the findings. In addition, we also attempt to provide more in-depth analyses on how the differences in some characteristics of the labor force may influence firm performance with regard to ownership identity.
2. DATA AND METHODOLOGY 2.1 Data and Sample Overview
Our firm-level data is derived from the ORBIS database. It contains standard financial indicators on balance sheet and income statement items, including: revenue, total assets, gross and net profit, capital, total debt, number of employees, average profit and cost per employee. Besides, it also provides information on additional qualitative variables, such as firm identification (name and address), year of incorporation, ownership identity and other indicators in order to provide sound analyses and data. In this study, we use cross-sectional data capturing the most updated characteristics of approximately 50,000 firms doing business all around the world. We remove from our sample firms with inadequate information and firms with lots of missing. To this end, our final sample is composed of a total 25,247 observations, of which about 12,742 respond to SOEs that are from various non-financial sectors including manufacturing, services, and agriculture.
2.1.1 Measuring Profitability The choice of performance measure is a complex subject. One may use survival, arguing that if a firm survives, it could generate economic value. This measure, however, is not appropriate in our context since SOEs are hardly exposed to the sanctions of disciplining market forces, which in turn lead to market exit. In addition, in this study, we do not intend to analyze performance in terms of productivity. Such a study would require fixed price data at the firm level, which is not available in the present setting. Rather, we follow (Boardman and Vining 1989; Aivazian et al. 2005) and choose to study firm performance in terms of the return on assets (ROA).

ADBI Working Paper 950 Phi et al.
5
The use of profitability, i.e., ROA, as a yardstick for examining the performance of firms is particularly popular in literature on corporate finance since it reflects the economic benefits for the owners (Goldeng et al. 2008). Thus, ROA is believed to be a good proxy to measure firm performance. In this study, ROA is computed as the ratio of profit before tax to the total assets of the firm.
2.1.2 Measuring Solvency Just assessing profitability may mislead policymakers as many SOEs are established to provide social services and public goods and do not necessarily have a profit maximization objective. Therefore another important indicator that we used in this study for the performance of SOEs is solvency. Solvency assesses the ability of a firm to meet its financial obligations. If a company is too heavily dependent on debt, it may suffer a higher risk of insolvency. Nonetheless, a reluctance or inability to borrow might be a sign that operating margins are simply too tight. A good balance of debt and equity, or that a company can generate a higher rate of return than interest rate on its loans, could enhance its profitability. Literature on corporate finance has relied on several measures to assess a firm’s solvency or leverage status (i.e. debt/equity, debt/capital, debt/assets, debt/EBITDA, assets/equity, total liabilities/total assets). In this study, we follow Dewenter and Malatesta (2001) and Omran (2004) and use the solvency ratio as total liabilities to total assets. We also employ another leverage ratio, which is long-term debt to total assets, as an alternative measure for a robustness test.
2.1.3 Classification of SOEs and POEs Ownership identity (i.e., SOEs and POEs) is the variable of main interest in our research. However, there is no consensus or clear-cut definition of firm type in terms of ownership or the exact extent of ownership. For instance, Hu et al. (2004) define SOEs as firms with 100% of shares owned by the state. Whereas, according to EU (2016), SOEs are those firms with the state exercising the ultimate control. One principal challenge facing SOEs, which may deter them from gaining efficiency and, thus, profitability is the insufficiency of operational and management autonomy of boards and executives (EU 2016). Given that fact, it is plausible to make a performance comparison between groups of SOEs with ultimate state control and POEs with private sectors having voting rights. Therefore, for the purpose of this analysis, firms are defined as SOEs when public authorities hold at least 50.01% of the shares. Similarly, firms with at least 50.01% of shares owned by private equity firms, individuals, or families are labeled POEs.
2.1.4 Other Controls Our models also include a number of control variables that have often been used in the firm operational outcome literature, such as firm size (Goldeng et al. 2008), firm age (Goldeng et al. 2008), ownership (SOE and POE) (Megginson et al. 1994), labor size (Dewenter and Malatesta 2001), labor Intensity (i.e. Dewenter and Malatesta, 2001). Firm size is measured through three parameters: the natural logarithm of total assets (SIZE_ASSETS), the natural logarithm of total sales (SIZE_SALES), and the natural logarithm of capital (SIZE_CAPITAL). Firm age (AGE) is the proxy for the number of years from the date of incorporation to 2018. SOE is a dummy variable that takes the value of 1 if it is government-owned, and 0 otherwise. Similarly, POE is a dummy variable taking the value of 1 if it is private-owned, and 0 otherwise. LABOR is measured by taking the natural logarithm of the total number of employees. We use two different measures of labor intensity: employees divided by total sales

ADBI Working Paper 950 Phi et al.
6
(LABOR/SALES) and employees divided by total assets (LABOR/ASSETS). Finally, the leverage (LEVERAGE) of firms is measured via the total short-term debts to equity. Descriptive statistics for our main variables are reported in Table 1. A correlation matrix is provided in Table 2.
Table 1: Descriptive Statistics
Variables Mean Std. Dev. Min Max ROA 6.117 11.610 –98.501 99.989 LABOR 5.669 1.866 0 14.648 SIZE_ASSET 11.630 1.849 1.942 22.111 SIZE_SALES 11.623 1.646 –2.079 20.031 LABOR/SALES 0.035 1.492 –0.824 150.678 LABOR/ASSET 0.014 0.459 0 65.310 LEVERAGE 0.078 0.135 –0.001 2.698 SOLVENCY 39.031 24.479 0 100 AGE 37.238 35.036 0 118 SIZE_CAPITAL 7.656 3.330 –7.170 17.944 COST_EMPLOYEE 19.666 18.489 0 98.671
Note: This table provides summary statistics of the main variables used in this research. Source: Authors’ compilation.
Table 2: Pairwise Correlation of Main Independent Variables
1 2 3 4 5 1 EBIT 1 2 LABOR 0.067* 1 3 SIZE_SALES –0.044* 0.553* 1 4 AGE 0.079* 0.212* 0.090* 1 5 LABOR/SALE –0.015 0.003 –0.116* 0.000 1 6 LABOR/ASSET –0.044* 0.025* –0.154* –0.008 0.014 7 LEVERAGE –0.104* –0.021 0.144* –0.012 –0.011 8 SOLVENCY 0.317* 0.051* –0.100* 0.065* 0.007 9 COST_EMPLOYEE –0.036* 0.336* –0.2971 –0.010 0.030* 10 SIZE_CAPITAL 0.189* 0.281* 0.386* 0.160* –0.005
6 7 8 9 10 1 EBIT 2 LABOR 3 SIZE_SALES 4 AGE 5 LABOR/SALE 6 LABOR/ASSET 1 7 LEVERAGE –0.010 1 8 SOLVENCY –0.004 –0.277* 1 9 COST_EMPLOYEE 0.389* –0.170* 0.096* 1 10 SIZE_CAPITAL –0.032* –0.022* 0.174* 0.003 1 Note: This table reports the pairwise correlations of the main variables for our sample. * denotes the significance level of 1%. Source: Authors’ compilation.

ADBI Working Paper 950 Phi et al.
7
2.2 Methodology
2.2.1 Univariate Tests As argued earlier, it is of interest in this study to investigate the performance differences of the SOE and POE groups. Thus, for this purpose, two separate univariate tests are conducted. Following Megginson et al. (1994) and Omran (2004), we calculate the mean and median values of each variable for each group (SOEs and POEs) in our sample. The methods used compute the absolute differences in mean and median performance for each firm type, SOEs or POEs, as follows:
APD = PERFORMANCESOE – PERFORMANCEPOE
Where APD is the absolute performance difference, and PERFORMANCESOE and PERFORMANCEPOE are the mean or median performance of SOEs and POEs, measured by either ROA or SOLVENCY, respectively. As such, first, we compare the mean values of the two investigated groups using a two sample t-test. Having computed the SOE and POE means, we rely on the Wilcoxon rank sum test as our robust method of testing for a significant difference in the median of variables since the sizes of sub-samples are not matched. Before we test for significant differences in performance, several tests are conducted (their results are not presented here) to determine whether the performance of SOEs and POEs can be adequately modeled by a normal distribution.
2.2.2 OLS Regressions To ascertain our results from previous tests and empirically examine the effect of ownership identity on firm performance in terms of profitability and leverage, we follow Dewenter and Malatesta (2001) and utilize a series of multivariate analyses on cross-sectional data containing 25,274 firms doing business worldwide. For each sub-sample group, the following regressions are run:
𝑃𝑃𝑃𝑃𝑃𝑃𝑃𝑃𝑃𝑃𝑃𝑃𝑃𝑃𝑃𝑃𝑃𝑃𝑃𝑃𝑃𝑃𝑃𝑃𝑃𝑃𝑖𝑖 = α + δ 𝑆𝑆𝑆𝑆𝑆𝑆𝑖𝑖 + β 𝐶𝐶𝑃𝑃𝐶𝐶𝑃𝑃𝑃𝑃𝑃𝑃𝑃𝑃 𝑣𝑣𝑃𝑃𝑃𝑃𝑃𝑃𝑃𝑃𝑃𝑃𝑃𝑃𝑟𝑟𝑟𝑟𝑖𝑖+ ε𝑖𝑖 (1.1)
𝑆𝑆𝑃𝑃𝑃𝑃𝑣𝑣𝑟𝑟𝐶𝐶𝑆𝑆𝑃𝑃𝑖𝑖 = α + δ 𝑆𝑆𝑆𝑆𝑆𝑆𝑖𝑖 + β 𝐶𝐶𝑃𝑃𝐶𝐶𝑃𝑃𝑃𝑃𝑃𝑃𝑃𝑃 𝑣𝑣𝑃𝑃𝑃𝑃𝑃𝑃𝑃𝑃𝑃𝑃𝑃𝑃𝑟𝑟𝑟𝑟𝑖𝑖 + ε𝑖𝑖 (1.2)
Where i indicates the firm, and profitability and solvency are measured by the ROA and the total liabilities to total assets ratio, respectively. The variable of main interest in our study is ownership identity (SOE and POE). SOE is a dummy variable, with 1 denoting SOEs and 0 otherwise. The following control variables are included: firm age, firm size (in terms of total sales), firm size (in terms of capital), the leverage ratio, labor size (or the number of employees), labor intensity (measured by employees divided by total sales and employees divided by total assets), and the average cost of an employee.
2.2.3 Propensity Score Matching A well-known acknowledgement in the literature on empirical corporate finance research is that while multiple regression models are advantageous in navigating endogeneity concerns in observational data, they may also suffer from “functional form misspecification” in case the relationship between dependent and independent variables is misspecified, which might lead to unbiased estimates. The potential bias from functional form misspecification might be alleviated using propensity score matching (PSM) as it could decrease reliance on the specification of the relation

ADBI Working Paper 950 Phi et al.
8
between variables (Rosenbaum and Rubin 1983). Thus, in this study, we use this method to construct an optimal control firm sample. We separate our full sample into two sub-groups comprising SOEs (treatment firms) and POEs (control firms). Matching starts with a probit regression based on the firms in these two groups using various characteristics (i.e., firm size in terms of total sales, leverage ratio, ROA, firm age, and labor size) as control variables. For the robustness of our results, we utilize various matching methods: nearest neighbors (n=1), Mahalanobis, nearest neighbors (n=2), Gaussian kernel, and radius (radius = 0.1). In the later stage, multivariate regressions are run using a matched sample with different matching methods.
3. EMPIRICAL RESULTS As argued previously, it is well-documented theoretically and empirically that there might exist performance dissimilarities among firms of different ownership identities (SOEs versus POEs). In our study, we argue that different firm ownership structures may impose different impacts on firm capacities and, hence, firm performance. Thus, we investigate two important aspects of firms: profitability and leverage. The results of our baseline analyses are presented in Tables 3, 4, 5, and 6.
3.1 Does Ownership Identity Affect the Profitability of Firms?
Table 3 reports the comparisons of the performance for the firms in our sample in terms of profitability and solvency using a two-way T-test and Wilcoxon rank sum test. Both tests generate relatively similar pictures of firm performance. Our findings show the clear tendency that government-owned enterprises are significantly less profitable than their private peers. The differences in profitability appear to be economically important. The average return on assets for private firms is 8.010, almost twice that for SOEs. In terms of sales volume, POEs prove to be superior to their government peers; however, the difference is not substantial.
Table 3: Comparison of Performance and Other Financial Indicators of SOEs and POEs
Variable
Two-way T-test Wilcoxon Rank Sum Test SOE (1)
POE (2)
Difference (1)–(2)
t-Statistics
SOE (1)
POE (2)
Difference (1)–(2)
z-Statistics
ROA 4.260 8.010 –3.750*** –25.999 2.680 5.765 –3.085*** –33.372 SIZE_SALES 10.958 12.297 –1.339*** –62.310 10.616 11.998 –1.382*** –64.906 LEVERAGE 0.048 0.108 –0.060*** –35.325 0.001 0.041 –0.004*** –40.900 SOLVENCY 41.402 36.615 4.787*** 15.612 38.202 34.023 4.179*** 13.234 LIQUIDITY 1.929 1.543 0.386*** 7.308 1.090 0.998 0.092*** 11.538
Note: This table presents the mean and median comparisons of performance and other firm characteristics between SOEs and POEs. The t-test and Wilcoxon rank sum test are deployed to examine the mean and median differences, respectively. *, **, and *** denote significance at the 10%, 5%, and 1% levels. Source: Authors’ compilation.
Furthermore, as a baseline of our research, we employ a series of multivariate regression analyses to investigate the nexus between ownership structure and firm performance. The results of the regressions are presented in Table 4. In model (1) of Table 4 with profitability measure as the dependent variable, the coefficient for SOEs is

ADBI Working Paper 950 Phi et al.
9
negative and significant, indicating that SOEs have lower economic performance than other non-SOE peers. On the contrary, the estimation for POEs is robustly positive, showing that POEs are more profitable than government firms.
Table 4: Effects of Ownership Identity on the Performance of Firms
Dependent Variable
ROA SOLVENCY Model 1 Model 2
SOE –3.620*** (0.205)
4.239*** (0.390)
POE 3.620*** (0.205)
–4.239*** (0.390)
LEVERAGE –14.11*** (0.695)
–14.11*** (0.695)
LABOR/SALES 0.072 (0.058)
0.072 (0.058)
SIZE_SALES 0.379*** (0.108)
0.379*** (0.108)
LABOR –0.308*** (0.108)
–0.308*** (0.108)
LIQUIDITY 0.118*** (0.033)
0.118*** (0.033)
1.154*** (0.139)
1.154*** (0.139)
AGE –0.003 (0.003)
–0.003 (0.003)
0.044*** (0.005)
0.044*** (0.005)
COST_EMPLOYEE –0.056*** (0.007)
–0.056*** (0.007)
0.124*** (0.011)
0.124*** (0.011)
ROA 0.576*** (0.020)
0.576*** (0.020)
SIZE_ASSET 0.381*** (0.136)
0.381*** (0.136)
SIZE_CAPITAL 1.147*** (0.075)
1.147*** (0.075)
Constant 6.942*** (0.934)
3.322*** (0.890)
14.78*** (1.413)
19.02*** (1.360)
Observations 13,273 13,273 15,178 15,178
Note: This table reports the estimation results of the effects of ownership identity on the performance of firms in terms of profitability and leverage. We use a dummy variable distinguishing state-owned firms (SOEs) and private-owned firms (POEs). The dependent variables are profitability measured by ROA and SOLVENCY via the total liabilities to total assets ratio, separately. Our sample consists of 25,274 worldwide firms. Data are retrieved from the ORBIS database. Models (1) and (2) present the outcomes with ROA as the dependent variable while models (3) and (4) show the results for solvency. Robust standard errors are in parentheses. *, **, and *** denote significance at the 10%, 5%, and 1% levels, respectively. Source: Authors’ compilation.
With respect to the propensity score matching test, for which the findings are reported in Table 5, regardless of the matching method, the results of the differences between groups show great consistency with each other and with previous tests. Between the two investigated groups of similar characteristics (i.e., age, labor size, and the labor-to-sales ratio), the differences in the ROA are significantly negative, suggesting a lower profitability level for SOEs. Additionally, the results of the regression models after using different matching methods are in line with those from our baseline models, reinforcing our findings that POEs are superior to SOEs in terms of profitability.

ADBI Working Paper 950 Phi et al.
10
Table 5: The Impact of Ownership Identity on Profitability: Propensity Score Matching Method
Panel A: Matching Estimation: Differences in ROA between Treatment and Control Firms
Matching Method Treatment Firms
(1) Control Firms
(2) Difference
(1)–(2) t-Statistics Near neighbor (n=1) 3.945 13.420 –9.475*** –5.79 Mahalanobis 3.945 10.369 –6.423*** –4.48 Near neighbor (n=2) 3.945 12.068 –8.123*** –5.58 Kernel Gaussian 3.945 10.722 –6.777*** –10.30 Radius (0.1) 3.945 11.224 –7.279*** –7.96
Panel B: Regression Estimation: Based on Matching Samples Dependent Variable: ROA
Near Neighbor
(n=1) (1)
Mahalanobis (2)
Near Neighbor
(n=2) (3)
Kernel Gaussian
(4)
Radius (0.1) (5)
SOE –5.313*** (0.202)
–4.692*** (0.188)
–4.736*** (0.902)
–5.249*** (0.852)
–5.293*** (0.868)
SIZE_SALES –0.024 (0.094)
–1.003*** (0.104)
0.072 (0.372)
0.062 (0.389)
0.049 (0.392)
AGE –0.026*** (0.003)
–0.019*** (0.003)
–0.024** (0.010)
–0.017* (0.010)
–0.018* (0.010)
LEVERAGE –12.66*** (0.949)
–13.75*** (0.959)
–12.11*** (1.974)
–15.09*** (1.801)
–15.25*** (1.853)
LABOR –0.002 (0.106)
0.642*** (0.106)
0.082 (0.255)
0.022 (0.246)
0.028 (0.250)
LIQUIDITY 0.042 (0.032)
0.126*** (0.023)
0.071 (0.054)
0.087** (0.043)
0.084* (0.044)
LABOR_SALES 0.032 (0.057)
–0.061 (0.051)
0.041 (0.068)
0.037 (0.066)
0.035 (0.066)
COST_EMPLOYEE –0.062*** (0.005)
–0.113*** (0.007)
–0.060*** (0.018)
–0.046*** (0.017)
–0.046*** (0.017)
Constant 12.58*** (0.721)
19.93*** (0.888)
10.36** (4.410)
10.69** (4.524)
10.89** (4.577)
Observations 12,836 12,836 9,426 13,273 13,273
Note: This table examines the effect of ownership identity on performance using a propensity score matching methodology. We split our sample into two separate groups (SOEs and POEs), with SOEs being firms with more than 50.01% state ownership and POEs being firms majorly owned by private sectors. Matching starts with a probit regression based on firms in these two groups using various characteristics (i.e., firm size in terms of total sales, the leverage ratio, ROA, firm age, and labor size) as control variables. For the robustness of our results, we utilize various matching methods: nearest neighbors (n=1), Mahalanobis, nearest neighbors (n=2), Gaussian kernel, and radius (radius = 0.1). Panel A presents the matching estimation of the loan spread between treat firms and control firms. Panel B presents the regression estimation. The regression equation is as follows: Profitabilityi = α + δSOEi + βControl variablei + ε𝑖𝑖. *, **, and *** denote significance at the 10%, 5% and 1% levels. Source: Authors’ compilation.

ADBI Working Paper 950 Phi et al.
11
This might be due to the fact that the strong connections of SOEs with the government largely result in their board of directors being manipulated by the bureaucracy to pursue non-profit objectives (Xu and Yano 2017). Since the corporate profits are not the primary goal, managers will concentrate on creating personal benefits over making firms profitable (Shleifer 1998). Another similar explanation could be regulatory framework. For instance, the electricity prices of SOEs are strictly controlled by the government and/or an independent regulatory agency. Another plausible explanation might be that the managers and core figures of SOEs are not recruited based on merit but rather through kinships and clandestine exchange mechanisms (Krueger 1990), which might lead to inefficiency in managerial and operational practices. Thus, our results correspond well with many other studies of private versus public ownership (i.e. Boardman and Vining [1989]; Megginson et al. [1994]; DeWenter and Malatesta [2001]; Truong et al. [2006]).
3.2 Does Ownership Identity Affect Firm Solvency?
When comparing the performance of SOEs and POEs, one may argue that the ROA only tells part of the performance story since SOEs tend to forgo profit maximization tasks (Pratuckchai and Patanapongse 2012) in the pursuit of other social and political goals (Whincop 2005). Rather, it is well-documented empirically (i.e., Dewenter and Malatesta [2001]; Omron [2004]) that SOEs have a higher liabilities-to-assets ratio, meaning that they tend to rely more on debt than shareholder funds. Thus, in this study, we predict that SOEs are of a higher solvency ratio than POEs. Evidence from our tests supports our prediction on SOEs’ solvency status. As can be seen from Table 3, SOEs have higher solvency ratios compared to firms that are privately owned, revealing that they are more dependent on outside sources for their financial needs. However, their liquidity ratio is superior to that of their private counterparts, signaling that they are inclined to hold more liquid assets. While in certain scenarios a high liquidity value may be key, it is not always important for a company to have a high liquidity ratio. The basic function of the liquidity ratio is to measure a company’s capability to settle all current debt with all current available assets. The stability and financial health, or lack thereof, of a company and its efficiency in paying off debt is indicated by liquidity ratios and is of great importance to market analysts, creditors, and potential investors. In addition, estimations of multivariate regression models in Table 4 also show evidence supporting our findings from the two-way t-test. The coefficient on SOE in model (2) is robustly positive depicting a higher level of leverage for SOEs compared to non-SOE firms. The propensity score matching method also provides similar outcomes. From Table 6, it is obvious that the solvency ratios of the treatment group are robustly significantly higher than those of the control group in all matching methods, supporting our outcomes in previous tests. Firms of different ownership identity (but with similar sales volumes, years of operation, profitability, and labor size) show solvency differences. Taking into consideration the results of regression models after matching SOE and POE firms with the same financial characteristics, we also obtain similar findings with the baseline models. The coefficients on SOE in all five models with different matching methods are consistently positive, thus, ascertaining our results from the baseline models.

ADBI Working Paper 950 Phi et al.
12
Table 6: The Impact of Ownership Identity on Solvency: Propensity Score Matching Method
Panel A: Matching Estimation: Differences if Solvency between Treatment and Control Firms
Matching Method Treatment Firms
(1) Control Firms
(2) Difference
(1)–(2) t-Statistics Near neighbor (n=1) 40.963 33.257 7.706*** 5.28 Mahalanobis 40.963 32.629 8.334*** 3.30 Near neighbor (n=2) 40.963 33.160 7.803*** 5.68 Kernel Gaussian 40.963 34.053 6.910*** 7.89 Radius (0.1) 40.963 33.885 7.078*** 7.48
Panel B: Regression Estimation: Based on Matching Samples Dependent variable: SOLVENCY
Near Neighbor
(n=1) (1)
Mahalanobis (2)
Near Neighbor
(n=2) (3)
Kernel Gaussian
(4)
Radius (0.1) (5)
SOE 6.099*** (0.390)
7.334*** (0.363)
5.988*** (0.665)
6.471*** (0.465)
6.474*** (0.466)
LIQUIDITY 0.302*** (0.048)
1.261*** (0.134)
0.420** (0.180)
0.473*** (0.117)
0.473*** (0.115)
AGE 0.050*** (0.006)
0.031*** (0.005)
0.045*** (0.010)
0.048*** (0.007)
0.048*** (0.007)
COST_EMPLOYEE 0.030*** (0.008)
0.046*** (0.010)
0.032* (0.018)
0.053*** (0.013)
0.053*** (0.013)
ROA 0.468*** (0.021)
0.466*** (0.022)
0.457*** (0.053)
0.496*** (0.032)
0.493*** (0.032)
SIZE_ASSET –0.762*** (0.173)
–0.448*** (0.144)
–0.775* (0.430)
–0.433** (0.214)
–0.439** (0.213)
SIZE_CAPITAL 1.750*** (0.100)
1.822*** (0.096)
1.709*** (0.128)
1.647*** (0.108)
1.647*** (0.109)
Constant 25.24*** (1.747)
18.35*** (1.367)
25.77*** (5.196)
21.06*** (2.345)
21.13*** (2.325)
Observations 13,730 13,730 11,910 15,178 15,178
Note: This table examines the effect of ownership identity on performance using a propensity score matching methodology. We split our sample into two separate groups (SOEs and POEs), with SOEs being the firms with more than 50.01% state ownership and POEs being firms majorly owned by private sectors. Matching starts with a probit regression based on firms in these two groups using various characteristics (i.e., firm size in terms of total sales, the leverage ratio, ROA, firm age, and labor size) as control variables. For the robustness of our results, we utilize various matching methods: nearest neighbors (n=1), Mahalanobis, nearest neighbors (n=2), Gaussian kernel, and radius (radius = 0.1). Panel A presents the matching estimation of the loan spread between treat firms and control firms. Panel B presents the regression estimation. The regression equation is as follows: Solvencyi = α + δSOEi + βControl variablei +𝜀𝜀𝑖𝑖; *, **, and *** denote significance at the 10%, 5% and 1% levels. Source: Authors’ compilation.
The explanation for this, perhaps, lies in the fact that the state is unlikely to allow a large SOE to go bankrupt and SOEs can enjoy a “soft” budget constraint since they are backed by the government for their funding (Megginson and Netter 2001). They have the advantage of borrowing funds at a lower rate rather than accessing the equity market to raise capital (Omran 2004). Thus, the discipline that capital markets impose on state-held firms and the threat of financial distress for them is less important than their private counterparts. However, it is worth noting that such “soft” budget constraints, to a certain extent, could also be a source of inefficiency in government firms (Frydman et al. 1999) when the board of management there might fail to use their
ADBI Working Paper 950 Phi et al.
13
funds righteously. Thus, our findings on solvency are largely in line with those of Dewenter and Malatesta (2001) and Omran (2004).
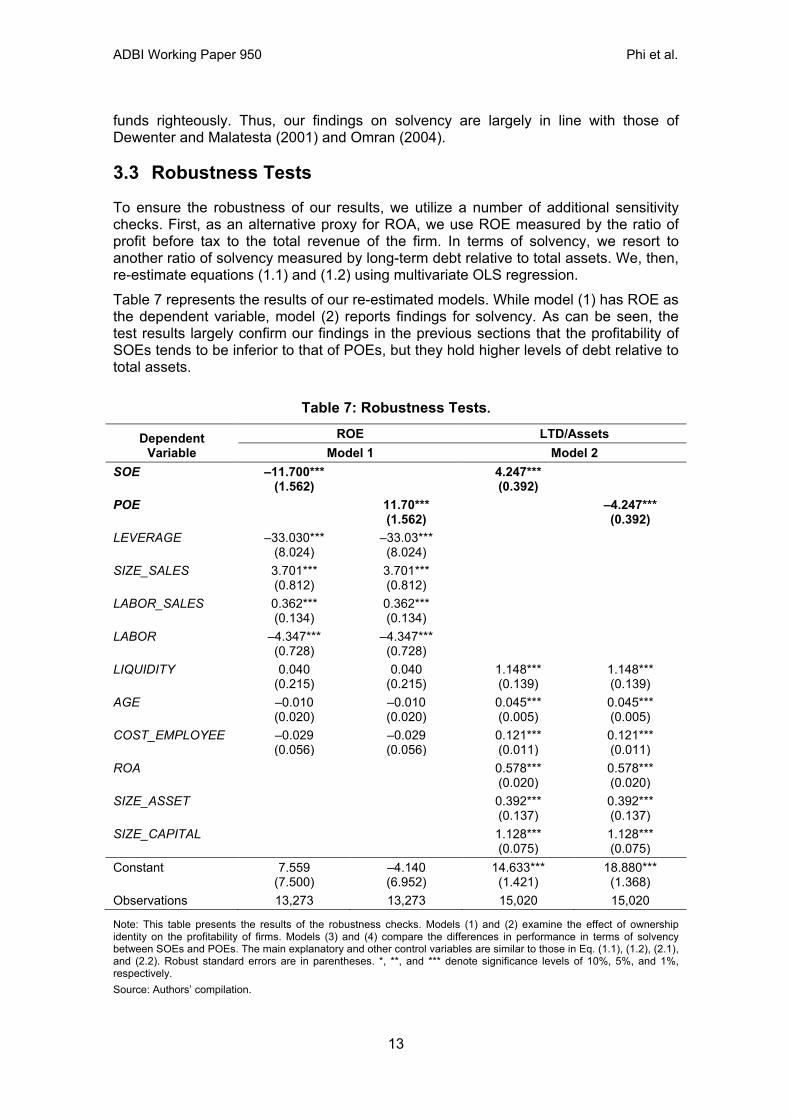
3.3 Robustness Tests
To ensure the robustness of our results, we utilize a number of additional sensitivity checks. First, as an alternative proxy for ROA, we use ROE measured by the ratio of profit before tax to the total revenue of the firm. In terms of solvency, we resort to another ratio of solvency measured by long-term debt relative to total assets. We, then, re-estimate equations (1.1) and (1.2) using multivariate OLS regression. Table 7 represents the results of our re-estimated models. While model (1) has ROE as the dependent variable, model (2) reports findings for solvency. As can be seen, the test results largely confirm our findings in the previous sections that the profitability of SOEs tends to be inferior to that of POEs, but they hold higher levels of debt relative to total assets.
Table 7: Robustness Tests.
Dependent Variable
ROE LTD/Assets Model 1 Model 2
SOE –11.700*** (1.562)
4.247*** (0.392)
POE 11.70*** (1.562)
–4.247*** (0.392)
LEVERAGE –33.030*** (8.024)
–33.03*** (8.024)
SIZE_SALES 3.701*** (0.812)
3.701*** (0.812)
LABOR_SALES 0.362*** (0.134)
0.362*** (0.134)
LABOR –4.347*** (0.728)
–4.347*** (0.728)
LIQUIDITY 0.040 (0.215)
0.040 (0.215)
1.148*** (0.139)
1.148*** (0.139)
AGE –0.010 (0.020)
–0.010 (0.020)
0.045*** (0.005)
0.045*** (0.005)
COST_EMPLOYEE –0.029 (0.056)
–0.029 (0.056)
0.121*** (0.011)
0.121*** (0.011)
ROA 0.578*** (0.020)
0.578*** (0.020)
SIZE_ASSET 0.392*** (0.137)
0.392*** (0.137)
SIZE_CAPITAL 1.128*** (0.075)
1.128*** (0.075)
Constant 7.559 (7.500)
–4.140 (6.952)
14.633*** (1.421)
18.880*** (1.368)
Observations 13,273 13,273 15,020 15,020
Note: This table presents the results of the robustness checks. Models (1) and (2) examine the effect of ownership identity on the profitability of firms. Models (3) and (4) compare the differences in performance in terms of solvency between SOEs and POEs. The main explanatory and other control variables are similar to those in Eq. (1.1), (1.2), (2.1), and (2.2). Robust standard errors are in parentheses. *, **, and *** denote significance levels of 10%, 5%, and 1%, respectively. Source: Authors’ compilation.

ADBI Working Paper 950 Phi et al.
14
Second, as documented earlier, in addition to running multivariate regression models, we also implement propensity score matching tests as a complement to our OLS regressions. The results of the PSM tests are largely in line with those of the regression models, further reinforcing our findings in this study.
4. ADDITIONAL ANALYSIS: OWNERSHIP IDENTITY, LABOR SIZE, LABOR INTENSITY, AND FIRM PERFORMANCE
In Section 3, we document that there are performance differences between SOEs and non-SOEs with regard to profitability and solvency. There are a number of reasons for this. Besides the discrepancy in ultimate goals, SOEs seem to be less productive than POEs. According to Boycko et al. (1996), politicians cause government-owned firms to employ excess labor inputs. Furthermore, those recruited are chosen to perform the desired tasks based on political connections rather than based on merit (Krueger 1990), which is assumed to lower the productivity of SOEs. Given the fact that human capital has a positive relationship with productivity and, thus, firms’ performance (Mason et al. 2012), it is possible that the heterogeneity in labor force characteristics between public and private firms may impact their performance differential. Thus, in this section, we provide an additional investigation into how distinct aspects of labor, i.e., labor size, labor intensity, and labor cost, can influence the performance differential. For such purpose, besides implementing the two way T-test, Wilcoxon rank sum tests, and propensity score matching, we incorporate into our baseline specifications the interaction terms between SOE and labor size (LABOR), labor intensity (LABOR/SALE), and the average cost of an employee (COST_EMPLOYEE), separately. The results of these tests are presented in Table 7. As can be seen from panels A and B of Table 8, government firms have statistically significantly higher average labor-to-sales and labor-to-assets ratio than private firms do, implying that they are more labor intensive than their counterparts. Although in our sample state-owned companies employ less labor on average, they generate smaller sales volumes and have a higher cost per one employee. In other words, firms owned by private sectors are more labor efficient than government ones. With respect to panel C, when incorporating the interaction terms into the baseline models, the coefficients on SOE are significantly negative, indicating the inferior profitability for SOEs over non-SOEs. As long as the interaction terms between SOEs and labor size, labor intensity, and labor cost are taken into consideration, it appears that labor size and labor cost appears to impose opposing effects on the performance of government firms. The coefficient of SOE*LABOR is significantly positive, implying that SOEs perform worse than non-SOEs but tend to benefit more from an expansion of the labor size. In comparison, the robustly negative coefficient on SOE*COSTEMPLOYEE depicts that an increase in labor wage may lower their profitability at a more rapid pace than POEs since they tend to suffer more from the harmful effect of the labor cost. However, it is worth noting that since the coefficient on the interaction term of SOE and labor intensity is negative but insignificant, there is no robust evidence showing that the effects of labor intensity on firm performance differ between the groups of SOEs and non-SOEs.

ADBI Working Paper 950 Phi et al.
15
Table 8: Ownership Identity, Labor Size, Labor Intensity, Labor Cost, and Firm Performance
Panel A: Univariate Tests
Variable
Two-way T-test Wilcoxon rank sum test SOE (1)
POE (2)
Difference (1)–(2)
t-Statistics
SOE (1)
POE (2)
Difference (1)–(2)
z-Statistics
LABOR 5.434 5.905 –0.471*** –20.129 5.361 5.991 –0.630*** –24.204 LABOR/SALES 0.065 0.005 0.060*** 2.850 0.004 0.002 0.002*** 27.074 LABOR/ASSET 0.012 0.017 –0.005* –0.866 0.0026 0.0035 –0.001*** –5.096 COST_EMPLOYEE 25.766 14.661 11.105*** 39.375 19.244 10.610 8.634*** 36.762
Panel B: Propensity Score Matching – Labor/Sales
Method Treatment
(1) Control
(2) Difference
(1)–(2) t-Statistics Near neighbor (n=1) 0.069 0.022 0.046* 1.94 Mahalanobis 0.069 0.012 0.057** 2.02 Near neighbor (n=2) 0.069 0.018 0.051** 2.18 Kernel Gaussian 0.069 0.022 0.467** 2.06 Radius (0.1) 0.069 0.022 0.467** 2.08
Panel C: OLS Regression Dependent Variable: ROA
Labor size Labor Intensity Labout cost Model 1 Model 2 Model 3
SOE –5.187*** (0.572)
–4.098*** (0.176)
–2.851*** (0.273)
LEVERAGE –9.190*** (0.560)
–9.045*** (0.552)
–9.226*** (0.679)
LABOR/SALES 0.110*** (0.034)
5.520 (12.480)
0.105** (0.043)
SOLVENCY 0.121*** (0.004)
0.121*** (0.004)
0.106*** (0.004)
LIQUIDITY 0.0240 (0.042)
0.0242 (0.042)
0.010 (0.028)
SIZE_SALES 0.886*** (0.062)
0.920*** (0.064)
0.658*** (0.108)
AGE –0.006*** (0.002)
–0.006*** (0.002)
–0.007** (0.003)
LABOR –0.875*** (0.078)
–0.795*** (0.063)
–0.613*** (0.106)
COST_EMPLOYEE –0.015* (0.009)
SOE*LABOR 0.181** (0.087)
SOE*LABOR/SALES –5.405 (12.48)
SOE*COSTEMPLOYEE –0.043*** (0.010)
Constant –1.272* (0.740)
–2.201*** (0.629)
0.644 (0.965)
Observations 18,580 18,580 13,273
Note: This table presents the results of additional analyses. Panels A, B, and C report the findings from univariate tests, the propensity score matching test, and OLS regression, respectively. In panel C, models (1)–(3) examine the effect of ownership identity on the profitability of firms with regard to the differences in labor size, labor intensity, and labor cost, separately. Robust standard errors are in parentheses. *, **, and *** denote significance levels of 10%, 5%, and 1%, respectively. Source: Authors’ compilation.
ADBI Working Paper 950 Phi et al.
16
5. DISCUSSION AND CONCLUSION In this study, we examine whether ownership identity is related to firm performance in terms of profitability and solvency. Our cross-sectional comparisons based on a large sample size reveal several empirical regularities. Using financial performance measures and by employing various empirical methods, we find significant evidence that SOEs are outperformed by their POEs counterparts. The findings are consistent over both simple univariate comparisons and multivariate regressions. Government firms appear to be less profitable than POEs, which is in line with the earlier literature. However, just assessing profitability and only considering this aspect of a firm will mislead policymakers as many SOEs are established to provide public goods and services and not necessarily to have profit maximization behavior. Therefore, in this study, in addition to profitability, we considered solvency as the second indicator of performance. The results show that SOEs are also more dependent on debt and financial support from outside sources rather than equity. Hence, we provide support for the view that public firms are less efficient than private firms, at least in terms of profitability. The cross-sectional comparisons also show that government firms tend to be more labor intensive and have a higher labor cost than non-government ones. Thus, our test results tend to confirm findings from a number of prior studies (i.e. Boardman and Vining [1989]; Vining and Boardman [1992]; Megginson et al. [1994]; DeWenter and Malatesta [2001]; Truong et al. [2006]). To this end, our findings suggest that privatization could be considered as a driver for firm efficiency. Privatization as a policy could motivate private and public firms to cope with future changes in economic systems and encourage SOEs to shift their management towards maximizing profitability and efficiency to survive. However, it is worth noting that privatization cannot be the sole answer to the performance improvement of SOEs. Rather, it should come with policy changes to put SOEs in a more competitive economic environment. Therefore, governments should pay more attention to several prior-privatization approaches toward building and developing regulatory capabilities to create a market where both private and public firms can function efficiently. Indeed, a study over a longer period is needed before these results can be considered conclusive. Finally it is important to mention that although privatization is a possible policy measure, SOE reforms without privatization are also possible depending on the specific situation. Therefore, future research on improving SOE performance (including the empirical effects of privatization) is needed.
ADBI Working Paper 950 Phi et al.
17
REFERENCES Aivazian, V.A., Ge, Y. and Qiu, J. (2005). “Can corporatization improve the
performance of state-owned enterprises even without privatization?” Journal of Corporate Finance. 11(5). 791–808.
Boardman, A.E. and Vining, A.R. (1989), “Ownership and performance in competitive environments: a comparison of the performance of private, mixed, and state-owned enterprises”. The Journal of Law and Economics. 32(1).1–33.
Boycko, M., Shleifer, A. and Vishny, R.W. (1996). “A theory of privatization”. Economic Journal. 106. 309–319.
Briggs, A. (1961). “The Welfare State in Historical Perspective,” European Journal of Sociology. (2)2. 221–258.
Castro, J., and Uhlenbruck, K. (1997). “Characteristics of privatization: evidence from developed, less developed, and former communist countries”. Journal of International Business Studies, 28(1). 123–143.
DeWenter, K.L. and Malatesta, P.H. (2001). “State-owned and privately owned firms: an empirical analysis of profitability, leverage, and labour intensity”. American Economic Review, 91(1). 320–334.
Djankov, S. and Murrell, P. (2002). “Enterprise restructuring in transition: a quantitative survey”, Journal of Economic Literature. 40(3). 739–792.
Eisenhardt, K.M. (1989), “Agency theory: assessment and review”. Academy of Management Review. 14(1). 57–74.
EU (2016). “State-owned enterprises in the EU: Lessons learned and Ways Forward in a Post-Crisis context”. Institutional paper 031. ISSN: 2443–8014.
Frydman, R., Gray, C., Hessel, M., and Rapaczynski, A. (1999). “When Does Privatization Work? The Impact of Private Ownership on Corporate Performance in Tran sition Economies”. Quarterly Journal of Economics. 114(4). 1153–1191.
Goldeng, E., Grunfeld, L.A. and Benito, G.R.G. (2008). “The performance differential between Private and State Owned Enterprises: The Roles of Ownership, Management and Market Structure”. Journal of Management Studies. 45(7). 1244–1273.
Gakhar, D.V. and Phukon, A. (2017). “From welfare to wealth creation: a review of the literature on privatization of state-owned enterprises”. International Journal of Public sector management. 31(2). 265–286.
Grout, P.A. and Stevens, M. (2003). “The assessment: financing and managing public services”. Oxford Review of Economic Policy. 19. 215–234.
Gupta, N. (2005), “Partial privatization and firm performance”, Journal of Finance. 60(2). 987–1015.
Hart, O. D., and Moore, J. (1990). “Property rights and the nature of the firm”. Journal of Political Economy. 98(6). 1119–1158.
Hill, P.J. (1999), “Public choice: a review”. Faith and Economics. 34, Fall. 1–10. Hu, Y., Song, F. and Zhang, J. (2004). ‘Competition, ownership, corporate governance
and enterprise performance: Evidence from China’, Working Paper No. 1111, Hong Kong Institute of Economics and Business Strategy.

ADBI Working Paper 950 Phi et al.
18
Kole, S.R. and Mulherin, J.H. (1997), “The government as a shareholder: a case from the United States”. Journal of Law and Economics. 40(1). 1–22.
Kowalski, P., M. Büge, M. Sztajerowska, and M. Egeland (2013), “State-Owned Enterprises: Trade Effects and Policy Implications”, OECD Trade Policy Papers, No. 147, OECD Publishing, Paris.
Krueger, A.O. (1990).”Government failures in development”. Journal of Economic Perspectives. 4(3). 9–23.
Mason, G., O’Leary, B. and Vecchi, M. (2012). “Certified and Uncertified Skills and Productivity Growth Performance: Cross-Country Evidence at Industry Level.” Labour Economics. 19 (3). 351–360.
Mbo, M. and Adjasi, C. (2017). Performance of SOEs: evidence on Botswana Telecommunications Corporation. International Journal of Social Economics. 44(7). 960–979.
McCormick, R.E., Meiners, R.E., (1988). “University governance: a property rights perspective”. Journal of Law and Economics. 31 (2), 423–442.
Megginson. W. L. and Netter J. M. (2001). “From State to Market: A Survey of Empirical Studies on Privatization Author(s)”. Journal of Economic Literature. 39(2). 321–389.
Megginson, W.L., Nash, R.C. and Randenborgh, M.V. (1994), “The financial and operating performance of newly privatized firms: an international empirical analysis”. Journal of Finance. 49(2). 403–452.
Nguyen, T.B.H. and Do, H.L., (2007). “The equitization process in Vietnam: Making a headstart in a long journey, in best practices in Asian corporate governance”. Tokyo: Asian Productivity Organization.
Omran, M. (2004), “The performance of state-owned enterprises and newly privatized firms: does privatization really matter?”. World Development. 32(6). 1019–1041.
Parker, D. (2004). “The UK’s privatization experiment: the passage of time permits a sober assessment” CESifo Working Paper Series No.1126, CESifo Group, Muichf.
Parker, D., and Hartley, K. (1991). Status change and performance: economic policy and evidence. In A. Ott and K. Hartley (Eds.), Privatization and economic efficiency: A comparative analysis of developed and developing countries (pp. 108–125). Brookfield, VT: Edward Edgar.
Perkin, D., (1994). “Completing China's move to the market”. Journal of Economics Perspectives, 8(2). 23–46.
Poczter, S. (2016), “The long-term effects of bank recapitalization: evidence from Indonesia”, Journal of Financial Intermediation. 25(C).131–153.
Pratuckchai, W. and Patanagongse, W. (2012). “The Study of Management Control Systems In State Owned Enterprises: A Proposed Conceptual Framework”. International Journal of Organizational Innovation, 5(2). 83–115.
Rosenbaum, P.R., Rubin, D.B., (1983). “The central role of the propensity score in observational studies for causal effects”. Biometrika 70, 41–55.
Shleifer, A. (1998). “State versus Private Ownership”. Journal of Economic Perspectives. 12(4). 133–150.

ADBI Working Paper 950 Phi et al.
19
Sun, Q., Tong, W.H.S. and Tong, J. (2002). “How does government ownership affect firm performance? Evidence from China's privatization experience”. Journal of Business Finance and Accounting, 29(1–2). 1–27.
Truong, D.L., G. Lanjouw and R. Lensink, (2006). “The impact of privatization on firm performance in a transition economy: The case of Vietnam”. Economics of Transition, 14(2). 349–389.
Vickers, J., and Yarrow, G. (1991). “Economic perspective on privatization”. Journal of Economic Perspective. 5(2). 111–132.
Whincop, M.J. (2005). “Corporate Governance in Government Corporations”. Ashgate Publishing Limited.
Xu, G and Yano, G. (2017). “How does anti-corruption affect corporate innovation? Evidence from recent anti-corruption efforts in China”. Journal of Comparative Economics. 45(3). 498–519.