asian journal of microbiology, biotechnology
TRANSCRIPT

Asian Journal of Microbiology,
Biotechnology & Environmental Sciences
UGC, NEW DELHI,INDIA APPROVED JOURNAL
Download Sample Paper
ISSN: 0972-3005
Chief Editors Prof.(Dr.) R.K.Trivedy, India,Dr. P.K. Wong, Hong Kong
Executive Editor Dr.Sadhana Sharma, India,
Associate Editors Dr. Namrata Sharma India, Dr. C.Visvanathan, AIT,
Thailand, Dr. Theeshan Bahourn, Univ. of Mauritius,
Mauritius,and Dr. Azni H. Idris University of Putra
Malayasia, Malayasia
Editorial Board
Download Sample Issue
Subscription Rates
Submit Article
Click here for scimagojr.com
SCOPUS - H Index - 13
NAAS Rating - 4.93
Brief About Asian Journal of Microbiology,
Biotechnology & Environmental Sciences
Published Quarterly Since 1999. Asian Journal of Microbiology, Biotechnology &
Environmental Sciences is published in March, June, September and December every
year.

AJMBES is a highly popular journal exclusively devoted to three most important and
interrelated areas of science.
The scope of the journal includes
1. Microbiology of water, air, soil, food, environmental
and industrial microbiology
2.Microbiology in waste water treatment 3.All aspects of bio technology perferably
environmental
and industrial microbiology
4.Enviromental biochemistry
5.Ecology of grassland, forests and wetlands, limnology and oceanography, mangrove
ecology,
ecology of lakes, rivers and soil ecology
6.All reasearch related to biology of water pollution
including toxicology
7.Effect of air pollutants on microbes, plants, animal & man and biomonitoring of air
pollution
8.Ecotechnology including land application of waste water, vermicomposting, utilisation of
crop residues, bioremediation of hazardous wastes, biomass generation,
energy plantation, reclamation of mined lands
9.All research related to biological aspect of fisheries
including utilisation of biological wastes in fish farming
10.Waste water treatment involving organisms and rootzone technology, biological aspects
of composting
11.Waste land development
12.All floristic and faunistic reporting from any ecosystem
13. Agricultural Ecology.
14. Bioinformatics.
Coverage: Research Papers, Reviews, Technical Notes, Book Reviews, Information on
Conferences and Training Pogrammes all over the World, Topical Articles, New
Publications and Products Information.
Asian Journal of Microbiology, Biotechnology & Environmental Sciences is
abstracted/covered in:
Chemical Abstracts, U.S.A.
SCOPUS
EBSCO Publishing, U.S.A.
Cambridge Science Abstracts
Ecology Abstracts
Pollution Abstracts
Eco-Disc CD Rom
Geological Abstracts
International Development Abstracts
Oceanographic Literature Review
Zoological Records
Indian Science Abstracts, Niscair, India
Elsevier’s Compendex
Elsevier’s Current Awareness in Biological Sciences
Elsevier’s Encompass

Elsevier’s Geobase
Asian Journal of Microbiology, Biotechnology & Environmental Sciences journal is
accredited with National Academy of Agricultural sciences, NAAS, India.
Asian Journal of Microbiology, Biotechnology & Environmental Sciences journal is
covered by SCOPUS.
Asian Journal of Microbiology, Biotechnology & Environmental Sciences journal also
features in Uhlrich International Periodical Directory, U.K., Gale Directory, U.K. and
SAARC directory of periodicals.
Asian Journal of Microbiology, Biotechnology & Environmental Sciences is UGC , New
Delhi approved journal (No. 8799)
Asian Journal of Microbiology
Biotechnology & Environmental Sciences
Editorial Advisory Board
Chief Editors
Dr. P.K.Wong : Professor, Deptt. of Biology, Chineese University of Hong Kong, Hong
Kong
and Dr. R.K.Trivedy, Ex. Prof. & Head, Deptt. of Environmental Sciences, University of
Pune, Pune, India
Associate Editors
Dr. Sadhana Sharma, Prof. & Head, Deptt. of Biochemistry, AIIMS, Patna, India,
Dr. Namrata Sharma, AIIMS, New Delhi,
Dr. Theeshan Bahourn, Univ. of Mauritius, Mauritius,
Dr. C.Visvanathan, AIT, Thailand and
Dr. Azni H. Idris University of Putra Malayasia, Malayasia
EDITORIAL ADVISORY BOARD
1. Dr. Hiroshi Tsnuo, Japan
2. Dr. Jiro Koyama, Japan
3. Dr. Clem Adokpayi, Nigeria
4. Dr. C.D. Nwani, Nigeria
5. Dr. D.J. Lee, Taiwan
6. Dr. Zidan Abduldiem Bashir,
Malaysia
7. Dr. S.M. Talebi, Iran
25. Dr. V. Jirku, Czech Republic
26. Dr. Mark L.D. Lopez, Phillipines
27. Dr. G. Suresha, Saudi Arabia
28. Dr. Mohd. Nural Anwar, Bangladesh
29. Dr. Margaret Greenway, Australia
30. Dr. A.R. Ghosh, Burdhwan, India
31. Dr. Anju Singh, Mumbai, India
32. Dr. Rashid Noor, Dhaka, Bangladesh

8. Dr. G. Khittoo, Mauritius
9. Dr. Rao Bhamidimari, New
Zealand
10. Dr. Chee Kong Yap, Malaysia
11. Dr. Y. Anjaniyelu, U.S.A
12. Dr. A.H. Subratty, Mauritius
13. Dr. Sani Mashi, Nigeria
14. Dr. B. Leenanon, Thailand
15. Dr. Kawsar Ahmed, Bangladesh
16. Dr. (Ms.) Liqa Raschid, Sri Lanka
17. Dr. Jonas Contiero, Brazil
18. Dr. Shyam Bhagwant, Mauritius
19. Dr. K.P. Chong, Malaysia
20. Dr. J. Rotimi, Nigeria
21. Dr. Duangrat Inthorn, Thailand
22. Dr. Asgar Ali, Malaysia
23. Dr. S.A. Abbasi, Puduchhery,
India
24. Dr. W. Fuchs, Austria
33. Dr. B.B. Ayade, Nigeria
34. Dr. Reda, Elabayoumi, Egypt
35. Dr. T. Koliopoulos, Greece
36. Dr. A.K. Kumaraguru, Madurai, India
37. Dr. Sesha Shrinivas Vutukuru, Hyderabad,
India
38. Dr. A.K. Dixit, Mumbai, India
39. Prof. (Dr.) D.P. Singh, Lucknow, India
40. Dr. Hassan Moffadel, Sudan
41. Dr. U.S. Bagade, Mumbai, India
42. Dr. Okezie LA. Rouma, U.K.
43. Dr. Wilson S. Tisera, Kupang, Indonesia
44. Mr. Pavan Kumar Pindi, Mahabubnagar
45. Dr. Mohd. Adnan University of Hai’l, Saudi
Arabia
46. Dr. M.H. Sayadi, Iran
47. Prof. Christian Paul P. Dela Cruz, Phillipines
48. Dr. Rislika Putri Istanli, Indonesia

http://www.envirobiotechjournals.com/index.php
EM International
Home International
Journals
Books
Environmental
Consulting
About
Us
Contact
Asian Journal of Microbiology, Biotechnology &
Environmental Sciences Journal Papers
Issue: Vol 18, Issue 4, 2016
EFFECT OF SILICON IN TARO CROP (COLOCASIA ESCULENTA) IN
COMBINATION WITH TWO LEVELS OF ORGANIC MATTER EMILIO BASANTES MORALES, MÓNICA PEÑAFIEL, MARCO BARAHONA, GOOTY
JAFFER MOHIDDIN, ALEXANDRA E. CUAYCAL AMD SANTIAGO BASANTES
AGUAS
DETECTION OF LIPASE AND ELASTASE IN TYPHOID AND UTI PATIENTS
CAUSED BY SALMONELLA TYPHIMURIUM IN THE EASTERN PART OF
BANGLADESH M.J. FOYSAL, F. MOMTAZ, M.H. HAQUE1, M.N. HOSSAIN, M.M. RAHMAN AND
S.H. PRODHAN
ALLOMETRIC EQUATIONS FOR PREDICTING ABOVE AND BELOW-GROUND
BIOMASS OF YOUNG RAIN TREE [ALBIZIA SAMAN (JACQ.) MERR.] TO
HANDLE CLIMATE CHANGE GUN MARDIATMOKO
PHENOL REMOVAL BY MOVING BED BIOFILM REACTOR (MBBR) FROM
SALINE WASTEWATER MEHDI AHMADI, NEMAT JAFARZADEH, ALI BABAEI, NADALI ALAVI, BAHMAN
RAMAVANDI, SAHAND JORFI AND ZEINAB GHAED RAHMAT
BIODEGRADATION OF PESTICIDES MALATHION AND PROFENOFOS THE
LAKE WATERS RAWA PENING BY BACTERIA CONSORTIUM
OCEANOBACILLUS IHEYENIS - EXIQUOBACTERIUM PROFUNDUM AND
OCEANOBACILLUS IHEYENIS - EXIQUOBACTERIUM PROFUNDUM S. ISWORO, PURWANTO, AND A.SABDONO
THE NOSOCOMIAL BACTERIAL INFECTION IN ICU ADMITTED PATIENTS
OF ALI IBN ABI TALIB HOSPITAL (AS), RAFSANJAN, IRAN FROM JUNE 2013
TO JULY 2014 Ziba Shabani
POTENTIAL ANTI-INFECTION ACTIVITY OF ETHANOL EXTRACT STEM
BARK BANYURU (PTEROSPERMUM CELEBICUM, MIQ.) AGAINST SEVERAL
BACTERIA MARZUKI ASNAH1, INDAHYANTI NUR, RANTE HERLINA AND YULIANTY
RISFAH
IDENTIFICATION OF DIFFERENTIALLY EXPRESSED GENES INDUCED BY
POLY ETHYLENE GLYCOL IN MAIZE (ZEA MAYS L.) CALLUS QUALITY
IMPROVEMENT

MANAL M. ABDEL-RAHMAN, ASMAA M. EL-FARAMAWY AND IBRAHIM E.
MOUSA
COMBINATION OF FILTER MEDIA TO REDUCE TOTAL SUSPENDED SOLIDS,
BIOCHEMICAL AND CHEMICAL OXYGEN DEMAND IN WASTEWATER USING
INSTALLATION OF HORIZONTAL ROUGHING FILTER I.B.W. GUNAM, F.E.L. NATALIA, I. W. ARNATA, C. PUTNARUBUN, Y. SETIYO,
A.A.M.D. ANGGRENI AND S. MULYANI
SYNTHESIS OF POLYHYDROXYBUTYRATE BY HERBASPIRILLUM
SEROPEDICAE Z69 LAC+ USING WHEY PERMEATE A.I. CATALÁNA, C. CALLEJAS, G. MARTÍNEZ, H. VARELA AND S. BATISTA
CONFIRMATORY FACTOR ANALYSIS OF THE MALAY POST TRAUMATIC
STRESS DISORDER CHECKLIST (MPCL-C) AMONG NURSES OF KUALA KRAI
HOSPITAL POST “BAH KUNING” Khairil Idham Ismail1, Rosnah Ismail and Rafidah Bahari
CO-INFECTION OF TRICHOMONAS VAGINALIS AND CANDIDA ALBCIANS
AMONG WOMEN OF CHILDBEARING AGE IN EBONYI LGA, EBONYISTATE,
NIGERIA ALO MOSES NNAEMEKA1, UGAH UCHENNA IYIOKU AND OWOLABI JACOB
OLUWABUSUYI1
ASSESSMENT OF THE SEROLOGICAL AND CLINICAL SYMPTOMS OF
BRUCELLOSIS PATIENTS HOSPITALIZED IN ALI IBN ABI TALIB (AS)
HOSPITAL, RAFSANJAN, IRAN IN 2014-2015 Z. SHABANI AND A. RAHNEMA
THE HYPEROSMOTIC STRESS TOLERANCE OF PROLINE OVEREXPRESSION
STRAIN AND ANTIOXIDANT ENZYME MPR1 STRAIN OF SACCHAROMYCES
CEREVISIAE IN HIGH SUGAR CONCENTRATION MEDIA DURING
BIOETHANOL RODUCTION DWI ARYANTI NUR’UTAMIA, LIESBETINI HADITJAROKOB AND KHASWAR
SYAMSUB
THE DEVELOPMENT OF MUTATIONAL WITCHES’ BROOMSINS COTCHPINE
(PINUSSYLVESTRIS) M.S. YAMBUROV, A.S. PROKOPYEV, T.P. ASTAFUROVA AND S.V.
PONKRATYEVA
THE LEAF ANATOMY STRUCTURE OF PHLOX DOUGLASII HOOK. AND
PHLOX SUBULATA L. CULTIVATED IN THE SIBERIAN BOTANICAL GARDEN
(TOMSK, RUSSIA) TATIANA NIKOLAEVNA BELAEVA AND ALINA NIKOLAEVNABUTENKOVA
POLLEN MORPHOLOGY OF SIPHONOSTEGIA CHINENSIS BENTH. (FAMILY
OROBANCHACEAE) OLGA D. CHERNOVA , ELENA M. BURKANOVA, SVETLANA B. ROMANOVA ,
ALEXEY S. PROKOPYEV AND SERGEY V. PANFILOV
ENHANCED PAH BIODEGRADATION BY CONSORTIA DEVELOPED WITH
BIOFILM – BIOSURFACTANT -PRODUCING MICROORGANISMS SWAPNA GUNTUPALLI, LEELA MADHURI CHALASANI, KSHATRI JYOTHI, C.V.
RAO B AND BONDILI J.S.
EFFICIENT AND SECURE WAY OF KEEPING PATIENT HEALTHCARE
RECORDS AND ACCESS CONTROL STRATEGIES FOR DATA STORED IN
CLOUDS: A SURVEY R. TAMILARASI AND S. NIRMALA SUGIRTHA RAJINI

NILAVEMBU, A CONVENTIONAL THERAPY FOR DENGUE FEVER - A
REVIEW P. SUJI PRIYA AND HEPSIBAH FRANCIS
ASSOCIATION RULE MINING ON DNA MICRO ARRAY DATA -A SURVEY K. ANISH THEEBA AND J. ILAMCHEZHIAN
CLINICO-MICROBIOLOGICAL PROFILE OF OPPORTUNISTIC INFECTION IN
HIV-AIDS SOUMENDRA NATH MAITY, R.VIJAYARAGHAVAN, NAGABABU PYADALA,
PRUDHVI CHAND MALLEPADDI , VASUMATHI POLAVARAPU, KUMAR SAI
SAILESH AND RATHNAGIRI POLAVARAPU
CHALLENGES IN ACHIEVING FOOD SECURITY IN INDIA BENEDICTA D SOUZA AND K. RAJA MOHAN RAO
SYMBIOTIC EFFECTIVENESS OF NATIVE RHIZOBIUM ON DIFFERENT
ADVANCED GENOTYPES OF SOYBEAN SOHAN LAL DESHMUKH, S.B. GUPTA, D. DASH, S.K. NAG AND RAVINDRA SONI
DIVERSITY OF CELLULOSE DEGRADING ACTINOMYCETES IN WASTE
LANDFILL ECOSYSTEM SUBATHRA LAVAN, M. SURESH KUMAR, D. KAVITHA and S. ILAKKIYA
HEAVY METAL ANALYSIS IN DIVERSITY OF HONEYS R. DEVENDER AND H. RAMAKRISHNA
ANTIMICROBIAL ACTIVITY OF DIFFERENT EXTRACTS OF VERBESINA
ENCELIOIDES (CAV.) BENTH VINITA SINGH AND R.C. DHAKER
FLAVOPARMELIA CAPERATA, A HOST FOR BEAUVERIA SP. IN SUBALPINE
FOREST OF CHAKRATA DISTRICT, UTTARAKHAND, INDIA, AND NATURAL
SELECTION IN B. BASSIANA ASHUTOSH PATHAK, ROHIT K MISHRA, SHASHI KANT SHUKLA, RAJESH
KUMAR, ANAND PANDEY, MADHU PANDEY AND ANUPAM DIKSHIT
MOLECULAR IDENTIFICATION AND OPTIMIZATION OF PROCESS
PARAMETERS FOR ANTIMICROBIAL COMPOUND PRODUCTION BY
STREPTOMYCES SP. S. SATAPATHY AND S. MOHAPATRA
APPLICATION OF DATA MINING IN HEALTHCARE: A SURVEY E. MERCY BEULAH, S. NIRMALA SUGIRTHA RAJINI AND N. RAJKUMAR
A TQM APPROACH FOR IMPLEMENTATION OF HANDLING AND
MANAGEMENT OF HOSPITAL WASTE A. IRIN SUTHA AND S. JOHN ROBERT
EVALUATION OF ANTIOXIDANTS, TANNINS AND ANTIBACTERIAL
ACTIVITY OF GREEN TEA AND BLACK TEA AGAINST HUMAN PATHOGENIC
BACTERIA C.M. LUBNA GHAZIA1AND A.GHOUSIA NISHA
CLOUD BASED ARCHITECTURE FOR HEALTHCARE SYSTEM S. NIRMALA SUGIRTHA RAJINI AND E. MERCY BEULAH
ISOLATION, CHARACTERIZATION AND IDENTIFICATION OF BACTERIAL
STRAIN PRODUCING AMYLASE GARGI UPADYAY AND PRASANNA DHARANI AIYER
FORMATION OF SKIN AND HAIR COAT OF THE ROMANOV SHEEP IN THE
CONDITIONS OF THE PIEDMONT OF THE NORTH CAUCASUS

OLEG KAZBEKOVICH GOGAEV, KHETAG ESTAEVICH KESSAEV, BORIS
SERGEEVICH KALOEV, MURAT EKHYAEVICH KEBEKOV AND TIMUR
TAZRETOVICH TARCHOKOV
TO THE QUESTION ABOUT MARINE ELECTRIC PROSPECTING METHODS
DEVELOPING FOR OIL AND GAS DEPOSITS SEARCH ON SHELF
ENVIRONMENT A.L. PISKAREV, V.K. PALAMARCHUK, N.V. GLINSKAYA AND E.V. BURDAKOVA
GREY WATER TREATMENT AND ITS APPLICATION IN CULTIVATION OF
PLANTS Surjit Singh, Neha Pradhan, Nupur Ojha, Bodhisattva Roy and Sutapa Bose
RESPONSE SURFACE ANALYSIS OF CADMIUM (II) ADSORPTION FROM
AQUEOUS SOLUTION BY USING MICROALGAE (CHLORELLA VULGARIS) M. MOHAMMADI, H. HASSANZADEH, E. EHSANDOOST AND M. MOHAMMADI
THE IMMOBILIZATION OF THE ASH RESIDUE PRODUCED AS A RESULT OF
PROCESSING RADIOACTIVE ION-EXCHANGE RESINS IN A LEAD MELT S.N. SKOMOROKHOVA, A.N. NIKOLAEV, R.SH. ASKHADULLIN, E.M. TRIFANOVA
AND I.V. SITNIKOV
COIMBATORE’S GARBAGE DUMP YARD – VELLALORE - A PRECISE STUDY
“FROM STENCH TO AROMA” T. SIVAKUMAR, K. SIVAKUMAR, B. SIVARAMAN, C. SIVAN RAJ AND A.
KUPPURAJ
THE SYSTEM OF ENVIRONMENTAL POLICY IMPLEMENTATION IN THE
NUCLEAR INDUSTRY VLADIMIR ALEXANDROVICH GRACHEV AND OLGA VLADIMIROVNA
PLYAMINA

Asian Jr. of Microbiol. Biotech. Env. Sc. Vol. 18, No. (4) : 2016 : 821-830© Global Science PublicationsISSN-0972-3005
ALLOMETRIC EQUATIONS FOR PREDICTING ABOVE AND
BELOW-GROUND BIOMASS OF YOUNG RAIN TREE
[ALBIZIA SAMAN (JACQ.) MERR.] TO HANDLE
CLIMATE CHANGE
GUN MARDIATMOKO
Department of Forestry, Faculty of Agriculture, Pattimura University, Ambon, Indonesia
(Received 30 May, 2016; accepted 18 July, 2016)
Key words : Allometric equation, Rain tree, R/S ratio, BEFs, Climate change
Abstract - Climate change challenge is real and urgent in the world including Southeast Asia. The raintree (Albizia saman Jacq. Merr.) is becoming more important and recognized as having a major role incarbon storage to address climate change. This paper is to describe and discuss a method to estimatethe above and below-ground biomass and to determine root-to-shoot ratio and biomass expansionfactors of young rain tree in Ambon Island, Indonesia. The carbon mass equation model wasconstructed based on a significant relationship between carbon mass of young rain tree and itsdiameter at 3 cm height and tree height. In order to analyze the biomass content, a destructivesampling technique was used. After felling, dimensional measurement was performed for each tree.The results of the study showed that the equation model for estimating above and below-groundbiomass of rain tree was allometric equation: Y = -10,310.50 + 1,820.89X
1 + 10.89X
2 where X
1 = Diameter
and X2 = Height, R Square (adj) was 0.847 and SE was 1,540; root-to-shoot varied from 0.09 to 1.09 with a
mean of 0.548 and biomass expansion factors varied from 1.17 to 3.41 with a mean of 1.896.
Corresponding Author’s email- [email protected]
INTRODUCTION
Albizia saman (Jacq.) Merr, formerly Samanea saman(Jacq.) Merr. or rain tree is a medium-sized or largetree of potentially great size, often reaching 25-30 mtall, occasionally 45 m, with a short stout bole to 2-3 m dbh and a wide, low, spreading crown, oftentwice as wide as the tree is high. It is a stately tree,with heavy, nearly horizontal branches and anumbrella-shaped crown. One notable old A. samantree near Government House in Trinidad wasrecorded to shade approximately a hectare, andreach 50 m in height, a stem 2.6 m in diameter, witha crown diameter of 60 m (Allen and Allen, 1981;Raintree, 1987). According to Merrill (1912) thistree was one of the first roadside exotic trees to bewidely planted in many tropical countries and it isnow so widely cultivated, particularly inSoutheast and south Asia, that it is often mistakenas native to that area. It was planted principally as
a shade or ornamental tree in streets, parks and incoffee plantations. In general, A. saman has largecrown and heavy branches. Its canopy, withcrowns of great diameter is unsurpassed for shadein silvopastoral systems, parks or roadsides andthe pink flowers add to its value as an ornamental.The wood of this tree is strong, durable or verydurable, with a light yellow sapwood and richdark chocolate-brown heartwood. The wood is alsoused for fencing, construction timber, plywood,making crates, boats, and cart wheels made fromsingle cross-sections of the thickest trunks whichare said to be very durable and were a commonsight on two-wheeled oxcarts in parts of CentralAmerica. The tree also contains gum and resin.(Standley and Steyermark, 1946, Jensen, 2001).Invasiveness of this plant i.e: has high reproductivepotential; has propagules that can remain viable formore than one year; highly adaptable to differentenvironments; highly mobile locally; proved

822 GUN MARDIATMOKO
invasive outside its native range, tolerates, orbenefits from, cultivation, browsing pressure,mutilation, fire etc. (CABI, 2015). Moreover, raintree is a multi-purpose tree, adaptable to tropicalconditions, and with great potentiality asalternative feed for ruminants and monogastrics.Its nutritional value is given by its production ofabundant edible biomass, with crude protein levelshigher than 20 %, and the presence of lipidiccompounds, soluble carbohydrates and minerals inits foliage and fruits (Delgado et al., 2014).
Climate change challenge is real and urgent inthe world including Southeast Asia. According toYuen and Kong (2009), Southeast Asia is one of theworld’s fastest growing regions in terms ofpopulation and urban growth. Scientificassessment indicates that the coastlines ofSoutheast Asia are highly vulnerable to the effectsof climate change. In this regard, the research onclimate change needs to be encouraged by theresearchers through colaboration at national andinternational level. The rain tree is becoming moreimportant and recognized as having a major role incarbon storage to address climate change. Based oneveryday experience if we take shelter under raintree feels cooler than other trees such as pine,agathis or flamboyant (flame tree) etc. Thisindirectly indicates that these plants play a majorrole in the carbon sequestration and oxygenproduction. In other words, these plants play a rolein tackling climate change. Therefore, at this timerain tree planting began in earnest in various areassuch in the area of Southeast Asia includingSingapore, Malaysia (Tan and Yeo, 2009; Ng, 2015),Philippine and Indonesia. Two leading banks inIndonesia (Panin Bank and BNI Bank) have beenusing funds of corporate social responsibility (CSR)to warrant planting in some provinces in Indonesia.Reforest Indonesia supported by Panin Bank is anational tree planting program aiming at creating abetter living environment and reducing emission ofglasshouse gas in Indonesia. To support the OBIT(One Billion IndonesianTrees) program launched bythe Indonesian President, Panin Bank invites everycitizen in Indonesia to plant rain tree or Indonesianoriginal trees such as A. saman and Sengon(Paraserianthes falcataria) trees. In this case, PaninBank provides up to 500 million rain tree andSengon seeds to be donated to partners andtraining for green officers who will help people toplant trees (Panin, 2013). Beside that, BNI Bank re-
distributes tree seedlings that were plantedtogether with Budiasi Society at PerennialsBreeding Center BNI-Budiasi, Bogor, West Java, tosupport the Government’s program OBIT. Therewere 5,000 trees planted to shade the newest airportin the province of North Sumatra, namelyKualanamu Airport (Paguyuban Budiasi, 2014).
The role of plants in tackling climate change cannot be separated from the distribution of biomassin an area. In general, measurement of biomassdistribution relates to the application of allometricequations for predicting above and below-groundbiomass, ratio of root-to-shoot and biomassexpansion factors (BEFs). According to IPCC (2006),National and regional above-ground biomass(AGB) estimates are generally calculated based onestimates of standing stem volume from forestinventories and from default biomass expansionfactors (BEFs). The AGB estimates are convertedinto below-ground biomass (BGB) using defaultroot-to-shoot ratio (R/S) values. This method iscommonly used to estimate carbon stocks fornational greenhouse gas (GHG) inventories.Currently, carbon storage capacity of forest isgenerally computed as per BEFs specifically, carbonstorage capacity of forest can be concluded bybiomass muliplying by carbon content per unitarea with regression equation of biomass andstorage capacity, resulting from comprehensiveeffect of semi-environment (temperature andrainfall), tree species, age, and growth, reflectingenvironmental factors, tree ages, tree density, andforest stand. Hence, storage capacity of forest standcan be taken as a factor for BEFs (Xie and Zhao,2014). Based on Mokany et al. (2006), reliable root-to-shoot ratios are needed for a wide range ofvegetation types in order to improve the accuracyof root biomass estimates, including those requiredfor estimating the effects of land management andland use change in National Greenhouse GasInventories. In general, forest biomass estimationcan be done by destructive and non-destructivesampling. According to Soares and Tome (2012),non-destructive biomass estimation does notrequire harvesting trees; it uses biomass equationto estimate biomass at tree-level and samplingweights to estimate biomass at the forest level. Sofar allometric equations to predict biomass ofyoung rain tree are poorly documented. In thisregard research on measurements AGB and BGB of
young rain tree (A. saman) needs to be done.

823Allometric Equations for Predicting Above and Below-Ground Biomass of Young Rain Tree
MATERIALS AND METHODS
The research was based in Nursery Area near theGreenhouse of Faculty of Agriculture, PattimuraUniversity, Ambon City. The research wasconducted in May 2012- August 2014. There were27 pcs of young rain tree at level seedling andsapling with age between 8-22 months old, treediameter at 3cm height between 3.4 – 9.8 cm andtree height between 280 – 690 cm in Nursery Area.The plants were irrigated weekly and fertilizedwith bokashi of 500 g/plant/4 months. Location ofnursery is open area (full sun) and soil type isrenzina. The type of climate in Ambon Municipalitywas type A of Schmidt and Fergusson that is atropical marine climate and climate season,because the location of Ambon Island itself issurrounded by the sea. The rain is 2,962 mm yr-1
and 217 days of rain per year; wet months (> 100mm month-1) occurs year around. Therefore, theclimate in the study site is strongly influenced bythe ocean and coincides with the summer climate,i.e. the West or North season and the East orSoutheast season. Total of 27 trees were cut(destructive sampling). The stem of the sampled cuttrees was devided into bole, branch, twig, leaf androot. A fresh weight of each morphological treecompartment (bole, branch, twig, leaf and root)were separately weight. After the weighing is done,sample of each morphological tree compartmentwas taken and dried in an oven at 800-850 C for 24hours to obtain the constant dry weight in thelaboratory.
Data analysis
From the field and laboratory data for eachmorphological tree component was calculated. Forthe selection of biomass equations, the followingdependent variables were studied: the total rootbiomass, total-stem wood biomass inside bark,total branches biomass, total leafs biomass andtotal trees biomass. From the obtained data,multiple linear regression model was used todevelop tree biomass equations. Y = b
0 + b
1X
1 + b
2X
2
+ ei . The use of this regression model was followed
by analysis of multiple linear regression as follows:check normality assumption by the One-sampleKolmogorov-Smirnov, model fit, collinearitydiagnostics, check homogeneity of variance.Statistical analysis of data and regression analysisfor developing allometric equations were
performed using the SPSS software package(ver.21). It is a comprehensive system for analyzingdata. SPSS Statistics can take data from almost anytype of file and use them to generate tabulatedreports, charts, and plots of distributions andtrends, descriptive statistics and complexstatistical analyses (IBM 2012). Calculation of BEFsand R/S as below: W
aboveground
BEFs = _________ W
bole
Wroot
R/S = ___________ W
aboveground
where BEFs = biomass expansion factors, R/S = root-to-shoot ratio, W
aboveground = total dry weight of bole,
branch, twig and leaf, Wbole
= dry weight of bole,and W
root = dry weight of root. The average,
standard error, confidence interval, coefficient ofvariation and precision of R/S and BEFs werecalculated by formula as below:
Average n
XiX ∑=
Variance: ( )
1
2
2
−−
=∑n
XXiS or
( )
1
2
2
2
−
−=
∑∑
nn
XiXi
S
Standard deviation: ( )
1
2
−−
= ∑n
XXiS or
( ) ( )
1
2
2
−
−=∑
∑
nn
XiXi
S
Standard error of the mean: n
SxS =
Confidence interval: XStXIC .±=
Coefficient of variation: %100.X
SCV =

824 GUN MARDIATMOKO
Ta
ble
1.
Dry
wei
gh
t o
f m
orp
ho
log
ica
l tr
ee c
om
pa
rtm
ent,
R/S
an
d B
EF
s ca
lcu
lati
on
No
.T
ree
dia
-T
ree
D
ry W
eig
ht
(g)
wit
h O
ven
80°
-85°
CW
above
Wroot
Wabove
R/S
BE
Fs
me
ter
hei
gh
tg
rou
nd
(g)
gro
un
d &
(cm
)(c
m)
(g)
roo
t (g
)
Bo
leB
ran
chT
wig
Le
af
13,
430
034
4.82
188.
5625
.90
72.6
163
1.89
625.
501,
257.
390.
991.
832
3,5
290
164.
8128
7.88
20.0
644
.34
517.
0946
0.44
977.
530.
893.
143
3,7
300
456.
6040
1.51
56.1
583
.38
997.
6448
4.98
1,48
2.62
0.49
2.18
43,
928
059
6.22
222.
3337
.75
72.3
192
8.61
896.
821,
825.
430.
971.
565
4,0
330
789.
8328
.07
31.8
475
.96
925.
7043
2.60
1,35
8.30
0.47
1.17
64,
134
047
6.54
369.
6337
.62
55.1
793
8.96
542.
761,
481.
720.
581.
977
4,3
370
649.
8949
8.36
66.5
812
4.32
1,33
9.15
668.
282,
007.
430.
502.
068
4,5
400
786.
9618
9.61
42.4
266
.52
1,08
5.51
611.
491,
697.
000.
561.
389
4,6
430
860.
5529
6.18
106.
1912
5.53
1,38
8.45
671.
242,
059.
690.
481.
6110
4,7
390
929.
4441
8.65
72.3
516
1.07
1,58
1.51
873.
112,
454.
620.
551.
7011
4,8
300
333.
8357
5.58
25.6
336
.19
971.
231,
054.
622,
025.
851.
092.
9112
4,9
330
858.
9025
0.51
33.2
467
.08
1,20
9.73
693.
201,
902.
930.
571.
4113
5,0
440
920.
5941
2.49
68.5
013
3.18
1,53
4.76
523.
222,
057.
980.
341.
6714
5,1
430
1,11
4.69
372.
4285
.87
114.
161,
687.
141,
103.
312,
790.
450.
651.
5115
5,2
430
1,12
4.22
429.
1211
5.84
130.
671,
799.
8589
1.12
2,69
0.97
0.50
1.60
165,
340
01,
513.
8919
57.8
613
6.18
190.
213,
798.
141,
102.
274,
900.
410.
292.
5117
5,4
350
1,94
4.21
347.
6273
.29
120.
762,
485.
881,
058.
833,
544.
710.
431.
2818
5,5
470
1,63
0.62
479.
6151
.98
127.
082,
289.
2994
2.61
3,23
1.90
0.41
1.40
195,
636
01,
341.
9049
4.34
51.5
810
6.19
1,99
4.01
1,41
6.05
3,41
0.06
0.71
1.49
205,
841
01,
171.
7537
9.27
44.6
297
.32
1,69
2.96
983.
542,
676.
500.
581.
4421
5,9
530
2,20
1.06
1,85
0.47
344.
1752
5.16
4,92
0.86
1,43
4.64
6,35
5.50
0.29
2.24
226,
039
01,
100.
2674
4.04
204.
5424
3.04
2,29
1.88
980.
533,
272.
410.
432.
0823
6,1
320
573.
7297
1.32
164.
3224
4.42
1,95
3.78
1,02
4.33
2,97
8.11
0.52
3.41
246,
347
01,
211.
7279
2.31
131.
9520
0.80
2,33
6.78
1,14
4.35
3,48
1.13
0.49
1.93
256,
434
01,
038.
8649
0.01
197.
4213
8.53
1,86
4.82
1,48
1.69
3,34
6.51
0.79
1.80
269,
559
06,
801.
775,
358.
2678
8.20
1,34
6.15
14,2
94.3
81,
968.
9016
,263
.28
0.14
2.10
279,
869
08,
679.
164,
733.
4783
4.24
1,43
9.79
15,6
86.6
61,
436.
1317
,122
.79
0.09
1.81
Co
rrel
ati
on
am
on
g d
iam
eter
, h
eig
ht
an
d a
bo
ve-
gro
un
d b
iom
as
(AG
B)
Ch
eck
no
rma
lity
ass
um
pti
on
, m
ult
ico
llin
eari
ty,
t-te
st a
nd
all
om
etri
c eq
ua
tio
n r
esu
lt T
he
NP
ar
test
s r
esu
lt w
as
pre
sen
ted
in
Ta
ble
2 a
nd
mu
ltic
oll
ean
irit
y t
est
resu
lt w
as
pre
sen
ted
in
Ta
ble
3.

825Allometric Equations for Predicting Above and Below-Ground Biomass of Young Rain Tree
Table 2. The One-Sample Kolmogorov-Smirnov test
Diameter Height Above ground Unstandardizedbiomass residual
N 27 27 27 27Normal parametersa Mean 5.31 394.85 2,709.14 0.00
Standard deviation 1.51 94.67 3,667.21 1.48734474E3Most extreme differences Absolute 0.16 0.13 0.38 0.11
Positive 0.16 0.13 0.38 0.10Negative -0.10 -0.11 -0.27 -0.11
Kolmogorov-Smirnov Z 0.84 0.70 1.95 0.56Asymp. sig. (2-tailed) 0.49 0.73 0.00 0.91
a. Test distribution is normal.
Based on Table 2, Asym.sig 2 tailed value was 0,91 > 0,05. Its means test distribution was normal
Table 3. Unstandardized and standardized coefficients
Model Unstandardized Standardized Collinearity statisticscoefficients coefficients
B Std. error Beta t Sig. Tolerance VIF
1 (Constant) -10,306.99 1,301.88 -7.92 0.00Diameter 1,557.53 348.13 0.64 4.47 0.00 0.33 3.01Height 12.03 5.56 0.31 2.16 0.04 0.33 3.01
a. Dependent variable: Above-ground biomass
Based on Table 3, VIF value was <10 and tolerance value was > 0.1 and its means there was no multicollinearity.The t-tests for each of the individual slopes are non-significant (P> 0.05). In this case, Diameter variable wassignificant with P value was 0.00 (<0.05) and also Height variable was sigificant with P value was 0.04 (<0.05). Besidethat, the result of allometric equation was Y = -10306,993 + 1557,526X
1 + 12,029X
2 where X
1 = Diameter and X
2 =
Height.The Glejser test for heteroscedasticity, F-test and Adjusted R square calculation resultThe result of Glejser test for heteroscedasticity was presented in Table 4.
Table 4. Unstandardized and standardized coefficients
Model Unstandardized Standardizedcoefficients coefficients
B Std. error Beta t Sig.
1 (Constant) 98.34 639.45 0.15 0.88Diameter 256.45 170.99 0.48 1.50 0.15Height -0.59 2.73 -0.07 -0.22 0.83
a. Dependent variable: ABS_RES
Based on Table 4 the two independent variables (Diameter and Height) have significant value > 0.05 and it can beconcluded that there was no heteroscedasticity at regression model.The F-test result was presented in Table 5.
Precision: where: n = number of
sample, t = table of distribution- t
RESULTS
Measurement results of dry weight of morpholo-gical tree compartment, R/S and BEFs calculation
Measurement results of dry weight of
826 GUN MARDIATMOKO
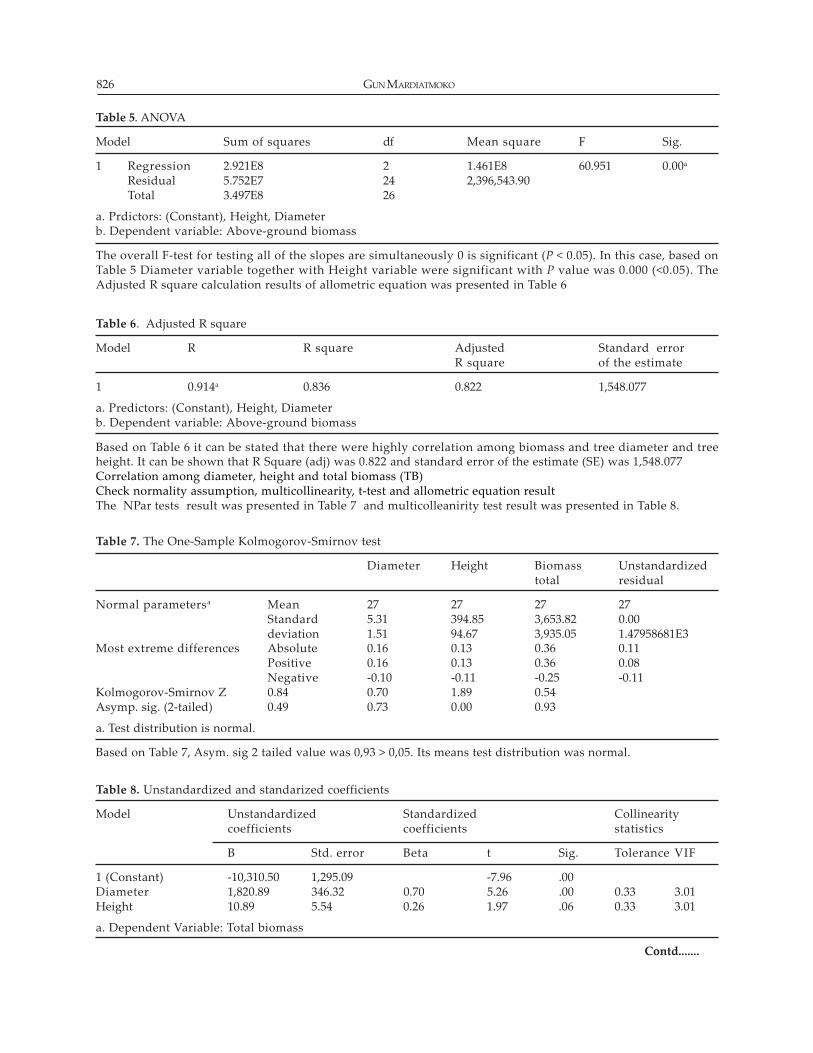
Table 5. ANOVA
Model Sum of squares df Mean square F Sig.
1 Regression 2.921E8 2 1.461E8 60.951 0.00a
Residual 5.752E7 24 2,396,543.90Total 3.497E8 26
a. Prdictors: (Constant), Height, Diameterb. Dependent variable: Above-ground biomass
The overall F-test for testing all of the slopes are simultaneously 0 is significant (P < 0.05). In this case, based onTable 5 Diameter variable together with Height variable were significant with P value was 0.000 (<0.05). TheAdjusted R square calculation results of allometric equation was presented in Table 6
Table 6. Adjusted R square
Model R R square Adjusted Standard errorR square of the estimate
1 0.914a 0.836 0.822 1,548.077
a. Predictors: (Constant), Height, Diameterb. Dependent variable: Above-ground biomass
Based on Table 6 it can be stated that there were highly correlation among biomass and tree diameter and treeheight. It can be shown that R Square (adj) was 0.822 and standard error of the estimate (SE) was 1,548.077Correlation among diameter, height and total biomass (TB)Check normality assumption, multicollinearity, t-test and allometric equation resultThe NPar tests result was presented in Table 7 and multicolleanirity test result was presented in Table 8.
Table 7. The One-Sample Kolmogorov-Smirnov test
Diameter Height Biomass Unstandardizedtotal residual
Normal parametersa Mean 27 27 27 27Standard 5.31 394.85 3,653.82 0.00deviation 1.51 94.67 3,935.05 1.47958681E3
Most extreme differences Absolute 0.16 0.13 0.36 0.11Positive 0.16 0.13 0.36 0.08Negative -0.10 -0.11 -0.25 -0.11
Kolmogorov-Smirnov Z 0.84 0.70 1.89 0.54Asymp. sig. (2-tailed) 0.49 0.73 0.00 0.93
a. Test distribution is normal.
Based on Table 7, Asym. sig 2 tailed value was 0,93 > 0,05. Its means test distribution was normal.
Table 8. Unstandardized and standarized coefficients
Model Unstandardized Standardized Collinearitycoefficients coefficients statistics
B Std. error Beta t Sig. Tolerance VIF
1 (Constant) -10,310.50 1,295.09 -7.96 .00Diameter 1,820.89 346.32 0.70 5.26 .00 0.33 3.01Height 10.89 5.54 0.26 1.97 .06 0.33 3.01
a. Dependent Variable: Total biomass
Contd.......

827Allometric Equations for Predicting Above and Below-Ground Biomass of Young Rain Tree
Based on Table 8, VIF value was <10 and tolerance value was > 0.1 and its means there was no multicollinearity.The t-tests for each of the individual slopes are non-significant (P> 0.05). In this case, Diameter variable wassignificant with P value was 0.00 (<0.05) but Height variable was non sigificant with P value was 0.06 (>0.05). Besidethat, the result of allometric equation was Y = -10,310.50 + 1,820.89X
1 + 10.89X
2 where X
1 = Diameter and X
2 = Height.
The Glejser test for heteroscedasticity, F-test and Adjusted R square calculation resultThe result of Glejser test for heteroscedasticity was presented in Table 9.
Table 9. Unstandardized and standardized coefficients
Model Unstandardized Standardizedcoefficients coefficients
B Std. error Beta t Sig.
1 (Constant) 251.71 649.68 0.39 0.70Diameter 279.65 173.73 0.52 1.61 0.12Height -1.32 2.78 -0.15 -0.48 0.64
a. Dependent Variable: ABS_RES
Based on Table 9 the two independent variables (Diameter and Height) have significant value > 0.05 and it can beconcluded that there was no heteroscedasticity at regression model.The F-test result was presented in Table 10.
Table 10. ANOVA
Model Sum of squares df Mean square F Sig.
1 Regression 3.457E8 2 1.728E8 72.88 .000a
Residual 5.692E7 24 2,371,608.55Total 4.026E8 26
a. Predictors: (Constant), Height, Diameterb. Dependent variable: Total biomass
The overall F-test for testing all of the slopes are simultaneously 0 is significant (P < 0.05). In this case, based onTable 10 Diameter variable together with Height variable were significant with P value was 0.000 (<0.05). TheAdjusted R square calculation results of allometric equation was presented in Table 11.
Table 11. Adjusted R square
Model R R square Adjusted R square Stdandard error of the estimate
1 0.927 0.859 0.847 1,540.003
a. Predictors: (Constant), Height, Diameterb. Dependent variable: Total biomass
Based on Table 11 it can be stated that there were highly correlation among biomass and tree diameter and treeheight. It can be shown that R Square (adj) was 0.847 and standard error of the estimate (SE) was 1,540.003.
morphological tree compartment, R/S and BEFscalculation were presented in Table 1.
DISCUSSION
Based on Table 3, correlation among diameter,height and above-ground biomas (AGB) can beshown by the result of allometric equation Y = -10306,993 + 1557,526X
1 + 12,029X
2 where X
1 =
Diameter and X2 = Height. R Square (adj) was 0.822
and it can be stated that there were highlycorrelation among AGB and tree diameter and treeheight with SE was 1,548.077 (Table 6). Beside that,based on Table 8 correlation among diameter,height and total biomass (TB) can be shown by theresult of allometric equation was Y = -10,310.50 +1,820.89X
1 + 10.89X
2 where X
1 = Diameter and X
2 =
Height. R Square (adj) was 0.847 and it can be

828 GUN MARDIATMOKO
stated that that there were highly correlationamong TB and tree diameter and tree height withSE was 1,540.003 (Table 11).
In general, there was no big differences analysisof multiple linear regression (check normalityassumption by the One-sample Kolmogorov-Smirnov, model fit, collinearity diagnostics, checkhomogeneity of variance) between correlationamong diameter, height and above-ground biomas(AGB) and correlation among diameter, height andtotal biomass (TB). Both of them were normaldistribution, there were no multicollinearity andalso no heteroscedasticity at regression model,based on F-test result stated that diameter variabletogether with height variable were significant withP value was 0.000 (<0.05). This indicate that the twoallometric equations can be used to estimate AGBand TB through diameter and height measurementfor young rain tree. A small difference occurs onlyin value of R square (adj) and SE between two of theallometric equation. According to Widhanarto(2009), the models were chosen among those usedhighest R square (adj), lowest standard error (SE)and the simplicity of models. If we consider thematter, we can choose allometric equation as themost suitable to predict TB than AGB. We apply Rsquare (adj) and not apply R square in this analysisof regression equation. Acording to Andale (2015),both R square and the adjusted R square give us anidea of how many data points fall within the line ofthe regression equation. However, there is one maindifference between R square and the adjusted Rsquare: R square assumes that every single
Fig 1. The Normal P-P Plot Regression Standardized Residual with dependent variable AGB and TBSummary of R/S and BEFs calculation was presented in Table 12
Table 12. Summary of R/S and BEFs of young rain tree
No. Elucidation R/S BEFs
1. Total 14.80 51.192. Average 0.548 1.8963. Standard error of the mean 0.046 0.1074. Confidence interval 0.548 ± 1.896 ±
0.095 0.2215. Coefficient of variation (%) 43.883 29.4816. Precision (%) 8.44 5.67
variable explains the variation in the dependentvariable. The adjusted R square tells us thepercentage of variation explained by only theindependent variables that actually affect thedependent variable. From the standpoint ofstatistical methods, the standard error of theestimate is a measure of the dispersion (orvariability) in the predicted scores in a regression.In a scatterplot in which the SE is small, one wouldtherefore expect to see that most of the observedvalues cluster fairly closely to the regression line.When the SE is large, one would expect to see manyof the observed values far away from theregression line (McHugh, 2008). On the Normal P-PPlot Regression Standardized Residual withdependent variable TB was clear that most of theobserved values cluster fairly closely to theregression line compared with dependent variableAGB (Figure 1).
Roots and shoots are functionally inter-dependent and these two systems maintain adynamic balance in biomass which reflects relativeabundance of above-ground resources (light and

829Allometric Equations for Predicting Above and Below-Ground Biomass of Young Rain Tree
CO2) compared with root-zone resources (water
and nutrients). Whole-plant growth rate and root:shoot ratio are thus an outcome of genotype ×environment interaction, but source of control isambiguous) (Atwell et al., 1999). Based on Table 1and Table 12, R/S for rain tree varied from 0.09 to1.09 with a mean of 0.548. The average R/S for raintree found this study was larger that observed bysome authors such as 0.17 for Pinus in Brazil(Sanquetta et al., 2011), 0.36 for Pinus in GreatBritain (Levy et al., 2004), 0.24 for LebomboIronwood or Androstachys johnsonii in Mozambique(Magalhaes and Seifert, 2015), 0.52 for Norwayspruce seedlings in northeast Italy (Pastorella andPaletto, 2014), varied from 0.157 to 0.190 for Acaciamangium in West Java, Indonesia (Miyakuni et al.,2004), varied from 0.09 to 0.67 with a mean 0.27 forthe coniferous and broadleaf mixed forest innortheast China (Wang et al., 2008). This indicatesthat R/S will vary depending on the type and itshabitat of vegetation growth and the influence ofthe environment such as water (quantity, qualityand timing), nutrient, site index, sunlight,temperature and humidity, pest and diseases, treedensity, etc. The R/S result of our study was largerand it was allegedly due to good maintenance suchas watering, fertilizing and weeding regularly andthere was no competition between tree roots andcanopy from each others rain tree. According toReid (2013), the standard error of the mean is themeasure of how close your data points are to thetrue mean, and represent your precison. In thisregards, based on Table 12 standard error of themean was small (0.046) for R/S calculation and itsmean that our data points closed to the true mean.In other word there was high precision of R/Smeasurement (8.44%). Therefore we can use R/S tomeasure root biomass or shoot biomass. Moreover,the biomass of root systems is difficult andexpensive to measure accurately in forest trees.Root weight of individual trees can be estimatedfrom stem diameter or from the root/ shoot ratio(Beets et al., 2007). Based on these considerations wecan estimate the root biomass of young rain treeindirectly by using the total biomass throughallometric equation based on diameter and height(Y = -10,310.50+1,820.89X1+10.89X2) and R /S (0.548)of young rain tree.
Based on Table 1 and Table 12, BEFs for rain treevaried from 1.17 to 3.41 with a mean of 1.896. Theaverage BEFs for rain tree found this study waslarger that observed by some authors such as 1.47
for Pinus in Brazil (Sanquetta et al., 2011), variedfrom 0.690 to 0.710 for Scot pine, varied from 0.777to 0.862 for Norway spruce, varied from 0.544 to0.556 for broad leaved in boreal forest of Finland(Lehtonen, 2004), varied from 0.02 to 1.31 forLebombo Ironwood or Androstachys johnsonii inMozambique (Magalhaes and Seifert, 2015) andvaried from 1.180 to 1.332 for Acacia mangium inWest Java, Indonesia (Miyakuni et al., 2004). Similarwith R/S young rain tree, this indicates that BEFswill vary depending on the type and its habitat ofvegetation growth and the influence of theenvironment such as water (quantity, quality andtiming), nutrient, site index, sunlight, temperatureand humidity, pest and diseases, tree density, etc.The BEFs result of our study was larger and it wasallegedly due to good maintenance such aswatering, fertilizing and weeding regularly andthere was no competition between tree roots andcanopy from each others rain tree. Based on Table12 standard error of the mean was small (0.107) forBEFs calculation and its mean that our data pointsclosed to the true mean. In other word there washigh precision of BEFs measurement (5.67%).Therefore we can use BEFs to measure AGB or bolebiomass content for young rain tree.
CONCLUSION
There were highly correlation among TB and treediameter and tree height. We can use allometricequation: Y = -10,310.50 + 1,820.89X
1 + 10.89X
2
where X1 = Diameter and X
2 = Height, R Square (adj)
was 0.847 to estimate TB based on diameter andheight of young rain tree. R/Svaried from 0.09 to1.09 with a mean of 0.548, SE was small (0.046) andhas high precision (8.44%). Due to the biomass ofroot systems is difficult and expensive to measureaccurately in forest trees, we can estimate the rootbiomass of young rain tree indirectly by using theallometric equation and R / S (0.548) of young raintree. Beside that, BEFs also varied from 1.17 to 3.41with a mean of 1.896, SE was small (0.107) and hashigh precision (5.67%). Therefore we can use thisBEFs to measure AGB or bole biomass content foryoung rain tree.
ACKNOWLEDGEMENT
The author thanks the Directorate General of HigherEducation, The Ministry of Education and Cultureof Indonesia for funding the study through the 2012research scheme of Hibah Bersaing.

830 GUN MARDIATMOKO
REFERENCES
Allen, O.N. and Allen, E.K. 1981. The Leguminosae. ASource Book of Characteristics, Uses and Nodulation.London, UK: MacMillan Publishers Ltd.
Andale, 2015. Adjusted R2 / Adjusted R-Squared: Whatis it used for? Statistics How To. Statistics for therest of us! http://www.statisticshowto.com/adjusted-r2/ (Accessed 17 May 2016)
Atwell, B.J., Kriedemann, P.E. and Turnbull, C.G.N. 1999.Biomass Distribution. Plants in Action: Adaptation inNature, Performance in Cultivation. MacmillanEducation Australia Pty Ltd, Melbourne, Australia
Beets, P.N., Pearce, S.H., Oliver, G.R. and Clinton, P.W.2007. Root/shoot ratios for deriving below-groundbiomass of Pinus radiata stands. New Zealand Journalof Forestry Science. 37 (2): 267-288.
CABI. 2015. Samanea saman (rain tree). Invasive SpeciesCompendium. http://www.cabi.org/isc/datasheet/4026, (Accessed 16 May 2016)
Delgado, D.C., Hera, R., Cairo, J. and Orta, Y. 2014.Samanea saman, a multi-purpose tree withpotentialities as alternative feed for animals ofproductive interest. Cuban Journal of AgriculturalScience. 48 (3): 205-212
IBM. 2012. IBM SPSS Statistics 21 Brief Guide. http://w w w . s u s s e x . a c . u k / i t s / p d f s / S P S S _Brief_Guide_21.pdf (Accessed 9 August 2013)
IPCC. 2006. Guidelines for national greenhouse gasinventories. Intergovernmental Panel on ClimateChange. http://www.ipcc.ch (Accessed 7 January2013).
Jensen, M. 2001. Trees Commonly Cultivated in SoutheastAsia: An Illustrated Field Guide. FAO Regional Officefor Asia and the Pacific. Second edition.Craftsman Press Co., Ltd., Bangkok.
Lehtonen, A., Makipaa, R., Heikkinen, J., Sievanen, R.and Liski, J. 2004. Biomass expansion factors(BEFs) for Scot pine, Norway spruce and birchaccording to stand age for boreal forests. ForestEcology and Management. 188 : 211-224.
Levy, P.E., Hale, S.E., and Nicoll, B.C.2004. Biomassexpansion factors and root : shoot ratios forconiferous tree species in Great Britain. Forestry.77 (5) : 421-430.
Magalhaes, T.M. and Seifert, T. 2015. Tree componentbrief and root-to-shoot ratio of Lebombo iron-wood: measurement uncertainty. Carbon Balanceand Management. 10 (9) : 1-14.
McHugh, M.L. 2008. Standard error: meaning andinterpretation. Lessons in biostatistics. BiochemiaMedica. 18 (1) : 7-13.
Merrill, E.D. 1912. Notes on the flora of Manila withspecial reference to the introduced element.Philippine Journal of Sciences, Botany. 7 : 145-208.
Miyakuni, K., Heriansyah, I., Heriyanto, N.M. and
Kiyono, Y. 2004. Allometric biomass equation, bio-mass expansion factors and root-to-shoot ratios ofplanted Acacia mangium Willd forest in West Java,Indonesia. Japan Forest Planning. 10 : 69-76.
Mokany, K., Raison, R.J., Prokushkin, A.S. 2006. Criticalanalysis of root: shoot ratios in terrestrial biomes.Global Change Biology. 12 : 84-96.
Ng, F.S.P. 2015. The rain tree-Samanea saman-and itsyellow form. Utar Agriculture Science Journal. 1 (3) :43-49.
Paguyuban Budiasi, 2014. BNI makes Kualanamu Shadyby 5,000 tree seedlings. http://www. paguyuban-budiasi.com/2014/04/1971.html, (Accessed 26 July2014).
Panin, 2013. Reforest Indonesia Program. http://www.panin.co.id/pages/309/csr-program, (Accessed 7June 2014).
Pastorella, F. and Paletto, A. 2014. Biomass allocation innatural regeneration of Fagus sylvatica and Piceaabies trees in Italian Alps. Forestry Studies. 61: 35-46.
Raintree, J.B. 1987. The multipurpose Raintree, Samaneasaman. NFT Highlights, No. 87-06. Waimanalo, USA;Nitrogen Fixing Tree Association.
Reid, A. 2013. How to calculate precision. eHowContributor. http://www.ehow.com/ how_6186008_calculate-precision.html (Accessed 26 May, 2016)
Sanquetta, C.R., Corte, A.P.D. and da Silva, F. 2011.Biomass expansion factor and root-to-shoot ratiofor Pinus in Brazil. Carbon Balance and Management.6 (6): 1-8.
Standley, P.C. and Steyermark, J.A. 1946. Flora ofGuatemala. Fieldiana (Botany). 24 (5).
Soares, P. and Tome, M. 2012. Biomass expansionfactores for Eucalyptus globulus stands in Portugal.Forest System. 21 (1) : 141-152
Tan, H.T.W. and Yeo,C.K. 2009. The potential of nativewoody plants for enchanching the urban water-ways and water bodies environment in Singapore.Raffles Museum of Biodiversity Research andSingapor-Delf Water Alliance, National Universityof Singapore. Singapore.
Wang, X., Fang, J. and Zhu, B. 2008. Forest biomass androot-shoot allocation in northeast China. ForestEcology and Management. 255 (12) : 4007-4020.
Widhanarto, G.O. 2009. Biomass equation for 1-7 years-old Acacia mangium Willd in West Kalimantan,Indonesia (Case Study in Plantation Forest PT.Finnantara Intiga). Pp 203-210. Proceeding Internatio-nal Seminar Reseach on Plantation Forest Management:Challenges & Opportunities. 5-6 Nov. 2009. Bogor.
Xie, S. and Zhao, D. 2014. Carbon storage dynamics offorest vegetation in Karst Mountain. A case studyin Youyang Tujia and Miao Autonomous County.Agricultural Science and Technology. 15 (10): 1733-1737
Yuen, B. and Kong, L. 2009. Climate change and urbanplanning in Southeast Asia. SAPIENS. Cities andClimate Change. 2 (3): 14-22