asian low-carbon society scenarios: tools and practices · asian low-carbon society scenarios:...
TRANSCRIPT

Asian Low-carbon Society Scenarios: Tools and Practices
Kei GOMI 五味五味五味五味 馨馨馨馨Kyoto University, Japan2010, Aug., 18th. Seminar @JGSEE, Bangkokkkk

CONTENTS
�Basic methodology: Backcasting
�AIM* Tools for designing LCS
�Application example�Application example
* Asia-pacific Integrated Modeling: A research group consists of more than 40 researchers from National Institute of Environmental Studies (Japan), Kyoto University (Japan), Energy Research Institute (China), Indian Institute of Management (India), etc. AIM group has been studied various aspects of climate change for more than 20 years. 2
2

BACKCASTING APPROACH
VisionSocio-economic indicators
Energy demandGHG emissionsLC measures
Target year
3
LC measures
RoadmapSchedule of measuresCost to implement measuresGHG emissions reductionsAncillary benefit of measures
Present
Scenario

DESIGNING A FUTURE
� GHG emission is related to most of the activities in the society.
� Required low-carbon measures strongly depends on the situation.
Economic growth rate
Industrial structure
Transport
Demography
� Therefore, consider both; � situation of the society as
a whole� detailed technologies used
in the society.
� Follow-up (e.g. every five years) 4
Transport systemLifestyle
Building stock
Land-use structure
Power supply
End-use energy device

PROCEDURE AND AIM/TOOLS
(1) Target setting
(3) Socio-economic
scenario
development
(4) Developing low-
carbon measures
database
(7) Developing a
system of detailed
measures
(8) Setting
quantitative
information of
(2) Information collection
IOTR
LCBD
5
5
development database
(6) Estimating a quantitative
snapshot as a LCS
information of
measures
(9) Estimating a
roadmap using BCT
(5) Evaluation of
measures’
integrated effect
(implementation)
(10) Follow-up
AHP tool BCT
SED template
ExSSElement models in AIM tools

PROBLEMS AND TOOLS
AHP tool
SEDtemplate
IOTRIO table is not available.
How to assume future society?
Which measure is more
preferable than others?
����
����
����
IO table reconciliation
tool.
Socio-economic
design template.
Analytic hierarchy
process tool.
LCBDWhat kind of measures are
available? ����
Low-carbon measures
database
6
6
AHP tool
BCT
ExSS
preferable than others?
How to calculate a quantitative
vision?
How to calculate a schedule of
measures?
����
����
����
Analytic hierarchy
process tool.
Extended snapshot
tool.
Backcasting tool.
AIM/CGEHow much is social cost of LCS
measures?����
Computable General
Equilibrium MOdel
AIM/
Enduse
What is optimal investment
path and cost? ����
Extended snapshot
tool.

MORE ABOUT LCS TOOLS
AHP tool
SEDtemplate
IOTRIO table reconciliation tool estimates an IO table from available information. Using
cross entropy method it estimates a balanced matrix based on national IO table and
local economic statistics.
Socio-economic design template assumes future image and sets parameters in a Q&A
style. Users anther the questions and assume direction first, and then set the volume
of parameters.
Analytic hierarchy process tool compares measures by multi-criteria and estimates
LCBDLow-carbon measures database contains information of measures available in the target
year. Among them are: energy-efficient technologies, renewable energy, transport
structure management, etc.
7
AHP tool
BCT
ExSS
Analytic hierarchy process tool compares measures by multi-criteria and estimates
integrated index. The criterion includes health, security & safety, transport
convenience, cultural value, land scape,etc.
Extended snapshot tool estimates socio-economic (SE) activity, energy demand,
emissions and introduction of Low-carbon measures in future. SE activity includes
population, industry, transport, and land use.
Backcasting tool estimates a schedule of detailed measures under resource and time
constraints. It also considers integrated index estimated by AHP tool, and maximize
their positive effect.
AIM/Enduse
AIM/CGEComputable General Equilibrium Model estimates economic activity of supply and
demand sectors based on price & market mechanism. It can estimate economic impact
of carbon tax, subsidy, constraints of emissions etc.
Enduse model estimates stock dynamics of energy service devices of energy and supply
demand sectors based on economically reasonable choice. It can assess cost of
particular sector to achieve particular emission targets.

EXTENDED SNAPSHOT TOOL (EXSS)
�A static model (single year) consists of simultaneous equations
�About 6000 endogenous variables
Wage Income
Export by
goods
Government
expenditure
Investment
Import ratio
Input
coefficient
matrix
Labor productivity
Labor participation ratio
Household size
Consumption
pattern
Demographic composition
Taxation and
social security
Floor area per
output
IO
analysis
Output by
industry
Consumption
Labor
demandPopulation
Number of
household
Output of
commercial
industry
PopulationOutput of
manufacturing
industry
8
variables
�Formulated by GAMS (general algebraic modeling system)
� Input and Output are MS Excel spread sheets.
output
Freight generation
per output
Transport distance
Modal share
Trip per person
Trip distance
Modal shareEnergy service
demand per driving
force
Fuel share
Energy
efficiency
CO2 emission factor
Commercial
building
floor area
Freight
transport
demand
Passenger
transport
demand
Energy service
demand
Exogenous
variables
Parameters
Endogenous
variables
Final energy
demand
Energy demand
(DPG)
Central power
generation
(CPG)Energy demand
(CPG)
Primary energy
supply
Dispersed power
generation (DPG)
CO2 emssions
Energy efficiency
DPG
Energy efficiency
(CPG)
Fuel share (CPG)
Transmission loss
(CPG)
Own use (CPG)
Energy end-use
device share
Energy end-use
device energy
efficiency
Carbon sink

SOCIO-ECONOMIC PART OF EXSS
Wage Income
Export by
goods
Government
expenditure
Investment
Import ratio
Input
coefficient
Labor productivityLabor participation ratio
Household size
Consumption
pattern
Demographic composition
Taxation and
social security
IO
analysis
Output by
industry
Consumption
Labor
demandPopulation
Output of Output of
9
coefficient
matrix
Household size
Floor area per
output
Freight generation
per output
Transport distance
Trip per person
Trip distance
Modal share
Energy service
demand per driving
force
Number of
household
Output of
commercial
industry
Commercial
building
floor area
Freight
transport
demand
Passenger
transport
demand
Population
Energy service
demand
Output of
manufacturing
industry

Energy service
demand per driving
force Fuel share
Energy
efficiency
Energy service
demand
Final energy
demand
Energy end-use
device share
Energy end-use
device energy
10Freight generation
per output
Transport distance
Trip per person
Trip distance
Modal share
Commercial
building
floor area
Freight
transport
demand
Passenger
transport
demand
ENERGY PART OF EXSS
10
CO2 emission factorExogenous
variables
Parameters
Endogenous
variables
Energy demand
(DPG)
Central power
generation (CPG)
Energy demand
(CPG)
Primary energy
supply
Dispersed power
generation (DPG)
CO2 emssions
Energy efficiency
DPG
Energy efficiency
(CPG)Fuel share (CPG)
Transmission loss
(CPG)
Own use (CPG)
device energy
efficiency
Carbon sink

EXSS: FURTHER EXTENSION TO AGRICULTURE
(ZERO-ORDER SKETCH OF NEW MODULE)
Agriculture
activity
coefficient
Output of
agriculture
Driving force of
agricultural
Production of agriculture in terms of money. Estimated by IO analysis.
Production of agriculture in physical unit. (sq.km of paddy field, number of
A parameter converting production in monetary to production in physical unit.It depends on structure of agriculture.
11
Share of practice in
each agricultural
activity
agricultural
activity
GHG emission
factor
GHG emissions
from agriculture
paddy field, number of livestock, etc)
GHG emissions by gas and by agricultural activity.
Ex. How many times rice is planted/harvested in a year, difference of water management, kind of feed, etc.
Emission factor of GHG by gas and by practice.

EXSS AND OTHER AIM ELEMENT MODELS
Input coefficient
Capital formation
Export by goods
Gov. expenditure
Import ratio
Labor
productivity
Labor participation ratio
Demographic composition
Taxation and social
security
Transport & land use:- Population distribution
- Share of vehicles**
- Urban/rural development plan**
- Construction of infrastructure**
- Nature conservation area
- Renewal of building stock** Sometimes regarded as LC measures/
Economy:- Economic growth level
- Basic industries in the region
- Fiscal policy
- Private investment including FDI
- Technological development
- Consideration of environment
Household:- Demographic structure
- Sense of value
- Balance of work & life
- Consumption style
- Living style
- Education
- Time use
Energy*:- Technological development
- Availability of energy resource
- Fuel price
- Power supply policy
- Behavior change
- Awareness of people & business*Related to selection of LC measures.
Macro-economy
model
Industrial structureTechnological
evelopment Education
Population/household
dynamics model
Household production
Lifestyle
IO Output by Labor demand Population
12
Floor area per output
Energy service demand per
driving force
Fuel share
Energy efficiency
CO2 emission factor
Carbon sink
Household size
Consumption pattern
security
Freight generation per output
Transport distance
Modal share
Trip per person
Trip distance
Modal share
Energy
balance table
IO
table
Labor/population
balance table
Transport
demand …etc
LC measures
portfolio
Household
account
GHG emissions
inventory
AIM/enduse
House and building
dynamics model
Energy supply
modelTraffic demand
Model
Household production
and lifestyle model
Land use plan
LC measures
LC measures
LC measures
LC measures
Key scenario elements to be assumed
Detailed assumptions without formal model
Element models in AIM tools
Parameters/exogenous variables to be input
Endogenous variables
Output of ExSS
IO
analysis
Wage Income
Output by
industry
Consumption
Labor demand Population
Number of
household
Output of
commercial
industry
Commercial
building floor area
Freight transport
demand
Passenger
transport demand
Population
Energy demand
CO2 emission
Output of
manufacturing
industry
Introduction of counter
measures to be reflected
Power generation
Fuel share
Energy efficiency
Own use
Transmission loss

BACKCASTING TOOL
� Based on constraints and input information of measures, BCT estimates,� Schedule of measures� Emission reduction pass� Annual input resource.� Annual input resource.
� It also considers time needed for R&D, developing financial mechanism, social decision making, etc.
� Integrated effect is also considered.
13

BACKCASTING TOOL
Commercial
year of
technologies
Upper bound of
annual input
resource
Relations
between
measures
Required
resource input
(human &
Schedule
Emission reductions
14
Necessary
years to
implement
Direct GHG
emission
reductions
measures
State in the
starting year
(human &
financial)
Integrated
effect(ancillary and/or
co-benefit)
Input resource

APPLICATION
�Shiga prefecture� A snapshot in 2030 with three
environmental targets
�Kyoto city� A snapshot and a roadmap consists
of more than 130 measures/policies
15

SHIGA & KYOTO
16Osaka
NagoyaKobe Kyoto Shiga

(1) ABOUT SHIGA PREFECTURE 2000
�Population : 1.39 million
�Gross Regional Product: � 5935 bill.\ ( 60bill.$)� 4.25 mill.\/capita (43000$/capita)
CO emissions:
Shiga prefecture
�CO2 emissions: � 12.5Mt-CO2� 9.0t-CO2/capita
� Industrial structure (share of gross output)� primary 1%� secondary 62%� tertiary 37% (in 2000) 17
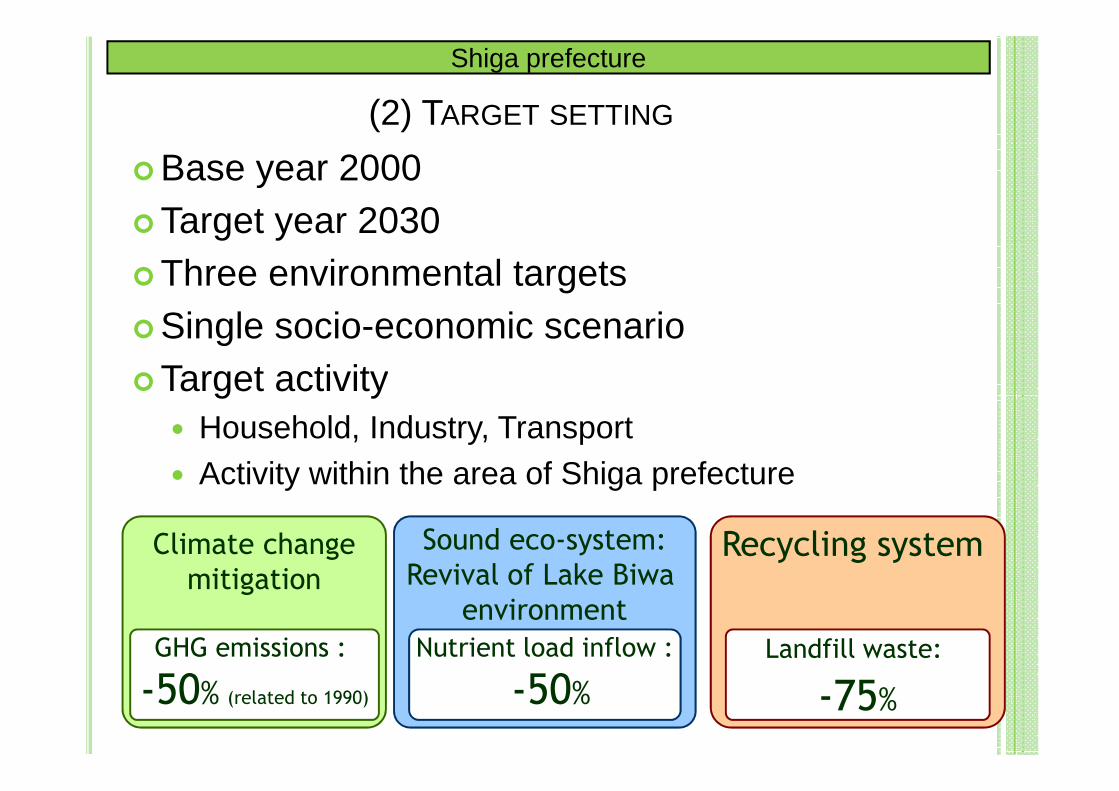
(2) TARGET SETTING
�Base year 2000�Target year 2030�Three environmental targets�Single socio-economic scenario�Target activity
Shiga prefecture
�Target activity� Household, Industry, Transport� Activity within the area of Shiga prefecture
18
Climate change
mitigation
Sound eco-system:
Revival of Lake Biwa
environment
Recycling system
GHG emissions :
-50% (related to 1990)
Nutrient load inflow :
-50%Landfill waste:
-75%

(3) EXSS: FURTHER EXTENSION
Output by
industry
PopulationNumber of
household
Commercial
building floor
area
Freight
transport
demand
Passenger
transport
demand
Agriculture
production
Shiga prefecture
19
Land use
demand
Number of
livestock
Municipal waste
generation
Waste
landfill
CH4 emission
from griculture
Carbon sink
(forest)
Waste
incineration
CO2 emission
from incineration
CH4 emission
from landfill
Water nutrient
load emission
Water quality
GHGs Water Waste
Industrial waste
generation

(4) SOCIO-ECONOMIC SCENARIO
� Dominant social trends in 2030
(1) Return of the population to the current level and progress of aging;
(2) Mature economic growth and dramatic increase in the role of the tertiary industry; and
(3) Increase in the proportion of women and elderly
Shiga prefecture
(3) Increase in the proportion of women and elderly people in employment.
� Powerful cities and industries maintaining intra-prefectural and inter-prefectural connections
� Beautiful rural villages maintaining nature and landscape 20

(5) RESULT: ENERGY AND GHG
GHG emissions by sector
924
897
335
1155
2906
1734
10801149
240101
283
156
165
303
10000
12000
14000
16000
GHG
emiss
ions
(1,0
00 t-
CO2e
q)
ForestabsorptionAgriculture(methane)WasteincinerationIndustrialprocess
12496
12877
14369
Carbon Sink
Agriculture methane( )
Waste incineration
Primary energy demand
405
498109
12085
255000
6000
Primary energy demand (ktoe)
Coal Oil Natural gas Nuclear power Hydropower Renewables
4883 5344
Shiga prefecture
21
600469
960
416
12401686
2114
1430
12631013
67496383
6436
3769
235303
-477
-2000
0
2000
4000
6000
8000
1990 2000 2030BaU 2030with
measures
GHG
emiss
ions
(1,0
00 t-
CO2e
q)
processFreightTransportPassengerTransportIndustry
BusinessoprrationsHousehold
6276
incineration
Industrial process
Freight transport
Passenger transport
Industry
Commercial
Household
319
2643 3043
1160
10501056
886
405
361
231
542650
87
0
1000
2000
3000
4000
2000 2030BaU 2030CM
Primary energy demand (ktoe)
3044

(6) RESULT: CONTRIBUTION OF MEASURES
14369
8000
10000
12000
14000
GHG emissions/reductions (1,000 t-C
O2eq)
Forest absorption 477kt-CO2eq
Structural reform of transport
459kt-CO2eq
Environmentally friendly actions
880kt-CO2eq
Renewable energy 615kt-CO2eqEm
issi
on r
educ
tion
Shiga prefecture
22
12496
6276
0
2000
4000
6000
1990 2030BaU 2030with
measures
GHG emissions/reductions (1,000 t-C
O2eq)
Fuel shifting 966kt-CO2eq
Efficiency improvement 3007kt-
CO2eq
CO2 per power generation
1687kt-CO2eq
Emissions

(7) RESULT: WATER NUTRIENT LOAD
0.1
1.9
12
14
16
18
Load flows into LakeBiw
a(kt/y)
16.2
0.4
0.7
5
6
7
8
6.7
0.020.02
0.3
0.4
0.5ain all on the a e sur ace
Ground ater
anduse
i estoc
Factories
Households
0.38
COD TN TP
Shiga prefecture
23
4.0
0.5
1.6
0.3
0.6
0.7
8.0
4.4
0.1
1.6
0
2
4
6
8
10
2000 20 0
Load flows into LakeBiw
a(kt/y)
7.7
1.8
0.9
0.6
0.2
0.3
0.4
3.0
0.9
0.4
0.6
0
1
2
3
4
5
2000 20 0
3.3
0.16
0.01
0.05
0.02
0.12
0.020.02
0.010.0070.02
0.0
0.1
0.2
0.3
2000 20 0
0.09

(8) RESULT: WASTE LANDFILL
Generation and landfill of
industrial waste
Generation and landfill of
municipal waste
23714000
5000
40004203
5017
Reduced
Kt
60
4.9
0.4
400
500
600509
444
Kt
60
4.9
0.4
400
500
600509
444
KtTreated at home
Reduced
Treated at home
Reduced
Shiga prefecture
24
286 146 71
1664 19102315
156198
259
18941950
0
1000
2000
3000
2000 2004 2030
Valuable
Recycled
Landfill
92
23
28.9
100.8
39
260
345
60
0
100
200
300
400
2000 2030
92
23
28.9
100.8
39
260
345
60
0
100
200
300
400
2000 2030
Recycled
Group separation and collection
Landfill
Recycled
Group separation and collection
Landfill

(9) COUNTER MEASURES
Measure Status to be achieved by 2030What should be done now to achieve the
statusReducti
on
Energy efficiency of equipment
Improvement of efficiency by 30% in total
Improvement rate of approximately 0.8% per annum; Selection of more energy efficient products at the time of replacement
551
HEMS (home energy management system)
Penetration at 90% of houses Start of penetration 60
Heat insulation level in houses
Achievement of the next-generation heat insulation level in 90% of houses
Selection of high heat insulation level at the time of newly building, remodeling,
55
Shiga prefecture
25
houses heat insulation level in 90% of houses the time of newly building, remodeling, and changing houses
Biomass heating Penetration at 10% of households Selection of biomass at the time of replacement of heating appliance
39
Passive solar heating Penetration at 10% of households Installation at the time of newly building and remodeling houses
39
Energy saving actions Penetration at almost all households Start of penetration, and education 156
Photovoltaic power Penetration at 20% of households Continuous expansion 54
Solar water heater Penetration at 20% of households Continuous expansion 99
Others 89
Total in households 1144
ktCO2eq

(10) POLICY RECOMMENDATION
Main efforts and actions required for the respective players to
achieve different environmental targets
Realization of a low carbon economy
Rehabilitation of the environment of Lake Biwa
Establishment of arecycling system
Businesses Introduction of high efficiency production equipmentFuel switching in manufacturing and transportationMore efficient logistics and modal shift
Reduction of water pollutant loads per production value
Recycling of wasteDevelopment of efficient recycling plants
Shiga prefecture
26
modal shift
Citizen Environmentally friendly housesPenetration of fuel-efficient passenger vehiclesEnergy saving actionsUse of railway, bicycles, and walking
Kitchen managementReuse of bathwater and rainwater
Control of municipalwaste generation through the use of rented and leased goodsSeparation and recycling of domestic waste
Local governments, etc.
Maintenance of forestsformation of compact citiesEncouragement of modal shift
Development of sewagesystems and reception of industrial effluentMeasures for drainage in urban Direct purification of river water and dredgingConversion to natural lakeshores
Establishment of a system for the reuse and recycling of municipalwasteEstablishment of efficient recycling routes

(1) ABOUT KYOTO CITY 2005
� Demography� Population 1.47million� Household 0.65 million
� Economy� GDP 6.1 trillion yen (67Bill.$)� Per capita GDP 46100 $� Industrial structure p:s:t = 0.2 : 28 : 71
Kyoto city
27
� Transport� Passenger transport demand 9251 Mp-km� Freight transport demand 3484 Mt-km
� GHG emissions 8015 ktCO2 (5.5tCO2/capita)
� Famous sightseeing place(17 world heritage)

(2) FRAMEWORK
� Base year: 2005� Target year: 2030� Target area: Kyoto City area� Target activity:
� Residential, commercial and industrial activity in Kyoto City area
Kyoto city
� Residential, commercial and industrial activity in Kyoto City area� Transport originated in Kyoto city area
� Target gas:� CO2 from fossil fuel combustion� CO2 from waste (plastic) incineration
� Low-carbon target: -40% compared to 1990 level� Two cases:
� Frozen at current levels case� Corrective measures case 28

(3) SNAPSHOT OF KYOTO CITY IN 2030ocio-economic indicators GHG emissions
2420
1740 1826
1815
6000
7000
8000
9000
10000
em
issions (kt-CO
2)
Residential
Commercial
Industry
Passenger Transport
Freight Transport
Waste incineration
7768
8015
8897 2005 20302030/2005
Population (104) 147 140 0.95
No. of household (104) 65 65 0.99
GDP (bill yen) 6124 8305 1.36
GDP per capita (mill yen/capita)
4.15 5.94 1.43
Kyoto city
29258
474 577 349
504
566 756
421
1506
1689 1655
819
2080 1256
1674
1276
1680 2204
900
821
0
1000
2000
3000
4000
5000
1990 2005 2030 BaU 2030 CM
CO
2em
issions (kt
4586 Gross output (bill yen) 9938 13400 1.35
Primary industry 17 19 1.13
Secondary industry 2735 3542 1.30
Tertiary industry 6947 9507 1.37
Passenger transport (mill p-km) 9251 8192 0.89
Freight transport (mill t-km) 3484 4571 1.31
2030 Frozen
2030 Corrective measures

(4) LOW-CARBON DIRECT MEASURESContribution to CO2 emissions reduction
(compared to Fro en)irect measures
32
500
120
40
974
174
194
Energy- saving behavior
Improvement of energy efficiency
Fuel shift & Natural energy
Energy- saving behavior
Improvement of energy efficiency
Fuel shift & Natural energy
Improvement of energy efficiency
Residential
Commercial
Industry
Sector Low- carbon countermeasure Data SourceCategory
(*)
Emissions reduction
(kt- CO2)
Action
(**)
Air conditioner 50.1 3(***)
Highest energy efficiency air conditioner COP 6.60 2 E Diffusion ratio (cooling and heating) 50%
High energy efficiency air conditioner COP 2.54 1 E Diffusion ratio (cooling and heating) 50%
High energy efficiency kerosene heating COP 0.88 1 E Diffusion ratio (heating: kerosene) 80% 12.9 3
High energy efficiency gas heating COP 0.88 1 E Diffusion ratio (heating: gas) 80% 25.8 3
High energy efficiency oil water heater COP 0.83 1 E Diffusion ratio (hot water: oil) 70% 6.1 3
Gas water heater 55.0 3
Latent heat recovery- type water heater COP 0.83 1 E Diffusion ratio (hot water: gas) 50%
High energy efficiency gas water heater COP 0.83 1 E Diffusion ratio (hot water: gas) 50%
Heat pump water heater COP 4.50 3 E Diffusion ratio (hot water: electricity) 70% 48.9 3
High energy efficiency gas cooker Thermal efficiency (base year= 1) 0.55 1 E Diffusion ratio (cooking: gas) 70% 12.3 3
High energy efficiency IH cooker Thermal efficiency (base year= 1) 0.86 1 E Diffusion ratio (cooking: electricity) 70% 8.0 3
Fluorescent light
LED (substitute fluorescent light) Electricity consumption (conventional type=1) 2.67 1 E Diffusion ratio 50% 24.1 3
Hf inverter fluorescent light Electricity consumption (conventional type=1) 1.33 1 E Diffusion ratio 50%
Incandescent light 51.5 3
LED (substitute incandescent light) Electricity consumption (conventional type=1) 8.70 1 E Diffusion ratio 50%
Bulb- type fluorescent light Electricity consumption (conventional type=1) 4.35 1 E Diffusion ratio 50%
Refrigerator 72.1 3
Super high energy efficiency refrigerator Electricity consumption (conventional type=1) 2.92 1 E Diffusion ratio 50%
Highest energy efficiency refrigerator Electricity consumption (conventional type=1) 2.33 1 E Diffusion ratio 50%
TV 31.9 3
LCD TV Electricity consumption (conventional type=1) 2.27 1 E Diffusion ratio 50%
Highest energy efficiency TV Electricity consumption (conventional type=1) 1.54 1 E Diffusion ratio 50%
House insulation 100.7 2
Next generation level Thermal loss (base year= 1) 0.36 4 E Diffusion ratio 40%
New standard Thermal loss (base year= 1) 0.43 4 E Diffusion ratio 40%
Energy- saving behavior Energy service demand reduction ratio 10% 5 B Diffusion ratio 25% 32.4 3
Photovoltaic generation Potential(ktoe) 295 6 S Diffusion ratio 10% 26.9 5
Solar water heating Potential(ktoe) 1037 6 S Diffusion ratio (hot water: all) 10% 38.8 5
Other energy efficiency improvement E 0.2 3
Other fuel shifting S 27.3 3
Total 625.1
Air conditioner (cooling only) 41.3 4
Super high energy efficiency air conditioner (cooling only) COP 5.00 2 E Diffusion ratio (cooling: electricity) 50%
Highest energy efficiency air conditioner (cooling only) COP 4.07 1 E Diffusion ratio (cooling: electricity) 50%
Cooling (gas) 19.1 4
High energy efficiency gas heat pump COP 1.60 8 E Diffusion ratio (cooling: gas) 40%
High energy efficiency absorption tiller (gas) COP 1.35 7 E Diffusion ratio (cooling: gas) 40%
High energy efficiency absorption tiller(oil) COP 1.35 9 E Diffusion ratio (cooling: oil) 70% 3.2 4
High energy efficiency boiler (oil) COP 0.88 1 E Diffusion ratio (heating: oil) 70% 25.1 4
High energy efficiency boiler (gas) COP 0.88 1 E Diffusion ratio (heating: gas) 70% 75.4 4
Identified implementation intencity
Household sector
Kyoto city
30
194
64
38
237
271
232
177
156
874
120
228
0 400 800 1200
Improvement of energy efficiency
Fuel shift
Eco- driving
Modal shift
Improvement of energy efficiency
Fuel shift & Natural energy
Improvement of energy efficiency
Fuel shift & Natural energy
Reduction of emissions per power generation
Forest absorption
Reduction of waste incineration
Industry
Passenger
Transport
Freight
Transport
Others
CO2 emissions reduction (kt- CO2)
Air conditioner (heating only) 67.0 4
Super high energy efficiency air conditioner (heating only) COP 7.40 2 E Diffusion ratio (heating: electricity) 90%
Highest energy efficiency air conditioner (heating only) COP 4.44 1 E Diffusion ratio (heating: electricity) 10%
High energy efficiency oil water heater COP 0.87 1 E Diffusion ratio (hot water: oil) 70% 16.0 4
Gas water heater 64.2 4
High energy efficiency gas waterheater COP 0.87 1 E Diffusion ratio (hot water: gas) 50%
Latent heat recovery- type water heater COP 0.85 1 E Diffusion ratio (hot water: gas) 50%
CO2 cooling medium water heater COP 3.00 1 E Diffusion ratio (hot water: electricity) 100% 64.2 4
High energy efficiency gas cooker Thermal efficiency (base year= 1) 0.55 1 E Diffusion ratio (cooking: gas) 70% 27.0 4
IH cooking heater Thermal efficiency (base year= 1) 0.86 1 E Diffusion ratio (cooking: electricity) 70% 11.6 4
Incandescent light 131.6 4
Timer controlled LED (substitute fluorescent light) Electricity consumption (conventional type=1) 3.95 1 E Diffusion ratio 50%
Illumination controlled LED (substitute fluorescent light) Electricity consumption (conventional type=1) 3.36 1 E Diffusion ratio 50%
Incandescent light 20.6 4
LED (substitute incandescent light) Electricity consumption (conventional type=1) 4.55 1 E Diffusion ratio 50%
Bulb- type fluorescent light Electricity consumption (conventional type=1) 4.55 1 E Diffusion ratio 50%
High- intensity evacuation light Electricity consumption (conventional type=1) 4.18 1 E Diffusion ratio 70% 0.5 4
Large scale computer (energy- saving type) Electricity consumption (conventional type=1) 1.18 1 E Diffusion ratio 70% 3.1 4
Personal computer (energy- saving type) Electricity consumption (conventional type=1) 2.47 1 E Diffusion ratio 70% 3.3 4
Copier (energy- saving type) Electricity consumption (conventional type=1) 1.45 1 E Diffusion ratio 70% 0.9 4
Fax machine (energy- saving type) Electricity consumption (conventional type=1) 1.45 1 E Diffusion ratio 70% 0.6 4
Printer (energy- saving type) Electricity consumption (conventional type=1) 1.45 1 E Diffusion ratio 70% 1.2 4
Elevator (energy- saving type) Electricity consumption (conventional type=1) 4.01 1 E Diffusion ratio 70% 5.4 4
Ventilation 50.1 4
with energy- saving fan Electricity consumption (conventional type=1) 2.00 1 E Diffusion ratio 50%
with low- pressure duct Electricity consumption (conventional type=1) 1.82 1 E Diffusion ratio 50%
Vending machine (energy- saving type) Electricity consumption (conventional type=1) 2.17 1 E Diffusion ratio 70% 11.5 4
Traffic light (LED type) Electricity consumption (conventional type=1) 3.75 1 E Diffusion ratio 70% 1.4 4
High energy efficiency transformer Electricity consumption (conventional type=1) 2.53 1 E Diffusion ratio 70% 13.3 4
Other electric appliances 61.2 4
30% energy- saving type Electricity consumption (conventional type=1) 1.43 1 E Diffusion ratio 50%
10% energy- saving type Electricity consumption (conventional type=1) 1.11 1 E Diffusion ratio 50%
Building insulation Thermal loss (base year= 1) 0.50 1 E Diffusion ratio 100% 231.1 2
BEMS Energy demand reduction ratio 10% 10 E Diffusion ratio 25% 24.4 4
Energy- saving behavior Energy service demand reduction ratio 10% 5 B Diffusion ratio 25% 40.3 4
Photovoltaic generation Potential(ktoe) 295 6 S Diffusion ratio 10% 26.9 5
Solar water heating Potential(ktoe) 1037 6 S Diffusion ratio (hot water: all) 5% 49.6 5
Other fuel shifting S 70.8 4
Total 1161.8
Energy efficient equipments E 184.7 4
High energy efficiency boiler Thermal efficiency(base year= 1) 1.09 11 Diffusion ratio 80%
High energy efficiency furnace Thermal efficiency(base year= 1) 1.67 12 Diffusion ratio 80%
High energy efficiency morter Electricity consumption(base year= 1) 1.25 11 Diffusion ratio 80%
Inverter control Electricity consumption(base year= 1) 1.05 11 Diffusion ratio 80%
Fuel shifting From oil to gas S Shifting ratio 60% 63.9 4
Increase in the ratio of seasonal vegetable production Ratio of CO2 emissions against non- seasonal vegitable production0.7 17 E Ratio of selling seasonal vegitables 36.2% 0.3 4
Increase in the ratio of wooden buildings Ratio of CO2 emissions against non- wooden buildings 0.6 17 E Diffusion ratio 30% 9.0 4
Total 257.9
Vehicle 270.7 1
Hybrid vehicle Fuel cost (conventional type=1) 0.6 1 E Diffusion ratio 50%
High energy efficiency vehicle Fuel cost (conventional type=1) 0.8 1 E Diffusion ratio 50%
Modal shift From vehicle to; B 236.7 1
Intra area trip walking and bicycle Shifting ratio 15%
train and bas Shifting ratio 30%
Inter area trip bicycle Shifting ratio 10%
train and bas Shifting ratio 30%
Trip to outside of the city train Shifting ratio 30%
Bio fuel From oil to bio fuel S Diffusion ratio 20% 231.7 5
Eco- driving Fuel efficiency improvement ratio 24% 13 B Diffusion ratio 20% 37.8 1
Total 776.9
Vehicle 176.9 1
Hybrid vehicle Fuel cost (conventional type=1) 0.6 1 E Diffusion ratio 50%
High energy efficiency vehicle Fuel cost (conventional type=1) 0.8 1 E Diffusion ratio 50%
Bio fuel From oil to bio fuel S Diffusion ratio 20% 156.2 5
Total 333.1
Bio- methanol power generation 17 production of electricity (ktoe) 18.8 53.8 5
Reducing the amount of waste incineration 17 Rate of CO2 emissions reduction 40% 228.1 3, 4
Improvement of CO2 intensity of power generation CO2 emission per generation (tC/toe) 0.78 873.9 (****)
Fuel shifting 14
Generation efficiency improvement
Coal Generation efficiency 48% 15
Gas Generation efficiency 55% 16
Total 4310.7
waste
incineration &
power supply
Commercial sevtor
Industrial sector
Passenger transport sector
Freight
transport
sector

(5) LOW-CARBON MEASURES
TDM implementation
Designing
pedestrian transit mall
Pavement
widening
Use of pedestrian
transit mall
Construction of
car- parkManagement of
car- park
Promotion of
park and ride
Study on road
pricingConstruction of
road pricing
facility
Implementation of Road pricing
Reducing vehicle
inflow
Introducing IC
cardImprovement of
public transport
timetable
More convenient terminal
Increase of
public transport use
Public bicycle
parking areaOrdinance of
bicycle parking
area on
commercial buildings
Planning
subsidy scheme on bicycle
parking area
Subsidize bicycle parking
area
Increase of bicycle parking
area
Promotion of bicycle parking
area
Increase of bicycle use
Implementation
of KICS- LLC*1
model project
Increase of
KISC- LLC
projectIncrease of
railway use
Planning of
LRT*2 systemConstruction of
LRT system
Operating LRT
Using LRT system
Board of bus
using system promotion
Increase of bus
lane
Promotion of bus lane system
Introducing
public transport priority system
Increase of bus
use
Campaign
sightseeing using public
transport
Planning
intelligent bus transit system
Operating
intelligent bus transit
Increase use of
public transport by visitors
outside of the
city
Improvement of
sightseeing information
display
Public transport
information service by
website
Increase use of public transport
by visitors
outside of the city
Construction of
electric vehicle
recharge stations
Eco- vehicle
promotionPlanning eco-
vehicle subsidy
Eco- vehicle subsidy
Diffusion of
eco- vehicle
Training of eco-
drivingDiffusion of
eco- driving
WalkableCity, Kyoto
Mobility management
TDM promotion
Modal shift (automobile to railway or
bus)
Transit mall Park & RideRoad pricing
Increase of public
transport use
Improvement of
environment for the usage of bicycle
Modal shift (automobile to railway)
Amenity in the usage of
railway
Light Rail Transit
Modal shift (automobile
to bus)
Bus priority
Modal shift of visitors
Sightseeing campaign
using public transport
Public transport information
service
Diffusion of eco- vehicle
Promotion of buying eco- vehicle
Diffusion of eco- driving
Enlightenment for eco-driving
Kyoto style Buildings and Forest Management
Improvement of insulation
level in
Improvement of insulation
level in
Improvement of emission intensity in
Forest absorption
Absorption of CO2 by
Low Carbon Lifestyle
Establishment of a Funding Mechanism
*1 KICS- LLC: Kyoto Information Card System, LLC
*2 LRT: Light Rail Transit*3 KES: KES Environmental Management System Standard
*4 KESC: KES Community
Kyoto city
31
bicycle uselevel in houses
Consulting service for
energy saving houses
CASBEE Kyoto
level in business buildings
intensity in construction
Promotion of Wooden houses
Wooden public
buildings
absorption
Forest management
of CO2 by planting tree
Promotion of planting tree on private space
Planting tree on public space
Planning of consultation
system for
energy- efficient buildings
Operation of
consultation system for
energy- efficient
buildingsDiffusion of
better insulated
houses
Design of CASBEE Kyoto
system
Operation of CASBEE Kyoto
system
Holding training workshops of
CASBEE Kyoto
system Propagation of
better insulated
housesPropagation of
better insulated
offices
Planning Heisei Kyo- Machiya
type housing
Construction of Heisei Kyo-
Machiya
prototypesImplementation
of Heisei Kyo-
Machiya type housing
Diffusion of
Heisei Kyo-Machiya type
housing
Publishing guidance of
wooden house
specificationConverting
public buildings
to wooden ones
Implementation of Integrated
forestry plan
Implementation of forestry
management
activation project
Operating subsidize
system of tree
plantingPlanting tree on
private space
Planting tree on roadside
Lifestyle
Improvement of efficiency in residential equipments
Enlightenment in lifestyle
Environmental education Eco- point
Energy-saving
behavior in houses
Reducing municipal waste
incineration
New recycling
plan
Encouragement of eco-
household
accountingEnergy saving
consulting
service
Promotion of eco- community
association
Diffusion of energy saving
labeling
Diffusion of energy efficient
home appliance
Diffusion of energy saving
behavior
Training of eco-supporters at
Miyako Ecology
CenterEnvironmental
education in
school
Implementation of Children’s
Eco- life
Challenge Project
Diffusion of
energy efficient home appliance
Diffusion of
energy saving behavior
Operating eco-point system
Diffusion of
energy efficient home appliance
Implementation of new national
recycling society
planReducing
municipal waste
Decarbonationof Industry
Improvement of efficiency in business equipments
Large emitter
programs
KES environmental management
system standard
Support for SME
Promotion of R&D
Energy- saving behavior in business
establishment
Corporate environmental philanthropy
Promotion of corporate
environmental philanthropy
Energy saving in public
buildings
Energy saving reform of public
buildings
Improvement of emission intensity in agriculture
Seasonal vegetable promotion
Reducing industrial solid waste incineration
New recycling
plan
Implementation
of large programs
Diffusion of
energy efficient equipments
Diffusion of
energy saving managing
system
KES*3
consultation and lecture
Bidding that
gives preferential
treatment to
KES- certified companies
Diffusion of
energy efficient business
equipments
Diffusion of energy saving
behavior
Subsidy to small
businessesFunding to small
buisinesses
Diffusion of energy efficient
business
equipments
R&D in
environment+nano cluster
research
organizationDiffusion of
energy efficient
home appliance developed in the
nanocluster
Diffusion of energy efficient
business
equipments developed in the
nanocluster
Implementation
of KESC*4
Planning of
public building reformation of
energy saving
systemsEnergy saving
reformation of
public buildings
Promotion of
seasonal vegetable
distribution
Improvement of industrial
production
techniqueIncrease the
ratio of seasonal
Kyoto vegetable consumption
Implementation
of new national recycling society
plan
Reducing industrial solid
waste emission
Comprehensive Use of
Renewable Energy
PV/SWH
PV/SWH for public
buildings
Promotion of PV/SWH for houses
Fuel shift of automobile (petroleum to biomass)
Sustaining BDF
production
Promotion of biofuel
Power generation by biomass
Bio methanol power
generation
Power generation by waste
incineration
Creating a
installation
specification of PV/SWH for
public building
Installation of
PV/SWH on public building
Subsidize
system of PV
Diffusion of PV devices
Collection of
used cooking oil
R&D of Gasified
methanol
developmentSetting guideline
of biofuel use
Differentiate
taxation of biofuel use
Diffusion of
biofuel use in national scale
Fuel shift of
vehicle from oil to biofuel
R&D of Gasified
methanol
Construction of bio methanol
plant
Operation of
bio- methanol power
generation
Power
generation from
solid waste incineration
Promotion of options by
funds
Kyoto citizen environmental
fund
Forest environment
tax
Kyoto carbon offset
Operation of
Kyoto citizen
environmental fund
Design of forest
environment tax
systemImplementation
of forest
environment tax system
Development of
Kyoto carbon
offset model project
Full- scale
operation of Kyoto carbon
offset system

(6) EX. MODAL SHIFT
Designing Construction of Study on road Introducing IC Public bicycle
Modal shift (automobile to railway or
bus)
Transit mall Park & RideRoad pricing
Increase of public
transport use
Improvement of
environment for the usage of bicycle
Kyoto city
32
Designing pedestrian
transit mallPavement
widening
Use of pedestrian
transit mall
Construction of car- park
Management of car- park
Promotion of
park and ride
Study on road pricing
Construction of road pricing
facility
Implementation of Road pricing
Reducing vehicle inflow
Introducing IC card
Improvement of public transport
timetable
More convenient terminal
Increase of public transport
use
Public bicycle parking area
Ordinance of bicycle parking
area on
commercial buildings
Planning subsidy scheme
on bicycle
parking areaSubsidize
bicycle parking area
Increase of bicycle parking
area
Promotion of bicycle parking
areaIncrease of
bicycle use
Kyoto style Buildings and Forest Management
Improvement of emission intensity in construction
Forest absorption
Absorption of CO2 by
planting tree

(7) ACTION 1 WORKABLE CITY, KYOTO
2005 2010 2015 2020 2025 203043.8
0
100
200
300
400
500
600
700
800
CO
2emissions reduction (kt-CO
2)
722
Kyoto city
33
TDM implementation
Designing pedestrian transit mall
Pavement widening
Use of pedestrian transit mall
Construction of car- park
Management of car- park
Promotion of park and ride
Study on road pricing
Construction of road pricing facility
Implementation of Road pricing
Reducing vehicle inflow by road pricing
Introducing IC card
Increase of public transport use (by IC card)
Improvement of public transport timetable
Increase of public transport use (by timetable improvement)
More convenient terminal
Increase of public transport use (by more convenient terminal)
Public bicycle parking area
32
32
32
11
11
11
TDM implementation
Designing pedestrian transit mall
Pavement widening
Use of pedestrian transit mall
Construction of car- park
Management of car- park
Promotion of park and ride
Study on road pricing
Construction of road pricing facility
Implementation of Road pricing
Reducing vehicle inflow by road pricing
Introducing IC card
Increase of public transport use (by IC card)
Improvement of public transport timetable
Increase of public transport use (by timetable improvement)
More convenient terminal
Increase of public transport use (by more convenient terminal)
Public bicycle parking area

(8) ACTION 1 WORKABLE CITY, KYOTOOrdinance of bicycle parking area on commercial buildings
Planning subsidy scheme on bicycle parking area
Subsidize bicycle parking area
Increase of bicycle parking area
Promotion of bicycle parking area
Increase of bicycle parking area
Implementation of KICS- LLC model project
Increase of KISC- LLC project
Increase of railway use
Planning of LRT system
Construction of LRT system
Operating LRT
Using LRT system
Board of bus using system promotion
21
21
Ordinance of bicycle parking area on commercial buildings
Planning subsidy scheme on bicycle parking area
Subsidize bicycle parking area
Increase of bicycle parking area
Promotion of bicycle parking area
Increase of bicycle parking area
Implementation of KICS- LLC model project
Increase of KISC- LLC project
Increase of railway use
Planning of LRT system
Construction of LRT system
Operating LRT
Using LRT system
Board of bus using system promotion
Kyoto city
34
Board of bus using system promotion
Increase of bus lane
Promotion of bus lane system
Introducing public transport priority system
Increase of bus use
Campaign sightseeing using public transport
Planning intelligent bus transit system
Operating intelligent bus transit
Increase use of public transport by visitors outside of the city
Improvement of sightseeing information display
Public transport information service by website
Increase use of public transport by visitors outside of the city
Construction of electric vehicle recharge stations
Eco- vehicle promotion
Planning eco- vehicle subsidy
Eco- vehicle subsidy
Diffusion of eco- vehicle
Training of eco- driving
Diffusion of eco- driving
30
12
12
448
38
kt-CO2
Board of bus using system promotion
Increase of bus lane
Promotion of bus lane system
Introducing public transport priority system
Increase of bus use
Campaign sightseeing using public transport
Planning intelligent bus transit system
Operating intelligent bus transit
Increase use of public transport by visitors outside of the city
Improvement of sightseeing information display
Public transport information service by website
Increase use of public transport by visitors outside of the city
Construction of electric vehicle recharge stations
Eco- vehicle promotion
Planning eco- vehicle subsidy
Eco- vehicle subsidy
Diffusion of eco- vehicle
Training of eco- driving
Diffusion of eco- driving

IN OTHER COUNTRIES/CITIES
�Completed � Thailand (with SIIT)� Johor (Iskandar Malaysia)(with UTM)� India (with IIM)� Ahmedabad, India (with IIM)� Indonesia (with ITB)
Vietnam� Vietnam
�Proceeding/plannning� Ratchaburi, Thailand (with JGSEE)� Higashi-ohmi, Japan� Hanoi, Vietnum� Guangzhou, China (with GIEC)� Bhopal, India (with MANIT)
35

36Thank you!