asking scientific questions - kerboodle · pdf fileasking scientific questions ... think ahead...
TRANSCRIPT
© Oxford University Press 2014 www.oxfordsecondary.co.uk/acknowledgements This resource sheet may have been changed from the original.
Asking scientific questions
Setting the scene
Scientists ask questions before they design experiments. The answers help
them understand how or why something happens. In this activity you will
find out more about the best questions to ask.
Aims
In this activity you will be working scientifically to:
turn an idea into a question to investigate
state the independent, dependent, and control variables
decide which questions can be investigated with a practical investigation.
Task
For any investigation, you can change several things. These are called
variables.
Independent variable: what you change in an investigation
Dependent variable: what you measure to judge the effect of changing
the independent variable
Control variable: what you must keep the same
Fill in the table on the next page.

© Oxford University Press 2014 www.oxfordsecondary.co.uk/acknowledgements This resource sheet may have been changed from the original.
Station Ideas
(Think of three ideas)
Questions
(Choose one) Variables
1
1:
2:
3:
Independent:
Dependent:
Control:
2
1:
2:
3:
Independent:
Dependent:
Control:
3
1:
2:
3:
Independent:
Dependent:
Control:
4
1:
2:
3:
Independent:
Dependent:
Control:
Extension
1 Some questions cannot be investigated with a practical investigation.
Choose one question relating to one of the stations visited and explain
why it cannot be investigated.
2 Rewrite the question so it can be investigated with a practical experiment.
© Oxford University Press 2014 www.oxfordsecondary.co.uk/acknowledgements This resource sheet may have been changed from the original.
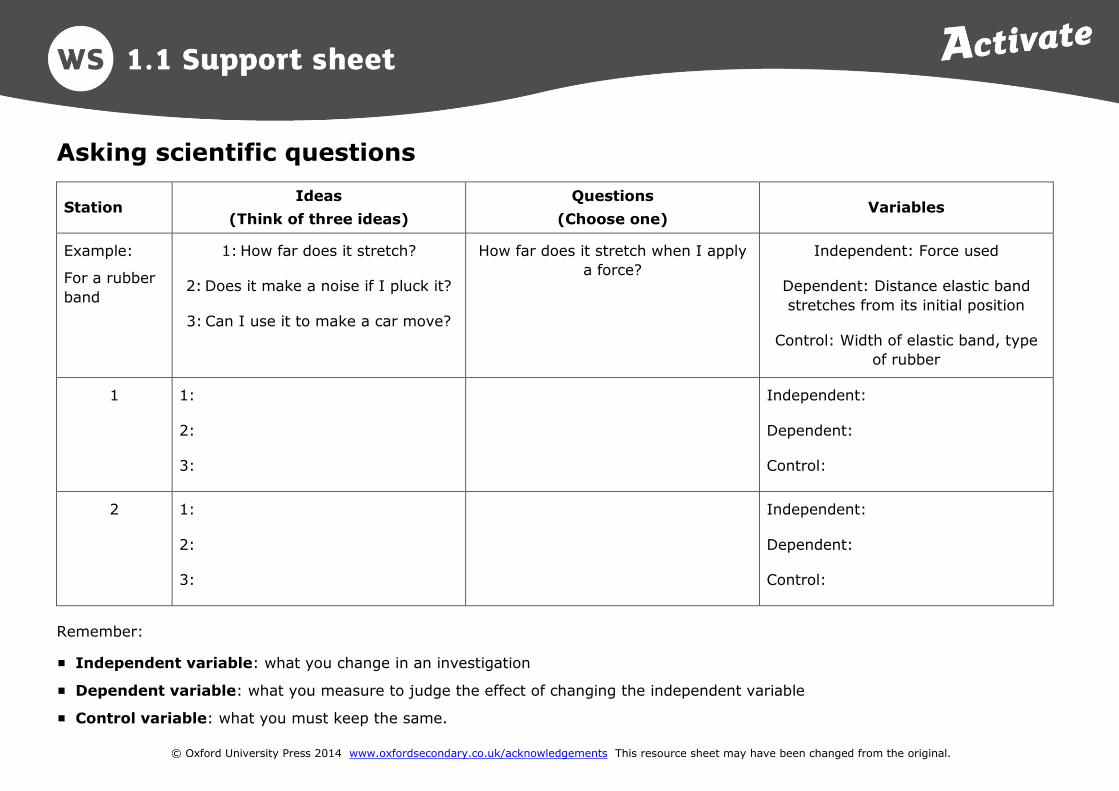
Asking scientific questions
Station Ideas
(Think of three ideas)
Questions
(Choose one) Variables
Example:
For a rubber
band
1: How far does it stretch?
2: Does it make a noise if I pluck it?
3: Can I use it to make a car move?
How far does it stretch when I apply
a force?
Independent: Force used
Dependent: Distance elastic band
stretches from its initial position
Control: Width of elastic band, type
of rubber
1 1:
2:
3:
Independent:
Dependent:
Control:
2 1:
2:
3:
Independent:
Dependent:
Control:
Remember:
Independent variable: what you change in an investigation
Dependent variable: what you measure to judge the effect of changing the independent variable
Control variable: what you must keep the same.
© Oxford University Press 2014 www.oxfordsecondary.co.uk/acknowledgements This resource sheet may have been changed from the original.
Planning investigations
Setting the scene
Scientists must plan an investigation to choose the best way to answer their
questions. This includes the method, how to carry out a safe investigation, and
how to collect good data.
In this activity you will find out more about planning investigations.
Aims
In this activity you will be working scientifically to:
decide what should be included in a plan
include examples of good data
include ideas for a risk assessment.
Task
It is important to choose the right equipment to make measurements.
At each station, choose the most suitable equipment to make the
measurement described.
Take a reading, followed by two repeats.
Think ahead so you plan to work safely. This is called a risk assessment.
Draw up your own results table using the grid below.

© Oxford University Press 2014 www.oxfordsecondary.co.uk/acknowledgements This resource sheet may have been changed from the original.
Questions
1 Station 1: Describe how you used the equipment to measure the volume of sand.
2 Station 2: Write down three things you must do to measure the thickness of a pile
of paper.
3 Station 3: State which equipment you used to measure the size of a piece of cloth.
Give a reason.
4 Station 4: Write a simple plan for another student to follow to measure the time for
a crumpled ball of paper to drop a vertical height of 1 m.
5 Scientists often check other people’s results. Check your results with another
student. If your results are the same, your experiment is reproducible. Explain if
any of your results were reproducible.
© Oxford University Press 2014 www.oxfordsecondary.co.uk/acknowledgements This resource sheet may have been changed from the original.
6 If you take the same measurements several times and get the same reading, the
experiment is repeatable. Explain if any of your results were repeatable.
Extension
Suggest some risks involved in heating water using a Bunsen burner. Explain how you can
reduce these risks.

© Oxford University Press 2014 www.oxfordsecondary.co.uk/acknowledgements This resource sheet may have been changed from the original.
Planning investigations
Station Equipment used Reading 1 Reading 2 Reading 3
1: volume of sand
2: thickness of a pile of
paper
3: size of a piece of
cloth
4: time for crumpled
paper to fall a vertical
distance of 1 m
© Oxford University Press 2014 www.oxfordsecondary.co.uk/acknowledgements This resource sheet may have been changed from the original.
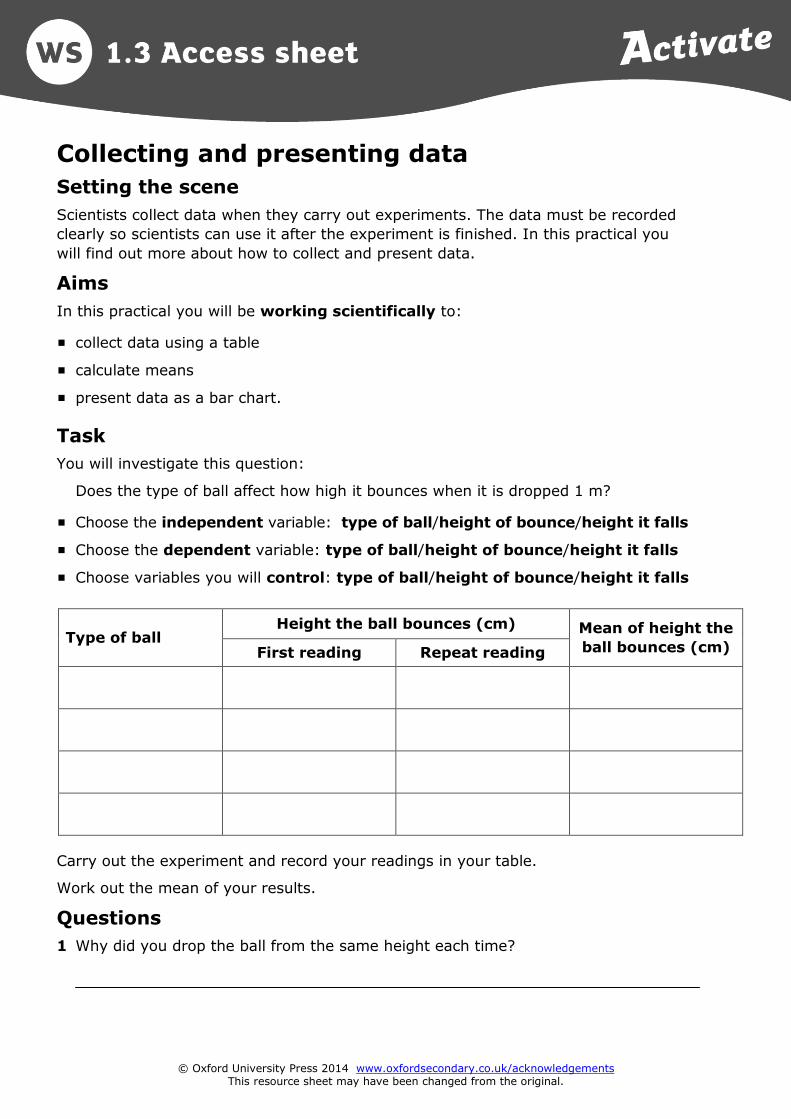
Collecting and presenting data
Setting the scene
Scientists collect data when they carry out experiments. The data must be recorded
clearly so scientists can use it after the experiment is finished. In this practical you
will find out more about how to collect and present data.
Aims
In this practical you will be working scientifically to:
collect data using a table
calculate means
present data as a bar chart.
Task
You will investigate this question:
Does the type of ball affect how high it bounces when it is dropped 1 m?
Choose the independent variable: type of ball/height of bounce/height it falls
Choose the dependent variable: type of ball/height of bounce/height it falls
Choose variables you will control: type of ball/height of bounce/height it falls
Type of ball Height the ball bounces (cm) Mean of height the
ball bounces (cm) First reading Repeat reading
Carry out the experiment and record your readings in your table.
Work out the mean of your results.
Questions
1 Why did you drop the ball from the same height each time?

© Oxford University Press 2014 www.oxfordsecondary.co.uk/acknowledgements This resource sheet may have been changed from the original.
2 Draw a bar chart to display your results in the grid below.
3 State if you can see a pattern in your results. Describe this pattern.

© Oxford University Press 2014 www.oxfordsecondary.co.uk/acknowledgements This resource sheet may have been changed from the original.
Collecting and presenting data
Setting the scene
Scientists collect data when they carry out experiments. The data must be
recorded clearly so scientists can use it after the experiment is finished. In this
practical you will find out more about how to record and present data.
Aims
In this practical you will be working scientifically to:
collect data using a table
calculate means
choose the best way to present data.
Safety
Try not to let balls roll on the floor.
Do not throw balls.
Equipment and materials
metre ruler
four different types of balls, as chosen by your teacher
Method
In this practical you will investigate this question:
Does the type of ball affect how high it bounces when it is dropped 1 m from the
ground?
Write down the independent variable:
Write down the dependent variable:
Write down variables you will control:
Carry out the experiment using four different types of balls provided.
Record your results in the table on the next page.

© Oxford University Press 2014 www.oxfordsecondary.co.uk/acknowledgements This resource sheet may have been changed from the original.
Results
Include a column for the independent variable.
Include three columns for the dependent variable – you will repeat readings.
Include a column for the mean of the readings.
Each column heading includes the name of the variable and its unit.
You need one row for each value of the independent variable.
Calculate the mean for your results.
Questions
1 State whether the data for your independent variable is continuous or categoric.
2 State whether the data for your dependent variable is continuous or categoric.
3 State the type of graph/chart you should draw to present your data. Explain your
answer.

© Oxford University Press 2014 www.oxfordsecondary.co.uk/acknowledgements This resource sheet may have been changed from the original.
4 Draw a graph/chart of your results in the grid below.
Remember: The independent variable should be on the x-axis and the
dependent variable should be on the y-axis.
5 State if you can see a pattern in your results. If there is a pattern, describe this pattern.
Extension
Suggest a reason for the pattern in your results.

© Oxford University Press 2014 www.oxfordsecondary.co.uk/acknowledgements This resource sheet may have been changed from the original.
Analysing data
Setting the scene
Scientists design experiments to answer a question. Once they have the data,
they must analyse it so they can explain if there is a relationship. In this
activity you will find out how to analyse data from experiments.
Aims
In this activity you will be working scientifically to:
plot graphs
use graphs to describe a relationship
describe stages in stating a relationship between variables.
Task
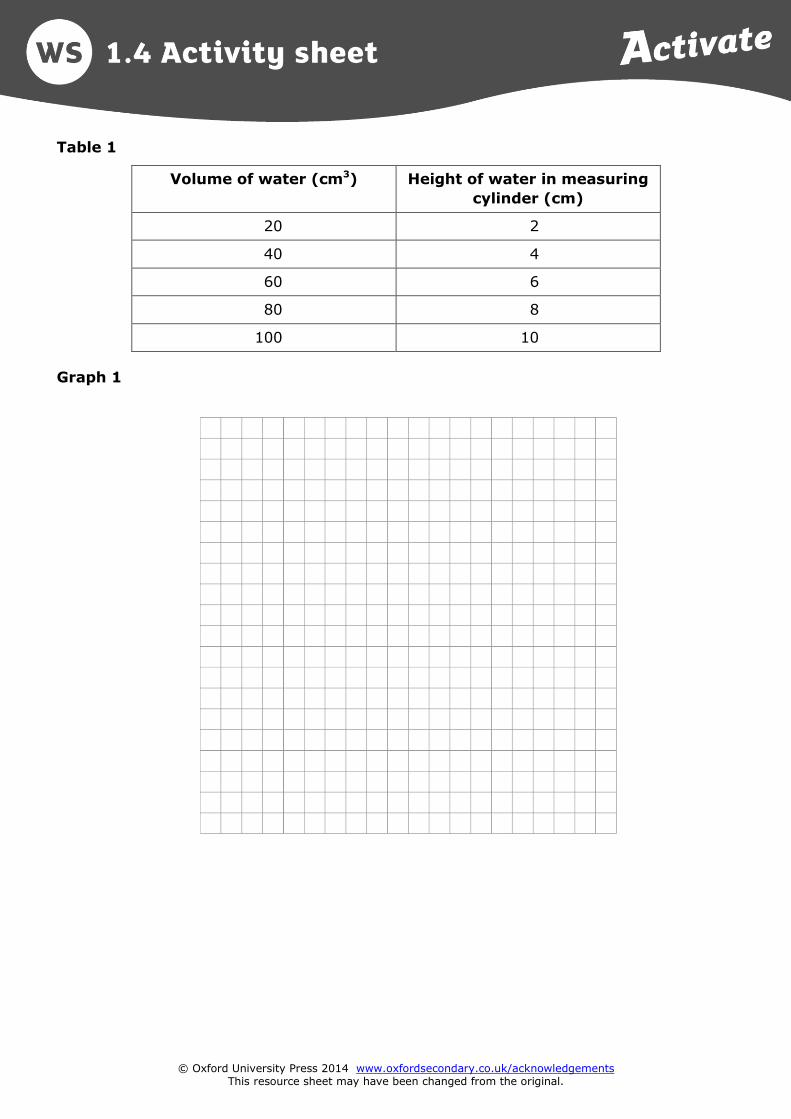
Plot a graph for each table of data using the grids provided.
o A scatter graph or line graph are best when variables are continuous (can have any value).
o Choose the scale so the numbers go up in equal steps.
o The independent variable is in the first column and goes on the x-axis (horizontal axis).
o Plan ahead so the numbers you plot fit on the graph’s axes.
o Don’t forget labels and units for both axes.
o Plot the points on the graph.
o Draw a straight line that goes as close to all the points as possible.
© Oxford University Press 2014 www.oxfordsecondary.co.uk/acknowledgements This resource sheet may have been changed from the original.
Table 1
Volume of water (cm3) Height of water in measuring
cylinder (cm)
20 2
40 4
60 6
80 8
100 10
Graph 1
© Oxford University Press 2014 www.oxfordsecondary.co.uk/acknowledgements This resource sheet may have been changed from the original.
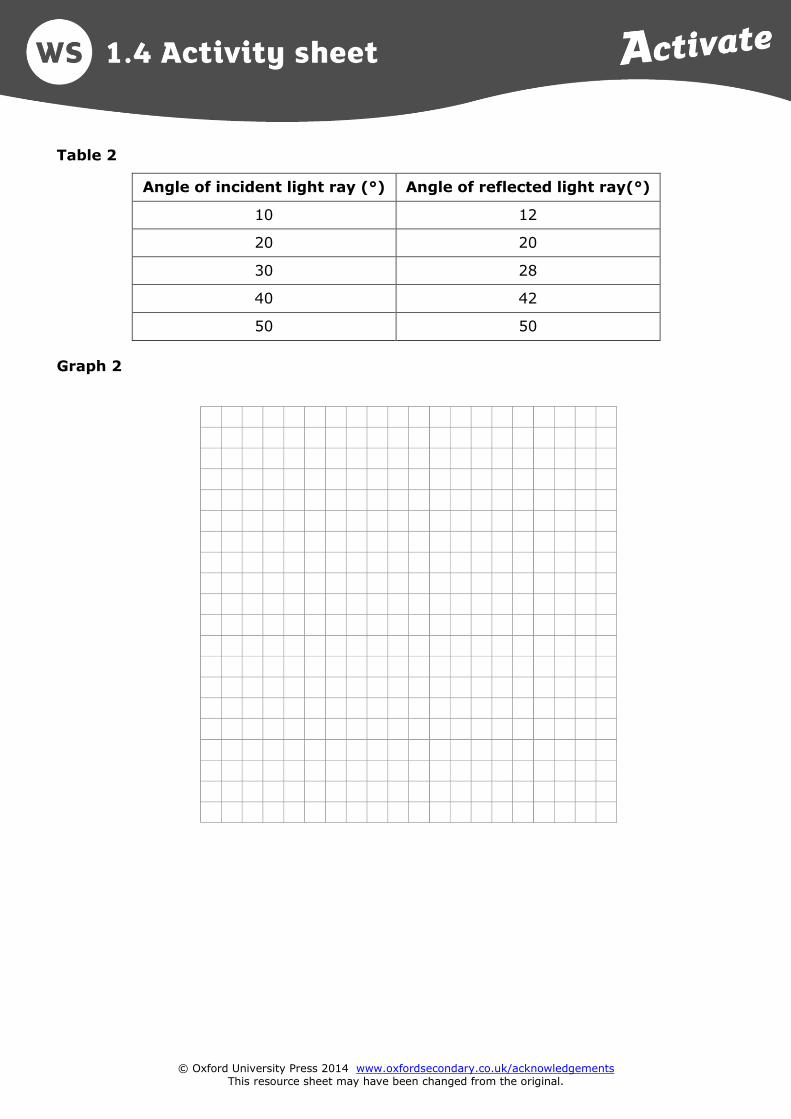
Table 2
Angle of incident light ray (°) Angle of reflected light ray(°)
10 12
20 20
30 28
40 42
50 50
Graph 2

© Oxford University Press 2014 www.oxfordsecondary.co.uk/acknowledgements This resource sheet may have been changed from the original.
Table 3
Force used (N) Length of rubber band (cm)
1 10.0
2 11.1
3 12.0
4 12.8
5 14.2
6 15.8
7 17.1
8 18.0
Graph 3

© Oxford University Press 2014 www.oxfordsecondary.co.uk/acknowledgements This resource sheet may have been changed from the original.
Describe the relationship each graph shows in as much detail as possible.
Graph 1
Graph 2
Graph 3
Questions
1 Give another example of data you could plot on a line graph or a scatter graph.
2 Give an example of data you could plot on a bar graph.
3 Describe the stages you must follow to analyse data and describe a relationship.

© Oxford University Press 2014 www.oxfordsecondary.co.uk/acknowledgements This resource sheet may have been changed from the original.
Extension
1 Plot this data on a scatter graph using the grid provided.
You do not need to start the scale for the y-axis at zero.
Table 4
Cooling time (s) Water temperature (°C)
0 80
60 71
60 66
90 63
120 57
150 55
180 53
210 51
240 50
Graph 5
© Oxford University Press 2014 www.oxfordsecondary.co.uk/acknowledgements This resource sheet may have been changed from the original.
2 You cannot draw a straight line of best fit for this data. Explain how you choose the
line of best fit.
3 Describe the relationship this graph shows. Use numbers to support your answer.

© Oxford University Press 2014 This resource sheet may have been changed from the original.
Analysing data Use the following labelled graph grids to plot your data.
Graph 1
Graph 2

© Oxford University Press 2014 This resource sheet may have been changed from the original.
Graph 3
© Oxford University Press 2014 www.oxfordsecondary.co.uk/acknowledgements This resource sheet may have been changed from the original.
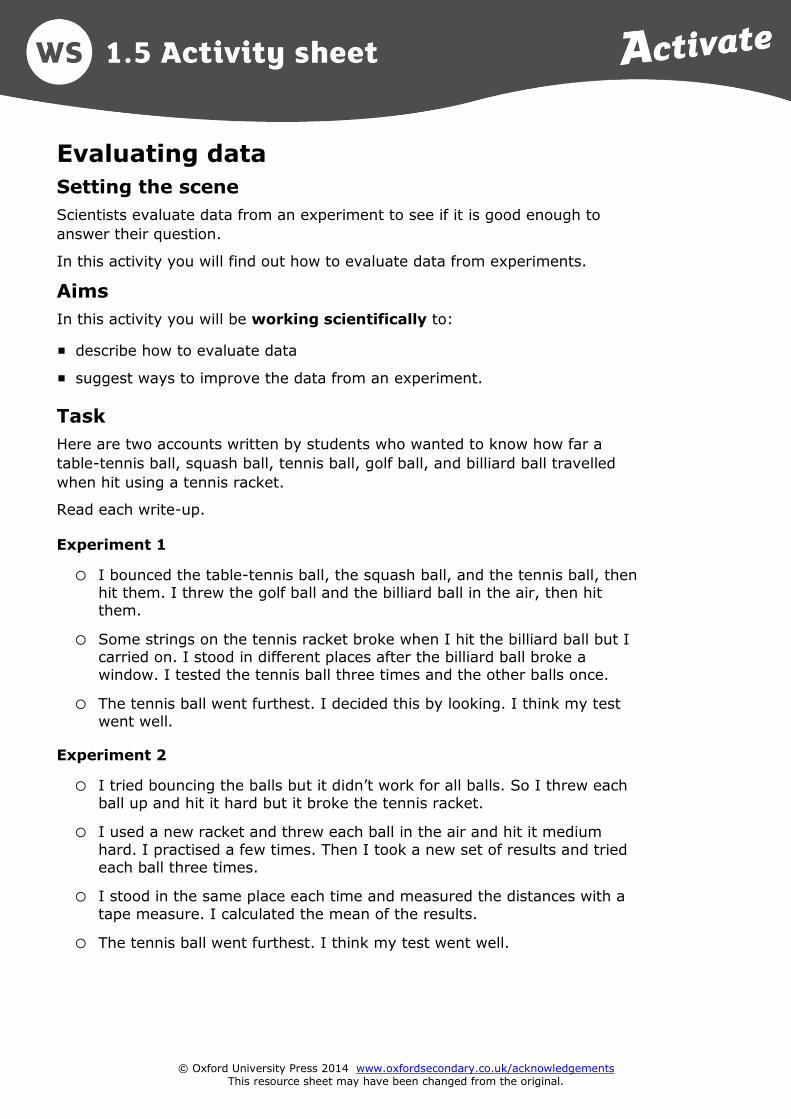
Evaluating data
Setting the scene
Scientists evaluate data from an experiment to see if it is good enough to
answer their question.
In this activity you will find out how to evaluate data from experiments.
Aims
In this activity you will be working scientifically to:
describe how to evaluate data
suggest ways to improve the data from an experiment.
Task
Here are two accounts written by students who wanted to know how far a
table-tennis ball, squash ball, tennis ball, golf ball, and billiard ball travelled
when hit using a tennis racket.
Read each write-up.
Experiment 1
o I bounced the table-tennis ball, the squash ball, and the tennis ball, then hit them. I threw the golf ball and the billiard ball in the air, then hit them.
o Some strings on the tennis racket broke when I hit the billiard ball but I carried on. I stood in different places after the billiard ball broke a window. I tested the tennis ball three times and the other balls once.
o The tennis ball went furthest. I decided this by looking. I think my test went well.
Experiment 2
o I tried bouncing the balls but it didn’t work for all balls. So I threw each ball up and hit it hard but it broke the tennis racket.
o I used a new racket and threw each ball in the air and hit it medium
hard. I practised a few times. Then I took a new set of results and tried each ball three times.
o I stood in the same place each time and measured the distances with a
tape measure. I calculated the mean of the results.
o The tennis ball went furthest. I think my test went well.

© Oxford University Press 2014 www.oxfordsecondary.co.uk/acknowledgements This resource sheet may have been changed from the original.
Summarise the key differences between the experiments in the table below.
Experiment 1 Experiment 2
Questions
1 Describe the stages each student must do to evaluate their data.
2 State which experiment gave better results. Explain your answer.
3 Suggest three ways to improve the first experiment.
© Oxford University Press 2014 www.oxfordsecondary.co.uk/acknowledgements This resource sheet may have been changed from the original.
Extension
1 From the three suggestions that you have given in Question 3 above, explain which
change would improve the data most.
2 Explain why it is important to evaluate data carefully.
© Oxford University Press 2014 www.oxfordsecondary.co.uk/acknowledgements This resource sheet may have been changed from the original.
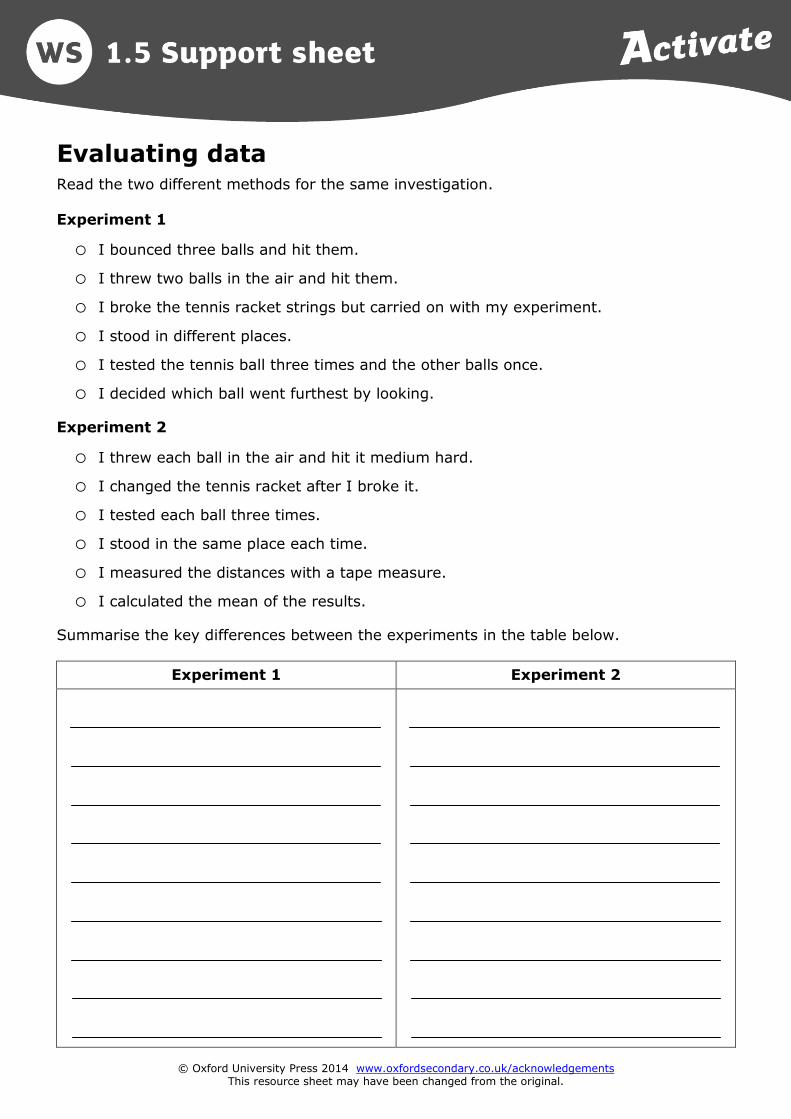
Evaluating data Read the two different methods for the same investigation.
Experiment 1
o I bounced three balls and hit them.
o I threw two balls in the air and hit them.
o I broke the tennis racket strings but carried on with my experiment.
o I stood in different places.
o I tested the tennis ball three times and the other balls once.
o I decided which ball went furthest by looking.
Experiment 2
o I threw each ball in the air and hit it medium hard.
o I changed the tennis racket after I broke it.
o I tested each ball three times.
o I stood in the same place each time.
o I measured the distances with a tape measure.
o I calculated the mean of the results.
Summarise the key differences between the experiments in the table below.
Experiment 1 Experiment 2

© Oxford University Press 2014 www.oxfordsecondary.co.uk/acknowledgements This resource sheet may have been changed from the original.