asmi statutory interim report 2017 - asm international · h.w. kreutzer m.c.j. van pernis ......
TRANSCRIPT

CONNECTINGTHE DOTS
STATUTORY INTERIM REPORTFOR THE SIX MONTH PERIOD ENDED JUNE 30, 2017

TABLE OF CONTENTS
GENERAL 3
PROFILE 4
VALUE CREATION 5
MISSION, STRATEGY AND FOCUS AREAS 7
KEY FIGURES 9
INTERIM MANAGEMENT BOARD REPORT 10
REPORTING RESPONSIBILITIES AND RISKS 15
CONSOLIDATED CONDENSED INTERIM FINANCIAL STATEMENTS 16
ASM INTERNATIONAL | STATUTORY INTERIM REPORT 2017 | 2

ASM International NV was incorporated on March 4, 1968 as a Dutch public limited liability company (“naamloze vennootschap”) and was previously known as Advanced Semiconductor Materials International NV.
Our principal executive office is located at Versterkerstraat 8, 1322 AP, Almere, the Netherlands. Our telephone number at that location is +31 88 100 8810, fax is +31 88 100 8830, website www.asm.com.
The Company’s first half of the financial year runs from January 1 to June 30.
SUPERVISORY BOARDJ.C. Lobbezoo, ChairmanH.W. KreutzerM.C.J. van PernisU.H.R. SchumacherS. Kahle-Galonske
MANAGEMENT BOARDC.D. del Prado, Chairman of the Management Board, President and Chief Executive Officer P.A.M. van Bommel, Member of the Management Board and Chief Financial Officer
GENERAL
ASM INTERNATIONAL | STATUTORY INTERIM REPORT 2017 | 3

ASM International NV (ASMI) is a leading supplier of semiconductor wafer processing equipment and process solutions. Our customers include the world’s top semiconductor device manufacturers. We help them create faster, cheaper and more powerful semiconductors that bring greater opportunities for people to understand, create and share more.
OUR ROLEWe design, manufacture and sell equipment and services to our customers for the production of semiconductor devices, or integrated circuits (ICs). Semiconductor ICs, often called chips, are a key technology that enable the advanced electronic products used by consumers and businesses everywhere. Our innovative technologies are used by the most advanced semiconductor manufacturers, primarily for the deposition of thin films.
Our customers’ goal is to build faster, cheaper, and more powerful semiconductors. We work closely with them to make this a reality, forging mutually beneficial partnerships that enable us to help them develop their technology roadmap. At the same time, our customers become expert users of our equipment, and their insights help us to continuously improve our systems, resulting in greater productivity and lower operating costs per wafer, benefiting us, them and the end consumer.
Because collaboration is such a vital part of our success, we also develop close ties with many of our other stakeholders. For example, we maintain partnerships with technical institutions and universities to carry out leading-edge research and development. At the same time, working closely with our suppliers helps us manufacture, service, and sustain our products efficiently.
COMPLEX PROCESSESThe process of making semiconductor ICs is highly complex and very costly. Semiconductor fabrication plants, called fabs, house a large set of wafer processing equipment which performs a series of process steps on round silicon wafers, which are typically 300mm in diameter. The equipment is operated in cleanrooms, which filter the air to avoid contamination from small particles that could negatively affect the circuitry on the chips. Most of our systems are designed for deposition processes when thin films, or layers, of various materials are grown or deposited onto the wafer. After testing the individual circuits for correct performance, the chips on the wafer are separated and then packaged in a protective housing before ultimately becoming part of a set of semiconductor chips on circuit boards within an electronic product.
PROFILE
ASM INTERNATIONAL | STATUTORY INTERIM REPORT 2017 | 4

We create value through our technologies by enabling leading semiconductor and technology industry partners to deliver the world of tomorrow through our innovative processing solutions and equipment. We partner with our customers and stakeholders to develop new materials, processes, and technologies that support their technology roadmaps that shape the world of the Internet of Things, smart cars, artificial intelligence, and cloud computing.
The chip-making process has entered the age of the nanometer, and we are now creating transistors that are only a small number of nanometers in width. But connecting billions of nanoscopic transistors on a single chip requires an astonishing degree of precision and control. As a leading supplier of equipment and process solutions to the semiconductor industry, our technology makes this possible.
GREATER PERFORMANCE, REDUCED ENERGY CONSUMPTIONDelivering excellence through advanced deposition technologies on dependable, cost-effective products enables us to realize the technology roadmaps we co-create with our customers. This leads to electronic devices that deliver ever-greater performance while reducing their energy consumption. Higher performance translates into more processing power, while lower energy requirements means smaller, longer-lasting, more efficient products. This enables our customers to further integrate smart technology into a wider range of their products.
The result is value creation not only for our customers, but for all of our stakeholders. For example, our employees enjoy the challenge of developing cutting-edge technology solutions, and have the opportunity for advancement. Our suppliers benefit from improved quality based on the use of statistical methods employed in our Supplier Process Control program.
10 NANOMETER DEVICESThe industry’s relentless push to follow Moore’s Law and the continuous demand for smaller, faster, and cheaper semiconductor components drives the technology advances in the semiconductor manufacturing process. As the transistors in an integrated circuit become smaller, the cost-per-component decreases. At the same time, the operating speed of the transistor increases. Thus, the minimum size of a single transistor in an integrated circuit is an important parameter. Today, our customers manufacture semiconductor devices as small as 10 nanometers (one nanometer, or nm, is one billionth of a meter), sometimes in a vertical 3D transistor or FinFET architecture.
HIGH PRODUCTIVITYIn addition to addressing the technology needs of our customers, the relentless drive of the industry to reduce cost corresponds to significant spending on development programs that further increase throughput, equipment reliability, and yield in our customers’ line, and further lower the cost per wafer of the wafer processing systems.
VALUE CREATION
ASM INTERNATIONAL | STATUTORY INTERIM REPORT 2017 | 5

OUR BUSINESS MODELOur technology enables precision deposition of thin films in various steps in the fabrication of semiconductor chips, helping our customers build the most advanced chips used in the electronics systems throughout society.
Our business model enables us to create value for the company and all of our stakeholders. We achieve this by working with our customers to develop innovative solutions, while constantly looking at what is best for our investors, our people, society, and other stakeholders. Fundamental to our model is R&D investment, including basic chemical, materials and feasibility research, followed by process and product developments. We endeavor to continuously employ experts in the semiconductor process and equipment technology fields, and support them with new patent filings. We cooperate with research institutes and our customers to understand the technology roadmap challenges and to develop the appropriate process and equipment solutions required.
Our manufacturing facility allows us to deliver high-quality systems on schedule so that our customers can ramp their fabrication plants. We support our customers globally with process and equipment service, and spare parts.
ASM INTERNATIONAL | STATUTORY INTERIM REPORT 2017 | 6

Our track record as an experienced innovation leader is the result of focusing on key issues and challenges within the semiconductor industry, enabling us to make the greatest difference to our customers, employees, and company stakeholders. While issues may change over time: we will continue to transform the results of our breakthrough technologies into volume manufacturing, benefiting our customers.
MISSIONOur mission is to provide our customers with the most advanced, cost-effective, and reliable products, service and global support network in the semiconductor industry and beyond. We advance the adoption of our deposition technology platforms by developing new materials and process applications that support our customers’ long-term technology roadmaps.
VISIONWe aim to delight our customers, employees and shareholders by driving innovation with new technologies and delivering excellence with dependable products. By doing this, we will create new possibilities for everyone to learn, create and share more of what they love.
STRATEGYOur strategic objective is to realize profitable, sustainable growth by capitalizing on our innovative strength in deposition technologies and our strong relationships with key customers. We act thereby as a responsible citizen.
The key elements of our strategy are:
› INNOVATIVE STRENGTH We are recognized for our technology leadership. We provide leading deposition technologies that support our customers in staying on the curve of Moore’s Law. Our innovative strength is what differentiates us in the marketplace, creates growth opportunities for our employees, and continues to be the cornerstone of our strategy. Apart from our internal R&D efforts, we are continuously expanding and deepening our strategic cooperation with key customers, suppliers, chemical manufacturers and research institutes such as imec. Our suppliers manufacture advanced components and assemblies to the tightest of tolerances and are required to adhere to our stringent design specifications, quality systems, and corporate responsibility requirements. This approach enables us to remain innovative and swiftly meet the changing demands of our customers.
› LEADERSHIP IN DEPOSITIONWe create value through our advanced thin film deposition technologies, which help leading semiconductor and technology industry partners to deliver the world of tomorrow through advanced chips. One of these technologies is ALD which is established as a mainstream technology in high-volume manufacturing, supporting virtually all of the leading customers in the semiconductor industry. As a leader in this space, ALD has turned into a key growth driver for our business. We expect that the trends of continued scaling and evolution towards 3D device structures will further expand the number of applications for ALD. We aim to maintain our leading position in ALD by leveraging on our strong expertise and established customer relationships, and by developing new applications in deposition technologies to support our customers with increasingly complex device node transitions. Within wafer processing, we focus primarily on equipment and process solutions for the deposition of thin films. Our core strengths are in ALD, epitaxy, plasma enhanced chemical vapor deposition (PECVD), low pressure chemical vapor deposition (LPCVD) and oxidation/diffusion. With this broad portfolio of technologies, we are addressing many of the key areas on the semiconductor industry roadmap, including:
MISSION, STRATEGY AND FOCUS AREAS
ASM INTERNATIONAL | STATUTORY INTERIM REPORT 2017 | 7

› high-k metal gate; › advanced FinFET transistors; › dielectric spacers for multiple patterning; › advanced 3D memories; › liners, etch stops, and spacers; › low-k dielectrics for interconnect; and › strained silicon for transistor channel engineering.
Our breakthrough technologies enable the industry to move to smaller line widths and better transistors that use new materials. We focus on serving the top companies that produce logic chips and memory devices, which includes addressing the needs of top foundries. By serving the leading chipmakers, we maintain an understanding of the important requirements of the next generation of device roadmaps, enabling us to develop value-added solutions to the industry’s critical issues. In many cases, new films developed for one device type can be utilized for other device types with relatively limited additional development.
› OPERATIONAL EXCELLENCE While technology leadership remains crucial, we have a responsibility to our stakeholders to continue to focus on further improving the effectiveness of our organization and the efficiency of processes. We aim to provide our customers with dependable leading-edge products and services at a consistent quality level, providing the best cost of ownership. To help achieve this, we continue to optimize our manufacturing and global sourcing processes, including the migration to common product platforms. We are working with our suppliers to improve fundamental quality through statistical methods and process controls. Our employees are engaged in an improved product life cycle process and our Product Safety Council is focused on further improving product safety through fundamental design.
In addition to addressing the technology needs of our customers, we also focus on further increasing equipment throughput and equipment reliability, thereby lowering the cost per wafer of our wafer processing systems. Combined with our commitment to quality, we continuously strive to achieve industry-leading productivity. In addition, to enable further efficiencies in our manufacturing process, we exert significant effort on improving the level of standardization in our equipment portfolio by migrating to common platforms, sub-assemblies and components.
ASM INTERNATIONAL | STATUTORY INTERIM REPORT 2017 | 8

SIX MONTHS ENDED JUNE 30,
(EUR million, except per share data and employees) 2016 2017
New orders 322.9 410.1
Backlog 175.4 209.6
Book-to-bill 1.1 1.2
Net sales 281.2 346.5
Gross profit 123.3 151.1
Gross profit margin % 43.8 % 43.6 %
Result from operations 35.5 52.6
Operating margin % 12.6% 15.2%
Share in income of investments in associates 9.1 53.3
Result from sale and dilution of ASMPT stake – 83.8
Net earnings from operations, attributable to common shareholders 40.9 168.0
Non-current assets 1,421.5 1,292.6
Current assets 602.1 848.4
Total assets 2,023.6 2,141.1
Non-current liabilities 13.9 12.9
Current liabilities 102.7 152.7
Total equity 1,907.0 1,975.4
Net working capital 1) 133.0 176.2
Net debt 2) (370.1) (522.8)
Cash flows from operating activities 31.3 19.2
Cash flows from investing activities (24.1) 223.3
Cash flows from financing activities (83.2) (101.9)
Number of employees 1,609 1,771
Per share data
Basic net earnings per share 0.67 2.84
Diluted net earnings per share 0.66 2.80
Weighted average number of shares (thousand)
Basic 61,156 59,192
Diluted 61,687 59,937
1 See Notes to the Consolidated condensed interim financial statements, Note 4.2 Net debt is defined as debt minus cash and cash equivalents.
KEY FIGURES
ASM INTERNATIONAL | STATUTORY INTERIM REPORT 2017 | 9

ASMI CONSOLIDATED RESULTS FOR THE SIX MONTHS ENDED JUNE 30, 2017The following table shows the operating performance for the six months ended June 30, 2017, compared to the same period of previous year:
SIX MONTHS ENDED JUNE 30,
(EUR million) 2016 2017 CHANGE
New orders 322.9 410.1 27%
Backlog 175.4 209.6 19%
Book-to-bill 1.1 1.2
Net sales 281.2 346.5 23%
Gross profit 123.3 151.1 23%
Gross profit margin % 43.8% 43.6%
Selling, general and administrative expenses (43.5) (48.2) 11%
Research and development expenses (42.9) (49.6) 16%
Restructuring expenses (1.5) (0.7) n/a
Result from operations 35.5 52.6 48%
Operating margin % 12.6% 15.2%
Financing income/(expenses) (1.2) (17.9) (16.7)
Income tax (2.5) (3.7) (1.2)
Share in income of investments in associates
ASMI share in net earnings ASMPT 22.7 66.4 43.7
Amortization of fair value adjustments from PPA (13.5) (13.1) 0.4
Result from sale and dilution of ASMPT stake – 83.8 83.8
Net earnings from operations, attributable to common shareholders 40.9 168.0 127.1
The backlog at the end of June 2017 increased with 19% to a level of €209.6 million, compared to June 30 last year. The book-to-bill ratio was 1.2.
Backlog includes orders for which purchase orders or letters of intent have been accepted, typically for up to one year. Historically, orders have been subject to cancellation or rescheduling by customers. In addition, orders have been subject to price negotiations and changes in specifications as a result of changes in customers’ requirements. Due to possible customer changes in delivery schedules and requirements and to cancellation of orders, our backlog at any particular date is not necessarily indicative of actual sales for any succeeding period.
INTERIM MANAGEMENT BOARD REPORT
ASM INTERNATIONAL | STATUTORY INTERIM REPORT 2017 | 10

The following table shows the level of new orders for the six months ended June 30, 2017 and the backlog as per June 30, 2017 compared to the comparable period of 2016:
SIX MONTHS ENDED JUNE 30,
(EUR million) 2016 2017 % CHANGE
BACKLOG AT THE BEGINNING OF THE YEAR 127.8 156.7 23%
New orders 322.9 410.1 27%
Net sales (281.2) (346.5) 23%
FX-effect 5.9 (10.6)
BACKLOG AS PER REPORTING DATE 175.4 209.6 19%
BOOK-TO-BILL RATIO (NEW ORDERS DIVIDED BY NET SALES) 1.1 1.2
Net sales for the six months ended June 30, 2017 amounted to €346.5 million, an increase with 23% compared to the same period last year. Our ALD business continued to be the key revenue driver. The impact of currency changes was an increase of 3% year on year.
The gross profit margin for the six months ended June 30, 2017 at 43.6% remained relatively stable compared to the 43.8% of the same period last year. The impact of currency changes was an increase of 3% year on year.
Selling, general and administrative expenses increased with 11% compared to the previous year. As a percentage of sales SG&A expenses were 14% compared to 15% for the same period previous year. The impact of currency changes was an increase of 2% year on year.
Research and development expenses
SIX MONTHS ENDED JUNE 30,
(EUR million) 2016 2017 % CHANGE
Research and development expenditure (48.3) (56.7) 17%
Capitalized development expenditure 13.8 15.5 12%
Amortization capitalized development expenditure (8.3) (7.1) (14)%
Impairment – (1.4) n/a
TOTAL (42.9) (49.6) 16%
Research and development expenses for the six months ended June 30, 2017 increased with 16% compared to the comparable period previous year, driven by additional investments to fulfill customer requirements. As a percentage of sales R&D expenses were 14%, compared to 15% for the previous year. The impact of currency changes was an increase of 3%.
Result from operations increased from €35.5 million in the first six months of 2016 to €52.6 million for the same period this year. Operating margin increased from 12.6% to 15.2%.
ASM INTERNATIONAL | STATUTORY INTERIM REPORT 2017 | 11

Financing income/(expenses)
SIX MONTHS ENDED JUNE 30,
(EUR million) 2016 2017 CHANGE
Interest income 2.6 0.7 (1.9)
Interest expenses (0.6) (0.7) (0.1)
Foreign currency exchange results (3.2) (18.0) (14.8)
TOTAL (1.2) (17.9) (16.7)
Interest expenses for the six months ended June 30, 2017 are mainly related to the stand-by facility. Foreign currency exchange results reflect the revaluation of cash positions denominated in foreign currencies, mainly US$.
Share in income of investments in associatesResult from investments includes our approximately 34% share in net earnings of ASMPT. In the six month ended June 30, 2017 ASMPT showed a sales increase of 25% compared to the first six months of last year, from HK$6,531 million to HK$8,185 million. Sales were 6% above the level of the last six months of 2016 of HK$7,718 million. ASMPT’s net earnings on a 100% base include a one-off non-cash gain of €24 million related to the revaluation of the convertible bond. Excluding this one-off, on a 100% basis, net earnings were €151 million in the six months ended June 30, 2017. The comparable period last year, also on a 100% basis, showed net earnings, excluding one-offs, of €80 million.
For the six months ended June 30, 2017 the amortization of the recognized intangible assets and the depreciation of the fair value adjustment for property, plant & equipment negatively impacted net earnings with €13.1 million. The annualized amount of this amortization will remain on a level of approximately €24 million until 2018 and will then decrease.
Reporting ASMI share in net earnings of ASMPT in the consolidated statement of profit or loss:
SIX MONTHS ENDED JUNE 30,
(EUR million) 2016 2017
ASMI share in net earnings ASMPT 22.7 66.4
Amortization of fair value adjustments from PPA (13.5) (13.1)
TOTAL 9.1 53.3
Result from sale and dilution of ASMPT stakeOn April 24, 2017, the Company announced the divestment of approximately 5% stake in ASM Pacific Technology Ltd (ASMPT). The transaction was settled on April 27, 2017.
The company sold 20,000,000 ordinary shares of ASMPT at a price of HK$105.00 per share to institutional or other professional investors through a partial secondary share placement, representing a 4.90% stake in ASMPT. This share placement was executed at April 25, 2017 and settled on April 27, 2017. The placement generated gross cash proceeds for the Company of HK$2,100,00,000 (approximately €248 million). The result of the sale was converted into euro using the transaction rate. The transaction rate is the actual rate for which the net proceeds were received. This rate was 0.11826. The Company maintains a share of 34.29% in ASMPT after this transaction.
ASM INTERNATIONAL | STATUTORY INTERIM REPORT 2017 | 12

Result from sale and dilution of ASMPT stake in the consolidated statement of profit or loss:
(Amounts in thousands) HKD EUR
Net proceeds 2,076,464 245,565
Equity value (493,063) (58,310)
PPA (937,024) (111,115)
Realization CTA due to sale 7,637
TOTAL 646,377 83,777
CASH FLOW, BALANCE SHEET, LIQUIDITY AND CAPITAL RESOURCES
CASH FLOWThe following table shows the cash flow statements for the six months ended June 30, 2017 compared to the same period of previous year:
SIX MONTHS ENDED JUNE 30,
(EUR million) 2016 2017
NET EARNINGS FROM OPERATIONS, ATTRIBUTABLE TO COMMON SHAREHOLDERS 40.9 168.0
Adjustments required to reconcile net earnings to net cash from operating activities:
Depreciation, amortization and impairments 23.8 25.5
Share-based compensation 3.7 3.6
Income taxes 2.5 3.7
Non-cash financing costs 0.7 (5.9)
Investments and associates (9.1) (137.1)
Changes in other assets and liabilities:
Accounts receivable (17.6) (17.6)
Inventories (0.2) (51.5)
Other current assets 0.2 (4.8)
Accounts payable and accrued expenses (9.5) 36.3
Income tax paid (4.1) (1.1)
NET CASH PROVIDED BY OPERATING ACTIVITIES 31.3 19.2
Capital expenditures (13.8) (23.3)
Capitalized development expenditure (13.8) (15.5)
Purchase of intangible assets (3.7) (1.5)
Dividend received from associates 7.2 18.1
Proceeds from disposal of ASMPT stake – 245.6
NET CASH (USED) PROVIDED IN INVESTING ACTIVITIES (24.1) 223.3
Purchase of treasury shares (57.0) (70.4)
Proceeds from issuance of shares and exercise of stock options 11.0 10.2
Dividend paid to common shareholders ASMI (37.2) (41.5)
Debt issuance fees paid – (0.1)
NET CASH USED IN FINANCING ACTIVITIES (83.2) (101.9)
ASM INTERNATIONAL | STATUTORY INTERIM REPORT 2017 | 13

BALANCE SHEETNet working capital, consisting of inventories, accounts receivable, other current assets, accounts payable, provision for warranty and accrued expenses and other payables, increased from €157 million as per December 31, 2016 to €176 million at June 30, 2017. The number of outstanding days of working capital, measured against quarterly sales, decreased from 82 days at December 31, 2016 to 78 days at June 30, 2017.
SOURCES OF LIQUIDITYOn June 30, 2017, the Company’s principal sources of liquidity consisted of €523 million in cash and cash equivalents and €150 million in undrawn bank lines.
SHARE BUYBACK PROGRAMSOn May 25, 2016, the Annual General Meeting of Shareholders authorized ASMI to acquire up to a maximum of 10% of its shares for a period of 18 months. On October 26, 2016, ASMI announced a share buyback program for the repurchase of up to €50 million of the Company’s common shares within the 2016-2017 time frame. On March 2, 2017, ASMI announced that its Management Board authorized an increase in this program to €100 million. The 2016-2017 program started on December 13, 2016 and is part of ASMI’s commitment to use excess cash for the benefit of its shareholders. On June 30, 2017, 77.7% of the program was completed at an average share price of €49.93.
On April 24, 2017, ASMI announced a partial sale of its ASMPT stake, whereby ASMI indicated to use the net proceeds of approximately €245 million for a new share buyback program. The program will start as soon as the current program has been completed. During the Annual General Meeting of Shareholders of May 22, 2017 the Board was again authorized to acquire up to 10% of ASMI shares for a period of 18 months. During the same meeting it was approved to cancel 1.5 million treasury shares.This became effective as of August 1, 2017. In this respect it is noted that the company held 4.82 million treasury shares as per June 30, 2017, which is more than sufficient to cover the outstanding options and restricted/performance shares.
ASMI intends to use part of the shares for commitments under employee share-based compensation schemes.
SUBSEQUENT EVENTSSubsequent events have been evaluated by the Company until August 31, 2017, the issuance date of this interim report 2017. There are no subsequent events to report.
ASM INTERNATIONAL | STATUTORY INTERIM REPORT 2017 | 14

RELATED PARTY TRANSACTIONSThere have been no significant related party transactions or changes in related party transactions described in ASMI’s 2016 Statutory Annual Report that could have a material effect on the financial position or performance of the Company in the first six months of the 2017 financial year.
AUDITORS’ INVOLVEMENTThe contents of this Interim Financial Report have not been audited or reviewed by an external auditor.
RISKS AND UNCERTAINTIESIn conducting our business, we face a number of principal risks and uncertainties that each could materially affect our business, revenues, income, assets and liquidity and capital resources. For a detailed description of our assessment of the major risk factors, see Risk management in our 2016 Statutory Annual Report. Those risk factors are deemed incorporated and repeated in this report by reference. ASMI believes that these risks similarly apply for the second half of 2017.
We monitor our primary risks on a continuous basis and implement appropriate measures as promptly as practicable to address known and new risks as they emerge and change. Additional risks not known to us or now believed to be not material could later turn out to have material impact on us.
OUTLOOKBased on our current assessment, we continue to expect a clear year-on-year improvement in the single wafer ALD market in 2017, with demand in the Logic/Foundry segment remaining healthy and a strong increase in the 3D-NAND segment.
For the third quarter we expect a sales level of €170-190 million, on a currency comparable level, while for the second half of 2017 as a whole we expect a sales level higher than in the first half of 2017. After the very strong orders in the past two quarters we expect order intake in Q3 at a still healthy level of €150-170 million, on a currency comparable level.
RESPONSIBILITY STATEMENTThe Management Board of the Company hereby declares that, to the best of its knowledge:
› the Consolidated condensed interim financial statements of the first six months ended June 30, 2017 prepared in accordance with IAS 34 Interim Financial Reporting give a true and fair view of the assets, liabilities, financial position and results of the Company and the undertakings included in the consolidation taken as a whole; and
› the Interim report of the Management Board gives a fair review of the information required pursuant to section 5:25d(8)/(9) of the Dutch Financial Markets Supervision Act (“Wet op het Financieel Toezicht”).
Almere, August 31, 2017
Management Board ASM International NV
C.D. del Prado, Chairman of the Management Board, President and Chief Executive OfficerP.A.M. van Bommel, Member of the Management Board and Chief Financial Officer
REPORTING RESPONSIBILITIES AND RISKS
ASM INTERNATIONAL | STATUTORY INTERIM REPORT 2017 | 15

CONSOLIDATED CONDENSED INTERIM FINANCIAL STATEMENTSFOR THE SIX MONTHS ENDED JUNE 30, 2017
CONSOLIDATED STATEMENTS OF PROFIT OR LOSS 17
CONSOLIDATED STATEMENTS OF COMPREHENSIVE INCOME 18
CONSOLIDATED STATEMENTS OF FINANCIAL POSITION 19
CONSOLIDATED STATEMENTS OF CHANGES IN EQUITY 20
CONSOLIDATED STATEMENT OF CASH FLOWS 21
NOTES TO CONSOLIDATED CONDENSED INTERIM FINANCIAL STATEMENTS 22
NOTE 1. GENERAL INFORMATION / SUMMARY OF SIGNIFICANT ACCOUNTING POLICIES 22
NOTE 2. OTHER INTANGIBLE ASSETS 23
NOTE 3. INVESTMENTS IN ASSOCIATES 24
NOTE 4. WORKING CAPITAL 26
NOTE 5. SEGMENT DISCLOSURE 27
NOTE 6. LITIGATION AND ENVIRONMENTAL MATTERS 29
NOTE 7. EARNINGS PER SHARE 30
NOTE 8. RELATED PARTY TRANSACTIONS 30
SAFE HARBOR STATEMENT 31
ASM INTERNATIONAL | STATUTORY INTERIM REPORT 2017 | 16
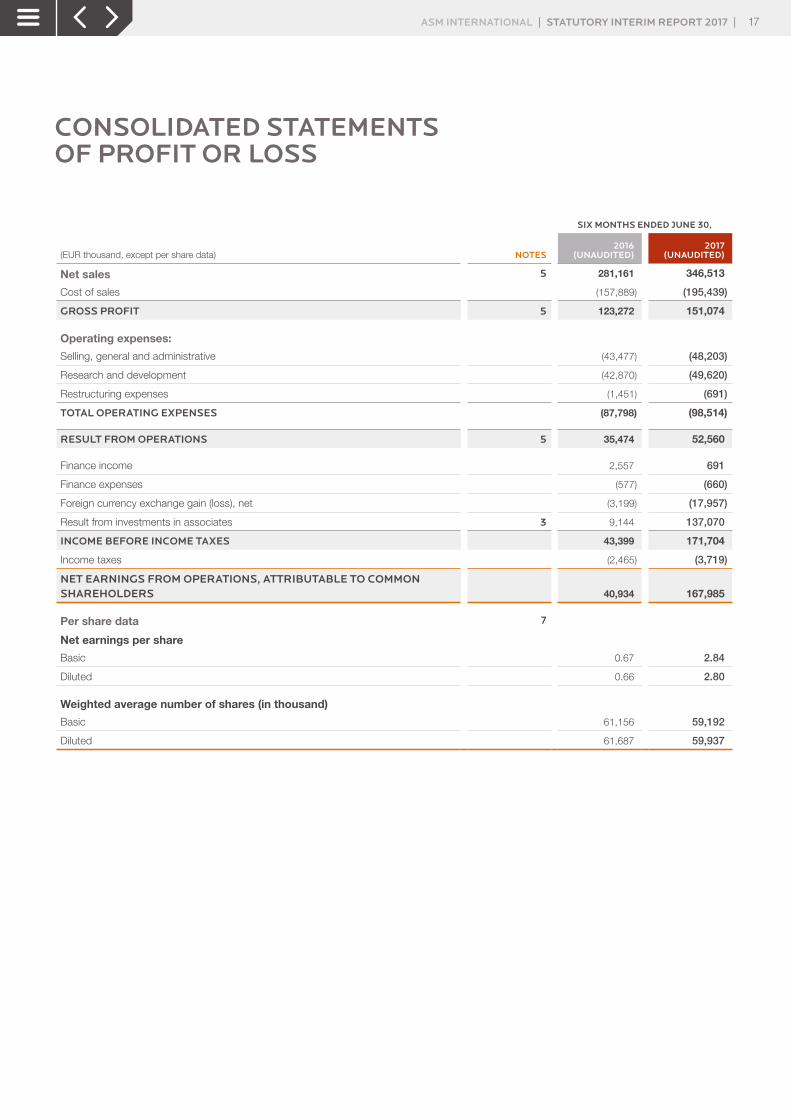
CONSOLIDATED STATEMENTS OF PROFIT OR LOSS
SIX MONTHS ENDED JUNE 30,
(EUR thousand, except per share data) NOTES2016
(UNAUDITED)2017
(UNAUDITED)
Net sales 5 281,161 346,513
Cost of sales (157,889) (195,439)
GROSS PROFIT 5 123,272 151,074
Operating expenses:
Selling, general and administrative (43,477) (48,203)
Research and development (42,870) (49,620)
Restructuring expenses (1,451) (691)
TOTAL OPERATING EXPENSES (87,798) (98,514)
RESULT FROM OPERATIONS 5 35,474 52,560
Finance income 2,557 691
Finance expenses (577) (660)
Foreign currency exchange gain (loss), net (3,199) (17,957)
Result from investments in associates 3 9,144 137,070
INCOME BEFORE INCOME TAXES 43,399 171,704
Income taxes (2,465) (3,719)
NET EARNINGS FROM OPERATIONS, ATTRIBUTABLE TO COMMON SHAREHOLDERS 40,934 167,985
Per share data 7
Net earnings per share
Basic 0.67 2.84
Diluted 0.66 2.80
Weighted average number of shares (in thousand)
Basic 61,156 59,192
Diluted 61,687 59,937
ASM INTERNATIONAL | STATUTORY INTERIM REPORT 2017 | 17

CONSOLIDATED STATEMENTS OF COMPREHENSIVE INCOME
SIX MONTHS ENDED JUNE 30,
(EUR thousand)2016
(UNAUDITED)2017
(UNAUDITED)
NET EARNINGS FROM OPERATIONS, ATTRIBUTABLE TO COMMON SHAREHOLDERS 40,934 167,985
Other comprehensive income, items that may be subsequently reclassified to profit or loss:
Realization CTA due to sale of ASMPT stake – (7,637)
Foreign currency translation effect (12,305) (106,400)
Proportionate part in other comprehensive income (loss) investments in associates 1,678 2,781
TOTAL (10,627) (111,256)
Related tax – –
TOTAL COMPREHENSIVE INCOME 30,307 56,729
ASM INTERNATIONAL | STATUTORY INTERIM REPORT 2017 | 18

CONSOLIDATED STATEMENTS OF FINANCIAL POSITION
(EUR thousand) NOTESJUNE 30, 2016 (UNAUDITED)
DECEMBER 31, 2016 (AUDITED)
JUNE 30, 2017 (UNAUDITED)
Assets
Property, plant and equipment 96,099 95,004 101,730
Goodwill 11,270 11,270 11,270
Other intangible assets 2 93,308 100,179 103,384
Investments in associates 3 1,166,865 1,235,738 1,022,451
Deferred tax assets 11,580 13,919 11,372
Other non-current assets — 4,824 4,825
Evaluation tools at customers 42,357 36,594 37,587
TOTAL NON-CURRENT ASSETS 1,421,479 1,497,528 1,292,619
Inventories 4 102,848 112,339 150,160
Accounts receivable 4 111,835 137,020 148,200
Income taxes receivable 124 370 262
Other current assets 4 17,171 22,849 27,029
Cash and cash equivalents 370,116 378,157 522,782
TOTAL CURRENT ASSETS 602,094 650,735 848,433
TOTAL ASSETS 2,023,573 2,148,263 2,141,052
EQUITY 1,906,964 2,015,856 1,975,427
Pension liabilities 828 1,418 1,200
Deferred tax liabilities 13,118 13,118 11,730
TOTAL NON-CURRENT LIABILITIES 13,946 14,536 12,930
Accounts payable 4 54,104 60,910 84,730
Provision for warranty 4 7,674 5,800 5,838
Income taxes payable 3,789 2,467 3,482
Accrued expenses and other payables 4 37,096 48,694 58,645
TOTAL CURRENT LIABILITIES 102,663 117,871 152,695
TOTAL LIABILITIES 116,609 132,407 165,625
TOTAL EQUITY AND LIABILITIES 2,023,573 2,148,263 2,141,052
ASM INTERNATIONAL | STATUTORY INTERIM REPORT 2017 | 19

CONSOLIDATED STATEMENTS OF CHANGES IN EQUITY
(EUR thousand, except share data)
NUMBER OF COMMON
SHARESCOMMON
SHARES
CAPITAL IN EXCESS OF PAR VALUE
TREASURY SHARES AT COST
RETAINED EARNINGS
OTHER RESERVES 1)
TOTAL EQUITY
BALANCE JANUARY 1, 2016 61,706,387 2,553 221,868 (84,000) 1,615,877 192,081 1,948,379
Net earnings – – – – 40,934 – 40,934
Other comprehensive income – – – – – (10,627) (10,627)
TOTAL COMPREHENSIVE INCOME – – – – 40,934 (10,627) 30,307
Dividend paid to common shareholders – – – – (37,187) – (37,187)
Compensation expenses share based payments – – 3,709 – – – 3,709
Exercise of stock options out of treasury shares 595,250 – (2,210) 20,998 (9,647) – 9,141
Purchase of common shares (1,557,106) – – (54,297) – – (54,297)Other movements in investments and associates:
Dilution – – – – 6,912 – 6,912
BALANCE JUNE 30, 2016 (UNAUDITED) 60,744,531 2,553 223,367 (117,299) 1,616,889 181,454 1,906,964
Net earnings – – – – 94,537 94,537
Other comprehensive income – – – – – 50,014 50,014
TOTAL COMPREHENSIVE INCOME – – – – 94,537 50,014 144,551
Dividend paid to common shareholders – – – – (5,486) – (5,486)
Compensation expenses share based payments – – 4,678 – – – 4,678
Exercise of stock options out of treasury shares 125,322 – (381) 6,838 (889) – 5,568
Vesting restricted shares out of treasury shares 55,041 – (1,827) 1,827 – – –
Purchase of common shares (1,109,051) – – (42,843) – – (42,843)Other movements in investments and associates:
Dilution – – – – 2,424 – 2,424
BALANCE JANUARY 1, 2017 59,815,843 2,553 225,837 (151,477) 1,707,475 231,468 2,015,856
Net earnings – – – – 167,985 – 167,985
Other comprehensive income – – – – – (111,256) (111,256)
TOTAL COMPREHENSIVE INCOME – – – – 167,985 (111,256) 56,729
Dividend paid to common shareholders – – – – (41,470) – (41,470)
Compensation expenses share based payments – – 3,626 – – – 3,626
Exercise of stock options out of treasury shares 448,190 – (1,692) 17,956 (6,083) – 10,181
Vesting restricted shares out of treasury shares 105,470 – (4,013) 4,013 – – –
Purchase of common shares (1,391,032) – – (69,495) – – (69,495)Other movements in investments and associates:
Dilution – – – – – – –
BALANCE JUNE 30, 2017 (UNAUDITED) 58,978,471 2,553 223,758 (199,003) 1,827,907 120,212 1,975,427
1 Other reserves consist of the currency translation reserve, the reserve for proportionate share in other comprehensive income investments in associates and realized CTA due to the sale of an ASMPT stake.
ASM INTERNATIONAL | STATUTORY INTERIM REPORT 2017 | 20

CONSOLIDATED STATEMENT OF CASH FLOWS
SIX MONTHS ENDED JUNE 30,
(EUR thousand)2016
(UNAUDITED)2017
(UNAUDITED)
Cash flows from operating activities
NET EARNINGS FROM OPERATIONS, ATTRIBUTABLE TO COMMON SHAREHOLDERS 40,934 167,985
Adjustments required to reconcile net earnings to net cash from operating activities:
Depreciation, amortization and impairments 23,777 25,527
Share-based compensation 3,709 3,626
Non-cash financing costs 740 (5,928)
Share in income of investments in associates (9,144) (137,070)
Income tax 2,465 3,719
Changes in other assets and liabilities:
Accounts receivable (17,638) (17,600)
Inventories (229) (51,475)
Other current assets 240 (4,817)
Accounts payable and accrued expenses (9,498) 36,328
Income tax paid (4,053) (1,087)
NET CASH PROVIDED BY OPERATING ACTIVITIES 31,303 19,208
Cash flows from investing activities
Capital expenditures, net (13,817) (23,345)
Capitalized development expenditure (13,799) (15,536)
Purchase of intangible assets (3,734) (1,503)
Dividend received from associates 7,235 18,117
Proceeds of disposal of ASMPT stake – 245,565
NET CASH (USED) PROVIDED IN INVESTING ACTIVITIES (24,115) 223,298
Cash flows from financing activities
Purchase of treasury shares ASMI (56,957) (70,443)
Proceeds from issuance of shares and exercise of stock options 10,969 10,181
Dividends paid to common shareholders of ASMI (37,187) (41,470)
Debt issuance fees paid – (133)
NET CASH USED IN FINANCING ACTIVITIES (83,175) (101,865)
FOREIGN CURRENCY TRANSLATION EFFECT ON CASH AND CASH EQUIVALENTS (812) 3,984
NET IN(DE)CREASE IN CASH AND CASH EQUIVALENTS (76,799) 144,625
Cash and cash equivalents at beginning of year 446,915 378,157
CASH AND CASH EQUIVALENTS AT BALANCE SHEET DATE 370,116 522,782
ASM INTERNATIONAL | STATUTORY INTERIM REPORT 2017 | 21

NOTES TO CONSOLIDATED CONDENSED INTERIM FINANCIAL STATEMENTS
NOTE 1. GENERAL INFORMATION / SUMMARY OF SIGNIFICANT ACCOUNTING POLICIES
GENERAL INFORMATIONASM International NV (ASMI or the Company) is a Dutch public liability company domiciled in the Netherlands with its principal operations in Europe, The United States of America and Asia. The Company dedicates its resources to the research, development, manufacturing, marketing and servicing of equipment and materials used to produce mainly semiconductor devices.
The Company’s shares are listed for trading on the Euronext Amsterdam Stock Exchange (symbol ASM).
The accompanying Consolidated financial statements include the financial statements of ASM International NV, and its consolidated subsidiaries (together referred to as ASMI or the Company).
The Consolidated condensed interim financial statements for the six months ended June 30, 2017 were authorized for issue by the Management Board on August 31, 2017.
The Consolidated condensed interim financial statements have not been audited or reviewed by an external auditor.
ACCOUNTING POLICIESThese Consolidated condensed interim financial statements have been prepared in accordance with IAS 34, Interim Financial Reporting. The Consolidated condensed interim financial statements do not include all of the information required for full annual financial statements and should be read in conjunction with ASMI’s 2016 Statutory Annual Report. In addition, the notes to these Consolidated condensed interim financial statements are presented in a condensed format. The applied accounting principles are in line with those as described in ASMI’s 2016 Statutory Annual Report and are based on IFRS as endorsed by the European Union.
No new standards and interpretations became effective as of January 1, 2017 which impact the Consolidated condensed interim financial statements.
USE OF ESTIMATES AND JUDGMENTSThe preparation of the Company’s Consolidated financial statements requires management to make judgments, estimates and assumptions that affect the amounts reported in the financial statements and accompanying notes. Actual results could differ materially from those estimates. We evaluate our estimates and underlying assumptions on an ongoing basis. We base our estimates on historical experience and on various other assumptions that are believed to be reasonable, the results of which form the basis for making judgments about the carrying values of assets and liabilities. Revisions to accounting estimates are recognized in the period in which the estimates are revised and in any future periods affected.
ASM INTERNATIONAL | STATUTORY INTERIM REPORT 2017 | 22

NOTE 2. OTHER INTANGIBLE ASSETSOther intangible assets mainly include capitalized development expenses, software developed or purchased for internal use and purchased technology from third parties. The changes in the amount of other intangible assets are as follows:
(EUR thousand)DEVELOPMENT
COSTS SOFTWARE
PURCHASED TECHNOLOGY AND
OTHER INTANGIBLE ASSETS TOTAL
BALANCE JANUARY 1, 2016 72,478 5,589 3,468 81,535
Additions 13,799 3,734 – 17,533
Amortization for the period (8,330) (282) (602) (9,214)
Foreign currency, translation effect 3,443 10 1 3,454
BALANCE JUNE 30, 2016 81,390 9,051 2,867 93,308
Additions 13,528 3,290 – 16,818
Amortization for the period (5,015) (373) (602) (5,990)
Reclassification – 21 – 21
Impairments (3,575) – – (3,575)
Foreign currency, translation effect (402) – (1) (403)
BALANCE JANUARY 1, 2017 85,926 11,989 2,264 100,179
Additions 15,536 1,445 58 17,039
Amortization for the period (7,096) (367) (341) (7,804)
Impairments (1,351) – – (1,351)
Foreign currency, translation effect (4,653) (26) – (4,679)
BALANCE JUNE 30, 2017 88,362 13,041 1,981 103,384
Impairment charges on capitalized development costs are included in operating expenses under research and development. Impairment of capitalized development expenses primarily related to development of new hardware for which the customers demand has shifted out in time, and technology which became obsolete.
Capitalized development costs are amortized over their estimated useful lives of 5 years, other intangible assets are amortized over their estimated useful lives of 3 to 7 years.
ASM INTERNATIONAL | STATUTORY INTERIM REPORT 2017 | 23

NOTE 3. INVESTMENTS IN ASSOCIATESThe changes in the investments in associates are as follows:
ASMPT
(EUR thousand) LEVITECH 1)NET EQUITY
SHARE
OTHER(IN)TANGIBLE
ASSETS AND FAIR VALUE
CHANGES GOODWILL TOTAL ASMPT TOTAL
BALANCE JANUARY 1, 2016 – 375,172 149,862 655,805 1,180,839 1,180,839
Share in net earnings of investments in associates – 22,655 – – 22,655 22,655
Other comprehensive income of investments in associates – 1,678 – – 1,678 1,678
Amortization recognized (in)tangible assets – – (13,511) – (13,511) (13,511)
Dividends – (7,235) – – (7,235) (7,235)
Dilution ASMPT share to 39.40% – 5,234 – – 5,234 5,234
Foreign currency translation effect – (6,415) (2,982) (13,398) (22,795) (22,795)
BALANCE JUNE 30, 2016 (UNAUDITED) – 391,089 133,369 642,407 1,166,865 1,166,865
Share in net earnings of investments in associates – 45,056 – – 45,056 45,056
Other comprehensive income of investments in associates – (3,022) – – (3,022) (3,022)
Amortization recognized (in)tangible assets – – (13,712) – (13,712) (13,712)
Dividends – (14,848) – – (14,848) (14,848)
Dilution ASMPT share to 39.19% – 4,102 – – 4,102 4,102
Foreign currency translation effect – 10,155 6,706 34,436 51,297 51,297
BALANCE JANUARY 1, 2017 – 432,532 126,363 676,843 1,235,738 1,235,738
Share in net earnings of investments in associates – 66,377 – – 66,377 66,377
Other comprehensive income of investments of associates – 2,781 – – 2,781 2,781
Amortization recognized (in)tangible assets – – (13,084) – (13,084) (13,084)
Sale and dilution of ASMPT stake – (58,310) (16,390) (94,725) (169,425) (169,425)
Dividends – (18,117) – – (18,117) (18,117)
Dilution ASMPT share to 34.29% – – – – – -
Foreign currency translation effect – (22,828) (8,757) (50,234) (81,819) (81,819)
BALANCE JUNE 30, 2017 (UNAUDITED) – 402,435 88,132 531,884 1,022,451 1,022,451
1 Reflects the net equity value of the interest in Levitech BV resulting from the management buy-out in 2009 of the RTP business.The value has been reduced in 2015 due to (start-up) losses of Levitech caused by the introduction of their advanced products in the market.
ASM INTERNATIONAL | STATUTORY INTERIM REPORT 2017 | 24

On March 15, 2013, the Company divested a controlling stake in its subsidiary ASM Pacific Technology Ltd (ASMPT). After the initial accounting of the sale transaction and related gains future income from ASMPT was adjusted for the fair value adjustments arising from the basis differences as if a business combination had occurred under IFRS 3R, Business Combinations, i.e. a purchase price allocation (PPA).
The purchase of the associate has been recognized at fair value, being the value of the ASMPT shares on the day of closing of the purchase transaction. The composition of this fair value was determined through a PPA. The PPA resulted in the recognition of intangible assets for customer relationship, technology, trade name, product names and goodwill. For inventories and property, plant & equipment a fair value adjustment was recognized.
The ASMPT investment is accounted for under the equity method on a go forward basis. Equity method investments are tested for prolonged impairment. An investment is considered impaired if the fair value of the investment is less than its carrying value.
If the fair value of an investment is less than its carrying value at the balance sheet date, the Company determines whether the impairment is temporary or prolonged. The amount per share recognized as per December 31, 2016 under equity accounting amounts to HK$63.14 whereas the level 1 fair value per share (being the market price of a share on the Hong Kong Stock Exchange) was HK$82.15 as per December 31, 2016. Management concluded that based on quantitative analysis no impairment of its share in ASMPT existed as per December 31, 2016.
In June 2016, 1,575,133 common shares of ASMPT (par value of HK$0.10 per share) were issued as a consequence of the conversion of HK$150 million of debt. The shares issued have diluted ASMI’s ownership in ASMPT to 39.40% as of June 30, 2016.
In December 2016, 2,139,100 common shares of ASMPT were issued, for cash at par value of HK$0.10 per share, pursuant to the Employee Share Incentive Scheme of ASMPT. The shares issued under the plan in 2016 have diluted ASMI’s ownership in ASMPT to 39.19% as of December 31, 2016.
On April 24, 2017, the Company announced the divestment of approximately 5% stake in ASMPT. The transaction was settled on April 27, 2017. The company sold 20,000,000 ordinary shares of ASMPT at a price of HK$105.00 per share to institutional or other professional investors through a partial secondary share placement, representing a 4.90% stake in ASMPT. This share placement was executed at April 25, 2017 and settled on April 27, 2017. The placement generated gross cash proceeds for the Company of HK$2,100,00,000 (approximately €248 million). The result of the sale was converted into euro using the transaction rate. The transaction rate is the actual rate for which the net proceeds were received. This rate was 0.11826. The Company maintains a share of 34.29% in ASMPT after this transaction.
At June 30, 2017, the book value of our equity method investment in ASMPT was €1,022 million. The historical cost basis of our 34.29% share of net assets on the books of ASMPT was €402 million as of June 30, 2017, resulting in a basis difference of €620 million. €88 million of this basis difference has been allocated to property, plant and equipment and intangibles assets. The remaining amount was allocated to equity method goodwill. Each individual, identifiable asset will periodically be reviewed for any indicators of potential impairment which, if required, would result in acceleration of basis difference amortization. We amortize the basis differences allocated to the assets on a straight-line basis, and include the impact within the results of our equity method investments. Amortization and depreciation are adjusted for related deferred tax impacts. Included in net income attributable to ASMI for the six months period ending June 30, 2017 was after-tax expense of €13 million, representing the depreciation and amortization of the basis differences.
ASM INTERNATIONAL | STATUTORY INTERIM REPORT 2017 | 25

Summarized 100% earnings information for ASMPT equity method investment excluding basis adjustments (foreign currency exchange rate average for 2017: 1 HK$: €0.11835 and for 2016: 1 HK$: €0.11600):
SIX MONTHS ENDED JUNE 30,
(HK$ million) 2016 2017
Net sales 6,531.3 8,185.4
Earnings before income tax 636.9 1,683.3
Net earnings 493.1 1,492.3
Summarized 100% statement of financial position information for ASMPT equity method investment excluding basis adjustments (foreign currency exchange rate as per June 30, 2017: 1 HK$: €0.11227, December 31, 2016: 1 HK$: €0.12232 and as per June 30, 2016: 1 HK$: €0.11610):
(HK$ million) JUNE 30, 2016 DECEMBER 31, 2016 JUNE 30, 2017
Current assets 11,569 11,918 13,687
Non-current assets 3,760 3,721 3,810
Current liabilities 6,337 6,237 4,645
Non-current liabilities 423 376 2,392
Equity 8,569 9,026 10,460
NOTE 4. WORKING CAPITALNet working capital is composed as follows:
(EUR thousand) JUNE 30, 2016 DECEMBER 31, 2016 JUNE 30, 2017
Inventories 102,848 112,339 150,160
Accounts receivable 111,835 137,020 148,200
Other current assets 17,171 22,849 27,029
Accounts payable (54,104) (60,910) (84,730)
Provision for warranty (7,674) (5,800) (5,838)
Accrued expenses and other payables (37,096) (48,694) (58,645)
NET WORKING CAPITAL 132,980 156,804 176,176
ASM INTERNATIONAL | STATUTORY INTERIM REPORT 2017 | 26

NOTE 5. SEGMENT DISCLOSUREThe Company organizes its activities in two operating segments, Front-end and Back-end. Operating segments are reported in a manner consistent with the internal reporting provided to the Chief Executive Officer (CEO), which is the Chief Operating Decision Maker (CODM).
The Front-end segment manufactures and sells equipment used in wafer processing, encompassing the fabrication steps in which silicon wafers are layered with semiconductor devices. The segment is a product driven organizational unit comprised of manufacturing, service, and sales operations in Europe, the United States of America, Japan, South Korea and Southeast Asia.
The Back-end segment manufactures and sells equipment and materials used in assembly and packaging, encompassing the processes in which silicon wafers are separated into individual circuits and subsequently assembled, packaged and tested. The segment is organized in ASM Pacific Technology Ltd, in which the Company holds a substantial share of 34.29% interest, whilst the remaining shares are listed on the Stock Exchange of Hong Kong. The segment’s main operations are located in Hong Kong, the People’s Republic of China, Singapore, Malaysia and Germany.
The Back-end segment remains reported as a separate segment since the cease of control per March 15, 2013. Since that date the segment is reported as an equity method investment as the CEO reviews this information as part of his CODM package.
Accordingly, the asset and result information regarding the operations that comprise the segment are disclosed. The full financial results are reviewed by the CODM, the external reporting of the segment are on an equity method investment basis. The total of all segments’ financial amounts are reconciled to the corresponding amounts reported in the Consolidated financial statements, eliminations are reflected in the reconciling column for amounts reported in excess of those amounts reflected in the Consolidated financial statements.
ASM INTERNATIONAL | STATUTORY INTERIM REPORT 2017 | 27
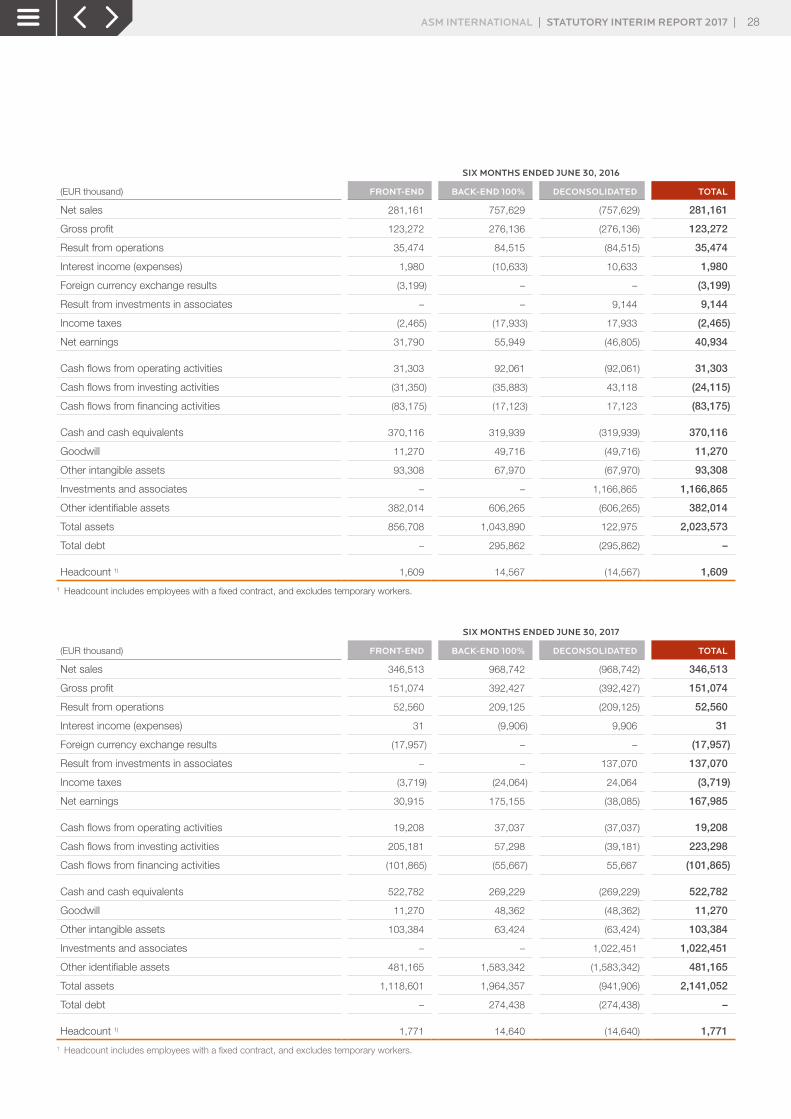
SIX MONTHS ENDED JUNE 30, 2016
(EUR thousand) FRONT-END BACK-END 100% DECONSOLIDATED TOTAL
Net sales 281,161 757,629 (757,629) 281,161
Gross profit 123,272 276,136 (276,136) 123,272
Result from operations 35,474 84,515 (84,515) 35,474
Interest income (expenses) 1,980 (10,633) 10,633 1,980
Foreign currency exchange results (3,199) – – (3,199)
Result from investments in associates – – 9,144 9,144
Income taxes (2,465) (17,933) 17,933 (2,465)
Net earnings 31,790 55,949 (46,805) 40,934
Cash flows from operating activities 31,303 92,061 (92,061) 31,303
Cash flows from investing activities (31,350) (35,883) 43,118 (24,115)
Cash flows from financing activities (83,175) (17,123) 17,123 (83,175)
Cash and cash equivalents 370,116 319,939 (319,939) 370,116
Goodwill 11,270 49,716 (49,716) 11,270
Other intangible assets 93,308 67,970 (67,970) 93,308
Investments and associates – – 1,166,865 1,166,865
Other identifiable assets 382,014 606,265 (606,265) 382,014
Total assets 856,708 1,043,890 122,975 2,023,573
Total debt – 295,862 (295,862) –
Headcount 1) 1,609 14,567 (14,567) 1,609
1 Headcount includes employees with a fixed contract, and excludes temporary workers.
SIX MONTHS ENDED JUNE 30, 2017
(EUR thousand) FRONT-END BACK-END 100% DECONSOLIDATED TOTAL
Net sales 346,513 968,742 (968,742) 346,513
Gross profit 151,074 392,427 (392,427) 151,074
Result from operations 52,560 209,125 (209,125) 52,560
Interest income (expenses) 31 (9,906) 9,906 31
Foreign currency exchange results (17,957) – – (17,957)
Result from investments in associates – – 137,070 137,070
Income taxes (3,719) (24,064) 24,064 (3,719)
Net earnings 30,915 175,155 (38,085) 167,985
Cash flows from operating activities 19,208 37,037 (37,037) 19,208
Cash flows from investing activities 205,181 57,298 (39,181) 223,298
Cash flows from financing activities (101,865) (55,667) 55,667 (101,865)
Cash and cash equivalents 522,782 269,229 (269,229) 522,782
Goodwill 11,270 48,362 (48,362) 11,270
Other intangible assets 103,384 63,424 (63,424) 103,384
Investments and associates – – 1,022,451 1,022,451
Other identifiable assets 481,165 1,583,342 (1,583,342) 481,165
Total assets 1,118,601 1,964,357 (941,906) 2,141,052
Total debt – 274,438 (274,438) –
Headcount 1) 1,771 14,640 (14,640) 1,771
1 Headcount includes employees with a fixed contract, and excludes temporary workers.
ASM INTERNATIONAL | STATUTORY INTERIM REPORT 2017 | 28
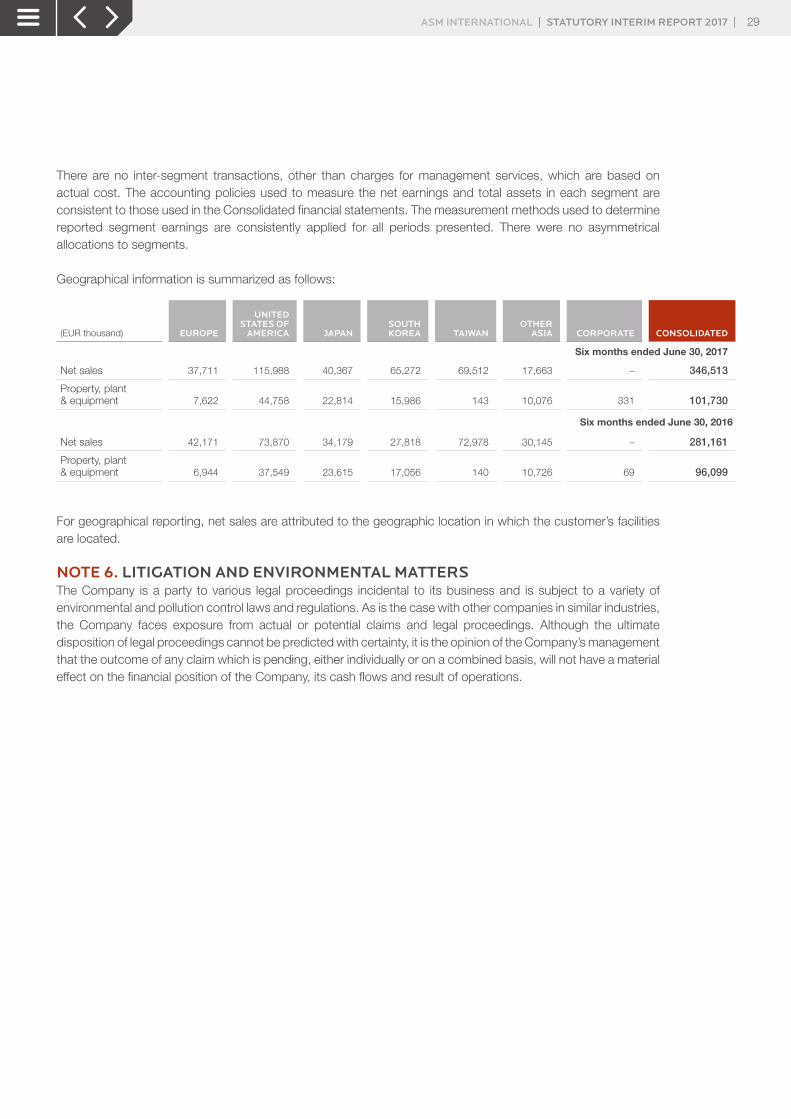
There are no inter-segment transactions, other than charges for management services, which are based on actual cost. The accounting policies used to measure the net earnings and total assets in each segment are consistent to those used in the Consolidated financial statements. The measurement methods used to determine reported segment earnings are consistently applied for all periods presented. There were no asymmetrical allocations to segments.
Geographical information is summarized as follows:
(EUR thousand) EUROPE
UNITED STATES OF
AMERICA JAPANSOUTH KOREA TAIWAN
OTHER ASIA CORPORATE CONSOLIDATED
Six months ended June 30, 2017
Net sales 37,711 115,988 40,367 65,272 69,512 17,663 – 346,513
Property, plant & equipment 7,622 44,758 22,814 15,986 143 10,076 331 101,730
Six months ended June 30, 2016
Net sales 42,171 73,870 34,179 27,818 72,978 30,145 – 281,161
Property, plant & equipment 6,944 37,549 23,615 17,056 140 10,726 69 96,099
For geographical reporting, net sales are attributed to the geographic location in which the customer’s facilities are located.
NOTE 6. LITIGATION AND ENVIRONMENTAL MATTERSThe Company is a party to various legal proceedings incidental to its business and is subject to a variety of environmental and pollution control laws and regulations. As is the case with other companies in similar industries, the Company faces exposure from actual or potential claims and legal proceedings. Although the ultimate disposition of legal proceedings cannot be predicted with certainty, it is the opinion of the Company’s management that the outcome of any claim which is pending, either individually or on a combined basis, will not have a material effect on the financial position of the Company, its cash flows and result of operations.
ASM INTERNATIONAL | STATUTORY INTERIM REPORT 2017 | 29

NOTE 7. EARNINGS PER SHAREBasic net earnings per common share is calculated by dividing net earnings attributable to common shareholders by the weighted average number of common shares outstanding for that period. The dilutive effect is calculated using the treasury stock method. The calculation of diluted net earnings per share assumes the exercise of options issued under our stock option plans (and the issuance of shares under our share plans) for periods in which exercised (or issuances) would have a dilutive effect.The calculation of diluted net earnings per share does not assume exercise of options (or issuance of shares) when such exercises (or issuances) would be anti-dilutive.
The calculation of basic and diluted net earnings per share attributable to common shareholders is based on the following data:
JUNE 30,
2016 2017
Net earnings used for purposes of calculating net income per common share
NET EARNINGS FROM OPERATIONS 40,934 167,985
Basic weighted average number of shares outstanding during the year (thousands) 61,156 59,192
Effect of dilutive potential common shares from stock options and restricted shares 531 745
DILUTIVE WEIGHTED AVERAGE NUMBER OF SHARES OUTSTANDING 61,687 59,937
Basic net earnings per share:
from operations 0.67 2.84
Diluted net earnings per share:
from operations 0.66 2.80
NOTE 8. RELATED PARTY TRANSACTIONSThe Company has a related party relationship with its subsidiaries, equity accounted investees and members of the Supervisory Board and the Management Board. Related party transactions are conducted on an at arm’s length basis with terms comparable to transactions with third parties.
The Group has no other significant transactions or outstanding balances with its equity-accounted investees other than its equity-interest holdings.
There have been no significant related party transactions or changes in related party transactions described in ASMI’s 2016 Statutory Annual Report that could have a material effect on the financial position or performance of the Company in the first six months of the 2017 financial year.
ASM INTERNATIONAL | STATUTORY INTERIM REPORT 2017 | 30
In addition to historical information, some of the information posted or referenced on this website contains statements relating to our future business and/or results, including, among others, statements regarding future revenue, sales, income, expenditures, sufficiency of cash generated from operations, maintenance of interest in ASM Pacific Technology Ltd, business strategy, product development, product acceptance, market penetration, market demand, return on investment in new products, facility completion dates and product shipment dates, corporate transactions, restructurings, liquidity and financing matters, outlooks, and any other non-historical information. These statements include certain projections and business trends, which are ‘forward-looking’. We caution readers that no forward-looking statement is a guarantee of future performance and that actual results could differ materially from those contained in the forward-looking statements.
You can identify forward looking statements by the use of words like ‘may’, ‘could’, ‘should’, ‘project’, ‘believe’, ‘anticipate’, ‘expect’, ‘plan’, ‘estimate’, ‘forecast’, ‘potential’, ‘intend’, ‘continue’, and variations of these words or comparable words.
Forward-looking statements do not guarantee future performance and involve risks and uncertainties. You should be aware that our actual results may differ materially from those contained in the forward-looking statements as a result of certain risks and uncertainties. These risks and uncertainties include, but are not limited to, economic conditions and trends in the semiconductor industry and the duration of industry downturns, currency fluctuations, the timing of significant orders, market acceptance of new products, competitive factors, litigation involving intellectual property, shareholder or other issues, commercial and economic disruption due to natural disasters, terrorist activity, armed conflict or political instability, epidemics and other risks indicated in our most recently filed Statutory Annual Report and other filings from time to time. The risks described are not the only ones. Some risks are not yet known and some that we do not currently believe to be material could later become material. Each of these risks could materially affect our business, revenues, income, assets, liquidity, and capital resources. All statements are made as of the date of posting unless otherwise noted, and we assume no obligation to update or revise any forward-looking statements to reflect future developments or circumstances.
SAFE HARBOR STATEMENT
ASM INTERNATIONAL | STATUTORY INTERIM REPORT 2017 | 31
