asse 2012 ptd paper v final prevention through design
TRANSCRIPT

7/29/2019 ASSE 2012 PtD Paper v Final Prevention Through Design
http://slidepdf.com/reader/full/asse-2012-ptd-paper-v-final-prevention-through-design 1/14
1
Session No. 703
Prevention through Design (PtD): Combining Risk Assessment,
Productivity and Sustainability
Georgi Popov, PhD, QEP, CMC.
Associate Professor
University of Central Missouri
Warrensburg, MO
John N. Zey, CIH, EdD.
Professor
University of Central Missouri
Warrensburg, MO
Introduction
Prevention through Design (PtD) addresses occupational safety and health needs in the designand redesign processes to prevent or minimize the work-related hazards and risks associated withthe construction, manufacture, use, maintenance, and disposal of facilities, materials, equipment,and the service sector. One of the goals is to educate designers, engineers, machinery andequipment manufacturers, environmental, health and safety (EHS) professionals, businessleaders, and workers to understand and implement PtD methods and apply this knowledge andskills to the design and re-design of new and existing facilities, processes, equipment, tools, andorganization of work.
One of the many challenges EHS professionals are facing is developing skills to convincemanagement to maximize the effectiveness of the safety program and consequently increaseproductivity. EHS professionals have to help management transform safety into an acceptedbusiness value for the organization. In order to be successful, the EHS students and professionalshave to learn to use the PtD principles and incorporate them into standard business practices. Amajor hurdle to the adoption of PtD is the perception that the PtD cost/benefit ratio isunfavorable. EHS professionals should recognize business cost drivers and justify PtD design

7/29/2019 ASSE 2012 PtD Paper v Final Prevention Through Design
http://slidepdf.com/reader/full/asse-2012-ptd-paper-v-final-prevention-through-design 2/14
2
expenditures in the early product development stage. Therefore, the authors developed a PtDmodel that incorporates risk assessment, hierarchy of controls, productivity, financial analysisand future state projections. To demonstrate the applicability of the model; the authors selected acase study that was suitable for practical demonstration and for use as an educational module. AValue-added project for refuse trucks improvements is presented. In the model PtD principles werecombined with risk assessment tools, productivity evaluation and sustainability. This case studydemonstrates how EHS professionals can play a significant role in the development of new business plansand implementation of Lean Six Sigma practices, designed to minimize injuries and improve productivity.
History of PtD
Prevention through design is not a new concept and as with many worthwhile endeavors has roots in thework of several previous individuals and organizations (Manuele, 2007, ANSI/SIHA, 2005). The work of Edward Demming via his total quality management process certainly provided foundationalunderpinnings for PtD (Manuele, 2008, Deming, 1982). Deming gives credit to others for the TQMprocess and thus the circle continues to turn and involve many participants. ASSE published a positionpaper on Designing for Safety, in the 1990s (1994). NIOSH gave the PtD movement a boast via a variety
of meeting and publications, starting in the 1990s. In late 2010, NIOSH released its PtD plan (2010).ASSE and AIHA has also provided significant support for PtD. ASSE is the Secretariat for the recentlypublished ANZI PtD standard.
PtD has been gaining momentum for the past several years as evidenced by the inclusion of PtD in currentoccupational safety and health textbooks (Blunt, Zey, Greife, Rose, 2011). The authors believe this trendwill continue for the foreseeable future. This idea is also supported by recent publications (Manuele,2008, Manuele, ND).
Project Description
Trash collection requires significant amount of repetitive movements. Musculoskeletal Disorders (MSD’s)
including lower back, and Carpal Tunnel Syndrome (CTS) injuries were recognized as a main concern forbusiness continuity and sustainability of the company. Human Resources (HR) reported difficulties in
hiring new employees and the organization had experienced a high turnover rate. In today’s global
economy the management had to take the necessary steps to reduce ergonomic injuries and improve
productivity. This study demonstrated potential savings an organization can realize from PtD
implementation. The purchase of new refuse trucks had to be justified. The organization formed a safety
and risk management team and prepared a business case for the investment. The team had to identify
priorities and developed a project model. PtD was identified as a key component of the project. The main
requirement was that the new refuse trucks were to be designed in a way to eliminate or minimize
ergonomics injuries. Our recommendation was to utilize PtD, Lean and Six Sigma tools to perform
current state of the art risk assessment and develop intervention priorities. PtD and Failure Mode and
Effects Analysis (FMEA) tools may also be used to develop future state projections for reduced risk.
Productivity gains may be evaluated utilizing common LEAN tools. Project Cycle Efficiency (PCE)
could be calculated for current state productivity and future state projections. Value Stream Mapping
(VSM) was used to evaluate current state vs. future state process.
A new tool for business investment analysis was developed for the project. Different solutions
were evaluated and prioritized. The Excel-based tool helped EHS professionals involved in the project
7/29/2019 ASSE 2012 PtD Paper v Final Prevention Through Design
http://slidepdf.com/reader/full/asse-2012-ptd-paper-v-final-prevention-through-design 3/14
3
and the team to compare total annual incidence cost before the improvements/intervention; total annual
incidences cost after the improvements/intervention, and calculate incident benefit and cost savings. The
EHS professionals next calculated the Return on Safety, Health and Environmental Investments (ROSHEI)
by simply adding net savings, new revenue (generated from increased productivity), and other benefits
(maintenance, fuel savings, insurance, etc). Net Present Value (NPV) and the payback period for the
safety investment were also calculated. Return on investment (ROI) was calculated next and is displayedas a numerical value as well as percentage. Internal Rate of Return (IRR) is another business term and is
usually considered a simplified alternative to NPV. The tool calculates and displays IRR as a percentage.
Based on our experience, we found that business managers would prefer to see comparisons of different
proposals rather than a single solution. Therefore, a worksheet to compare four different proposals was
developed. NPV’s for the different proposals are compared and displayed as a numerical value, while
IRR’s and ROI’s for all proposals/solutions are displayed as a percentage. To satisfy the new expectations
and gain support for EHS improvements, the team had to complete a cost – benefit analysis for mitigating
potential hazards.
Business analysis revealed a payback period of a little more than four years. IRR was only 12%.
The management of the organization requested non-financial benefits to be included in the model forcomplete evaluation. The organization requested assistance from a team of UCM students to evaluate theexisting truck emissions and compare them to the new trucks emissions. The new trucks run onCompressed Natural Gas (CNG) and the existing trucks use diesel fuel. Particulate matter (PM 2.5 andPM 10), NO2, SO2, O3, and CO levels were evaluated. In addition, VOC’s levels were also compared.
The management was not fully convinced based on the safety aspects alone. Therefore, gains in
productivity and non financial benefits had to be included. “Projecting a green image” and reduced air
pollutants emissions played a substantial part in the decision making process.
Methods
A new decision making model was developed to improve the refuse collection process. This researchidentified potential areas for EHS professional involvement in the decision making process. The authors
developed a new PtD model that incorporates risk assessment, hierarchy of controls, productivity,
financial analysis and future state projections. The model follows Define, Measure, Analyze, Improve,
and Control (DMAIC) logic. Separate tools were developed for each phase. For instance, Delphi,
brainstorming and Preliminary Hazard Analysis may be used in the “Define” phase. Modified Bow Tie,
Risk Assessment matrix, and Failure Mode Effect Analysis (FMEA) may be used in the “Measure” phase.
(Popov, 2011).
The FMEA tool was used to prioritize the hazards and modify the procedure to demonstrate and
quantify the risk reduction after the proposed EHS intervention. Several other tools were used during this
evaluation, such as VSM, PCE and Pareto 80/20 analysis. Next, adjustments were made and theimprovements were evaluated utilizing Lean Six Sigma tools.
Air pollutants levels were evaluated for the current diesel trucks and were compared to the new
CNG trucks. The emissions were evaluated utilizing direct reading instruments.

7/29/2019 ASSE 2012 PtD Paper v Final Prevention Through Design
http://slidepdf.com/reader/full/asse-2012-ptd-paper-v-final-prevention-through-design 4/14
4
To demonstrate the applicability of the newly developed PtD model, the authors present the
following case study. Due to confidentiality agreements, the team members and company name can’t be
shared.
Case Study
The refuse collection companies that still use manual trash collection technique usually have very high
musculoskeletal disorders (MSD) injury rate. That results in high turnover rate, high absenteeism rate and
significant financial losses for the company. Therefore, a value added business plan for replacement of
old refuse trucks with new automated trucks had to be developed. EHS professionals may be hired to
coordinate and manage the process to convince various levels of management, that such significant
investment is justified.
Ergonomics risk assessment was completed utilizing PtD and Six Sigma tools. High priority areas
for improvements had to be evaluated first. The study included initial cost-benefit analysis. Gross Cost
Savings from Environmental, Health, and Safety (EHS) interventions were calculated. NPV, Payback
Period, simple ROI and IRR calculations from EHS interventions were included in the study. A
worksheet to compare proposals and interventions benefits was developed.
The main purpose of the project was to demonstrate the benefits of automated refuse collection
trucks vs. conventional refuse collection trucks that are currently in use (Fig. 1).
Fig. 1. Refuse collection trucks
Conventional refuse collection trucks >>>>>>> Automated refuse collection trucks
To understand the process and develop possible intervention plan, simple digital images were
used. However, the authors had to develop a comprehensive management plan that would lead to
complete analysis of the process and convince the management of the benefits of investing in new trucks.
The team members observed the process and recorded the time required for each step. The steps are
presented below.
Step 1. Position the truck.
Step 2. Lift two polyethylene bags.
7/29/2019 ASSE 2012 PtD Paper v Final Prevention Through Design
http://slidepdf.com/reader/full/asse-2012-ptd-paper-v-final-prevention-through-design 5/14
5
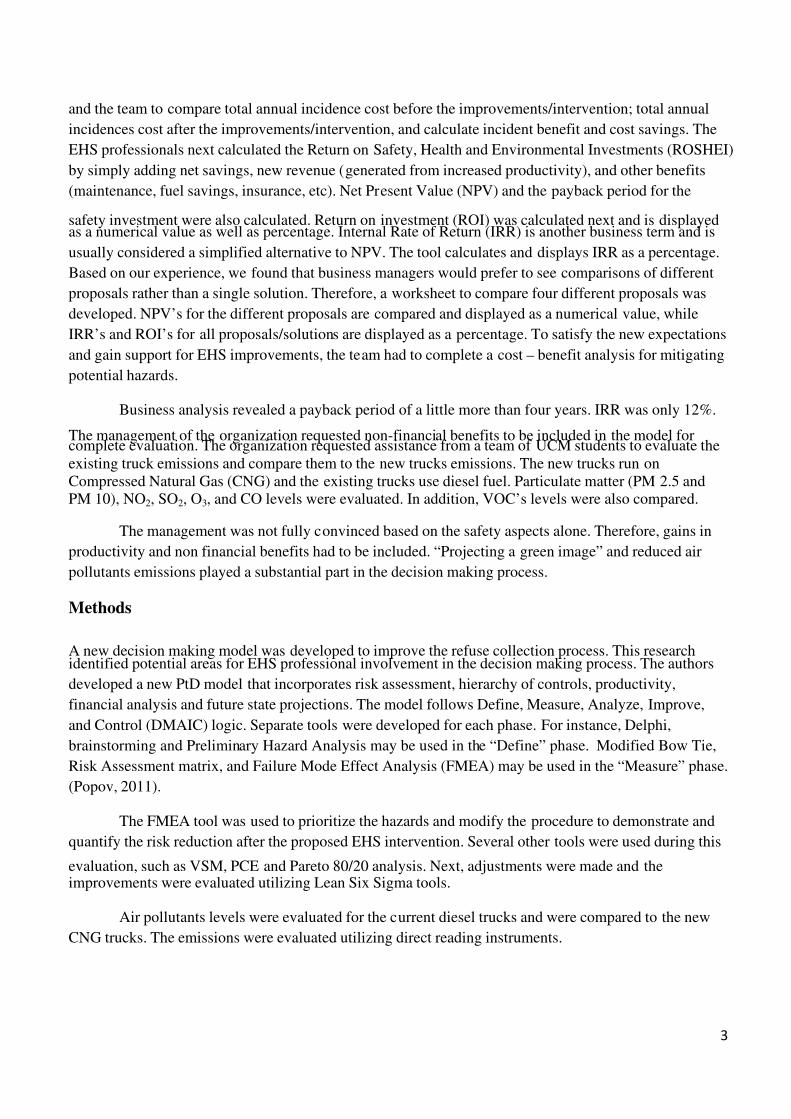
Step 3. Dump the bags.
Step 4. Repeat steps 2 and 3 lifting and dumping two more bags. Four poly bags are allowed per
household.
Step 5. Compress the trash.
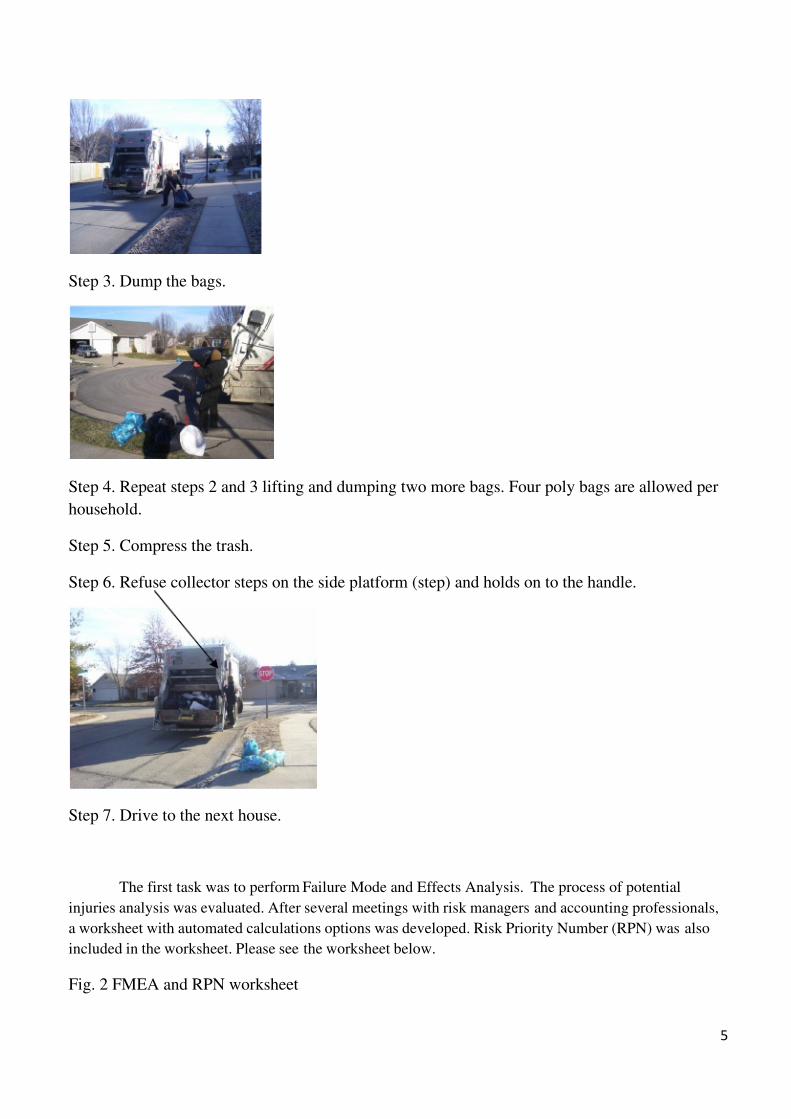
Step 6. Refuse collector steps on the side platform (step) and holds on to the handle.
Step 7. Drive to the next house.
The first task was to perform Failure Mode and Effects Analysis. The process of potential
injuries analysis was evaluated. After several meetings with risk managers and accounting professionals,
a worksheet with automated calculations options was developed. Risk Priority Number (RPN) was also
included in the worksheet. Please see the worksheet below.
Fig. 2 FMEA and RPN worksheet

7/29/2019 ASSE 2012 PtD Paper v Final Prevention Through Design
http://slidepdf.com/reader/full/asse-2012-ptd-paper-v-final-prevention-through-design 6/14
6
FMEA analysis shows high potential for back and shoulder injuries. Risk Priority Number was
the highest for trash bags pick. In addition to the injuries, MSD’s resulted in $ 49,822 workers
compensation cost per year. The financial expenses were clearly communicated to the risk manager. The
next task was to collect data and compare the Return on Investment (cost-benefit) analysis (Figure 3).
Fig. 3 ROI worksheet

7/29/2019 ASSE 2012 PtD Paper v Final Prevention Through Design
http://slidepdf.com/reader/full/asse-2012-ptd-paper-v-final-prevention-through-design 7/14
7
The worksheet was developed specifically for this project. However, it could be used for other
projects as well. The form is a comprehensive analysis of different categories and the financial impact of
each category. Some of the categories are easily quantifiable. For instance, workers compensation cost
was obtained from the accounting department. Annual salaries and benefits were also obtained from the
accounting department. Fuel and maintenance cost was obtained from the maintenance department.
Experience Modification Rating (EMR) measures worker compensation claims. Maintained exclusivelyby the insurance industry, EMR is the objective measurement of each employer’s claims experience. The
published manual rate for each state is multiplied by the employer’s EMR to determine the premium rate
paid by the employer. An EMR below 1.00 indicates that the employer will pay premiums below the
manual rate. The company was approaching an EMR of 1.00 and it was vitally important to lower the rate
to avoid increased insurance premiums. Due to confidentiality concerns, EMR impact was not disclosed
and could not be included in the calculations. Cost to hire new employees was not disclosed by the client.
Therefore, it was not included in the calculations.
The financial analysis shows that the project is not beneficial after the first year. Therefore, more detailed
financial analysis was requested. Three and five year’s NPV was calculated (Figure 4).
Fig. 4 NPV calculations
The analysis clearly shows that NPV is negative after three years, but after five years we can expect some
benefits. Therefore, the Pay Back period had to be calculated precisely (Figure 5).

7/29/2019 ASSE 2012 PtD Paper v Final Prevention Through Design
http://slidepdf.com/reader/full/asse-2012-ptd-paper-v-final-prevention-through-design 8/14
8
Fig. 5 Payback period calculations
Next, complete financial analysis was requested by the client. Following two meetings with
various levels of the company management, a worksheet was developed to calculate and capture financial
benefits of the project. Typical business tools and statistics were used to develop the worksheet (Figure 6).

7/29/2019 ASSE 2012 PtD Paper v Final Prevention Through Design
http://slidepdf.com/reader/full/asse-2012-ptd-paper-v-final-prevention-through-design 9/14
9
Fig. 6 Financial analysis
An interest rate of 7% was requested by the client. This is not a realistic interest rate at the moment.
However, conservative estimates were required for this project. The worksheet and the built in formulas
allow for interest rate adjustments. The worksheet also includes IRR calculations. The IRR is a rate of
return used in capital budgeting to measure and compare the profitability of investments. The IRR
calculated to 12%. For some companies IRR below 12% is not acceptable.
The payback period of 4.1 years was still not acceptable for the business managers. In order to capture
other benefits and convince the management, a new LEAN Six Sigma tool had to be developed and the
authors had to observe and measure productivity efficiency. Current state Project Cycle Efficiency (PCE)
was evaluated and compared to future state PCE. A combination of Six Sigma “Suppliers, inputs, process,
outputs, customers” (SIPOC) and LEAN Value Stream Mapping tools were utilized to present the
benefits of the project (Figure 7).

7/29/2019 ASSE 2012 PtD Paper v Final Prevention Through Design
http://slidepdf.com/reader/full/asse-2012-ptd-paper-v-final-prevention-through-design 10/14
10
Fig. 7 Current state SIPOC and PCE
A typical Fish bone diagram was used to present VSM. It is easy to understand and a relatively simpletool to use.
However, it was noticed that the project may have non-financial benefits as well. A concern existed for
emissions from the garbage trucks. Therefore, two students measured the emissions from the diesel
trucks. Another company that already implemented automated Compressed Natural Gas (CNG) trucks
was kind enough to let us sample the CNG emissions. Diesel emissions were higher in all categories for
the older type truck, that we were able to measure. Figure 8 provides the airborne data and comparisons
for both types of trucks.
Figure 8. Air pollution – Sustainability

7/29/2019 ASSE 2012 PtD Paper v Final Prevention Through Design
http://slidepdf.com/reader/full/asse-2012-ptd-paper-v-final-prevention-through-design 11/14
11
Results Process improvements were evaluated utilizing Lean Six Sigma tools and modified risk
assessment methodologies. The same SIPOC and PCE worksheet was used to evaluate futurestate improvements and process efficiency.
Future state SIPOC and PCE worksheets are presented in Figure 9.
Fig. 9 Future state SIPOC
Utilization of PtD, FMEA and Risk Assessment processes and the implementation of a new model are
estimated to significantly reduce the ergonomics injuries and reduce the probability of fall hazards. PCE
was improved from 17.41% to 47.50% due to the implementation of Lean practices. Possible EHS
involvement in the process was evaluated. Based on the comparison calculations, PCE increased from
17.41% to 47.5%.
Additionally, Residual Risk Reduction (R3TM) was calculated. EHS improvements resulted in 62.50% risk
reduction. (R3TM evaluation tool). Figure 10 presents current state vs. future state risk factor comparison.

7/29/2019 ASSE 2012 PtD Paper v Final Prevention Through Design
http://slidepdf.com/reader/full/asse-2012-ptd-paper-v-final-prevention-through-design 12/14
Figure 10 Current state vs. future st
Residual Risk
Hazards R
Back Injury
Back/Shoulder/Neck Injury
Slips/Trips/Falls
Total
% Reduction
R3R3=(RF CS-RF FS)/RF C
Figure 11 visualizes risk factor redu
future state risk factors.
Color codes could be used to pre(5x5) composite of the matrix thand their combinations are expresuggested in the standard, numercolor code is red. Numerical valModerate risk is from 6 – 9 andhighlighted in green. The sugges
0
5
10
15
Risk Factor CS vs.
ate risk factor comparison.
Reduction (R3™)
isk Factor CS Risk Factor FS
12 3
8 3
4 3
24 9
0.375 37.50%
0.625 62.50%S*100 % 62.5
ction and comparison of current state risk assessme
sent estimated risk reduction. The authors optet include numerical values for probability and
ssed as numerical risk scorings (ANSI/ASSE, 2ical values of 15 or higher suggests very high ries of 10 to 14 suggest high risk and are highligighlighted in yellow and low risk is under 1 to
ted EHS project is estimated to reduce all high
Risk Factor CS
Risk Factor FS
. FS
12
t vs. estimated
to use a PtDeverity levels011). Assk, therefore theted in orange.
5 and it isnd moderate

7/29/2019 ASSE 2012 PtD Paper v Final Prevention Through Design
http://slidepdf.com/reader/full/asse-2012-ptd-paper-v-final-prevention-through-design 13/14
13
risk ratings to low risk. Therefore, the chart visualizes significant risk reduction in all evaluatedcategories.
Conclusions
EHS professionals could play a significant role in the development of new business plans andimplementation of Lean Six Sigma practices designed to minimize injuries, improve productivity
and reduce waste time. PCE for this process was improved significantly and was made safer due
to input from the EHS professional and involvement of a team of students. The project led to a
decision by management to buy new safer refuse trucks, which presents opportunities to reduce
injuries, reduce emissions and improve productivity.
It was concluded that Risk Management, LEAN Six Sigma tools and financial analysis
could be used successfully to develop and present business case for Environmental, Health, and
Safety interventions.
Lessons learned
EHS professionals have to develop management skills and diversify their knowledge to
overcome difficulties during such projects. After the initial analysis, it became clear that
significant investment projects can’t not be easily justified based on risk assessment alone.
Future leaders in the safety profession will have to develop statistical skills and demonstrate
knowledge in financial management. In order to defend such projects, EHS professionals have to
be familiar with variety of risk management techniques, LEAN Six Sigma tools and financial
management principles. Being an expert in ergonomics is not enough to complete successful
complex projects. Complex projects require multi-disciplinary knowledge and cross-disciplines
management skills. Safety leaders have to become familiar with different organizational
structures and the variety of stakeholders interests to complete such projects. EHS professionals
have to be prepared to deal with various levels of the organizational management and
demonstrate competencies.
Bibliography
ANSI/AIHA. (2005). Occupational health and safety management systems (ANSI/Z10-2005). Fairfax,VA: Authors.
ASNI/ASSE. (2011). Prevention through Design Guidelines for Addressing OccupationalHazards and Risks in Design and Redesign Processes.(ANSI/ASSE Z590.3-2011). Des
Plaines, IL: Author. Available at:http://webstore.ansi.org/RecordDetail.aspx?sku=ANSI%2FASSE+Z590.3-2011
ASSE. (1994). Position paper on designing for safety. Des Plaines, IL: Author.

7/29/2019 ASSE 2012 PtD Paper v Final Prevention Through Design
http://slidepdf.com/reader/full/asse-2012-ptd-paper-v-final-prevention-through-design 14/14
14
Blunt, LA, Zey, JN, Greife L, Rose V. (2011). History and Philosophy of Industrial Hygiene. In: TheOccupational Environment: Its Evaluation, Control and Management. 3rd Ed AIHA. D. Anna Ed.
Deming, W. E.. (1982). Out of Crisis. Cambridge, MA: Massachusetts Institute of Technology forAdvanced Engineering Study.
Manuele, F.A. (2008). Advanced Safety Management: Focusing on Z10 and Serious Injury Prevention.John Wiley & Sons, Inc. Hoboken, NJ.
Manuele, F.A. (2008) Prevention Through Design: Addressing Occupational Risks in the Design and
Redesign Processes. ASSE Academic Practices Specialty Specialty. October, 2008.
Manuele, F.A. (2007) Prevention through Design: Addressing Occupational Risks in the Design &
Redesign Processes. A Special Issue of By Design. ASSE’s Engineering Practice Specialty.
October, 2008.
National Institute for Occupational Safety and Health (NIOSH). (2010). NIOSH releases Prevention
Through Design (PtD) Plan: Transformative Goals, Strategies for Job Safety and Health.
Popov, G. PtD.(2011). Model 2.0. Faculty Research. University of Central Missouri. Available athttp://centralspace.ucmo.edu/xmlui/handle/10768/85.
Liberty Mutual Residual Risk Reduction (R3TM) evaluation tool. Available at:http://www.libertymutualgroup.com/omapps/ContentServer?pagename=LMGroup/Views/LMG&ft=5&fid=1240002267026&ln=en