assessing coastal vulnerability to storm surge and wave impacts with projected sea...
TRANSCRIPT

Assessing Coastal Vulnerability to Storm Surge and Wave Impacts with Projected Sea-
Level Rise within the Salish Sea
Thesis Proposal for the Masters of Science Degree
Department of Geology
Western Washington University
Bellingham, Washington
Nate VanArendonk
June, 2017
Approved by Advisory Committee Members:
___________________________________________________________
Dr. Eric Grossman, Thesis Committee Chair
___________________________________________________________
Dr. Robert Mitchell, Thesis Committee Member
___________________________________________________________
Dr. Brady Foreman, Thesis Committee Member

1
1. Problem Statement
The Salish Sea provides habitat to valued shellfish populations, endangered salmon species,
and large municipalities such as Tacoma, Seattle and Vancouver, BC. It is anticipated that by
the years 2070 to 2099, sea levels will rise in the Salish Sea one to four feet (NAS, 2012). Yet, a
lack of knowledge exists surrounding the combined influence and impacts of expected changes
in storm surge, waves, and related nearshore processes from climate change and sea level rise
(SLR), especially in protected embayments and estuaries. In order to ensure regional
sustainability, an increased understanding of how the coastline and waterways of Puget Sound
will respond to these changes is necessary. As a first step towards accomplishing this, my
research project will perform an assessment on the extent that coastal storms and wave impacts
within Puget Sound will change with SLR. I propose to implement hydrodynamic modeling to
assess spatial and temporal changes in wave amplitude and energy and evaluate the potential
impacts to shoreline environments across Puget Sound. In order to gauge variations in future
wave energy, I will use the hydrodynamic modeling software Delft 3D/XBeach to examine wave
generation and propagation throughout the Salish Sea (Figure 1). I will also characterize
historical variability of weather data, extreme events, and the spatial variability in wave energy
along shorelines today with the ultimate goal of assessing how storm and wave impacts will vary
under different SLR scenarios in the future. Outcomes from my research will inform decision
makers in mitigating undesired effects of a changing coastal environment.
2. Introduction
Within the Salish Sea, anticipated SLR of one to four feet by 2100 poses a serious threat to
coastal lands, ecosystems for salmon and shellfish, nationally important agriculture, and industry
and infrastructure crucial to human well-being (NAS, 2012). Assessments around the open-ocean
coasts of the US suggest that nearshore wave energy will increase exponentially as sea levels
rise. This will result in today’s 100-year coastal storm becoming a 10-yr event with one foot of
sea level rise and a 1-yr event with two feet of sea level rise (Tebaldi et al, 2012). As ocean
levels steadily increase, coastlines are expected to migrate landward in response to higher wave
energy interacting with the shoreline. This amplified wave energy will create costly problems
such as an increase in coastal erosion, wetland loss, flooding, and saltwater intrusion into
freshwater aquifers (Ranasinghe et al., 2012). The influence of changing fluvial processes and
sediment dynamics are less certain but are likely to compound the complexity of forecasting
future coastal adjustment.
The Puget Sound portion of the Salish Sea has more than 8,000 square kilometers of marine
waters and 4,020 kilometers of shoreline that are susceptible to wave generated impacts (NAS,
2012). Therefore, the need to accurately model and assess changes in wave energy is critical to
improving and planning for the safety and sustainability of coastal communities. In addition,
significant investments in ecosystem restoration are being made to recover salmon, shellfish and
diverse valued ecosystem components (Puget Sound Partnership, Action Agenda -
http://www.psp.wa.gov/action_agenda_center.php). Evaluating their resilience and potential
benefits to reducing impacts associated with coastal flooding hazards are important to
prioritizing efforts, enhancing success, and are being mandated as part of the EPA National
Estuary Program funding for recovery.

2
In Puget Sound, a few studies (FEMA; FEMA, 2004; FEMA, 2015; Finlayson, 2006)
addressing wave energy and flood risks have attempted to model and understand impacts for
various counties and sites of interest. While these studies provide the context necessary for
designating coastal flood zones and assessing impacts on a site specific basis, they lack a
temporal component; Puget Sound has yet to have a systematic evaluation of the temporal and
spatial variability in wave energy today and how it will change in the future. I am proposing to
perform this level of assessment as part of the NOAA Regional Resiliency Grant titled
Washington Coastal Resilience Project. The Washington Coastal Resilience Project aims to
increase the knowledge surrounding coastal vulnerability throughout Puget Sound and evaluate
opportunities to enhance policy needed to achieve regional resilience under projected changes in
coastal climate. My work will address two main goals of this grant: 1) improve the
understanding of coastal hazards stemming from storm surge and waves, 2) enhance resiliency in
coastal communities through pilot studies.
To accomplish these goals and develop tools needed by policy makers (Brown et al., 2016), I
propose to use the open source modeling software Delft 3D to simulate wave generation and
impacts for the range of extreme conditions observed historically in conjunction with future SLR
projections across Puget Sound. Model simulations will include forcing by tides, sea-level rise,
storm surge (inverse barometer effect) and storm winds to predict the temporal and spatial
variability of total water levels, wave heights and wave energy approaching the shore. Across
the region, I plan to conduct a few case studies to examine likely impacts at spatial scales
important to addressing planning and adaptation. These results will be used to identify areas
across Puget Sound that will be susceptible to flooding and wave impacts for various storm
regimes (e.g., 1 year, 10 year, etc), characterize the extent, magnitude and frequency that
flooding will change relative to current conditions, and inform decision makers where protection
and restoration efforts may be more resilient. Throughout the following sections, I will provide
important information regarding climate change, climate predictions for the Pacific Northwest,
previous work, and the modeling tools I propose to accomplish my research goal.
3. Background
3.1 Projections of Pacific Northwest Climate Change
Earth’s Climate System
As atmospheric concentrations of greenhouse gasses (CO2, CH4, water vapor, etc.)
increase, the amount of outgoing radiation from the Earth is affected. These long wave
absorbers limit radiation traveling in to space which increases the temperature of the Earth
(greenhouse effect; Vardavas et al., 2011). General Circulation Models (GCMs) provide a way
for assessing this transfer of energy between the Earth and the Sun such that they simulate, with
some uncertainty, the processes (Sun, atmosphere, hydrosphere, biosphere, and cryosphere) that
govern the Earth’s radiative energy budget (Kiehl & Trenberth, 1997 & Vardavas et al., 2011).
While improvements to climate models will increase accuracy, current models show the
effects that forcings, such as greenhouse gases, have on the radiative energy budget of the Earth.
Current models, specifically the NASA Goddard Institute for Space Studies (GISS) model used
by Hansen (2005), show that the Earth is experiencing a radiative imbalance where it is
absorbing more energy than is being emitted to space. Ocean temperature data spanning from

3
1955 – 1998 shows an average increase of 10 W year/m2 for the oceans heat content indicating
that oceans are acting as a sink for the excess energy (Hansen, 2005). As the oceans absorb more
energy and temperatures increase, sea levels will rise due to the thermal expansion of water and
inputs of freshwater from melting ice sheets (Petersen et al., 2015).
Globally, the oceans influence weather patterns through the circulation and distribution of
heat. As global temperatures increase, weather systems have the potential to change which
influence observed wind and precipitation patterns (Kug et al., 2006). Over the United States,
wind speeds on average have shown a negative trend (Pryor et al., 2009). While in the Pacific
Northwest, namely the Strait of Georgia (the largest basin in the Northern Salish Sea), analysis
of buoy data has indicated that wind speeds are increasing between 0.019 and 0.093 m s-1 per
year (Gower, 2002). While these increasing trends are derived from data spanning roughly seven
years, it hints at the regional variability of winds in the Salish Sea. In fact, Seymour (2011) found
that, “The regional wave climates of the entire West Coast respond as a system to particular
combinations of atmospheric pressure in the Gulf of Alaska and position in the ENSO cycle.”As
freshwater inputs and thermal expansion to the Salish Sea drive SLR, and changing weather
patterns influence variability in winds, the wave climate of Puget Sound will be affected.
Finlayson (2006) has found that large storm events play the biggest role in shaping Puget
Sound beaches. The many diverse topographic features limit wind/wave energy such that
beaches within the region have predominately been characterized as a low energy environment.
However, regional storms have the ability to generate anomalous high energy conditions, capable
of mobilizing coarser sediment and larger clasts which change the morphology of the beach face
(Finlayson, 2006). Stronger and variable wind forcings (Gower, 2002) coupled with higher sea
levels allows waves to increase in magnitude and reach distances closer to shore before shoaling
and breaking. This imparts a more frequent and larger shear force on the beach face and has the
ability to change the low energy environment.
Climate of Pacific Northwest
Washington State is home to many unique climate zones spanning from coastal rain
forests to glaciated mountains within the Cascade Range. Variation in precipitation exists
between physiographic providences and undergoes seasonal variation. Outside of this, yearly
cycles driven by processes such as the El Niño-Southern Oscillation (ENSO), controlled by the
Pacific Decadal Oscillation (PDO) greatly effect precipitation and weather. The diverse geologic
features of Washington combined with yearly climate variability, influence weather systems both
temporally and spatially such that they define the climate of the state (Salathé et al., 2010).
Global climate models, as previously discussed above, simulate the climate over large
areas. These models tend to lack the spatial acuity needed to capture many of the mesoscale
processes (orographic impacts on precipitation for example) which govern the climate of a
region. Specific to Washington State, these mesoscale processes heavily influence local and
regional climates, placing a need for more accurate models (Salathé et al., 2010). Because of
this, regional climate models are employed to provide finer spatial resolution over specified
areas. Higher resolution allows regional models to, “simulate the interactions between large-
scale weather patterns and local terrain features not resolved by global models,” (Salathe et al.,
2010). One commonly used regional climate model is the Weather Research and Forecasting
model developed by the National Center for Atmospheric Research. A comparison of regional

4
and global climate models along with an analysis of historic and current meteorological data
shows a marked change in the climate of the Pacific Northwest (Salathe et al., 2010)
Temperatures in Washington State have shown an increase from 1895 to 2011 with an
average value of 0.7 C across the region. Predicted levels are expected to increase 1.9 C to 5.4
C for 2070 to 2099 relative to values from 1970 to 1999 dependent on greenhouse gas
emissions (Mote et al., 2014). Under high emission scenarios, temperatures in 2050 will show
an increase of 1.7 C to 4.8 C compared to 1950 – 1999 (Snover et al., 2013). These increasing
temperatures have the ability to change freeze levels and natural snowmelt patterns which affects
streamflow and sediment supply to rivers. Precipitation levels and sea level will also be affected,
generating floods of greater magnitudes with a higher recurrence interval; as sea levels increase,
flood waters will be unable to drain into the ocean (Mote et al., 2014 & Peterson et al., 2015).
Sea Level Rise
Global sea level is increasing due to the thermal expansion of the oceans and the melting
of polar ice caps and mountain glaciers. Across the globe, the effect of SLR will be observed
differently depending on regional factors like wind, atmospheric pressure, distribution of water,
and tectonic activity. In the Pacific Northwest, many factors play a role in observed SLR and
can cause significant variation over short distances. Specifically, atmospheric circulation,
tectonic uplift and isostatic rebound from recent glaciation play a big role in the observed
variation of SLR (Peterson et al., 2015).
Understanding how SLR will compound hazards and facilitate deviations in the
frequency and magnitude of extreme events is crucial (Jevrejeva et al., 2014). One major hazard
for coastal communities is flooding, where anomalous high water levels penetrate the backshore
and lack the capacity to drain flood and ponded waters, especially across unconfined coastal
aquifers. While coastal environments are adept at dealing with daily fluctuations in sea level
driven by tides, the co-occurrence of storms with high tides can produce devastating effects
(Zervas, 2005).
Major storms characteristically produce high wind speeds and low atmospheric pressure
which has the ability to raise sea levels beyond tidal levels (storm surge; McInnes et al., 2002).
Storm surge is the product of falling atmospheric pressure and wind stresses on the water which
cause a rise in sea level. For every millibar decrease in atmospheric pressure, there is
approximately a 1cm increase in sea level; this is commonly known as the inverse barometer
effect. Wind stresses have the ability, given enough fetch, to generate waves, currents and set-up
of the water surface. As currents approach the coast or encounter a barrier, water and waves will
begin to stack up and further elevate sea levels (wave set-up; McInnes et al., 2002). When these
process occur together, they can create intense flooding events (e.g., 100-year flood) amplifying
the damages to coastal environments (Zervas, 2005).
3.2 Wind-Generated Waves
As wind passes over a body of water, frictional forces between the air and the water
result in a shear stress on the fluid and a transfer of energy. The combined interaction of wind
and pressure variations with a body of water facilitates the formation of waves. Phillips (1957,
1960) developed a resonance model which describes how turbulent eddies in wind fields induce
pressure variations on the surface of the water. These differences in pressure result in the
formation of surface undulations which grow throughout time. While the resonance model

5
explains the initial formation of waves, Miles (1957) developed a shear flow model to simulate
the continued growth of waves. As wind passes over waves, “a complex air flow pattern
develops over the wave,” (Sorensen, 1997) which creates secondary air circulation in the
direction of the moving wave. This circulation ultimately results in air flow in the vertical
direction which allows the wave to increase in size—size also increases with fetch and wind
velocity (Sorensen, 1997).
Wind speeds in the Pacific Northwest display spatial variation in both average and
extreme values depending on their location relative to the coast, season, and yearly cycle (ENSO
for example). Coastal wind speeds are found to be much higher than those further inland due to
roughness over land from biologic, orographic and anthropogenic features (Griffin et al., 2010).
Over the past 60 years, there has been a noticeable increase in both the magnitude and frequency
of storms in the North Pacific (Bromirski et al., 2003). Open ocean buoy data show an increase
in significant wave heights of around 0.015 m/year since the 1970s (Ruggiero et al., 2010).
Some of this wave and wind energy enters the Strait of Juan de Fuca and influences wave
impacts in Puget Sound (Figure 1). Further analysis of buoy data has shown an association
between deep-water wave heights and the frequency of extreme storm events where a 2.7-meter
increase was noted from 1975 – 2000 along the outer coast of Washington (Allan & Komar,
2006). On a global scale, Young et al. (2011) analyzed 2x2 grids of satellite records of
average monthly wind speed and associated wave heights from 1990 – 2010. This study found
that the 90th and 99th percentile values of wind speed displayed a positive correlation with
increased wave heights, especially at higher latitudes and during storm events.
Using GCMs, researchers are able to model wind-generated waves under future
atmospheric conditions. GCMs extending into the mid – late 21st century under RCP 4.5 and
RCP 8.5 scenarios show that wind speeds would increase at both the northern and southern
regions along the east Pacific, with average wave periods increasing by 1 – 2 seconds (Erikson et
al, 2015). Around 50 N latitude and greater, wave heights under extreme conditions are
expected to continue increasing resulting in an amplified threat of flooding and coastal erosion
under future conditions (Erikson et al., 2015).
While SLR alone poses a real threat to global coast lines, there has been a noted, stronger
correlation of total water levels with climate driven hazards. Utilizing total water level models,
Ruggiero (2001) found that increases in both the magnitude and period of deep-water waves is
more significant for coastal flooding and erosion than SLR (Ruggiero et al., 2001 & Ruggiero et
al., 2010b & Ruggiero, 2013). These studies emphasize the need for a dynamic approach to
coastal modeling, incorporating different factors such as storm surge, wave set-up, wave run-up,
tides, and sea level rise to accurately constrain total water levels at the shoreline.
3.3 Coastal Modeling
Computer modeling provides a useful tool for simulating the complex and non-linear
interactions of physical processes that influence coastal morphology and aid in decision making
(Brown et al., 2016). Delft 3D has been widely used to examine interactions of currents, waves
and modifications of hydrology and sediment transport for coastal engineering and planning at a
range of spatial and temporal scales. Delft 3D is a suite of open-source, numerical
hydrodynamic and sediment transport algorithms that solves the physical interactions governing
coastal processes and in particular shallow wave transformation physics. It can simulate
hydrodynamics on both structured and unstructured grids, incorporate vegetation for coastal
geomorphology, and depict areas that will experience variations in wetting and drying. For each

6
time step in Delft 3D, the physics and interactions between flow, waves, sediment transport, and
the bottom are all calculated. This allows users to assess morphologic changes at the shore, and
in turn, the dynamic influence of sediment accretion on subsequent flow and wave
transformation.
In order to model wind-wave generation, Delft 3D incorporates SWAN (Simulating
WAves Nearshore), a third generation wave model used to simulate the formation of surface
waves. SWAN is able to handle both structured, unstructured, and nested grids when computing
wave generation for coastal settings at various spatial scales. Results from SWAN models can
then be coupled with other modules in Delft 3D such as Delft 3D-FLOW to better simulate the
impact that waves and currents have on one another (Simulation, 2014).
In 2005, the United States Geological Survey (USGS) in collaboration with the United
States Army Corps of Engineers (USACE) used Delft 3D for hydrodynamic modeling of the
mouth of the Columbia River in Washington State. The study validated the use of Delft 3D as an
accurate tool for realistically modeling coastal processes under a range of coastal settings (Elias
et al., 2012). By the late 2000s, the USGS began the development of a coastal-hazard modeling
project that grew into the Coastal Storm Modeling System (CoSMoS). The CoSMoS is a
numerical modeling tool that uses Delft 3D, specifically the FLOW/WAVE and XBeach
programs to predict coastal flooding. Regional models focusing on areas of interest, receive
boundary conditions from global data sources (WaveWatch III, National Data Buoy Center,
Coastal Data Information Program) which are then downscaled and used to determine total water
levels at the shoreline. These total water levels are then projected onto high resolution digital
elevation models at numerous cross-sections using the software XBeach for determining the
extent to which water levels penetrate the back shore and affect the coastal morphology (Barnard
et al., 2012).
3.4 Case Studies in Puget Sound
In Puget Sound, multiple studies have attempted to constrain SLR and the resulting total
water levels at the shoreline. In 2008, one study performed an assessment of SLR estimates for
2050 and 2100 using values generated in the fourth report by the Intergovernmental Panel on
Climate Change (Pachauri and Reisinger, 2007). From this report, SLR estimates range from
0.18 – 0.38 m for low emission scenarios and 0.26 – 0.59 m for high emission scenarios
(Pachauri and Reisinger, 2007; Mote et al., 2008). When combining the high emission scenario
with other factors such as melting polar ice caps, Mote et al., (2008) was able to develop a SLR
estimates with a low probability of occurrence for Puget Sound that would have the greatest
impact. In this high impact scenario, SLR of 0.55 m is expected by 2050 and 1.28 m by 2100
(Mote et al., 2008).
The most recent assessment of SLR was conducted by the National Research Council
(NRC) as part of their 2012 study (NAS, 2012). In this study, the NRC incorporated vertical land
motion and gravitational interactions between masses of ice and sea water (called the sea-level
fingerprint) in estimates of total water levels. Within Washington State, the NRC estimates SLR
to be 0.08 – 0.23 m by 2030, 0.18 - 0.48 m by 2050 and 0.50 – 1.40 m by 2100 with the state
wide estimates showing the largest deviation from the global mean (NAS, 2012). Comparing
estimates for SLR between various studies (Mote et al., 2008; Tebaldi et al., 2012; NAS, 2012)
shows that while there is some overlap in estimates, discrepancy exists surrounding projected
SLR estimates. In order to better evaluate TWL at the shoreline, a more dynamic model is
needed. These studies represent a static “bathtub” approach that does not capture the full physics

7
and responses that influence the shoreline (Figure 3). In order to accurately address future
conditions, more dynamic models incorporating waves are necessary.
Very little work has been done to assess the variability in wind-generated waves, their
potential variability and future impacts in Puget Sound. Most wave studies examine open ocean
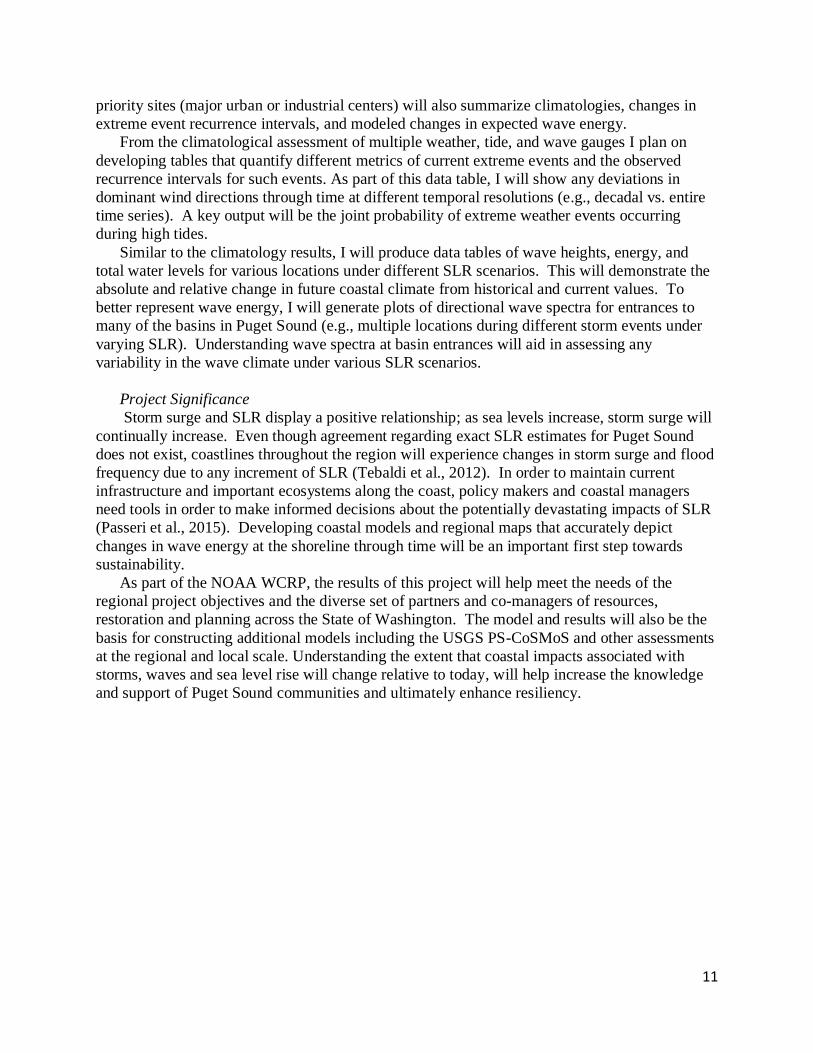
coasts where large ocean waves are common and impacts are high. Finlayson (2006) assessed
the geomorphology of Puget Sound beaches and calculated a single mean significant wave height
for the region. Using specific conditions of a 40 km fetch with wind speeds of 25 m/s, Finlayson
(2006) determined that a wave of 3.8 m with a period of 7.1 seconds is possible within Puget
Sound (Figure 2). These values signify the largest possible wave given sustained wind speeds
over open areas of water which is rather uncommon in Puget Sound. Numerous islands and
complex networks of coastal waterways disrupt the propagation of winds and subsequent waves
such that winds display variability both spatially and temporally (Finlayson, 2006). In order to
accurately model wind-wave generation in Puget Sound, a thorough evaluation of the variability
in wave energy and wave forcings is needed along with how these parameters may change in the
future.
The Federal Emergency Management Agency (FEMA) has performed regional assessments
of coastal hazards for flood insurance mapping. While the regional study spans the entire Pacific
coast of the US, guidelines exist to adapt FEMA’s methods for specific coastal settings. These
methodologies, leading to the creation of Flood Insurance Rate Maps (FIRM), are typically
employed on a local and community level to assess impacts on a finer scale (FEMA, 2004).
Within the state of Washington, Digital Flood Insurance Rate Maps have been generated for
specific counties such as Jefferson, Whatcom, Skagit, and Island County. As part of these
studies, FEMA modeled wave generation and flooding for the historical 100-yr coastal storm
event using SWAN (Simulating WAves Nearshore) and ADCIRC (a series of computer
programs that model fluid flow) for parameterized wind and water level conditions. Total water
levels were then imposed on 1-D transects at specific locations designated by the counties to
show locations where water will overtop the berm and map regions of potential flooding (FEMA,
2004).
When generating these maps, FEMA modeled specific processes independently, such as
storm surge and wave run up to establish 1% water levels which ultimately mark zones of
flooding (FEMA; FEMA, 2015; FEMA, 2004). This process differs from that of the CoSMoS
modeling approach, which incorporates storm surge, wave set-up/run-up, tides and any seasonal
effects with each calculation to better constrain total water level and the physics inherent in
coastal storms inundating the coast. FIRM modeling provides a rough baseline for water levels
from a 100-year coastal storm and its impacts, but does not address how wave energy will likely
change with sea level rise and climate change.
4. Proposed Work
To advance assessments of future coastal climate change beyond static models, I propose
to develop a physically based model that simulates the processes of storm surge, waves, wave
set-up, and run-up. These process models will allow me to perform a regional assessment of the
variability in wave energy today and assess the extent that wave energy and coastal storms will
change with sea level rise (Figure 3). Through the creation of these models, I am proposing to
address three main hypotheses with my research:
1. Significant wave height and annual energy reaching the shore will increase in

8
magnitude more with projected sea-level rise than forecasted changes in climate.
2. Upper foreshore morphologic and substrate change will be more significantly
impacted by projected increases in recurrence frequency of high water events than by
increases in projected wave heights.
3. Observed wind direction decadal oscillations of 10 to 15 degrees significantly impact
shoreline exposure to incident wave energy.
5. Methods
I will integrate computational modeling and field studies to characterize historical
conditions, modern processes, and evaluate potential future change. This research project will be
completed following the scope of work outline below:
1. Develop a catalogue of historic meteorological, tidal, and wave data for various
stations throughout Puget Sound.
2. Assess the climatology of the region through statistical analysis of historic data.
3. Perform extreme value analysis on historic data in order to estimate the recurrence
interval of extreme events and project into the future under various SLR scenarios.
4. Create grids of varying resolution for major basins within the Salish Sea which will
be coupled for modeling of the entire region. Perform sensitivity analyses on each
grid in order to calibrate and compare to observed data.
5. Deploy weather stations and wave sensors needed for model validation. Other field
techniques, such as structure from motion, will be employed to evaluate beach
substrate and topography. This will be assessed throughout the fall and winter for
any changes after major storm events.
6. Model wind-wave generation and propagation for each grid in the Salish Sea using
Delft 3D and SWAN. To cover the entire region, the coupling of models will be used
to generate the TWL at the shoreline.
7. Perform site-specific case studies using X-Beach to evaluate morphologic changes to
the beach face and the extent of flooding from TWL values derived from Delft 3D.
Assessments for SLR scenarios will use TWL values from Delft 3D but increasing
them according to different SLR estimates.
5.1 Historic Data – Climatological Assessment
Historic records of continuously measured sea level pressure, water levels, wind speed
and direction from stations throughout the Salish Sea will be analyzed using time-series
environmental statistical approaches. Analyses will examine distributions, general statistics,
extremes, and trends with which to characterize climatologies, classify storm events, and
quantify recurrence intervals of extreme events and phenomena of interest. Time-series will also
be essential for developing boundary conditions (inputs) for modeling. Data sources include
NOAA – NCDC (National Oceanic and Atmospheric Administration – National Climatic Data
Center), NOAA – NDBC (National Data Buoy Center), Naval or Air Force base weather data
sources, and other observational data sets proximal to shore (e.g., airports, schools, etc. General
climatologies will be visualized with wind-rose plots and extreme and recurrence interval
analyses will be derived using block maxima and rth largest approaches (Yang et al., 2014;
Zervas, 2005; Tebaldi et al., 2012; An & Pandey, 2006; Guedes Soares & Scotto, 2004; Vitousek

9
et al., 2017) under extreme value theory. Code necessary for performing analyses will be
generated in MATLAB, R and Python to be applicable to future and/or additional analyses as
new data sources are identified. Metadata will be generated for each set of data and results will
conform to USGS data reporting requirements.
Publically available numerical weather prediction service data will also be used to
characterize climate and for use in modeling. These data are spatially and temporally varying
gridded weather data from global climate models like the University of Washington Climate
Impacts Group’s 12-km Weather Research and Forecasting reanalysis hindcast (1950-2010),
Environment Canada’s 2.5-km High Resolution Deterministic Prediction System (available for
2015-present), and NOAA’s Climate Forecasting System 2.0. Individual storm events identified
in each of these model outputs will be analyzed to examine the resulting wave regime and to
place extreme events into the context of natural variability.
5.2 Statistical Analysis – Extreme Value Theory
Using methodology laid out by Zervas (2005), An & Pandey (2006), Guedes Soares &
Scotto, (2004) and Vitousek et al., (2017), generalized extreme value theory probability
distribution functions (pdfs) will be generated to determine the magnitude and frequency of
extreme events and storm statistics. For time series showing either seasonality or a trend, it will
be important to remove these before determining extreme values. After determining maximum
values (daily, monthly, yearly) for specific data types (wind speed, water level, etc.), statistical
software packages will be used to fit pdfs to the maximum values (block maxima, rth largest).
These pdfs can then be used to generate exceedance probability curves and represent both
recurrence intervals and values for specific storm events (100 year storm vs 10 year storm
(Zervas, 2005).
5.3 Hydrodynamic Modeling
To refine our understanding of the Puget Sound wave climate, I will use hydrodynamic
modeling to assess wave generation and propagation at a regional scale. Emphasis of this project
will be to evaluate the spatial variability in deep-water wave characteristics (>5 m depth)
approaching shore today and the extent it will change in the future due to sea level rise. This will
fulfill the goals of the parent NOAA Washington Coastal Resilience Project (WCRP) which had
resources sufficient to examine wave energy approaching the shore but not the complex physics
and interactions of wave dissipation and impact along the entire 4,020 km of Puget Sound
Shoreline. I will also couple the regional model outputs to high-resolution cross-shore models at
select “case study” sites being defined by the WCRP to evaluate potential changes in impacts
with sea level rise relative to today.
As part of the FIRM project, FEMA took the approach of classifying the 150 highest
water levels generally associated with storms and high tides at the NOAA Seattle tide gage
throughout time. USGS and partners have examined the history of non-tidal residuals (e.g., storm
surge anomalies) and atmospheric pressure anomalies from Seattle and several other tide/weather
gages. Select events from this list as well as the 100-yr, 50-yr, etc., conditions I calculated from
extreme value analyses will be used as boundary conditions to simulate the resulting wave fields
using Delft3D and SWAN. From this I will assess the full spectra of wave characteristics
expected given the historical conditions and recurrence intervals of events in Puget Sound.
Results from each model run will be compared with measured wave statistics where available,
and with recorded meteorological data to assess model accuracy and aid in calibration. Upon

10
validation, I will run each simulation again but under future SLR estimates. Model outputs for
each congruent scenario will be compared and results alongshore will be extracted to show the
percent change and any expected changes at the beach face.
The regional evaluation I complete for my thesis will be used in a Phase II analysis by the
USGS Puget Sound CoSMoS project to validate and characterize projected coastal impacts
associated with waves including flooding, extent and depth of flood waters, erosion, etc. The
regional model I help develop will evaluate wave generation and propagation for the range of
dominant wind intensities and directions and joint occurrence of tides and storm surge anomalies
experienced today. This will be accomplished using a coupled USGS Delft3D-Flexible Mesh
model of the Salish Sea for tidal flow (shown in Figure 4) and a structured wave model built in
SWAN. This will provide a characterization of the historical variability and extremes in wave
exposure that can then be used with scenarios of higher sea level position to assess how sea level
rise will influence wave impacts.
Modeling will allow for the assessment of how extreme events may change through time.
Binning historical wind data into select directional groups (3 – 5 degrees) and assessing the
distribution of wind speeds within each group, will lead to estimates of the recurrence intervals
of specific wind regimes above thresholds of concern and show the extent that wind directions
have changed through time (Figure 5). As part of a sensitivity analysis on wind-wave generation
in Puget Sound, I will model incrementally increasing wind directions and assess the extent that
wind direction affects wave energy. Coupling historic wind variability with model results, I can
then assess how wave energy may have changed through time, including incident wave energy,
and help to test whether an increase in sea level will bring about any changes in dissipation,
refraction or other physics that affect wave impacts at the shore.
After completing the regional wave assessment, I intend to examine two site specific case
studies: one exploring the influence of SLR and waves on bluff retreat along the Island County
bluff-barrier spit system of Iverson Lagoon; the other aims to assess how to apply the regional
model of future extreme coastal conditions to the urban infrastructure of Tacoma. These case
studies will incorporate cross-shore 1D models needed to solve for wave dissipation, set up and
run up to predict inundation, potential for erosion and any geomorphic change that could impact
habitats or local infrastructure. This modeling effort will use the results of the regional wave
study to propagate wave energy to the shore along high-resolution digital elevation models and
likely utilize XBeach or a similar 1D wave transformation algorithm that USGS has integrated
into the CoSMoS framework.
6. Expected Results
The goal of this project is to assess the variability of wave energy today and the impact that
sea level rise will have on wave energy in the future throughout the Salish Sea. Regional maps
of the variability in significant wave height and energy approaching the shoreline under various
SLR scenarios and different extreme storm events (Figure 6) will help inform coastal managers
and policy makers of spatial considerations of future risk. These maps will depict annual
forecasted maximum wave heights along the shore, percent changes relative to today and the
extent of flooding/morphological changes to the beach face for site specific studies. Such maps
have been identified as important and valuable tools for coastal managers and policy makers to
better plan for the changing wave climate. Results in the form of tables and maps by basin and
11
priority sites (major urban or industrial centers) will also summarize climatologies, changes in
extreme event recurrence intervals, and modeled changes in expected wave energy.
From the climatological assessment of multiple weather, tide, and wave gauges I plan on
developing tables that quantify different metrics of current extreme events and the observed
recurrence intervals for such events. As part of this data table, I will show any deviations in
dominant wind directions through time at different temporal resolutions (e.g., decadal vs. entire
time series). A key output will be the joint probability of extreme weather events occurring
during high tides.
Similar to the climatology results, I will produce data tables of wave heights, energy, and
total water levels for various locations under different SLR scenarios. This will demonstrate the
absolute and relative change in future coastal climate from historical and current values. To
better represent wave energy, I will generate plots of directional wave spectra for entrances to
many of the basins in Puget Sound (e.g., multiple locations during different storm events under
varying SLR). Understanding wave spectra at basin entrances will aid in assessing any
variability in the wave climate under various SLR scenarios.
Project Significance
Storm surge and SLR display a positive relationship; as sea levels increase, storm surge will
continually increase. Even though agreement regarding exact SLR estimates for Puget Sound
does not exist, coastlines throughout the region will experience changes in storm surge and flood
frequency due to any increment of SLR (Tebaldi et al., 2012). In order to maintain current
infrastructure and important ecosystems along the coast, policy makers and coastal managers
need tools in order to make informed decisions about the potentially devastating impacts of SLR
(Passeri et al., 2015). Developing coastal models and regional maps that accurately depict
changes in wave energy at the shoreline through time will be an important first step towards
sustainability.
As part of the NOAA WCRP, the results of this project will help meet the needs of the
regional project objectives and the diverse set of partners and co-managers of resources,
restoration and planning across the State of Washington. The model and results will also be the
basis for constructing additional models including the USGS PS-CoSMoS and other assessments
at the regional and local scale. Understanding the extent that coastal impacts associated with
storms, waves and sea level rise will change relative to today, will help increase the knowledge
and support of Puget Sound communities and ultimately enhance resiliency.

12
7. Timeline
2017 2018
Jun. Jul. Aug. Sept.
Oct. Nov. Dec. Jan. Feb. Mar. Apr. May Jun.
Data Collect/Identify Sites
X
Climatology Assessment X X
Extreme Event Analysis
X
Begin Modeling
X X X
Model SLR
X X X
Analyze Results
X X X
Generate Tables & Plots
X X X X
Write Thesis
X X X X X X X X X X X
Table Thesis
X
Defend & Graduate
X

13
8. References
Adelsman, H., Ekrem, J., 2012 Preparing for a Changing Climate: Washington State's
Integrated Climate Response Strategy. Washington Department of Ecology, Publication
No. 12-01004, Olympia, Washington.
http://www.ecy.wa.gov/climatechange/ipa_responsestrategy.htm.
Allan, Jonathan C., and Komar, Paul D. “Climate Controls on US West Coast Erosion
Processes.” Journal of Coastal Research 223 (May 2006): 511–29. doi:10.2112/03
0108.1.
An, Ying, and M.D. Pandey. The R Largest Order Statistics Model for Extreme Wind Speed
Estimation. Vol. 95, 2007. doi:10.1016/j.jweia.2006.05.008.
Barnard, P.L., O’Reilly, Bill, van Ormondt, Maarten, Elias, Edwin, Ruggiero, Peter, Erikson,
L.H., Hapke, Cheryl, Collins, B.D., Guza, R.T., Adams, P.N., and Thomas, J.T., 2009,
The framework of a coastal hazards model; a tool for predicting the impact of severe
storms: U.S. Geological Survey Open-File Report 2009-1073, 21 p.
[http://pubs.usgs.gov/of/2009/1073/].
Bromirski, Peter D., Reinhard E. Flick, and Daniel R. Cayan. “Storminess Variability along the
California Coast: 1858–2000.” Journal of Climate 16, no. 6 (March 2003): 982–93.
doi:10.1175/1520-0442(2003)016<0982:SVATCC>2.0.CO;2.
Brown, J. M., P. Ciavola, G. Masselink, R. McCall, and A. J. Plater. “Preface: Monitoring and
Modelling to Guide Coastal Adaptation to Extreme Storm Events in a Changing
Climate.” Natural Hazards and Earth System Sciences 16, no. 2 (February 12, 2016): 463–67.
doi:10.5194/nhess-16-463-2016.
Elias, Edwin P. L., Guy Gelfenbaum, and André J. Van der Westhuysen. “Validation of a
Coupled Wave-Flow Model in a High-Energy Setting: The Mouth of the Columbia River:
MCR WAVE-FLOW MODEL.” Journal of Geophysical Research: Oceans 117, no. C9
(September 2012): n/a-n/a. doi:10.1029/2012JC008105.
Erikson, L.H., C.A. Hegermiller, P.L. Barnard, P. Ruggiero, and M. van Ormondt. “Projected
Wave Conditions in the Eastern North Pacific under the Influence of Two CMIP5
Climate Scenarios.” Ocean Modelling 96 (December 2015): 171–85.
doi:10.1016/j.ocemod.2015.07.004.
FEMA (Federal Emergency Management Agency). Coastal Flood Hazard Analysis and
Mapping for Whatcom, Skagit, Island Counties, Washington: Engineering Report
FEMA (Federal Emergency Management Agency). (2015). Flood Insurance Study: Whatcom
County, Washington (Report No. 53073CV001C).

14
FEMA (Federal Emergency Management Agency). (2004). Guidelines and specifications for
flood hazard mapping partners appendix D. Final Draft Guidelines for Coastal Flood
Hazard Analysis and Mapping for the Pacific Coast of the United States.
Finlayson, D. 2006. e geomorphology of Puget Sound beaches. Puget Sound Nearshore
Partnership Report No. 2006-02. Published by Washington Sea Grant Program,
University of Washington, Seattle, Washington. Available at
http://pugetsoundnearshore.org.
Guedes Soares, Carlos, and Manuel Scotto. Application of the R Largest-Order Statistics for
Long-Term Predictions of Significant Wave Height. Vol. 51, 2004.
doi:10.1016/j.coastaleng.2004.04.003.
Gower, J. F. R. (2002), Temperature, wind and wave climatologies, and trends from marine
meteorological buoys in the northeast Pacific, J. Clim., 15(24), 3709–3718,
doi:10.1175/1520-0442(2002)015<3709:TWAWCA>2.0.CO;2.
Griffin, B. J., K. E. Kohfeld, A. B. Cooper, and G. Boenisch. “Importance of Location for
Describing Typical and Extreme Wind Speed Behavior: PACIFIC NORTHWEST WIND
SPEED BEHAVIOR.” Geophysical Research Letters 37, no. 22 (November 2010): n/a-
n/a. doi:10.1029/2010GL045052.
Hansen, J. “Earth’s Energy Imbalance: Confirmation and Implications.” Science 308, no. 5727
(June 3, 2005): 1431–35. doi:10.1126/science.1110252.
Jevrejeva, S., A. Grinsted, and J. C. Moore. “Upper Limit for Sea Level Projections by 2100.”
Environmental Research Letters 9, no. 10 (2014): 104008. doi:10.1088/1748
9326/9/10/104008.
Kiehl, J. T., and Kevin E. Trenberth. “Earth’s Annual Global Mean Energy Budget.” Bulletin of
the American Meteorological Society 78, no. 2 (February 1997): 197–208.
doi:10.1175/15200477(1997)078<0197:EAGMEB>2.0.CO;2.
Kug, Jong-Seong, Ben P. Kirtman, and In-Sik Kang. “Interactive Feedback between ENSO and
the Indian Ocean in an Interactive Ensemble Coupled Model.” Journal of Climate 19, no.
24 (December 1, 2006): 6371–81. doi:10.1175/JCLI3980.1.
McInnes, Kathleen L., Graeme D. Hubbert, Debbie J. Abbs, and Steve E. Oliver. “A Numerical
Modelling Study of Coastal Flooding.” Meteorology and Atmospheric Physics 80, no. 1–
4 (June 1, 2002): 217–33. doi:10.1007/s007030200027.
Miles, J.W. (1957), “On the Generation of Surface waves by Shear Flows,” Journal of Flud
Mechanics, Vol. 3. pp. 185-204.
Mote, P.W., Petersen, A., Reeder, S., Shipman, H., Whitely Binder, L.C. 2008. Sea Level Rise in
the Coastal Waters of Washington State. Report prepared by the Climate Impacts Group,

15
Center for Science in the Earth System, Joint Institute for the Study of the Atmosphere
and Oceans, University of Washington, Seattle, Washington and the Washington
Department of Ecology, Lacey, Washington.
Mote, P., A. K. Snover, S. Capalbo, S. D. Eigenbrode, P. Glick, J. Littell, R. Raymondi, and S.
Reeder. “Ch. 21: Northwest. Climate Change Impacts in the United States: The Third
National Climate Assessment,” 2014. doi:10.7930/J04Q7RWX.
National Academy of Sciences (20120. Sea-Level Rise for the Coasts of California, Oregon, and
Washington: Past, Present, and Future. Washington, D.C.: National Academies Press,
2012. http://www.nap.edu/catalog/13389.
Pachauri, Rajendra K., Andy Reisinger. “IPCC Fourth Assessment Report.” IPCC, Geneva
(2007): 2007
Passeri, Davina L., Scott C. Hagen, Stephen C. Medeiros, Matthew V. Bilskie, Karim Alizad,
and Dingbao Wang. “The Dynamic Effects of Sea Level Rise on Low-Gradient Coastal
Landscapes: A Review: THE DYNAMIC EFFECTS OF SEA LEVEL RISE ON LOW
GRADIENT COASTAL LANDSCAPES.” Earth’s Future 3, no. 6 (June 2015): 159–81.
doi:10.1002/2015EF000298.
Petersen, S., Bell, J., Miller, I., Jayne, C., Dean, K., Fougerat, M., 2015. Climate Change
Preparedness Plan for the North Olympic Peninsula. A Project of the North Olympic
Peninsula Resource Conservation & Development Council and the Washington
Department of Commerce, funded by the Environmental Protection Agency. Available:
www.noprcd.org
Phillips, O.M. (1957), “On the Generation of Waves by Turbulent Winds,” Journal of Fluid
Mechanics, Vol. 2, pp. 417-445.
Phillips, O.M. (1960), “On the Dynamics of Unsteady Gravity Waves of Finite Amplitude, 1.
The Elementary Interactions,” Journal of Fluid Mechanics, Vol. 9, pp. 193-217.
Potential Impacts of Accelerated Climate Change. Washington, D.C. : United States. Dept. of
Energy. ;, 2016.
Pryor, S. C., R. J. Barthelmie, D. T. Young, E. S. Takle, R. W. Arritt, D. Flory, W. J. Gutowski,
A. Nunes, and J. Roads. “Wind Speed Trends over the Contiguous United States.”
Journal of Geophysical Research 114, no. D14 (July 23, 2009).
doi:10.1029/2008JD011416.
Ranasinghe, Roshanka, Trang Minh Duong, Stefan Uhlenbrook, Dano Roelvink, and Marcel
Stive. “Climate-Change Impact Assessment for Inlet-Interrupted Coastlines.” Nature
Climate Change 3, no. 1 (September 2, 2012): 83–87. doi:10.1038/nclimate1664.
Ruggiero, Peter. “Is the Intensifying Wave Climate of the U.S. Pacific Northwest Increasing

16
Flooding and Erosion Risk Faster Than Sea-Level Rise?” Journal of Waterway, Port,
Coastal, and Ocean Engineering 139, no. 2 (March 2013): 88–97.
doi:10.1061/(ASCE)WW.1943-5460.0000172.
Ruggiero, P., Komar, P. D., McDougal, W. G., Marra, J. J., and Beach, R. A. (2001). “Wave
runup, extreme water levels and the erosion of properties backing beaches.” J. Coastal
Res., 17(2), 407–419.
Ruggiero, Peter, Paul D. Komar, and Jonathan C. Allan. “Increasing Wave Heights and
Extreme Value Projections: The Wave Climate of the U.S. Pacific Northwest.”
Coastal Engineering 57, no. 5 (May 2010): 539–52.
doi:10.1016/j.coastaleng.2009.12.005.
Ruggiero, P., Komar, P. D., and Allan, J. C. (2010b). “Increasing wave heights and extreme
value projections: The wave climate of the U.S. Pacific Northwest.” Coastal Eng., 57(5),
539 552.
Salathé, Eric P., L. Ruby Leung, Yun Qian, and Yongxin Zhang. “Regional Climate Model
Projections for the State of Washington.” Climatic Change 102, no. 1–2 (May 5, 2010):
51–75. doi:10.1007/s10584-010-9849-y.
Seymour, R. J., 2011. Evidence for changes to the northeast Pacific wave climate. Journal of
Coastal Research, 27(1), 194–201. West Palm Beach (Florida), ISSN 0749-0208.
Simulation of short-crested waves with SWAN, (2014). Delft 3D-Wave User Manual, Delft
Snover, A.K, G.S. Mauger, L.C. Whitely Binder, M. Krosby, and I. Tohver. 2013. Climate
Change Impacts and Adaptation in Washington State: Technical Summaries for Decision
Makers. State of Knowledge Report prepared for the Washington State Department of
Ecology. Climate Impacts Group, University of Washington, Seattle.
Sorensen, Robert M. “Wind-Generated Waves.” In Basic Coastal Engineering, by Robert M.
Sorensen, 151–86. Boston, MA: Springer US, 1997. doi:10.1007/978-1-4757-2665-7_6.
Tebaldi, Claudia, Benjamin H. Strauss, and Chris E. Zervas. “Modelling Sea Level Rise Impacts
on Storm Surges along US Coasts.” Environmental Research Letters 7, no. 1 (2012):
14032. doi:10.1088/1748-9326/7/1/014032.
Vardavas, Ilias M., Ilias Vardavas, and Frederic Taylor. Radiation and Climate: Atmospheric
Energy Budget from Satellite Remote Sensing. OUP Oxford, 2011.
Vitousek, Sean, Patrick L. Barnard, Charles H. Fletcher, Neil Frazer, Li Erikson, and Curt D.
Storlazzi. “Doubling of Coastal Flooding Frequency within Decades due to Sea-Level
Rise.” Scientific Reports 7, no. 1 (May 18, 2017): 1399. doi:10.1038/s41598-017-01362
7.

17
Yang, Zhaoqing, Taiping Wang, Dave Cline, and Brian Williams. “Hydrodynamic Modeling
Analysis to Support Nearshore Restoration Projects in a Changing Climate.” Journal of
Marine Science and Engineering 2, no. 1 (January 22, 2014): 18–32.
doi:10.3390/jmse2010018.
Young, I. R., S. Zieger, and A. V. Babanin. “Global Trends in Wind Speed and Wave Height.”
Science 332, no. 6028 (April 22, 2011): 451–55. doi:10.1126/science.1197219
Zervas, C.E. “Response of Extreme Storm Tide Levels to Long-Term Sea Level Change,” 1–6.
IEEE, 2005. doi:10.1109/OCEANS.2005.1640144.

18
9. Figures
Figure 1: Map of the Salish Sea, showing the area of study for this research project
19
Figure 2: Wave climate maps of Puget Sound showing mean significant wave height (left) and period
(right) of statistically summarized wind storms from 1996 – 2000. Taken from Finlayson (2006)
20
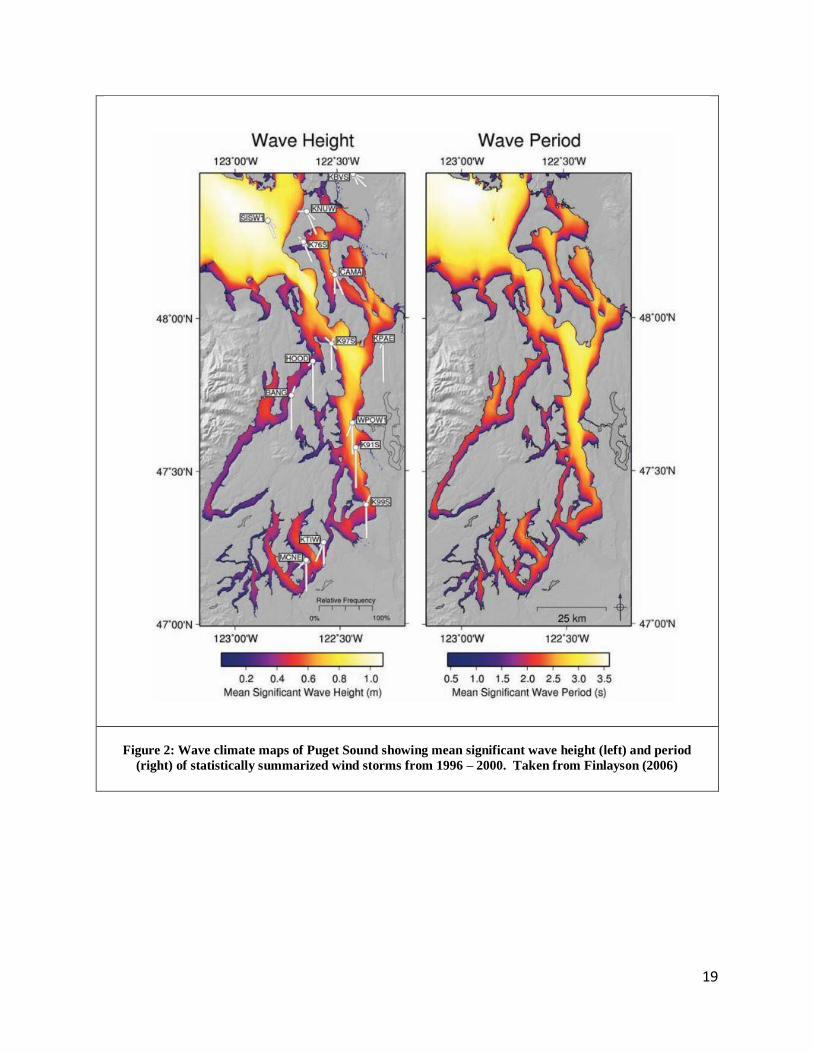
Figure 3: Photographs of Alki Beach in West Seattle, showing the difference between calm seas during
high tide in contrast with wind generated waves interacting with the shoreline during high tide.
Provides a visual representation of a static vs. dynamic approach to coastal modeling.

21
Figure 4: Image of the Delft 3D – FM (Flexible Mesh) model domain for the entire Salish Sea.

22
Figure 5: Wind rose diagrams for Paine Field and Whidbey Island Naval Air Station located in
Washington. Data spans from the early 1940’s to present. Both stations are proximal to the coast
and are separated by roughly 35 miles. Over this short distance, variability in wind direction is
easily noticed where Whidbey has dominant W and SE winds while Paine Field has dominant
N/NW and S/SE winds.
Paine Field FieldField
Whidbey Island NAS

23
Figure 6: Sample map showing the desired output from the regional study. In this example Whidbey
Island, WA is shown with a hypothetical east blowing wind. This sample map shows how locations
directly exposed to the westerlies will see the highest wave energy compared to areas protected by land
to the west.