assessing paleotemperature and … · after manual polishing, ... 2000), leaf stomata (retallack,...
TRANSCRIPT

GEOLOGICA BELGICA (2011) 14/3-4: 143-158
ASSESSING PALEOTEMPERATURE AND SEASONALITY DURING THE EARLY EOCENE CLIMATIC OPTIMUM (EECO) IN THE BELGIAN BASIN
BY MEANS OF FISH OTOLITH STABLE O AND C ISOTOPES
Daan VanHOVE1,2, PEtEr StaSSEn1, rObErt P. SPEIJEr1 & EtIEnnE StEUrbaUt1,2
(4 figures and 2 tables)
1. Department of Earth and Environmental Sciences, K.U.Leuven, Celestijnenlaan 200E, B-3001 Leuven, Belgium2. Department of Paleontology, Royal Belgian Institute of Natural Sciences, Vautierstraat 29, B-1000 Brussels, Belgium
ABSTRACT. The Paleogene greenhouse world comprises variable paleoclimate conditions providing an indispensable deep-time perspective for the possible effects of human-induced climate change. In this paper, paleotemperature data of the early Eocene climatic optimum (EECO) from the mid-latitude marginal marine Belgian Basin are discussed. They are derived from fish otolith δ18O compositions of four non-migratory species belonging to the families Congridae and Ophidiidae. Otoliths from several levels and localities within the middle to late Ypresian were selected. After manual polishing, bulk and incremental microsamples were drilled and analyzed by a mass spectrometer. A cross-plot of bulk otolith δ18O vs. δ13C results shows a discrepancy between both families used. Ophidiid data probably represent true bottom water temperatures of the Belgian Basin. The mean annual temperature (MAT) of the EECO is calculated at 27.5 °C, which is in line with other proxy results. However, variations in MAT up to 6 °C occur, suggesting a pronounced expression of climate variability in mid-latitude marginal basins. Incremental analyses revealed a ~9.5 °C mean annual range of temperatures, similar to modern seasonality. These results show that marginal marine environments such as the Belgian Basin are well suited to infer high-resolution paleoclimate variability.
KEYWORDS. Otolith, stable isotopes, early Eocene, EECO, North Sea Basin, shallow marine, paleoclimate
1. Introduction
During the past decade the early Paleogene greenhouse world, being the youngest greenhouse period in Earth’s history, has increasingly engaged the attention of paleoclimatologists. It is characterized by high global mean temperatures and the absence of a pronounced sea-surface temperature (SST) gradient, with little if any ice on Earth’s poles (Zachos et al., 2001, 2008; Bijl et al., 2009). Atmospheric carbon dioxide (CO2) concentrations were at least two times higher than pre-industrial levels, as has been inferred among others from pedogenic goethite (Yapp, 2004), planktic foraminiferal boron isotopes (Pearson & Palmer, 2000), leaf stomata (Retallack, 2001) and global carbon cycle modeling (e.g. Tajika, 1998; Wallmann, 2001). Interestingly, the long-term trend of rising temperatures culminating in the Early Eocene Climatic Optimum (EECO; Zachos et al., 2001, 2008; see Fig. 4) has been found to be superimposed by short-term climate variability. Multiple hyperthermal events (Paleocene/Eocene thermal maximum, PETM; Eocene thermal maximum 2, ETM2; ETM3) were recognized recently (Lourens et al., 2005; Zachos et al., 2001, 2008; Agnini et al., 2009), and high-resolution δ13C, core color reflectance and X-ray fluorescence data have been linked to variations in Earth’s orbital parameters (Cramer et al., 2003; Lourens et al., 2005; Westerhold et al., 2008; Westerhold & Röhl, 2009). The EECO (ca. 52-49 Ma) represents the warmest period of the past 70 myr, as indicated by low-latitude TEX86 paleotemperature
estimates (Pearson et al., 2007) and the occurrence of crocodilians within the Arctic Circle (Markwick, 1998, 2007). It has been attributed by Kent & Muttoni (2008) to atmospheric greenhouse gas emissions, related to the collision of India with Asia around 50 Ma.
Since the extent of early Paleogene climate variability seems to approximate icehouse climate variability, this period becomes particularly attractive to investigate climate system behavior with respect to elevated temperature and greenhouse gas conditions, and by consequence, its possible effects on the biosphere. Linking deep-sea and continental realms trough marginal marine settings can play an important role in these investigations. In these marginal environments, climate variability is expressed and recorded in many ways, such as sea-level changes archived as stratigraphic sequences (e.g. Hardenbol et al., 1998), faunal shifts in space and time (e.g. Scheibner & Speijer, 2008), and variable oxygen isotope signatures of biominerals secreted by many benthic and planktic organisms (e.g. Ivany et al., 2000; Zachos et al., 2005). Also, by studying adjacent basins, local expressions of latitudinal climatic gradients can be obtained.
The Belgian Basin is an example of a marginal basin that is well suited for paleoenvironmental studies of the early Paleogene because of its fairly complete sections with integrated sequence stratigraphy (Steurbaut, 1998; Vandenberghe et al., 2004) and often abundant fossil content. This paper focuses on the upper Ypresian

144 D. VanHOVE, P. StaSSEn, r. P. SPEIJEr & E. StEUrbaUt
sediments of the Belgian Basin (see section 2), which cover the EECO interval. Already since halfway the 19th century, the Belgian Ypresian sedimentary deposits have been studied intensively and correlated with successions in the Hampshire, London and Paris Basins (Lyell, 1852). More recent research led to extensive summaries of the regional stratigraphy (Vandenberghe et al., 1998; Steurbaut 1998, 2006). These sediments and their fossil contents have also been interpreted in terms of early Eocene climate. The fossil assemblages discovered so far, such as the vertebrate assemblage at the base of the Egemkapel Clay Member (Steurbaut, 1998), the teleost fish fauna of the Egem Sand Member (Steurbaut & Nolf, 1991) and the sporopollinic assemblages of the Gentbrugge and Aalter Formations indicating the presence of Nypa palms (Roche, 1991), all point to a (sub)tropical climate. This is confirmed by a relatively high percentage of Apectodinium spp. dinoflagellate cysts (Van Simaeys et al., 2003) and the kaolinite and smectite clay mineralogical content of some units (Mercier-Castiaux & Dupuis, 1991; Robert & Chamly, 1991), indicating a warm climate with contrasting seasonal humidity.
Despite this overwhelming evidence of high temperatures in the Belgian Basin during the Ypresian, quantitative temperature and seasonality data are lacking. Yet this information is necessary to fully understand the external and internal forcing mechanisms of the climate system. It also contributes to our understanding of climate-induced changes on ecosystems and the geochemical composition of the sea-water. Stable oxygen and carbon isotopes, measured from fish otoliths, are used here as a paleotemperature and paleoseasonality proxy. Previous studies have shown that oxygen isotopes in biogenic aragonite of otoliths are precipitated in or near equilibrium with ambient water, and that the fractionation factor is temperature dependent (Iacumin et al., 1992; Patterson et al., 1993; Thorrold et al., 1997; Weidman & Millner, 2000; Høie et al., 2004; Storm-Suke et al., 2007). Carbon stable isotopes on the other hand, were found to be deposited in disequilibrium with the Dissolved Inorganic Carbon (DIC) of the environment, which can be partly attributed to metabolic and dietary effects (Thorrold et al., 1997; Schwarcz et al., 1998; Campana, 1999; Weidman & Millner, 2000). So far, the use of otolith stable isotopes to infer Paleogene climate changes has been very limited (Ivany et al., 2000; De Man et al., 2004), especially for the Ypresian (Ivany et al., 2003). Similar studies involved otoliths from the Jurassic (Patterson, 1999; Price et al., 2009) and Holocene periods (Patterson, 1998; Andrus et al., 2002).
Our objective is to assess the use of otolith δ18O paleothermometry as a high-resolution paleoclimate proxy for early Paleogene marginal settings. To achieve this, bulk analyses (mean annual temperatures, MAT) and analyses of individual growth increments (seasonality) have been performed on well-preserved otoliths of several units covering the EECO interval. Otoliths from non-migratory bottom-dwellers (families Ophidiidae and Congridae) were selected for our purposes, because these
are thought to yield bottom water temperatures, and because of their abundance in the Belgian Ypresian (see section 3.1). Given the general scarcity of early Paleogene stable isotope data within the entire North Sea Basin, our data help identify the nature of latitudinal temperature variability during this warm period in this region.
2. Geological and paleogeographical setting of Belgium during the early Eocene
During the Ypresian, the Belgian Basin and its western and southern prolongations, respectively the London and Hampshire(-Dieppe) Basins and the Paris Basin, formed part of the southern North Sea Basin (e.g. Murray, 1992; King, 2006, Fig. 1B-C-D). The surrounding Precambrian-Paleozoic massifs were drained by large rivers, probably just like today (King, 2006). During the early Ypresian, shortly after the PETM (Steurbaut et al., 2003), the end of thermal updoming of Greenland and the initiation of sea-floor spreading between Norway and Greenland led to regional subsidence (Vandenberghe et al., 2004; King, 2006), while simultaneously a eustatic sea-level rise occurred (Miller et al., 2005, Fig. 1B-C).
It was during this time of high relative sea-level and subsequent basin-wide transgression (Vandenberghe et al., 2004; King, 2006; Steurbaut, 2006), that the Kortijk Clay Formation was deposited. This unit is part of a succession of marine clays and silts, reaching a thickness of 100 m in northern Belgium. It overlies the lowermost Ypresian fluvio-lacustrine facies of the Tienen Formation and correlates with the London Clay Formation in the London Basin and the Røsnæs Clay Formation in Denmark (Neal, 1996; Vandenberghe et al., 1998; King, 2006; Steurbaut, 1998, 2006). In northern Belgium, this unit represents deposition at middle-outer neritic depths (50-200 m); towards the south it represents near-shore deposition (Fig. 1C, Steurbaut, 2006). The Kortrijk Clay Formation is divided into five members (Vandenberghe et al., 1998, 2004; Steurbaut, 1998, 2006). The lowermost is the Zoute Silt Member, which contains wood fragments and volcanic ash particles, and is sharply separated from the overlying member by a pebble layer. This is interpreted as an interruption of sedimentation, which can be correlated to temporary uplifting of the Brabant Massif and Artois Axis (Fig. 1A-B). This unit is overlain by two decalcified members: the Mont-Heribu Clay Member, consisting mainly of silty clays, and the Orchies Clay Member, consisting of stiff clays. The Roubaix Clay Member is composed of calcareous clays and silts and very fine sands, passing towards the southeast into the predominantly sandy Mons-en-Pévèle Sand Formation. The uppermost member is the generally decalcified Aalbeke Clay Member, comprised of fine silty clays.
These predominantly argillaceous lower Ypresian deposits are overlain by a heterogeneous upper Ypresian succession of fine glauconitic sands and silty clays, deposited at inner neritic to coastal depths (Vandenberghe et al., 1998, 2004; Steurbaut, 1998, 2006). This shallowing is essentially due to eustatic sea-level fall and renewed

PalEOtEmPEratUrE anD SEaSOnalIty DUrIng tHE EECO by mEanS Of fISH OtOlItH StablE O anD C ISOtOPES 145
uplift of the Brabant Massif and the Artois Axis (Fig. 1A-D). The southern coastline of the North Sea Basin gradually shifted northwards (Fig.1D). However, several levels with abundant Nummulites in the Egem Sands point to a southwestern marine connection to the Atlantic Ocean (see King, 2006). The upper Ypresian sedimentary record starts with the Tielt Formation, consisting of the slightly calcareous Kortemark Silt Member, the Egemkapel Clay Member bounded by omission surfaces and the Egem Sand Member. The latter comprises glauconitic fine sands with shelly layers (‘faluns’, probably deposited during storms) rich in calcareous fossils, deposited relatively close to the coastline. It is succeeded by the Hyon Sand Formation, which begins with the carbonate-free Bois-la-Haut Sand Member, followed by the poorly sorted glauconitic fine sands containing carbonaceous fossils of the Panisel Sand Member. The next Gentbrugge Formation is a heterogeneous unit including five distinctive members, representing offshore (Kwatrecht, Merelbeke Clay and Pittem Clay Members), near-coastal (Vlierzele Sand Member) and at the top (Aalterbrugge Member) even
swamp environments. Only the Pittem Clay Member is calcareous in outcrop. The Vlierzele Sand Member incises deeply into underlying deposits. A subsequent transgression led to the deposition of the Aalter Sand Formation, rich in glauconite and shells. The Ypresian-Lutetian transition is situated in the middle of this formation.
The above information is summarized on Fig. 1A. From this it becomes clear that the lower Eocene record of the Belgian Basin is fairly continuous. Having suffered only minor deformation (Henriet et al., 1991), it is well-suited for studies on the impact of early Eocene climate variability on marginal marine ecosystems.
3. Material and methods
3.1. Material
Ypresian otoliths in the Belgian Basin have been described by Steurbaut and Nolf (1991). In general, 55 % of the species can be attributed to modern genera, and species of the families Ophidiidae (60 %) and Congridae (15 %)
NP
14
NP
13
NP
12
NP
11N
P1
0N
P9
NP
8
Yp10
Yp9
Yp8
Yp7
Yp6
Yp5
Yp4
Yp3Yp2
Th7/Yp1
Th6/Yp0
Th5
Yp
res
ian
Th
an
eti
an
Lu
teti
an
Lu1
relative sea levellow high
Brussels Sand
Aalter
VlierzeleAalterbrugge
Pittem
Merelbeke
Hyon-M. PaniselEgem
EgemkapelKortemark
Aalbeke(Roubaix)
Roubaix
Orchies
Varangeville-Mont Héribu
Craquelinnes - Zoute siltOosthoekTienen Fm.
Brussels Sand facies N. France ?
up
lift
Bra
ban
t M
assif
up
lift
B.M
.
Sta
ge
Ca
lc.
na
nn
o.
Se
qu
en
ce
s
tra
tig
rap
hy
Stratigraphic and relative sea-levelpositions of the sequences
Pa
rac
on
ge
r s
au
va
ge
i
Pa
rac
on
ge
r p
ap
oin
ti
“N
eo
by
thit
ino
rum
”
su
bre
gu
lari
s
Gly
pto
ph
idiu
m p
oll
i
offshore
Lit
ho
str
at.
Bru
ssels
sand
Tie
ne
nG
ent-
Bru
gge
Hyon
Aalter
Ko
rtrijk
cla
yT
ielt
Orchies
Ag
e (
Ma
)
48
49
50
51
52
53
54
55
56
barren
ENGLAND
GE
RM
AN
Y
BELGIUM
N
FRANCE
IV
upper bathyalanoxic, muddy
III
shallow marine sands
I
continental deposits
early Ypresian coastline(~ 53 Ma)
BRUSSELS
PARIS
II
THE NETHERLANDS
infra- to circalittoral oxic, muddy
LUXEM-BOURG
ENGLAND
0 40 80km
GE
RM
AN
Y
BELGIUM
N
FRANCEPARIS
IIIoxic, muddy
I
continental deposits
late Ypresiancoastline(~ 50 Ma)
II
BRUSSELS
THE NETHERLANDS
LUXEM-BOURG
shoreface sands& infralittoral clays
ENGLAND
GE
RM
AN
Y
BELGIUM
N
FRANCE
PARIS
I
continental and brackish deposits
earliest YpresianTienen Fm. distribution
(~ 55 Ma)
BRUSSELS
THE NETHERLANDS
LUXEM-BOURG
continentalI
0 40 80km
0 40 80km
D
C
B
A
Figure 1. Stratigraphic and paleogeographic framework of Ypresian deposits in the Belgian Basin. A) Sequence stratigraphic chart modified after Vandenberghe et al. (2004), according to the time scale of Hardenbol et al. (1998). Dark grey infillings: continental deposits; middle grey: mainly sand deposits; light grey; mainly clay to silt deposits; vertical hatching: schematic representation of the eroded incisions. Otolith sampling is indicated by black triangles. The ranges of the species used are plotted on the right (thick line: abundant; dotted line: no record due to decalcification). B-C-D) Paleogeographic facies maps are modified after Steurbaut (2006) and Van Eetvelde & Dupuis (2004) and represent the Belgian Basin and surroundings at the onset of the Ypresian (B), during the early to middle Ypresian (C) and the EECO interval respectively (D).

146 D. VanHOVE, P. StaSSEn, r. P. SPEIJEr & E. StEUrbaUt
dominate the Ypresian fauna. There is a shift in abundance patterns of individual species corresponding to the transition of the lower to upper succession of Ypresian sediments (see section 2). The lower Ypresian is characterized by an acme and dominance (up to 90 % of the fauna) of Glyptophidium polli, and the upper Ypresian by its general absence and the frequent occurrence of “Neobythitinorum” subregularis. The fish fauna of the Egem Sand Formation is the most diverse of the Belgian Ypresian. The samples selected for this study are represented by four species belonging to two families: Paraconger papointi and P. sauvagei of the family Congridae; Glyptophidium polli and the extinct genus and species “Neobythitinorum” subregularis of the family Ophidiidae (Fig. 2A-B-C-D). Their ranges and relative abundances are plotted on Fig. 1A. They were selected
from the well-documented and taxonomically up-to-date otolith collection of the Royal Belgian Institute of Natural Sciences (RBINS), Brussels, curated by Dirk Nolf. The selected otoliths have been collected during the second half of the 20th century, at six different localities within the Belgian Basin (Table 1), some of them remaining accessible today. The sampled units are the Mons-en-Pévèle Formation, two coquinas (‘faluns I and II’) of the Egem Sand Member, the Panisel Sand Member and the Aalter Sand Formation (Fig. 1A, Table 1).
3.2. Methods
During selection, attention has been paid to their size, because larger otoliths normally contain more increments than smaller ones. First the external preservation state of
Figure 2. A-B-C-D) Otolith species used in this study; A) Paraconger sauvagei, B) Paraconger papointi, C) “Neobythiti-norum” sub-regularis, D) Glyptophidium polli. E) Polished P. papointi from the Panisel Sand Member with visible in-crements, F) incremental and total and inner bulk microsampling of a P. papointi from the Panisel Sand Member, G) cold cathode luminescence image of a P. papointi from the Egem Sand Member after microsam-pling, H) SEM image of a partly broken P. pa-pointi from the Egem Sand Member.

PalEOtEmPEratUrE anD SEaSOnalIty DUrIng tHE EECO by mEanS Of fISH OtOlItH StablE O anD C ISOtOPES 147
all selected otoliths was assessed with optical microscopy. Five otoliths representing four stratigraphic levels and all species, except P. sauvagei, were crushed and analyzed for their X-ray diffraction (XRD) pattern by a Philips PW 1830 Generator (CuKα, 30 mA, 45 Kv, 15-55° detection), at the Department of Earth and Environmental Sciences (E&ES) of the K.U.Leuven. Comparison with standard patterns was performed by Topas Academic V4 software. Thirty otoliths were selected for bulk and incremental stable isotope analyses. For bulk analyses, this corresponds to an average of 2.7 otoliths per species per level. They were embedded in resin with a Beuhler SimpliMet 3000 Automatic Mounting Press (E&ES). This involves elevated pressure and temperature, which led in some cases to bursting of the otolith, but the duration is too short to have any effect on the isotopic composition of the otolith carbonate. Next the resulting resin stubs were polished on wetted sand paper (P150-P1200) until the sagittal plane (with visible nucleus) was reached (Fig. 2E). Although the transverse plane contains the most complete growth history of an otolith, the sagittal plane is less compressed and hence more suitable for incremental sampling (Panella, 1980a; Van Neer et al., 2004).
After this preparation procedure, otoliths were ready for microsampling and the evaluation of possible diagenetic alterations by cold cathodoluminescence. The latter has been applied on eleven stubs representing all species and stratigraphic levels using a Technosyn Cold Kathodo Luminescence Model 8200 MKII at the E&ES. Given the prerequisite to be able to accurately define microsampling paths, a Merchantek MicroMill at the Stable Isotope Lab (SIL) of the Free University of Brussels was used. Total bulk sample (rim to core), inner bulk sample (200 µm from rim to core) and incremental sample
(always starting at the rim) paths were selected on a computer screen and automatically drilled with a Ø300 µm drill bit (Fig. 2F). As incremental paths become shorter towards the nucleus, drilling depth was set deeper in these paths, carefully avoiding contamination with earlier drilled paths (drill bit is thicker than increment path widths). The fact that the sagittal plane is slightly bulged (Panella, 1980b) has been ignored. Application of this working-method allowed an average number of 12 increment paths to be drilled per otolith. One otolith that partly crumbled off during drilling was used for ultrastructural investigation by a JSM-6400 Scanning Electron Microscope (SEM) at the E&ES.
The powder resulting from drilling was manually collected in glass tubes and stored in a 50 °C oven to avoid moisture. This procedure does not affect the isotope signature (see Guiguer et al., 2003). Average microsample weight is estimated at ca. 70 µg, based on the calculated microsample volumes and including an assumed 30 % loss of powder during its collection. Following an average residence time of 25 days in the oven, the microsamples were analyzed for their oxygen and carbon isotopic content in a ThermoFinnigan Kiel (III) automated carbonate extraction device (reaction with 70 °C phosphoric acid, see Hoefs, 1997), coupled to a ThermoFinnigan DeltaplusXL isotope ratio mass spectrometer at the SIL. During each analysis run, in-house MAR2 standards (calibrated with NBS-19) have been measured to calculate analysis precision. The obtained precision was a standard deviation of 0.06 ‰ for δ13C and 0.18 ‰ for δ18O. The results were corrected for the number of gas expansions that have been made during the acid reaction in the Kiel, and are always reported in δ-notation, relative to VPDB.
Table 1. Bulk δ18O and δ13C results, ages and stratigraphic information of the otoliths used in this study.

148 D. VanHOVE, P. StaSSEn, r. P. SPEIJEr & E. StEUrbaUt
Paleotemperatures were calculated with the equation established by Thorrold et al. (1997): 1000*lnα = 18.56*10³*(T K-1) – 32.54 with α = (δ18Ootolith + 1000)/(δ18Owater + 1000). This equation is used because it is derived from a bottom-dwelling tropical to subtropical shelf species (Micropogonias undulatus; Lassuy, 1983), that was reared under controlled environmental conditions. For the conversion of the VSMOW standard for water to VPDB, the equation δ18O(VSMOW) = 1.03091*δ18O(VPDB) + 30.91 (Coplen et al., 1983) was used. To discriminate between groups of data, statistical analyses were performed with Statistica 8.0 (StatSoft). First Levene’s test was applied to test equality of variances (p ≤ 0.05 in all tests used in this study). If so, the unpaired t-test was used to test whether or not the means of the groups differ significantly. If not, this was achieved with the Welch test (adapted t-test for unequal variances).
4. Results and Discussion
4.1. Preservation of the selected otoliths
Otoliths are generally composed of radial elongated crystals of aragonite (Panella, 1980a), and a small percentage (0.2-10 %) of organic material, called the otoline (Nolf, 1985; Campana, 1999). The otoline contains glycoproteins and other macromolecules, which apparently play a pivotal role in the carbonate biomineralization process (Campana, 1999). In aberrant otoliths, the precipitated carbonate polymorph is principally vaterite, or otherwise calcite (Nolf, 1985; Tomás & Geffen, 2003; Falini et al., 2005). Their occurrence also seems to be influenced by the macromolecules involved during crystallization (Falini et al., 2005). Often, in the case of vaterite, this polymorph constitutes only part of the otolith, with a sharp delineation between the vaterite and aragonite phase. In the more primitive taxa, such as the Anguiliformes (including the Congridae), vaterite is more frequently present (Nolf, 1985).
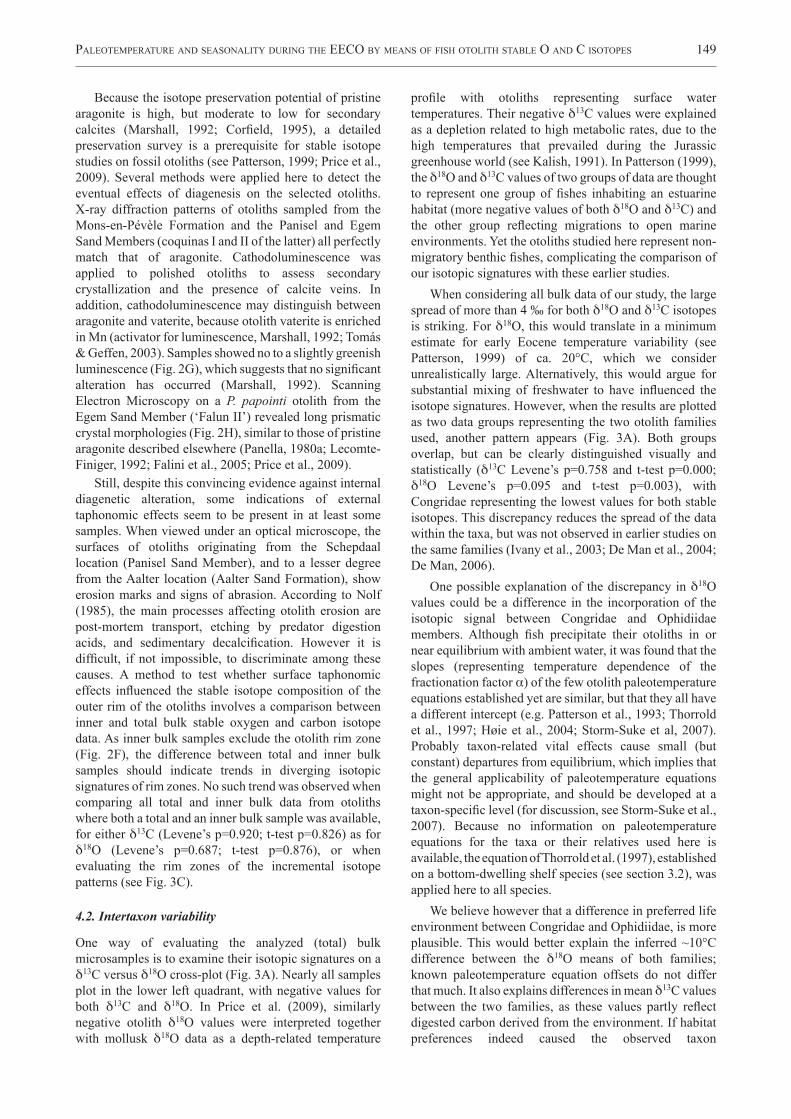
Figure 3. A) δ18O and δ13C cross-plot of the families Congridae and Ophidiidae, based on the data in Table 1, with modern relatives of both families depicted. B) Comparison of otolith mean summer temperatures (MST) with the latitudinal TEX86 sea surface temperature (SST) gradient for the Ypresian established by Bijl et al. (2009). Otolith temperatures were calculated using the Thorrold et al. (1997) equation and assuming a δ18Osw of -1.0 ‰, for both the Congrid and Ophidiid data. C) Incremental stable isotope pattern of a Paraconger papointi from the Egem Sand Member.
PalEOtEmPEratUrE anD SEaSOnalIty DUrIng tHE EECO by mEanS Of fISH OtOlItH StablE O anD C ISOtOPES 149
Because the isotope preservation potential of pristine aragonite is high, but moderate to low for secondary calcites (Marshall, 1992; Corfield, 1995), a detailed preservation survey is a prerequisite for stable isotope studies on fossil otoliths (see Patterson, 1999; Price et al., 2009). Several methods were applied here to detect the eventual effects of diagenesis on the selected otoliths. X-ray diffraction patterns of otoliths sampled from the Mons-en-Pévèle Formation and the Panisel and Egem Sand Members (coquinas I and II of the latter) all perfectly match that of aragonite. Cathodoluminescence was applied to polished otoliths to assess secondary crystallization and the presence of calcite veins. In addition, cathodoluminescence may distinguish between aragonite and vaterite, because otolith vaterite is enriched in Mn (activator for luminescence, Marshall, 1992; Tomás & Geffen, 2003). Samples showed no to a slightly greenish luminescence (Fig. 2G), which suggests that no significant alteration has occurred (Marshall, 1992). Scanning Electron Microscopy on a P. papointi otolith from the Egem Sand Member (‘Falun II’) revealed long prismatic crystal morphologies (Fig. 2H), similar to those of pristine aragonite described elsewhere (Panella, 1980a; Lecomte-Finiger, 1992; Falini et al., 2005; Price et al., 2009).
Still, despite this convincing evidence against internal diagenetic alteration, some indications of external taphonomic effects seem to be present in at least some samples. When viewed under an optical microscope, the surfaces of otoliths originating from the Schepdaal location (Panisel Sand Member), and to a lesser degree from the Aalter location (Aalter Sand Formation), show erosion marks and signs of abrasion. According to Nolf (1985), the main processes affecting otolith erosion are post-mortem transport, etching by predator digestion acids, and sedimentary decalcification. However it is difficult, if not impossible, to discriminate among these causes. A method to test whether surface taphonomic effects influenced the stable isotope composition of the outer rim of the otoliths involves a comparison between inner and total bulk stable oxygen and carbon isotope data. As inner bulk samples exclude the otolith rim zone (Fig. 2F), the difference between total and inner bulk samples should indicate trends in diverging isotopic signatures of rim zones. No such trend was observed when comparing all total and inner bulk data from otoliths where both a total and an inner bulk sample was available, for either δ13C (Levene’s p=0.920; t-test p=0.826) as for δ18O (Levene’s p=0.687; t-test p=0.876), or when evaluating the rim zones of the incremental isotope patterns (see Fig. 3C).
4.2. Intertaxon variability
One way of evaluating the analyzed (total) bulk microsamples is to examine their isotopic signatures on a δ13C versus δ18O cross-plot (Fig. 3A). Nearly all samples plot in the lower left quadrant, with negative values for both δ13C and δ18O. In Price et al. (2009), similarly negative otolith δ18O values were interpreted together with mollusk δ18O data as a depth-related temperature
profile with otoliths representing surface water temperatures. Their negative δ13C values were explained as a depletion related to high metabolic rates, due to the high temperatures that prevailed during the Jurassic greenhouse world (see Kalish, 1991). In Patterson (1999), the δ18O and δ13C values of two groups of data are thought to represent one group of fishes inhabiting an estuarine habitat (more negative values of both δ18O and δ13C) and the other group reflecting migrations to open marine environments. Yet the otoliths studied here represent non-migratory benthic fishes, complicating the comparison of our isotopic signatures with these earlier studies.
When considering all bulk data of our study, the large spread of more than 4 ‰ for both δ18O and δ13C isotopes is striking. For δ18O, this would translate in a minimum estimate for early Eocene temperature variability (see Patterson, 1999) of ca. 20°C, which we consider unrealistically large. Alternatively, this would argue for substantial mixing of freshwater to have influenced the isotope signatures. However, when the results are plotted as two data groups representing the two otolith families used, another pattern appears (Fig. 3A). Both groups overlap, but can be clearly distinguished visually and statistically (δ13C Levene’s p=0.758 and t-test p=0.000; δ18O Levene’s p=0.095 and t-test p=0.003), with Congridae representing the lowest values for both stable isotopes. This discrepancy reduces the spread of the data within the taxa, but was not observed in earlier studies on the same families (Ivany et al., 2003; De Man et al., 2004; De Man, 2006).
One possible explanation of the discrepancy in δ18O values could be a difference in the incorporation of the isotopic signal between Congridae and Ophidiidae members. Although fish precipitate their otoliths in or near equilibrium with ambient water, it was found that the slopes (representing temperature dependence of the fractionation factor α) of the few otolith paleotemperature equations established yet are similar, but that they all have a different intercept (e.g. Patterson et al., 1993; Thorrold et al., 1997; Høie et al., 2004; Storm-Suke et al, 2007). Probably taxon-related vital effects cause small (but constant) departures from equilibrium, which implies that the general applicability of paleotemperature equations might not be appropriate, and should be developed at a taxon-specific level (for discussion, see Storm-Suke et al., 2007). Because no information on paleotemperature equations for the taxa or their relatives used here is available, the equation of Thorrold et al. (1997), established on a bottom-dwelling shelf species (see section 3.2), was applied here to all species.
We believe however that a difference in preferred life environment between Congridae and Ophidiidae, is more plausible. This would better explain the inferred ~10°C difference between the δ18O means of both families; known paleotemperature equation offsets do not differ that much. It also explains differences in mean δ13C values between the two families, as these values partly reflect digested carbon derived from the environment. If habitat preferences indeed caused the observed taxon

150 D. VanHOVE, P. StaSSEn, r. P. SPEIJEr & E. StEUrbaUt
inconsistency, and given that the temperature difference between different habitats would be rather small, then based on the more negative δ18O and δ13C values of Congridae, this family inhabited more coastal environments, sensitive to (seasonal) riverine freshwater influx. Today’s eastern North Sea near-shore zones are indeed characterized by depleted δ18Osw values (Harwood et al., 2008). Following the interpretation on similar data of Patterson et al. (1999) mentioned above, the Congridae data would even indicate estuarine conditions, but this is not supported by the sedimentological data (see section 2). Accordingly, the data of the Ophidiidae specimens point to a more offshore, fully marine environment, less prone to freshwater mixing.
This explanation does not contradict the fact that inter-taxon inconsistencies were not reported in earlier work (e.g. Ivany et al., 2003). It seems not unlikely that during the hothouse conditions of the EECO, elevated water temperatures or other environmental changes (e.g. changed runoff patterns) may have forced the Congridae and Ophidiidae species used in this study to diverge ecologically. Interpreted in this way, Ophidiidae isotopic data should yield a true bottom water temperature signal, while those of Congridae probably represent a composed signal of temperature and coastal water freshening.
One complication involved by this explanation is the co-occurrence of both isotopically delineated ecological groups in the same taphonomic setting. Note that modern relatives of both groups comprise benthopelagic species occupying a stationary life position when adult (Ivany et al., 2003). Two taphonomic elements could explain this complication. Firstly, most otoliths trapped in the sediment record derive from migratory predators (Nolf, 1995). This is based on the observation that in settings where both fish bones and otoliths are found (including the Belgian Eocene), almost no osteological remains belong to taxa that are represented by otolith occurrences. Instead, these remains belong to larger and predominantly predatory fishes, leading to the hypothesis that the major pathway through which otoliths enter a given taphonomic setting is via the secretion of predators (bones are preferentially digested with respect to otoliths). The foraging behavior of these predators could explain why different ecological groups occur in the same taphocoenosis. Secondly, many of the otoliths were probably transported shortly after deposition by (storm) wave action and currents before being definitively buried. Such transport is supported by the abrasion (roundedness) observed in many otoliths (Nolf, 1985; see section 4.1).
4.3. Sea-water oxygen isotope composition
In order to interpret the results in terms of temperature, a value for the isotopic composition of the Ypresian sea-water is required. Assuming an ice-free world, a mean value of -1.0 ‰ (VSMOW) was estimated for early Eocene oceanic δ18Osw by Shackleton and Kennett (1975) and Zachos et al. (1993, 1994). However, this value does not necessarily correspond to the δ18Osw of the Belgian Basin at that time, because of possible local influences on
sea-water salinity, and latitudinal and longitudinal gradients in oceanic δ18Osw (e.g. Zachos et al., 1994; Tindall et al., 2010). Previous discussions concerning stable isotope data of early middle Eocene Turritella and Venericardia bivalves from the Paris Basin (Andreasson and Schmitz, 1996) have highlighted the complexities involved when constraining past salinity of the southern North Sea Basin (Andreasson & Schmitz, 1996, 1997; Klein & Fricke, 1997; Purton & Brasier, 1997). Indeed, excluding the effects of local deviations in sea-water salinity has become a major challenge in stable isotope paleothermometry of marginal marine realms, forcing authors to reinterpret their data. For example, suspiciously negative δ18O values of early Eocene Venericardia bivalves from Alabama were corrected for supposed seasonal discharge of 18O-depleted rivers into the Gulf of Mexico (Ivany et al., 2004). Recently, Zacke et al. (2009) attributed some anomalously low apatite δ18O values of an early Paleogene shark-tooth record from the North Sea Basin, including samples from the Belgian Basin, to a temporary basin-wide surface water freshening. These authors proposed that during a ca. 3 myr period, starting before the onset of the Eocene, North Sea Basin δ18Osw was probably lowered by 2-3 ‰. This has been related by Zacke et al. (2009) to a temporary isolation of the North Sea Basin from the Atlantic, due to the combined effects of low relative sea-level, tectonism and basaltic magmatism at the end of the Paleocene. As mentioned above, the early to middle Ypresian was characterized by a transgressive phase (see section 2, Fig. 1C). During this phase, the northern North Sea Basin became reconnected with the Atlantic, and by the late Ypresian, surface water salinity was probably restored to normal early Eocene conditions (Zacke et al., 2009). In addition, a southwestern connection of the southern North Sea Basin with the Atlantic via the English Channel is indicated by the presence of Nummulites and Morozovella species in multiple upper Ypresian levels (King, 2006; see section 2). Based on these data no anomaly in fully marine δ18Osw values was present in the Belgian Basin during the EECO.
Only a few studies are available to constrain a realistic δ18Osw value for the Belgian Basin. Present-day values in the North Sea Basin are close to 0.0 ‰, varying roughly from west to east between 0.4 and -0.4 ‰ (LeGrande and Schmidt, 2006; Harwood et al., 2008). For the southernmost North Sea and the English Channel δ18Osw data are lacking. According to salinity studies, ocean water from the Atlantic is gradually mixed with less saline water while it moves northeastward through the Channel and enters the North Sea (Taylor et al., 1983; Jones and Howarth, 1995). This can be seen as an argument for an analogous gradient in δ18Osw compositions in these areas. Although the paleogeography of the North Sea region was somewhat different in the early Eocene compared with today (see section 2), a similar δ18Osw gradient probably prevailed during this period. The oceanic end member of this gradient is the early Eocene oceanic δ18Osw value at a paleolatitude of 45° N (Scotese et al., 1988). Zachos et al. (1994) established a paleolatitudinal correction for oceanic

PalEOtEmPEratUrE anD SEaSOnalIty DUrIng tHE EECO by mEanS Of fISH OtOlItH StablE O anD C ISOtOPES 151
δ18Osw values, as the use of one mean ocean value for all latitudes would underestimate temperatures at the tropics and overestimate temperatures at high-latitudes. Assuming a global mean ocean value of -1.0 ‰ for the early Eocene, this correction results in an adjusted latitudinal value of -0.8 ‰ at 45° N. Unfortunately, the Zachos et al. (1994) correction is based on recent surface seawater δ18O data and does not account for longitudinal variability. Other attempts have been made to estimate δ18Osw distributions of past oceans, by using isotope-enabled climate models (e.g. Roche et al., 2006; Roberts et al., 2009). Recently Tindall et al. (2010) used such a model to simulate temperatures and surface water δ18O during the early Eocene. Modeled values at 45° N are in the range of -0.2 to -1.0 ‰, and represent a relatively enriched northern Atlantic Ocean because restricted oceanic exchange between the Arctic and Atlantic Oceans was assumed. This agrees with the ‘closed’ scenario of the model of Roberts et al. (2009) for the early Paleogene, in which the Greenland-Norway seaway is closed. This scenario could help explain the occurrence of the low-salinity tolerant Azolla fern in the Arctic around 48-49 Ma, but a ‘closed’ scenario was possibly not the case during the earlier EECO interval. According to an ‘open’ scenario, oceanic δ18Osw at 45° N could have been as low as -1.5 ‰ (Roberts et al., 2009).
Given the uncertainties associated with these estimations of an oceanic δ18Osw end member, and given the gradient towards more negative δ18Osw values between the Atlantic and the North Sea, a δ18Osw value of -1.0 ‰ for the Belgian Basin is a reasonable estimate, keeping in mind that a change of 0.2 ‰ corresponds to ~1 °C. Hence, in this study, for the calculation of paleotemperatures of otoliths from the family Ophidiidae, which we believe to have inhabited fully marine environments (see section 4.2), we adopt a δ18Osw value of -1.0 ‰ (Table 1). For Congridae, we invoke sea-water freshening of near-shore zones to explain their low oxygen and carbon stable isotope data. As we have no means to estimate a certain coastal δ18Osw value, no paleotemperature series with adapted δ18Osw was calculated for Congrid stable isotope data. Thus, also a value of -1.0 ‰ for δ18Osw was used, which allows comparison with the Ophidiid data when expressed in terms of paleotemperatures.
4.4. Mean annual temperature variability during the EECO
From the above discussion it follows that the conversion of isotopic signatures to temperatures is not straightforward. Nevertheless, we believe to have good reasons to accept temperatures calculated from Ophidiid isotope data that can directly be compared to results from other studies. In Fig. 4, Congridae and Ophidiidae total bulk data and their means were plotted together with the benthic foraminiferal global deep-sea temperature record of Zachos et al. (2008) and recently published tropical (Pearson et al., 2007) and high-latitudinal (Bijl et al., 2009) TEX86 SST records.
During the EECO, Ophidiid mean annual temperatures varied between ~25 and ~31 °C, with a mean value of
27.5 °C, which is comparable to present-day mean temperatures in tropical regions. This suggests that during the EECO, bottom water temperatures of the Belgian Basin were on average 15 °C warmer than deep-sea temperatures. Considering the southern high-latitude SST data of Bijl et al. (2009), it seems acceptable that our bottom water data are on average slightly colder, particularly because TEX86 paleotemperatures are possibly biased towards summer temperatures (Bijl et al., 2009). When converted to the paleotemperature equation of Thorrold et al. (1997), the few Congridae otolith stable oxygen isotope data from the Ypresian U.S. Gulf Coast (30° N) are ~2 °C lower (Ivany et al., 2003) than our
Figure 4. Comparison of calculated paleotemperatures from Congrid and Ophidiid bulk δ18O analyses with deep-sea temperature data from benthic foraminifera δ18O analyses (Zachos et al., 2008 in Bijl et al., 2009) and TEX86 sea surface temperatures of the East Tasman Plateau (Bijl et al., 2009) and Tanzania (Pearson et al., 2007). Temperatures were calculated using the Thorrold et al. (1997) equation and assuming a δ18Osw of -1.0 ‰, for both the Congrid and Ophidiid data.

152 D. VanHOVE, P. StaSSEn, r. P. SPEIJEr & E. StEUrbaUt
Table 2. Incremental δ18O and δ13C results, ages and stratigraphic information of individual otoliths used in this study.

PalEOtEmPEratUrE anD SEaSOnalIty DUrIng tHE EECO by mEanS Of fISH OtOlItH StablE O anD C ISOtOPES 153
Belgian Basin temperatures. Consistently, Gulf Coast Venericardia bivalve and other mollusk stable isotope analyses suggest early Eocene temperatures of 26 °C (Ivany et al., 2004) and 26-27 °C (Kobashi et al., 2001). Given the presumably very low paleotemperature gradient during the early Eocene (Bijl et al., 2009; Fig. 3B), this is a small difference, and could reflect the more closed nature of the Belgian Basin in comparison to the Gulf Coast embayment. In fact, our data confirm that the (sub)tropical regions were very broad during the early Eocene (see section 4.5). Our data are also in line with otolith oxygen isotope data of the early middle Eocene Lede Sand Formation from the Belgian Basin (De Man et al., 2004). Converting those data to Thorrold et al. (1997), temperatures at about 3 myr after the end of the EECO approximated 26 °C. Our temperatures are at least 3.5 °C warmer than North Sea Basin bottom-water temperature estimates for the middle to late Ypresian based on shark teeth δ18O measurements (Table 3 in Zacke et al., 2009). However, the lower values of these measurements were not included in those temperature calculations, because they probably reflect a signal that is influenced by other factors than temperature variability, such as seasonal changes in salinity and fluvial discharge. On the other hand it is worth to mention that although they are derived from actively swimming Odontaspidid sharks, the only two samples from the upper Ypresian of the Belgian Basin used in Zacke et al. (2009) give temperature estimates of 28-30 °C, which is even warmer than our mean EECO value of 27.5 °C.
The variation in mean annual temperatures up to 6°C throughout the late Ypresian, can be explained by recent findings that the early Paleogene climate was more variable than previously thought. For example, δ18O measurements on single species deep-sea benthic foraminifera from Demerara Rise (tropical Atlantic), reveal variations in the order of 1 ‰ throughout the early to middle Eocene (Sexton et al., 2006). This variability as observed in deep-sea records should have been well expressed in mid-latitude marginal settings, because of their shallow and more diverse nature, subjected to local expressions of climate changes and seasonality. Since a large range of biota record this variability geochemically or through their assemblage patterns, these marginal environments may also be well suited to unravel early Paleogene climate variability (see section 1). Finally, the Congrid temperatures (Fig. 4) correspond to the early Eocene mean annual SST around the equator (Pearson et al., 2007). This confirms that paleotemperatures inferred from Congrids, assuming a δ18Osw of -1.0 ‰, are indeed too high to represent an unbiased temperature record, contrary to those of the Ophidiidae.
4.5. EECO seasonality
Fish and their otoliths, are known to grow continuously. Concentric growth patterns in the otolith aragonite have been observed representing even sub-daily growth cycles (e.g. Panella, 1980a). Seasonal variations in otoliths are visible by alternating opaque and translucent growth
rings. This seasonal pattern makes them well suited for studying intra-annual variations in stable isotope geochemistry. Counting and interpreting the visible growth increments can then be used to estimate the number of stable isotope analyses that cover yearly growth cycles. This control is needed because too few analyses will result in averaging of the isotopic signals.
Here, incremental analyses were performed to infer seasonality. The obtained resolution was on average four analyzed increments per year. The average age of the fish was two-three years. Otoliths sampled in this way show substantial variability in both oxygen and carbon stable isotopic signatures (Fig. 3C, Table 2). This variability is around 2.1 ‰ on average for both the Ophidiids and Congrids. As the Ophidiidae probably inhabited fully marine settings, their incremental isotope values are less affected by seasonal δ18Osw changes and represent temperature variability. Therefore, assuming a constant δ18Osw of -1.0 ‰ (see section 4.3), our best estimate for the average mean annual ranges of temperature (MART) during the EECO is ~9.5 °C. This finding agrees well with earlier research that the early Paleogene was not equable when concerning interannual variability (Andreasson & Schmitz, 1996, 2000; Kobashi et al., 2001; Ivany et al., 2003). Apparently, even during the EECO interval, a seasonal temperature contrast comparable to present-day seasonality in the North Sea prevailed (e.g. Lane & Prandle, 1996). Ophidiid mean summer temperatures, were found to be ~31 °C and winter temperatures ~21.5 °C on average. The mean Ophidiid summer temperatures are added as a single data point to the latitudinal SST gradient of Bijl et al. (2009), because this gradient may be biased towards summer temperatures (Fig. 3B). This supports the view that the latitudinal SST gradient during the early Eocene was lower than today’s gradient (Bijl et al., 2009; Fig. 3B).
For the Congrids, it is not possible to reliably infer seasonal temperature variability, as we have no estimation for near-shore δ18Osw values. In addition, we do not know whether the supposed mixing with δ18O-depleted waters was seasonal or continuous. If continuous, the Congrids experienced similar seasonal temperature contrasts as the Ophidiids during the EECO, since their incremental δ18O variability is the same. If not, then assuming that Congrid annual temperature contrasts would have been larger (rather than smaller) than those of Ophidiids, this would imply that the more shallow areas of the Belgian Basin were isotopically enriched during summer and depleted during winter.
5. Conclusions
Paleotemperature and paleoseasonality during the EECO interval in the Belgian Basin was inferred from otolith stable isotope data. An intertaxon difference was observed between the family Congridae and Ophidiidae. The Ophidiid data are thought to represent fully marine bottom water temperatures, while Congrids lived probably in more coastal waters influenced by freshwater mixing, leading to an overestimation of paleotemperatures. Mean

154 D. VanHOVE, P. StaSSEn, r. P. SPEIJEr & E. StEUrbaUt
annual temperature (MAT) during the EECO calculated from Ophidiidae is 27.5 °C. Even during the EECO, changes in MAT through time of up to 6 °C seem to have occurred. The average mean annual range of temperature is calculated at 9.5 °C. Our data also confirm that the early Eocene latitudinal paleotemperature gradient was lower than today’s gradient. These findings suggest that the high variability as observed in deep-sea records is also recorded in mid-latitude epicontinental basins. Because several calcareous intervals in the lower Paleogene of the Belgian Basin allow high-resolution sampling of otoliths, future analyses will undoubtedly increase our understanding about the nature of these variations. As a cautionary note, we have to keep in mind that the choice of the paleotemperature equation used, and the choice of a value for the sea-water isotopic composition, could possibly bias the temperature record with several degrees. Independent high-resolution salinity estimates for the southern North Sea Basin, and the establishment of a taxon-specific paleotemperature equation should rule out these assumptions in the future. Nevertheless, bridging the continent and the deep sea, our data highlight the importance of studying climate variability in marginal marine basins.
6. Acknowledgements
We are grateful to Herman Nijs for his help during sample preparation, and Rémy Mas, Antoine van de Maele and Philippe Claeys (VUB) for their support and supervising during microsample drilling and stable isotope analyses at the SIL. We thank Linda Ivany and Gregory Price for their constructive reviews, which improved this paper. This research was supported by FWO – Research Foundation Flanders and the K.U.Leuven Research Fund. D.V. acknowledges the support of a grant of the Institute for the Promotion of Innovation through Science and Technology in Flanders (IWT-Vlaanderen).
7. References
AGNINI, C., MACRI, P., BACKMAN, J., BRINKHUIS, H., FORNACIARI, E., GIUSBERTI, L., LUCIANI, V., RIO, D., SLUIJS, A. and SPERANZA, F., 2009. An early Eocene carbon cycle perturbation at ~52.5 Ma in the Southern Alps: Chronology and biotic response. Paleoceanography, 24: PA2209.
ANDREASSON, F.P., SCHMITZ, B., 1996. Winter and summer temperatures of the early middle Eocene of France from Turritella δ18O profiles. Geology, 24(12): 1067-1070.
ANDREASSON, F.P., SCHMITZ, B., 1997. Winter and summer temperatures of the early middle Eocene of France from Turritella δ18O profiles: Reply. Geology, 25(10): 958-960.
ANDRUS, C.F.T., CROWE, D.E., SANDWEISS, D.H., REITZ, E.J., ROMANEK, C.S., 2002. Otolith δ18O record of mid-Holocene sea surface temperatures in Peru. Science, 295(5559): 1508-1511.
BIJL, P.K., SCHOUTEN, S., SLUIJS, A., REICHART, G.J., ZACHOS, J.C., BRINKHUIS, H., 2009. Early Palaeogene temperature evolution of the southwest Pacific Ocean. Nature, 461(7265): 776-779.
CAMPANA, S.E., 1999. Chemistry and composition of fish otoliths: pathways, mechanisms and applications. Marine Ecology-Progress Series, 188: 263-297.
COPLEN, T.B., KENDALL, C., HOPPLE, J., 1983. Comparison of stable isotope reference samples. Nature, 302(5905): 236-238.
CORFIELD, R.M., 1995. An introduction to the techniques, limitations and landmarks of carbonate oxygen isotope palaeothermometry. In Bosence, D. W., Allison, P. A. (eds) Marine Palaeoenvironmental Analysis from fossils. Geological Society Special Publication 83, Geological Society of London, London, 27-42.
CRAMER, B. S., WRIGHT, J. D., KENT, D. V., AUBRY, M. P., 2003. Orbital climate forcing of δ13C excursions in the late Paleocene-early Eocene (chrons C24n-C25n). Paleoceanography 18(4): 1097.
DE MAN, E., 2006. Benthic foraminifera biofacies analysis and stable isotopes of the middle Eocene to Oligocene successions in the southern North Sea Basin. Tools for stratigraphy and for reconstruction of extreme climate changes, PhD thesis, Leuven.
DE MAN, E., IVANY, L., VANDENBERGHE, N., 2004. Stable oxygen isotope record of the Eocene-Oligocene transition in the southern North Sea Basin: positioning the Oi-1 event. Netherlands Journal of Geosciences, 83(3): 193-197.
FALINI, G., FERMANI, S., VANZO, S., MILETIC, M., ZAFFINO, G., 2005. Influence on the formation of aragonite or vaterite by otolith macromolecules. European Journal of Inorganic Chemistry, 2005(1): 162-167.
GUIGUER, K.R.R.A., DRIMMIE, R., POWER, M., 2003. Validating methods for measuring δ18O and δ13C in otoliths from freshwater fish. Rapid Communications in Mass Spectrometry, 17(5): 463-471.
HARDENBOL, J., THIERRY, J., FARLEY, M.B., JACQUIN, T., DE GRACIANSKY, P.C., VAIL, P.R., 1998. Mesozoic and Cenozoic sequence chronostratigraphic framework of European basins. In de Graciansky, P. C., Hardenbol, J., Jacquin, T., Vail, P. R. (eds) Mesozoic and Cenozoic Sequence Stratigraphy of European Basins. SEPM Special Publication 60, SEPM (Society for Sedimentary Geology), 3-13.
HARWOOD, A. J. P., DENNIS, P. F., MARCA, A. D., PILLING, G. M., MILLNER, R. S., 2008. The oxygen isotope composition of water masses within the North Sea. Estuarine Coastal and Shelf Science 78(2): 353-359.
HENRIET, J. P., DE BATIST, M., VAN VAERENBERGH, W., VERSCHUREN, M., 1991. Seismic facies and clay tectonic features of the Ypresian clay in the southern North Sea. In Dupuis, C., De Coninck, J., Steurbaut, E. (eds) The Ypresian Stratotype. Bulletin de la Société belge de Géologie 97(3-4): 457-472.

PalEOtEmPEratUrE anD SEaSOnalIty DUrIng tHE EECO by mEanS Of fISH OtOlItH StablE O anD C ISOtOPES 155
HOEFS, J., 1997. Stable Isotope Geochemistry, Springer, Berlin, 201 pp.
HOIE, H., OTTERLEI, E., FOLKVORD, A., 2004. Temperature-dependent fractionation of stable oxygen isotopes in otoliths of juvenile cod (Gadus morhua L.). ICES Journal of Marine Science, 61(2): 243-251.
IACUMIN, P., BIANUCCI, G., LONGINELLI, A., 1992. Oxygen and carbon isotopic composition of fish otoliths. Marine Biology, 113(4): 537-542.
IVANY, L.C., LOHMANN, K.C., PATTERSON, W.P., 2003. Paleogene temperature history of the US Gulf Coastal Plain inferred from fossil otoliths. In Prothero, D., Ivany, L. C., Nesbitt, E. (eds) From Greenhouse to Icehouse: The Marine Eocene-Oligocene Transition. Columbia University Press, New York, 232-251.
IVANY, L.C., PATTERSON, W.P., LOHMANN, K.C., 2000. Cooler winters as a possible cause of mass extinctions at the Eocene/Oligocene boundary. Nature, 407(6806): 887-890.
IVANY, L.C., WILKINSON, B.H., LOHMANN, K.C., JOHNSON, E.R., MCELROY, B.J., COHEN, G.J., 2004. Intra-annual isotopic variation in Venericardia bivalves: Implications for early Eocene temperature, seasonality, and salinity on the US Gulf Coast. Journal of Sedimentary Research, 74(1): 7-19.
JONES, J. E., HOWARTH, M. J., 1995. Salinity models of the southern North Sea. Continental Shelf Research 15(6): 705-727.
KALISH, J.M., 1991. δ13C and δ18O isotopic disequilibria in fish otoliths - metabolic and kinetic effects. Marine Ecology-Progress Series, 75(2-3): 191-203.
KENT, D.V., MUTTONI, G., 2008. Equatorial convergence of India and early Cenozoic climate trends. Proceedings of the National Academy of Sciences of the United States of America, 105(42): 16065-16070.
KING, C., 2006. Paleogene and Neogene: uplift and a cooling climate. In Duff, P. M., Brenchley, P. J., Franklin, R. P. (eds) The geology of England and Wales. Geological Society of London, London, 395-428.
KLEIN, R.T., FRICKE, H.C., 1997. Winter and summer temperatures of the early middle Eocene of France from Turritella δ18O profiles: Comment. Geology, 25(10): 957-958.
KOBASHI, T., GROSSMAN, E.L., YANCEY, T.E., DOCKERY, D.T., 2001. Reevaluation of conflicting Eocene tropical temperature estimates: Molluskan oxygen isotope evidence for warm low latitudes. Geology, 29(11): 983-986.
LANE, A., PRANDLE, D., 1996. Inter-annual variability in the temperature of the North Sea. Continental Shelf Research, 16(11): 1489-1507.
LASSUY, D. R., 1983. Species profiles: life histories and environmental requirements (Gulf of Mexico): Atlantic croaker. U.S. Fish and Wildlife Service Biological Report FWS/OBS 82(11.3): 12 pp.
LECOMTE-FINIGER, R., 1992. The crystalline ultrastructure of otoliths of the Eel (A. anguilla L. 1758). Journal of Fish Biology, 40(2): 181-190.
LEGRANDE, A. N., SCHMIDT, G. A., 2006. Global gridded data set of the oxygen isotopic composition in seawater. Geophysical Research Letters 33(12): L12604.
LOURENS, L.J., SLUIJS, A., KROON, D., ZACHOS, J.C., THOMAS, E., ROHL, U., BOWLES, J., RAFFI, I., 2005. Astronomical pacing of late Palaeocene to early Eocene global warming events. Nature, 435(7045): 1083-1087.
LYELL, C., 1852. On the Tertiary strata of Belgium and French Flanders. The Quarterly Journal of the Geological Society of London, 8: 277-371.
MARKWICK, P.J., 1998. Fossil crocodilians as indicators of late Cretaceous and Cenozoic climates: implications for using palaeontological data in reconstructing palaeoclimate. Palaeogeography Palaeoclimatology Palaeoecology, 137(3-4): 205-271.
MARKWICK, P.J., 2007. The palaeogeographic and palaeoclimatic significance of climate proxies for data-model comparisons. In Williams, M., Haywood, A. M., Gregory, F. J., Schmidt, D. N. (eds) Deep-Time Perspectives on Climate Change: Marrying the Signal from Computer Models and Biological Proxies. The Micropaleontological Society, London, 251-312.
MARSHALL, J.D., 1992. Climatic and oceanographic isotopic signals from the carbonate rock record and their preservation. Geological Magazine, 129(2): 143-160.
MERCIER-CASTIAUX, M., DUPUIS, C., 1991. Clay mineral associations in the Ypresian formations in the NW European Basin. Time and geographical variations - interpretations. In Dupuis, C., De Coninck, J., Steurbaut, E. (eds) The Ypresian Stratotype. Bulletin de la Société belge de Géologie, 97(3-4): 441-450.
MILLER, K.G., KOMINZ, M.A., BROWNING, J.V., WRIGHT, J.D., MOUNTAIN, G.S., KATZ, M.E., SUGARMAN, P.J., CRAMER, B.S., CHRISTIE-BLICK, N., PEKAR, S.F., 2005. The phanerozoic record of global sea-level change. Science, 310(5752): 1293-1298.
MURRAY, J.W., 1992. Palaeogene and Neogene. In Cope, J. C. W., Ingham, J. K., Rawson, P. F. (eds) Atlas of Palaeogeography and Lithofacies. Geological Society of London, London, Memoirs 13, 141-147.
NEAL, J.E., 1996. A summary of Paleogene sequence stratigraphy in northwest Europe and the North Sea. In Knox, R. W. O. B., Corfield, R. M., Dunay, R. E. (eds) Correlation of the Early Paleogene in Northwest Europe. Geological Society Special Publication 101, Geological Society of London, London, 15-42.
NOLF, D., 1985. Otolithi Piscium, Gustav Fischer Verlag, Stuttgart, 145 pp.
NOLF, D., 1995. Studies on fossil otoliths - The state of the art. Recent Developments in Fish Otolith Research, 1995(19): 513-544.

156 D. VanHOVE, P. StaSSEn, r. P. SPEIJEr & E. StEUrbaUt
PANNELLA, G., 1980a. Growth patterns in fish sagittae. In Rhoads, D. C., Lutz, R. A. (eds) Skeletal Growth of Aquatic Organisms. Plenum Press, New York, 519-560.
PANNELLA, G., 1980b. Methods of preparing fish sagittae for the study of growth patterns. In Rhoads, D. C., Lutz, R. A. (eds) Skeletal Growth of Aquatic Organisms. Plenum Press, New York, 619-624.
PATTERSON, W.P., 1998. North American continental seasonality during the last millennium: high-resolution analysis of sagittal otoliths. Palaeogeography Palaeoclimatology Palaeoecology, 138(1-4): 271-303.
PATTERSON, W.P., 1999. Oldest isotopically characterized fish otoliths provide insight to Jurassic continental climate of Europe. Geology, 27(3): 199-202.
PATTERSON, W.P., SMITH, G.R., LOHMANN, K.C., 1993. Continental paleothermometry and seasonality using the isotopic composition of aragonitic otoliths of freshwater fishes. Geophysical Monographs, 78: 191-202.
PEARSON, P.N., PALMER, M.R., 2000. Atmospheric carbon dioxide concentrations over the past 60 million years. Nature, 406(6797): 695-699.
PEARSON, P.N., VAN DONGEN, B.E., NICHOLAS, C.J., PANCOST, R.D., SCHOUTEN, S., SINGANO, J.M., WADE, B.S., 2007. Stable warm tropical climate through the Eocene epoch. Geology, 35(3): 211-214.
PRICE, G.D., WILKINSON, D., HART, M.B., PAGE, K.N., GRIMES, S.T., 2009. Isotopic analysis of coexisting late Jurassic fish otoliths and mollusks: Implications for upper-ocean water temperature estimates. Geology, 37(3): 215-218.
PURTON, L.M.A., BRASIER, M.D., 1997. Winter and summer temperatures of the early middle Eocene of France from Turritella δ18O profiles: Comment. Geology, 25(10): 958-958.
RETALLACK, G.J., 2001. A 300-million-year record of atmospheric carbon dioxide from fossil plant cuticles. Nature, 411(6835): 287-290.
ROBERT, C., CHAMLEY, H., 1991. Development of early Eocene warm climates, as inferred from clay mineral variations in oceanic sediments. Global and Planetary Change, 89(4): 315-331.
ROBERTS, C. D., LEGRANDE, A. N., TRIPATI, A. K., 2009. Climate sensitivity to Arctic seaway restriction during the early Paleogene. Earth and Planetary Science Letters 286(3-4): 576-585.
ROCHE, D. M., DONNADIEU, Y., PUCEAT, E., PAILLARD, D., 2006. Effect of changes in δ18O content of the surface ocean on estimated sea surface temperatures in past warm climate. Paleoceanography 21(2): PA2023.
ROCHE, E., 1991. Sporopollinic biostratigraphy and Ypresian paleoenvironment. In Dupuis, C., De Coninck, J., Steurbaut, E. (eds) The Ypresian Stratotype. Bulletin de la Société belge de Géologie, 97(3-4): 373-383.
SCHEIBNER, C., SPEIJER, R.P., 2008. Late Paleocene-early Eocene Tethyan carbonate platform evolution - A response to long- and short-term paleoclimatic change. Earth-Science Reviews, 90(3-4): 71-102.
SCHWARCZ, H.P., GAO, Y., CAMPANA, S., BROWNE, D., KNYF, M., BRAND, U., 1998. Stable carbon isotope variations in otoliths of Atlantic cod (Gadus morhua). Canadian Journal of Fisheries and Aquatic Sciences, 55(8): 1798-1806.
SCOTESE, C. R., GAHAGAN, L. M., LARSON, R. L., 1988. Plate tectonic reconstructions of the Cretaceous and Cenozoic ocean basins. Tectonophysics 155(1-4): 27-48.
SEXTON, P. F., WILSON, P. A., NORRIS, R., 2006. Testing the Cenozoic multisite composite δ18O and δ13C curves: New monospecific Eocene records from a single locality, Demerara Rise (Ocean Drilling Program Leg 207). Paleoceanography 21: PA2019.
SHACKLETON, N.J., KENNETT, J.P., 1975. Paleotemperature history of the Cenozoic and the initiation of Antarctic glaciation, oxygen and carbon isotope analyses in DSDP sites 277, 279 and 281. Initial Reports of the Deep Sea Drilling Project, 29: 743-755.
STEURBAUT, E., 1998. High-resolution holostratigraphy of middle Paleocene to early Eocene strata in Belgium and adjacent areas. Paläontographica Abteilung A, 247(5-6): 91-156.
STEURBAUT, E., 2006. Ypresian. In Dejonghe, L. (ed.) Current status of chronostratigraphic units named from Belgium and adjacent areas. Geologica Belgica, 9(1-2): 73-93.
STEURBAUT, E., NOLF, D., 1991. Ypresian Teleost otoliths from Belgium and northwestern France. In Dupuis, C., De Coninck, J., Steurbaut, E. (eds) The Ypresian Stratotype. Bulletin de la Société belge de Géologie, 97(3-4): 321-347.
STEURBAUT, E., MAGIONCALDA, R., DUPUIS, C., VAN SIMAEYS, S., ROCHE, E., ROCHE, M., 2003. Palynology, paleoenvironments, and organic carbon isotope evolution in lagoonal Paleocene-Eocene boundary settings in North Belgium. In Wing, S. L., Gingerich, P. D., Schmitz, B., Thomas, E. (eds) Causes and Consequences of Globally Warm Climates in the Early Paleogene. Geological Society of America Special Paper 369, Geological Society of America, Boulder, Colorado, 291-317.
STORM-SUKE, A., DEMPSON, J.B., REIST, J.D., POWER, M., 2007. A field-derived oxygen isotope fractionation equation for Salvelinus species. Rapid Communications in Mass Spectrometry, 21(24): 4109-4116.
TAJIKA, E., 1998. Climate change during the last 150 million years: reconstruction from a carbon cycle model. Earth and Planetary Science Letters, 160(3-4): 695-707.
TAYLOR, A. H., REID, P. C., MARSH, T. J., STEPHENS, J. A., JONAS, T. D., 1983. Year-to-year changes in the salinity of the southern North Sea, 1948-1973: a budget. In Sündermann, J., Lenz, W. (eds) North Sea Dynamics. Springer-Verlag, Berlin, 200-219.

PalEOtEmPEratUrE anD SEaSOnalIty DUrIng tHE EECO by mEanS Of fISH OtOlItH StablE O anD C ISOtOPES 157
THORROLD, S.R., CAMPANA, S.E., JONES, C.M., SWART, P.K., 1997. Factors determining δ13C and δ18O fractionation in aragonitic otoliths of marine fish. Geochimica et Cosmochimica Acta, 61(14): 2909-2919.
TINDALL, J., FLECKER, R., VALDES, P., SCHMIDT, D. N., MARKWICK, P., HARRIS, J., 2010. Modelling the oxygen isotope distribution of ancient seawater using a coupled ocean-atmosphere GCM: Implications for reconstructing early Eocene climate. Earth and Planetary Science Letters, 292(3-4): 265-273.
TOMAS, J., GEFFEN, A.J., 2003. Morphometry and composition of aragonite and vaterite otoliths of deformed laboratory reared juvenile herring from two populations. Journal of Fish Biology, 63(6): 1383-1401.
VANDENBERGHE, N., LAGA, P., STEURBAUT, E., HARDENBOL, J., VAIL, P.R., 1998. Tertiary sequence stratigraphy at the southern border of the North Sea Basin in Belgian. In de Graciansky, P. C., Hardenbol, J., Jacquin, T., Vail, P. R. (eds) Mesozoic and Cenozoic Sequence Stratigraphy of European Basins. SEPM Special Publication 60, SEPM (Society for Sedimentary Geology), 119-154.
VANDENBERGHE, N., VAN SIMAEYS, S., STEURBAUT, E., JAGT, J.W.M., FELDER, P.J., 2004. Stratigraphic architecture of the upper Cretaceous and Cenozoic along the southern border of the North Sea Basin in Belgium. Netherlands Journal of Geosciences, 83(3): 155-171.
VAN EETVELDE, Y., DUPUIS, C., CORNET, C., 2004. Pyritized diatoms: a good fossil marker in the upper Paleocene-lower Eocene sediments from the Belgian and Dieppe-Hampshire Basins. Netherlands Journal of Geosciences, 83(3): 173-178.
VAN NEER, W., ERVYNCK, A., BOLLE, L.J., MILLNER, R.S., 2004. Seasonality only works in certain parts of the year: The reconstruction of fishing seasons through otolith analysis. International Journal of Osteoarchaeology, 14(6): 457-474.
VAN SIMAEYS, S., VANDENBERGHE, N., STEURBAUT, E., 2003. The Early Eocene Climatic Optimum: Evidence from high-resolution dinoflagellate cyst biostratigraphy. Symposium on the Paleogene - Preparing for Modern Life and Climate, 25-30 August 2003, Leuven, Belgium. Abstract and Program Book, 77.
WALLMANN, K., 2001. Controls on the Cretaceous and Cenozoic evolution of seawater composition, atmospheric CO2 and climate. Geochimica et Cosmochimica Acta, 65(18): 3005-3025.
WEIDMAN, C.R., MILLNER, R., 2000. High-resolution stable isotope records from North Atlantic cod. Fisheries Research, 46(1-3): 327-342.
WESTERHOLD, T., ROHL, U., 2009. High resolution cyclostratigraphy of the early Eocene - new insights into the origin of the Cenozoic cooling trend. Climate of the Past, 5(3): 309-327.
WESTERHOLD, T., ROHL, U., RAFFI, I., FORNACIARI, E., MONECHI, S., REALE, V., BOWLES, J., EVANS, H.F., 2008. Astronomical calibration of the Paleocene time. Palaeogeography Palaeoclimatology Palaeoecology, 257(4): 377-403.
YAPP, C.J., 2004. Fe(CO3)OH in goethite from a mid-latitude North American oxisol: Estimate of atmospheric CO2 concentration in the early Eocene “climatic optimum”. Geochimica et Cosmochimica Acta, 68(5): 935-947.
ZACHOS, J.C., LOHMANN, K.C., WALKER, J.C.G., WISE, S.W., 1993. Abrupt climate change and transient climates during the Paleogene - a marine perspective. Journal of Geology, 101(2): 191-213.
ZACHOS, J.C., STOTT, L.D., LOHMANN, K.C., 1994. Evolution of early Cenozoic marine temperatures. Paleoceanography, 9(2): 353-387.
ZACHOS, J., PAGANI, M., SLOAN, L., THOMAS, E., BILLUPS, K., 2001. Trends, rhythms, and aberrations in global climate 65 Ma to present. Science, 292(5517): 686-693.
ZACHOS, J. C., SCHOUTEN, S., BOHATY, S., QUATTLEBAUM, T., SLUIJS, A., BRINKHUIS, H., GIBBS, S. J. and BRALOWER, T. J., (2006). Extreme warming of mid-latitude coastal ocean during the Paleocene-Eocene thermal maximum: Inferences from TEX86 and isotope data. Geology 34(9): 737-740.
ZACHOS, J.C., DICKENS, G.R., ZEEBE, R.E., 2008. An early Cenozoic perspective on greenhouse warming and carbon-cycle dynamics. Nature, 451(7176): 279-283.
ZACKE, A., VOIGT, S., JOACHIMSKI, M.M., GALE, A.S., WARD, D.J., TÜTKEN, T., 2009. Surface-water freshening and high-latitude river discharge in the Eocene North Sea. Journal of the Geological Society, 166(5): 969-980.
Manuscript received 08.02.2010, accepted in revised form 24.12.2010, available on line 15.02.2011.
