assessing student learning: a collection of evaluation...
TRANSCRIPT

Assessing student learning 1
Assessing Student Learning: A Collection of Evaluation Tools
Gail M. Gottfried, Developmental Science (2007 Instructional Resource Award recipient)
Kathy E. Johnson Indiana University Purdue University Indianapolis
and Jordan R. Vosmik Drew University
Whereas grading systems based on tacit knowledge may be the norm in practice, the
recent trend toward educational accountability — from granting organizations, accreditation
boards, journals on the teaching of psychology, and even tenure/promotion committees —
suggests a real need for reliable, validated assessment measures that can be used to evaluate
students’ process learning (e.g., how to “do” science) and related changes in their attitudes
toward psychological research and practice (e.g., as “consumers” of statistical reports or as less
biased observers of human behavior). The three assessment measures included in this collection
can be administered at the start and/or the end of the term as can also be used to compare the
achievement of students from experimental and control classrooms. The measures are based on
the APA guide for learning goals and outcomes (see http://www.apa.org/ed/critique_study.html)
and the comprehensive rubric by Halonen et al. (2003).

Assessing student learning 2
Included in this collection
A Rubric for Evaluating a Psychology Research Report
Introduction 3
Rubric and guidelines for use 12*
Evaluating Students’ Process Knowledge: Measuring Understanding of Inter-Rater Reliability
Introduction 18
Activity 20*
Scoring rubric 22
Reading a Journal Article: An Assessment Tool
Introduction 23
Activity 26*
Scoring rubric 27
*To allow instructors to print the measures directly for classroom use, we have removed the page number and short title from these manuscript pages.
_____________________________________
Author contact information: Gail M. Gottfried, PhD Developmental Science, P.O. Box 1354, Sierra Madre, CA 91025 ([email protected])
Copyright 2009 by Gail M. Gottfried. All rights reserved. You may reproduce multiple copies of this material for your own personal use, including use in your classes and/or sharing with individual colleagues as long as the authors’ names and institutions and the Office of Teaching Resources in Psychology heading or other identifying information appear on the documents. No other permission is implied or granted to print, copy, reproduce, or distribute additional copies of this material. Anyone who wishes to produce copies for purposes other than those specified above must obtain the permission of the authors.

Assessing student learning 3
A Rubric for Evaluating a Psychology Research Report
Gail M. Gottfried Developmental Science (2007 Instructional Resource Award recipient)
Jordan R. Vosmik Drew University
Kathy E. Johnson
Indiana University — Purdue University Indianapolis
The APA Guidelines for the Undergraduate Psychology Major (American Psychological
Association, 2007) recommend that students who complete a baccalaureate degree be able to
“understand and apply basic research methods in psychology, including research design, data
analysis, and interpretation” (Goal 2). In addition, the discipline of psychology has always
valued effective writing practice, and psychologists have worked hard to elucidate standards for
writing through an evolving editorial style manual (American Psychological Association, 2005).
Thus, Goal 7 of the APA Guidelines, Communication Skills, includes the following learning
objectives: (a) students should “demonstrate professional writing conventions (e.g., grammar,
audience awareness, formality) appropriate to purpose and context”; and (b) students should “use
APA style effectively in empirically based reports, literature reviews, and theoretical papers.”
Many psychology curricula require an empirical report or literature review as the product
by which faculty will assess students’ attainment of these goals, likely within a research methods
or experimental psychology course. However, the amount of class time dedicated to instruction
Assessing student learning 4
on writing an empirical report can vary dramatically. On many campuses, introductory writing
classes fall exclusively within the domain of the English Department, and instructors of
psychology may consider some aspects of student writing (e.g., grammar, spelling) to fall under
the jurisdiction of campus writing centers. As a result, students may arrive in upper-division
psychology classes with minimal experience with scientific, discipline-specific writing,
including little experience reading and critically evaluating published research in psychology.
These students may struggle to learn the culture and conventions of writing for psychology.
Even in classes with direct instruction on APA-style writing, faculty may find the grading
of empirical reports to be extremely time consuming, particularly when they provide students
with detailed feedback on the strengths and weaknesses of their writing (see Willingham, 1990,
for discussion of the importance of such feedback). Additionally, faculty may feel hampered by
the lack of objective criteria for evaluating the content of the report, especially in an area in
which they may not be well versed in the literature (e.g., senior theses or other independent
projects).
We address some of these concerns with the creation of an analytical scoring rubric for
an empirical report. A rubric is an explicit expression of the performance criteria for a particular
product, in combination with detailed criteria for levels of mastery, expressed along a continuum.
It describes what excellent performance should be like, and also shows what developing and
poor performance will look like—with as many gradations as seem useful or appropriate.
Analytic scoring rubrics are especially helpful when the product or behavior being assessed is
complex because they provide the structure for assessment of separate aspects of performance
(Brookhart, 1999).

Assessing student learning 5
In this introduction, we present the procedures we followed, and the challenges we
encountered, in the development of an objective, standardized rubric for evaluating student
research projects. Following the introduction is the rubric itself, with general guidelines for its
use.
Rubric development
This project began with a request for “grading systems/rubrics that faculty use for scoring
students’ experimental projects (complete APA style paper, proposal, oral presentation, or full
literature review with hypothesis)” sent by GMG (first author of this paper) to the Cognitive
Development Society Listserv. This request yielded responses from 21 faculty and graduate
student instructors from the United States and Canada. Most included a checklist of evaluation
criteria or items to be included, with a total point value (e.g., “literature review thorough and
logically organized? out of 10 [points]”; see Mertler, 2001, for a discussion of the distinction
between checklists and rubrics), but did not include any information about the types of answers
that merited any given point value (e.g., how does a literature review that earns a score of10
differ from one that earns a score of 9, and what would be included or omitted in a literature
review that earns a score of 1 or 2?). From these samples (i.e., content-related evidence; see
Moskal & Leydens, 2000) and from discussion at the 2007 Developmental Science Teaching
Workshop (Gottfried, 2007), we compiled an overall list of key content issues to be included in
our rubric.
One faculty member, JRV (second author of this measure), responded to the initial email
request with a fully developed rubric for an empirical paper. Her rubric included eight graded
sections (i.e., Abstract; Introduction — Context and Literature Review; Introduction —

Assessing student learning 6
Literature Advancement; Introduction — Hypothesis; Method; Results; Discussion; and
Scientific Writing Style), which could be scored as meeting one of three well-defined
achievement levels: Exceptional (4 points); Effective to Less Effective (3 or 2 points); and
Unsatisfactory (1 or 0 points). Additionally, each section was weighted: The Abstract, for
example, was weighted x2, so that an exceptional abstract earned 8 pts (2 x 4).
Working together and assisted by the participants in the 2007 Developmental Science
Teaching Workshop, the three authors of this measure (GMG, JRV, and KEJ) then modified this
rubric, adding content from the other examples and emphasizing the proficiency levels
articulated in Halonen et al.’s (2003) paper on assessing scientific inquiry in psychology. First,
we identified three distinct areas of focus: research skills (i.e., descriptive, conceptualization,
and problem solving skills domains, including the presentation of a theoretically or
methodologically interesting hypothesis, a clean design, and appropriate analytical tools);
communication skills (i.e., the content and clarity of the written report, including selection of
relevant and current empirical articles presented in an organized and clear theoretical framework),
and the use of APA style and formatting. We then expanded the topic list to address 16 distinct
components of an empirical paper. Divisions beyond the original 8 were primarily in the method
section (e.g., separately evaluating participants, materials, procedure, and design) and regarding
writing style and APA formatting.
Next, to differentiate among “Effective” and “Less Effective” responses, we added a
fourth proficiency level. Our new rubric thus included Advanced, Effective/Developing, Less
effective/Introductory, and Poor categories. Importantly, we used a criterion-referenced, rather
than a norm-referenced, approach to assessment: Our Advanced level of performance was not
equated with earning an A but rather with the highest standard of the field of psychology. The

Assessing student learning 7
criterion is authentic in that it is similar to the standards used by editors in evaluating a
submission for publication. Note that our choice in setting such a high standard was multifold:
First, we wanted to ensure that students recognized the characteristics of work at the highest
level. This understanding is especially useful for students who aspire to attend graduate school
in a research-based field but perhaps can also motivate students to strive toward higher goals.
Second, we wanted to ensure that all undergraduate students, and perhaps early graduate students,
would be clearly represented across the scale. Third, we wanted to be able to use the same rubric
to evaluate individual students’ growth across a curriculum, perhaps as part of portfolio
assessment. A standardized rubric can capture development over time in a way that grades
cannot. For example, a student in a 200-level methods class may write a Discussion that restates
results and mentions possible confounds, thus meeting the learning objective for that course and
earning an A. However, if the student were to present the same Discussion for a 400-level senior
capstone class, he or she would likely not meet the learning objective for the upper-division
course, which may focus on synthesis, evaluation, and theory rather than methodological
confounds. An objective comparison at two points of time, based on the same evaluative criteria,
provides data from which to infer learning. Fourth, while recognizing that grade assignment,
curricular expectations, and skill level of the students differ at every institution, we wanted to
ensure the rubric could be used across institutions, based on the same standards. Such
standardization would allow the rubric to be used as a research tool — an objective measure of
student learning before and after introduction of a new teaching technique or program, for
example, or to compare treatment and control classes.
Finally, we removed the specific values for the weights of each section, recognizing that
faculty may choose different weights based on the focus of their classes. We note, however, that

Assessing student learning 8
that faculty using the rubric should assign weighted point values to each section when grading,
based on their own course expectations and goals.
Reliability
We then tested the reliability of the rubric. We collected eight research papers from our
undergraduate students, who agreed to let us use their papers for this project1. We included
senior theses, senior capstone projects, and empirical papers for a junior-level research methods
class. At least two of us scored each paper using the rubric; we then computed pairwise percent
agreement as a measure of interrater reliability. To our surprise, our reliability ranged from 37%
to 56%. Our follow-up discussions and reflection on content validity led to another revision of
the rubric to include 18 topical categories and more clearly operationalized research skills. We
also more clearly differentiated among research skills and communication skills. GMG and KEJ
then scored two additional papers, but our inter-rater reliability was still under 70%.
Though our attempts to establish high inter-rater reliability using our revised criteria and
more detailed rubric ultimately failed, we believe that the rubric itself is an important asset to
student learning and more effective teaching. We also believe that our challenges introduce a
number of interesting research questions. Thus, rather than revise the rubric again, we have
chosen to present it in its current version, with several suggestions for its use.
Using the rubric: Advice to fellow faculty
First, we strongly believe that a carefully constructed, richly detailed rubric can be
effective when it comes to helping students to write better research papers, perhaps even more
effective than textbook chapters devoted to research writing in psychology. Rubrics explicitly
draw contrasts between more and less effective means of conveying scientific ideas through the
1 We did not request student permission to reprint their responses; thus, we have not included sample reports and the scores we gave to them.

Assessing student learning 9
process of writing. They also provide students with normative information concerning what’s
typically expected at their current level of proficiency, and with how they might change their
writing to attain the next level of competency. The framework for the rubric provides a checklist
of sorts to ensure that students include the content that is expected, and the anchors aligned with
varying levels of competency enable students to understand exactly what is expected of them in
the particular course that they are taking. Thus, we believe that the rubric should be shared with
students early in the semester and that time should be invested in making sure that the content is
well understood. A good strategy for facilitating this comprehension is peer evaluation — we
recommend that students be granted the opportunity to read sections of their peers’ papers in
class and to provide feedback to each other using relevant sections of the rubric. One of us (KEJ)
engaged in this activity with groups of students writing honors theses, and students commented
that the peer evaluations had very much helped them to reflect upon their own writing and the
ways that it could be improved. Other possible learning experiences include using the rubric to
evaluate published journal articles, student-written articles published by Psi Chi, or departmental
honors theses from previous years.
Second, the rubric (particularly after it has been used for a semester or two) cuts down
significantly on the amount of time that instructors must spend providing feedback to students on
their writing. At the same time, the quality of the feedback almost certainly improves, as students
can readily see areas that are relative strengths and weaknesses. Ultimately using the rubric for
evaluation may allow instructors to take the time to provide feedback on multiple drafts of the
same paper, a practice that almost certainly will lead to greater improvement in student writing
than the standard practice of collecting a paper toward the end of the semester and providing
feedback only after the grading period has ended.
Assessing student learning 10
The most challenging aspect of using a rubric effectively is calibrating the ratings of
multiple instructors (or a single instructor and multiple teaching assistants) so that there is
sufficiently high inter-grader reliability. We suggest that such agreement may be far easier to
obtain within departments than across departments from different universities. Our efforts to
achieve similar ratings during our development of the rubric were generally unsuccessful. Yet we
were reading papers that we had not assigned, by students that we had not met and who attended
universities that we had never visited. It is likely that departmental cultures and the missions of
the institutions in which they reside (whether urban comprehensive institutions, research-
extensive universities, liberal arts colleges, or community colleges) shape the criteria that faculty
use to gauge levels of proficiency with writing. Additionally, individual faculty come to the task
with their own writing experiences, proficiency levels, and preferences (e.g., JRV still prefers her
original 3-item evaluation scale, rather than the modified 4-item scale we created). Instructor
ratings can also be affected by the idiosyncratic histories of individual students. We may be a bit
more lenient, for example, when a student who has struggled mightily produces a reasonably
coherent piece of written work. An honors thesis mentee who is headed for graduate school may
be evaluated more negatively because we are attempting to instill writing habits that may
ultimately make the process of writing a thesis or dissertation more manageable. We view the
bases for inter-grader reliability (or the lack thereof) to be a highly interesting topic for future
investigations, ideally involving collaborations among instructors from a wide variety of
institutions. We hope that the rubric we have presented here will provide a helpful tool for
carrying out this type of research as well as a productive starting point for departmental
discussions of learning objectives across the curriculum.

Assessing student learning 11
References
American Psychological Association. (2007). APA guidelines for the undergraduate psychology
major. Washington, DC: Author. Retrieved from www.apa.org/ed/resources.html
American Psychological Association. (2005). Publication manual of the American Psychological
Association. Washington, DC: Author.
Brookhart, S. M. (1999). The art and science of classroom assessment: The missing part of
pedagogy. ASHE-ERIC Higher Education Report, 27(1). Washington, DC: The George
Washington University, Graduate School of Education and Human Development.
Gottfried, G. M. (2007, June). Teaching workshop: Teaching developmental science. Santa
Monica, CA.
Halonen, J., Bosack, T., Clay, S., McCarthy, M., Dunn, D. S., Hill, IV G. W., et al. (2003). A
rubric for learning, teaching, and assessing scientific inquiry in psychology. Teaching of
Psychology, 30, 196–208.
Mertler, C. A. (2001). Designing scoring rubrics for your classroom. Practical Assessment,
Research & Evaluation, 7(25). Retrieved July 14, 2008 from
http://PAREonline.net/getvn.asp?v=7&n=25 .
Moskal, B. M., & Leydens, J.A. (2000). Scoring rubric development: Validity and reliability.
Practical Assessment, Research & Evaluation, 7(10). Retrieved November 28, 2007 from
http://PAREonline.net/getvn.asp?v=7&n=10 .
Willingham, D. B. (1990). Effective feedback on written assignments. Teaching of Psychology,
17, 10–13.

EVALUATING A PSYCHOLOGY RESEARCH REPORT A rubric and scoring system
Original framework provided by Dr. Jordan Vosmik; revised by G. Gottfried, J. Vosmik, and K. Johnson. Changes and additions based on scoring systems provided by 21 grad student and faculty member volunteers
contacted through the Cognitive Development Society electronic mailing list and Developmental Science pilot testers. Support for the development of the rubric was provided by an Instructional Research Award from OTRP.
Notes on rubric use: – The system is designed for projects that have an APA-style empirical paper (or components
of a paper) as an assessment of student learning but can be adjusted for posters as needed. We recommend evaluating the title page and the abstract after reading and evaluating the rest of the paper/poster.
– Content and form are generally scored separately. For example, inclusion of tables is scored
with Results; formatting of tables is scored along with APA style. An exception is for scoring the title page.
– Content can be reviewed even in the absence of a formal subsection. For example, a review
of the study design does not require a distinct Design subsection in the manuscript; rather, information about the overall design of the study should be apparent from the hypothesis and the Method section. Data reduction may be included in Procedure or in Results. Note that students may include relevant information but in the wrong section (e.g., discuss materials in the procedure section). Score the content as if it were in the proper subsection (i.e., description of the materials), and mark the organizational problem when scoring form (i.e., APA style and/or scientific writing style, as appropriate).
– Not all sections will be required or emphasized for all projects; certain sections can be
omitted or weighted to reflect the particulars of the class. – The Advanced criteria in this system should not be equated with earning an A but rather with
the highest standard of the field of psychology. Some classes may have (and may expect) no students producing advanced work in a particular category (e.g., design a study in Introductory Psychology). Note that an absolute standard such as this allows comparisons across developmental levels in a curriculum as well as across institutions.
– It is assumed that students who submit something will earn at least one point, with zero
points being reserved for students who do not submit that particular element, if required. Please address comments and suggestions to Gail Gottfried, [email protected].

Topic Advanced (4) Effective/Developing (3 points) Less Effective/Introductory (2
points) Poor (1 pt)
Title page Title includes variables and some articulation of relations (e.g., “difference between…”; “effects of x on y”). Running head shortened but complete within character limit. All relevant parts of the title page are included. APA style is completely correct.
All relevant parts of the title page are included. Title/RH is appropriate but may not be very concise.
Title/RH does not effectively convey all the variables in the study. Some needed elements may be missing.
Title/RH is not appropriate for a scientific paper. Title page does not follow APA style.
Abstract Abstract includes research question, variables, number and type of participants, major results, and implications/limitations of those results stated clearly and concisely within the word limit.
Abstract includes all essential information but is misleading due to a lack of concise sentence structure, or there may be some information missing (one paper section).
Abstract is missing essential information from two paper sections or is significantly over the word limit.
Abstract has some incorrect information or does not accurately portray the experiment. Three or more important elements are missing.
Introduction: Topic & Context
Paper (i.e., first paragraph or two) begins in a broad manner and clearly explains the problem to be investi-gated. Appropriate topic in level and in content (e.g., thesis makes novel contribution to field; cognitive development courses focus on cognitive issues, etc.).
Paper starts somewhat broadly, and provides some theoretical or real-world context for the main concept in the study. An explanation of the key concept or question is provided, but it could be clearer. The topic is appropriate for the class but not necessarily novel in the field.
More clarity in the opening may be needed or the paper may begin with a definition of the topic but provide very little context for the idea (e.g., may begin immediately with review of previous research). The topic, while generally appropriate for the class, may be simplistic.
Paper focuses immediately on the method, or no context for the topic is provided. The topic is not appropriate or is overly simplistic for the class level.
Introduction: Literature review
Studies are described in enough detail so that their relation to other studies and to the relevant theoretical and methodological issues can be understood by the reader. It is clear whether each general statement is a hypothesis, a result of a specific study, or a general conclusion. The review is in the author’s own words, and the focus is on the research, rather than the researchers. Limitations of prior research and contrasting views/positions are presented.
Studies are generally described in enough detail so that their relation to other studies and to the relevant theoretical and methodological issues can be understood by the reader (although some sections could be more specific). It is usually clear whether each general statement is a hypothesis, a result of a specific study, or a general conclusion (though some statements may need clarification). The review may include unnecessary quotations or poor paraphrases of the original articles.
Some of the reviewed literature seems to be inappropriate or not well-linked to the topic. Literature may not be reviewed in enough detail for the reader to be sure of its relation to other studies or to the relevant theoretical or methodological issues or it may be one-sided, omitting contrasting viewpoints. The review may discuss key concepts from the literature without paraphrasing adequately (i.e., over-reliance on quotations).
Too few citations are included for the reader to be confident that that literature has been adequately reviewed. Much of the reviewed literature may be inappropriate or not reviewed in enough detail for the reader to be sure of its relation to other studies or to the relevant theoretical or methodological issues. Definition or discussion of key concepts may be improperly paraphrased.
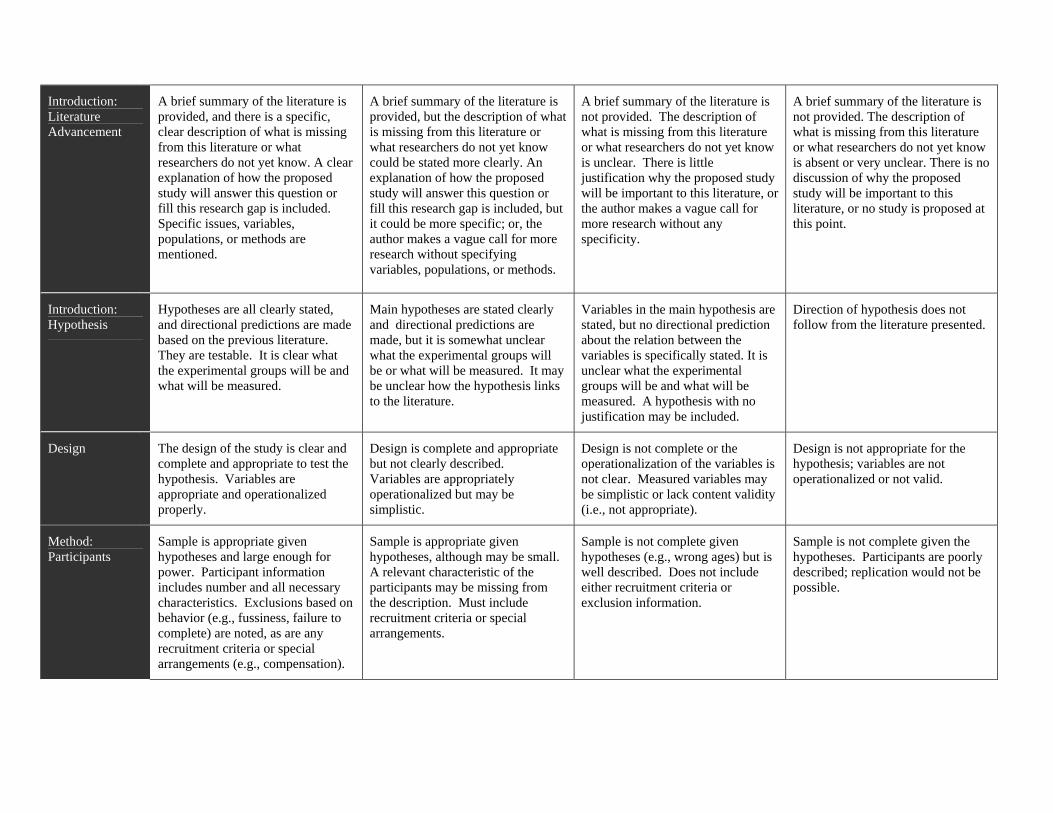
Introduction: Literature Advancement
A brief summary of the literature is provided, and there is a specific, clear description of what is missing from this literature or what researchers do not yet know. A clear explanation of how the proposed study will answer this question or fill this research gap is included. Specific issues, variables, populations, or methods are mentioned.
A brief summary of the literature is provided, but the description of what is missing from this literature or what researchers do not yet know could be stated more clearly. An explanation of how the proposed study will answer this question or fill this research gap is included, but it could be more specific; or, the author makes a vague call for more research without specifying variables, populations, or methods.
A brief summary of the literature is not provided. The description of what is missing from this literature or what researchers do not yet know is unclear. There is little justification why the proposed study will be important to this literature, or the author makes a vague call for more research without any specificity.
A brief summary of the literature is not provided. The description of what is missing from this literature or what researchers do not yet know is absent or very unclear. There is no discussion of why the proposed study will be important to this literature, or no study is proposed at this point.
Introduction: Hypothesis
Hypotheses are all clearly stated, and directional predictions are made based on the previous literature. They are testable. It is clear what the experimental groups will be and what will be measured.
Main hypotheses are stated clearly and directional predictions are made, but it is somewhat unclear what the experimental groups will be or what will be measured. It may be unclear how the hypothesis links to the literature.
Variables in the main hypothesis are stated, but no directional prediction about the relation between the variables is specifically stated. It is unclear what the experimental groups will be and what will be measured. A hypothesis with no justification may be included.
Direction of hypothesis does not follow from the literature presented.
Design The design of the study is clear and complete and appropriate to test the hypothesis. Variables are appropriate and operationalized properly.
Design is complete and appropriate but not clearly described. Variables are appropriately operationalized but may be simplistic.
Design is not complete or the operationalization of the variables is not clear. Measured variables may be simplistic or lack content validity (i.e., not appropriate).
Design is not appropriate for the hypothesis; variables are not operationalized or not valid.
Method: Participants
Sample is appropriate given hypotheses and large enough for power. Participant information includes number and all necessary characteristics. Exclusions based on behavior (e.g., fussiness, failure to complete) are noted, as are any recruitment criteria or special arrangements (e.g., compensation).
Sample is appropriate given hypotheses, although may be small. A relevant characteristic of the participants may be missing from the description. Must include recruitment criteria or special arrangements.
Sample is not complete given hypotheses (e.g., wrong ages) but is well described. Does not include either recruitment criteria or exclusion information.
Sample is not complete given the hypotheses. Participants are poorly described; replication would not be possible.

Method: Materials
Materials are appropriate given hypotheses and pilot tested and/or checked for reliability. Materials are described with enough detail that a reader could replicate the study; materials should be appended if self-created, cited if not.
Materials are appropriate but not complete (e.g., too few questions) or not checked for reliability. The description is adequate but could use more detail. The measures are appended or cited, as needed.
Materials are incomplete and not checked for reliability, or they lack validity given the hypothesis. They may also be adequate but simplistic given the study goals. The description is lacking in details but the measures are appended or cited, as needed.
Materials are incomplete and lacking in validity. They are not fully described or included in an appendix.
Method: Procedure
Procedure is appropriate and ethical. It is described, in order, with enough detail that a reader could replicate the study; instructions and protocol are included. Condition assignments are clear; randomization and counterbalancing are explained as necessary.
Procedure is appropriate and ethical. The description is primarily complete but some minor details may be missing, or some procedural aspects could be explained more clearly.
Procedure is appropriate and ethical. The description is not in order or difficult to follow, or a few major details are absent.
Procedure is not appropriate or not ethical. The description is unclear, or many major details are absent.
Data reduction Measurement of the dependent variable (i.e., scoring, quantifica-tion) is clear, and any procedures for data treatment are explained (e.g., reverse scoring is discussed if necessary; procedures for data cleaning or handling outliers are presented). If necessary, a coding scheme is clear and appropriate and interrater reliability is computed.
Measurement of the dependent variable (i.e., scoring, quantification) is clear and/or the coding scheme is appropriate. Data cleaning and outliers may not be discussed, or the discussion is not clear. Interrater reliability may not have been addressed.
Measurement if the dependent variable is appropriate but not explained clearly and/or the coding scheme is somewhat vague or does not cover all response possibilities (e.g., “maybe” in a Y/N task).
The scoring/quantification of the dependent variable and/or the coding scheme is not appropriate for the design of the study. It may be difficult to understand, even from the Results, how the data were scored/reduced.
Results:
Descriptive Statistics
Statistics are appropriate (e.g., means and SD; frequency) and computed accurately. Tables and figures are correct, organized by relevant variables, and called out in text.
Statistics are appropriate and computed accurately. The figures or tables may have minor errors or confusing aspects.
Statistics are appropriate but may be missing some relevant information (e.g., means but no SD). Figures or tables are redundant with text or omitted when necessary.
Statistics are inappropriate (e.g., means computed on categorical data) or computed inaccurately. Figures or tables are omitted when necessary.
Results:
Inferential Statistics
Inferential analysis is appropriate for addressing each hypothesis. Each finding is stated in “plain English” and supported with statistics in APA format.
Results section includes correctly used inferential statistics, but they may be incomplete (e.g., lacking appropriate post hoc tests) or the findings are unclear. Results may not be linked to hypotheses.
Results section includes inferential statistics, but they may be incorrect or incomplete. Results do not seem linked with the hypothesis of the study.
Overall the inferential statistics do not address the hypotheses of the study. Results are reported incorrectly, the wrong test is used, or some critical information is missing.

Discussion: Interpretation
Discussion includes a restatement of the findings. Patterns in the data and relations among the variables are explained and conclusions do not go beyond the data. The explanation/ interpretation is well connected to the hypotheses and to the broader psychological problem as represented in the introduction. Any discrepancies between the expected results and the actual data are explained. The take-home message is clearly summarized at the end.
Discussion includes a restatement of the findings, but the analysis of their meaning may be weak or not well connected to the hypothesis. There may be lack of consideration for the broader psychological problem. Only some results are explained (esp. only positive), or the links to previous literature simply restate the introduction.
The restatement of the results is not clear or is misleading. Only some results are explained (esp. only positive), and the links to previous literature simply restate the introduction. The author may inappropriately generalize beyond the data.
Discussion incorrectly states the results or is a rehash of the introduction without clearly presenting the current study. The take-home message of the study is not clear.
Discussion: Evaluation
Author has considered to what extent the results are conclusive and can be generalized. Potential confounds or methodological limits are discussed as appropriate, and future research is suggested.
Potential confounds or methodological limits are discussed as appropriate, and future research is suggested. Author has not considered to what extent the results are conclusive and can be generalized.
Potential confounds or methodological limits are listed but not clearly discussed, and future research is not suggested. Author has not considered to what extent the results are conclusive and can be generalized.
Potential confounds and methodological limits may be listed but may be inaccurate, incomplete, or very unclear.
References Reference page includes all and only cited articles. The articles are appropriately scholarly and appropriate to the topic. Sufficient recent sources make the review current, and classic studies are included if applicable and available. Original articles/chapters were clearly read by the student.
Reference list may leave out some cited article or include one that was not cited. The articles are appropriately scholarly but may be somewhat tangential and were likely read by the student. Sources include a good mix of recent and classic, as necessary.
Some references may not be appropriate for the assignment. Key references are clearly cited from other sources and not likely read by the student. Sources do not include a good mix of recent and classic, if necessary.
Reference list is more like a bibliography of related sources. References may not be scholarly sources or otherwise not appropriate for the assignment (e.g., too many secondary sources), or they may not be current.

Topic Advanced (4) Effective/Developing (3 points) Less Effective/Introductory (2 points)
Poor (1 pt)
Scientific Writing Style
There is a clear organization to the paper, and transitions are smooth and effective. Tone is appropriately formal. Topic sentences are appropriate for paragraphs, and key ideas are explained/described as needed. Punctuation and grammar are almost completely correct, including proper tenses and voice. Sentences are concise and word choice is precise, with nonbiased language. Proper paraphrases are usually used, but quotation marks are used appropriately if necessary.
Organization is effective although improvements could be made. Transitions are generally there, but are occasionally not smooth, and paragraphs may stray from the central idea. Tone is appropriately formal. Punctuation and grammar are almost completely correct. Sentences are generally concise and word choice is usually precise. Paraphrases are usually used, and quotation marks are used appropriately if necessary.
Organization is less adequate, making the paper difficult to follow. Transitions are sometimes there, and those that are there could be improved. Tone is occasionally colloquial. Punctuation and grammar are usually correct, but there are consistent mistakes. Sentences are not always concise and word choice is sometimes vague. The author includes many quotes or improper “paraphrases” that may constitute unintentional plagiarism.
Organization is confusing. Transitions are missing or are very weak. Tone is consistently too informal. Punctuation and grammar mistakes throughout the paper. Sentences are not concise and word choice is vague. The author strings together quotations without enough original input.
APA Style Information is included in the appropriately titled sections. Title page, in-text citations, paper format, and Reference page are in APA style with no mistakes. All headers, tables and figures, margins, captions, etc., are in APA style.
For the most part, information is included in the appropriately titled sections. Style is generally correct and must include correct spacing, fonts, and margins. Page breaks must be in appropriate places, and sections must be in order. May have minor mistakes in punctuation of references, in-text citations, statistical copy, or headers.
For the most part, information is included in the appropriately titled sections. Consistent APA style errors in referencing, spacing, or statistical copy.
Four or more consistent style errors, or many inconsistent style errors. Information is consistently included in the wrong sections (e.g., materials described in procedure; discussion included in results).

Assessing student learning 18
Evaluating Students’ Process Knowledge: Measuring Understanding of Inter-Rater Reliability
Gail M. Gottfried
LessonLab Research Institute and Developmental Science
and
Kathy E. Johnson
Indiana University – Purdue University Indianapolis
Whereas grading systems based on tacit knowledge may be the norm in practice, the recent trend
toward educational accountability — from granting organizations, accreditation boards, journals on the
teaching of psychology, and even tenure/promotion committees — suggests a real need for reliable,
validated assessment measures that can be used to evaluate students’ process learning (e.g., how to “do”
science). This activity is designed to assess students’ understanding of inter-rater reliability. In
particular, the questions tap students’ awareness of when IRR is needed, the need for two independent
coders who observe the same behaviors, computing IRR based on two coding worksheets, and
evaluating the strength of the IRR when drawing conclusions. The activity is untitled so that the
measure can be used to evaluate student critical thinking (e.g., as they complete the first page, do they
realize, without being told, that they need to compute inter-rater reliability?); some questions are
nonspecific to allow faculty to assess the methods they have taught (e.g., inter-rater reliability may be
Assessing student learning 19
computed as Cohen’s kappa; other faculty may choose to use a simpler measure, such as percent
agreement, to focus on the concept of rater agreement rather than statistical computation, especially in a
lower division course).
The evaluation rubric was initially developed based on responses from undergraduate students
taking a course that included a laboratory assignment that required them to code data and compute inter-
rater reliability.1 After discussing the evaluation rubric and the responses of six students enrolled in a
senior-level capstone course in developmental psychology, the two authors (GMG and KEJ) together
modified the rubric and then independently coded responses from six additional students. Percentage
agreement was 83%; disagreements were discussed, and the evaluation rubric was again modified as
necessary.
This measure can be used as a quiz or end-of-unit assessment and can also be used in a research
study to evaluate a new teaching technique (e.g., do students learn better with Hands-On Activity A or
Activity B?). Furthermore, with slight modification it can be used as both pretest and posttest to
evaluate student learning in a particular class. For example, faculty teaching a research methods class
may have students complete the activity early in the term and then may develop a parallel version by
changing the behavior of interest for use later in the term.
For additional information or assistance with this activity, contact Gail at [email protected].
1 Students and faculty involved in the development of this measure were pilot testers for the Developmental Science Virtual Laboratories, a set of video-based lab activities that provide structured activities for students to code, analyze, and evaluate experimental and observational data; IRB approval was given for that project, including for the development of this assessment measure. The Virtual Laboratory project was supported by the United States National Science Foundation through the Course, Curriculum, and Laboratory Improvement Program under grants DUE-0231016 and DUE-0441985. Any opinions, findings, and conclusions or recommendations expressed in this material are those of the author and do not necessarily reflect the views of the National Science Foundation. For additional information, contact G. Gottfried at [email protected].

ACTIVITY
You are enrolled in a child development class. Your professor assigns an observational project in which you and a partner are supposed to develop a hypothesis, go to the on-campus child care center, observe for 20 minutes, and write a paper about what you saw, using your data to support your conclusions. The professor tells you that part of your grade will be based on her assessment of your ability to observe objectively. You and your partner decide to focus your observation on aggression, and you hypothesize that girls will show more relational aggression than boys, and boys will show more physical aggression than girls. You decide on the following method. First, you observe one child for 20 seconds and record whether that child engages in physical, relational, or no aggression during that period. Then, you move on to another child, observe for 20 seconds, and record. You continue observing this way until you reach 20 minutes. To record your data objectively, you and your partner develop a worksheet to use. Child Int1 Int2 Int3 Int4 Int5 Int6 Int7 Int8 Int9 Int10 Int11 Int12 Int13 Int14 Int15
You make two copies of the worksheet, one for each of you, and you go to the child care center. One of you observes the girls, and one of you observes the boys. You put the children’s names in the first column, and then record data for Interval 1 for each boy or girl who’s present. You put R (for relational), P (for physical), or nothing into each cell. When you reach the bottom, you go back to the top and begin recording in the Interval 2 column. Afterward, you tally the total number of Ps and the number of Rs for boys and for girls. Together you write your paper. QUESTION: What might your professor say about the method for collecting data used by you and your partner? Be as complete as possible. Your professor wants to grade how well you observe — in other words, did you accurately record what you saw? What can your professor say about your observational abilities, and what is the evidence she will use to support her evaluation?

Two weeks later, you are sent to test the same hypothesis with older children. This time, both you and your partner look at boys for 10 minutes (again, watching each child for 20 seconds before moving to the next child on the list) and then girls for 10 minutes (also 20 seconds per child). You sit next to each other and watch the same children at exactly the same time but don’t peek at each other’s data sheet. Sometimes, though, it’s hard to tell if the child is being aggressive at all. When you aren’t sure, you put a ? in the grid and figure you’ll discuss the hard ones with your partner when you’re done. When you are done observing, you compare your responses. Your data sheets look like this:
YOUR DATA SHEET Child Int1 Int2 Int3 Int4 Int5 Int6 M1 P P ? M2 P P P P P M3 R R ? ? M4 R R P P M5 ? F1 R F2 R R F3 P F4 ? ? F5 R R
YOUR PARTNER’S DATA SHEET Child Int1 Int2 Int3 Int4 Int5 Int6 M1 P P M2 P P P P P M3 P R P P M4 R R P P M5 P F1 R R F2 R R F3 P F4 P P R F5 R R
QUESTIONS: In what ways has your method improved over your first try? What can your professor say about your observational abilities now, and what is the evidence she will use to support her evaluation? Can she tell whether you are accurately recording what you are seeing? What is your inter-rater reliability? Show your computational formula. Do your data support your hypothesis? Explain, reporting the data that support your conclusion. Your answer should have numbers in it.

Scoring rubric PAGE 1:
What might your professor say about the method for collecting data used by you and your partner? Be as complete as possible.
2 1 0 - should have had two observers
watching the same thing AND - sex is confounded with observer
- One of the two points given for a score of 2 OR
- some mention of IRR without good explanation of what it is
- no mention of IRR or confounds
Your professor wants to grade how well you observe — in other words, did you accurately record what you saw? What can your professor say about your observational abilities, and what is the evidence she will use to support her evaluation?
2 1 0 - she can’t say anything because she
wasn’t there and you have no IRR - mentions that you need IRR but
doesn’t state you can’t compute it based on your method
- anything else
PAGE 2:
In what ways has your method improved over your first try?
2 1 0 - you’re both watching the same
thing AND - sex and observer no longer
confounded
- One of the two points given for a score of 2
- anything else
What can your professor say about your observational abilities now, and what is the evidence she will use to support her evaluation? Can she tell whether you are accurately recording what you are seeing?
2 1 0 - Your observation is pretty good b/c
your IRR is over 80 AND - You need to be more decisive—no
? should be entered
- One of the two points given for a score of 2
- anything else
What is your inter-rater reliability?
2 1 0 - 50/60 = 83% - has 60 for denominator but
inaccurate numerator OR - has 50 for numerator but inaccurate
denominator
- anything else
Do your data support your hypothesis? Explain, using the data to support your conclusion.
2 1 0 - Data support hypothesis AND
accurate summary of data - Of 6 agrees for girls, 5/6 are R - Of 12 agrees for boys, 9/12 are P
- Data support hypothesis AND - computation given but not accurate
(e.g., 13/16 P for boys, 7/10 for girls, based only on decisive partner’s scores)
- Data do not support OR - Data support, but no computation
given

Assessing student learning 23
Reading a Journal Article: An Assessment Tool
Gail M. Gottfried Developmental Science
Whereas grading systems based on tacit knowledge may be the norm in practice, the
recent trend toward educational accountability — from granting organizations, accreditation
boards, journals on the teaching of psychology, and even tenure/promotion committees —
suggests a real need for reliable, validated assessment measures that can be used to evaluate
students’ process learning (e.g., how to “do” science). This activity is a start toward an
assessment of students’ abilities to read, summarize, and critically evaluate a journal article.
This assessment measure can be used at the start of a semester for course and curriculum
planning. Frequently, faculty assign unedited empirical papers to undergraduate students in lieu
of or to accompany a general textbook, only to find during class discussion that students’
knowledge of how to read an empirical paper strategically is lacking. For example, our
experience suggests that underclassmen often focus on the introduction, highlighting the findings
of previous studies more frequently than the hypotheses of the reported study. Upperclassmen
often highlight general conclusions and applications as presented in the discussion but seem to
skip over data tables, graphs, and statistical analyses. When asked to describe the design and
method of the study, many students either state the concept under study without tying it to an
operational definition (e.g., “tested participants’ understanding of the relation between thinking

Assessing student learning 24
and feeling”) or describe the measures without relating the behaviors to the theoretical construct
(e.g., “had students read scenarios and answer questions about them”). Early in the term, then, a
professor may want to assign this activity and use the results to create a developmentally
appropriate assignment or series of assignments across the term. Such assessment may be
particularly useful in classes in which students have a wide range of experience (e.g.,
sophomores and seniors; majors and nonmajors). We note, too, that the findings of this
particular study (i.e., Gaultney & McCann, 2001) may be enlightening for students at the start of
the term and may stimulate discussion about the expectations for the class.
The measure could also be used as both a pretest and a posttest to evaluate changes in
students’ abilities over the semester, for example in classes in which developing skill at reading
journal articles is explicitly taught or scaffolded. Because the questions focus on process rather
than content, carryover effects and familiarity may be minimized — students may remember the
content of the article, for example, but not remember exactly what they wrote as a summary
(note they may have their earlier responses stored in their computer, however). Faculty wanting
to eliminate this potential problem entirely may choose to develop a comparable measure,
perhaps assigning each measure to half the class at the start of the term and then the alternative
measures at the end of the term.
The scoring rubric for this assessment tool was developed directly from the responses of
a small sample of introductory and advanced students at two institutions. We approached these
two levels specifically to collect typical “introductory” and “developing” responses to use in
developing a scoring system. We also personally invited a small number of senior honors
students, based on the expectation that they would provide “advanced” responses. We made no
attempt to compute distribution scores for our sample — because the scoring rubric was designed

Assessing student learning 25
to be criterion-referenced, we expect that the distribution will vary based not only on the
students’ class standing but also on other criteria such as the number of previous empirically
drive courses they have taken, the rigor of the curriculum, the objectives of the course, the
academic preparation of students and selection process at the particular institution (e.g., SAT
scores), major or nonmajor standing, and others. We suggest that these variables may be of
particular interest to researchers evaluating student learning. We also note that, for this measure,
we did not (yet) collect an additional sample of student responses from which to test inter-rater
reliability for the scoring rubric. As such, we encourage interested faculty to continue to develop
this measure.
Furthermore, as with the other measures included in this collection, we do not suggest
how faculty may convert these scoring categories to class grades. Rather, we intended that the
tool would be used to show development over time — thus, it is likely that few if any students in
an introductory class will score 3s (Advanced undergraduate) and that few if any advanced
students will score 1s or 0s. Nevertheless, some faculty, especially those teaching mid-level
classes, may want to use the measure summatively and may consider “introductory” work to be
average or below average, “developing” work to be adequate or good, and “advanced” work to
be excellent.
For additional information or assistance with this activity, contact Gail at

Reading a journal article
Reference: Gaultney, J. F., & Cann, A. (2001). Grade expectations. Teaching of Psychology, 28, 84–87.
Read the Gaultney & Cann (2001) article carefully, and then complete the following activities.
Put everything into your own words — answer without looking back at the article, except for Item #3.
1. Summarize the study. 2. Evaluate the method. List the criteria on which you are evaluating, and then write your
evaluation (see example). Criterion Evaluation Sample size 220 students is a relatively large sample, although no power
analysis was done. 3. Explain Table 2. Be specific as to what the numbers mean (for example, what does 1.23 in
the first column show?) 4. One finding is that students don’t think professors can evaluate effort very well. How can
you operationalize effort to help alleviate this problem? 5. Given the findings of this study, suggest two possible follow-ups to address unanswered
questions raised by this study. For each follow-up study, state your research question, your hypotheses, and the justification for your prediction.

Question 1: Summarize the study.
Assessment objective: Understanding all sections of the study.
3 (Advanced undergrad) 2 (Developing) 1 (Introductory) 0 (Before instruction)
- includes accurate paraphrases of problem, participants, materials and procedure, brief summary of results, and implications
- notes variables in design and/or states results in terms of variables
- summary rather than list of each result
- includes all or most key components but is not summarized and/or in own words
- results are mostly accurate but unclear; may be in a list rather than a coherent summary
- implications of research may be omitted
- omits key components of study; focus is primarily on goal of study
- statement of topic or design is general; variables not specified
- results stated but not all accurate or only general conclusions stated
- relevant sentences cut from body of article without paraphrase
- one or two sentences that reflect the title with no additional information
- summary copied directly from abstract
“The study assessed students’ (in a large introduc-tory psychology course) preferences for evaluation. Researchers examined the statistical relationships among students’ gender, course goals (and prefer-ences), age, and attitudes towards grading for classes in general, and for the particular course they were enrolled. The research objective was thus to determine whether and which subgroups of stu-dents differ in their orientations toward grading and how. For the course goal and age factors, partici-pants were coded performance- or mastery-oriented, and as younger or older (under and over 20 years, respectively). Reasons for course enroll-ment, task preferences, and opinions about grading- specifically, the criteria upon which to be evaluated and ideal grade distribution, were analyzed by gender (male and female subgroups). Results include overall student preference for fun or easy tasks, multiple-choice tests graded on a curve, more evaluation opportunities, grade distributions skewed toward higher grades, and mastery of ma-terial and effort as most important in the calculation of final grades. Students did not believe teachers assess effort, the second most important evaluative component, well. Furthermore, performance-orien-ted students preferred fun or easy tasks more than mastery-oriented students who favored activities that reinforce learning. Women preferred more assignments and opportunities for evaluation, and only mastery-oriented men expected a normal-type grade distribution. Lastly, mastery-oriented and older students felt mastery should count more than effort in the calculation of grades, while perfor-mance-oriented and younger students felt they should count equally. (answer continues, next column)
“In this study, 220 college students completed a survey about their feelings towards grade expectations and their professors’ evaluation methods. The survey was used to see if students were generally satisfied with their final grade, surprised by their final grade, what their grade should reflect, and how the professors could assess their effort. The results were compared by using three groups: age, gender, and goal. The results showed that women were more likely than men to prefer more opportunities for evaluation. Younger students were more likely than older students to prefer more weight placed on effort than on mastery of the material. Performance-oriented students and women who were mastery-orients preferred grades to be distributed with more higher grades than lower grades.” (continuation from Advanced column)
The researchers therefore concluded that students held conflicting attitudes toward, and preferences for, grading that nearly predict dissatisfaction with evaluative outcomes. Nevertheless, most students received the grade they expected and were thus prepared, in spite of possible unawareness of conflicting preferences, and potential dissatisfaction with their final grade and/or course, overall.”
“This study collected data from 220 college-aged students from large lecture sections of introductory psychology classes. This research provides data to better understand student motivations and goals and to identify possible group differences in preferences for course requirements and evaluation methods. It addresses what students consider appropriate evaluation strategies and how subgroups might differ.”
“The study is about college students and the grades they expect in their intro psychology classes.”

Question 2: Evaluate the method. List the criteria on which you are evaluating, and then write your evaluation (see example).
Assessment objective: Ability to provide unbiased and complete critique of design and method of study.
3 (Advanced undergrad) 2 (Developing) 1 (Introductory) 0 (Before instruction)
- criteria include all or most of the following: number and demographic profile of participants, validity and reliability of instruments, and procedure/design
- evaluation is justified appropriately, using examples or data from the study as relevant
- criteria include all or most of the following: number and demographic profile of participants, validity and reliability of instruments, and procedure/design
- evaluation criteria are somewhat simplistic or not highly relevant for the study
- critiques writing rather than design of study
- few criteria included - criteria stated but not evaluated - evaluation criteria are simplistic;
relies on personal experience for evaluation or overinterprets with limited regard for evidence
- student seems unaware of the criteria on which to evaluate a research study
“Method of sampling — This study involved a sample of convenience and volunteerism, which can both produce a bias. A better sample would have been by picking students at random, although, this is very hard to get students to actually do that. The use of volunteers as participants greatly restricts the generalizability of the results.”
“background — not much info given except for the percentage of students that were first year, sophomores, and advanced students.”
“Responses — analysis was straightforward because the questions were forced-choice. Questionnaire — the categories were well represented within the questions. Participation — Students responses seemed to truly represent their ideas on the matter, considering participation was voluntary and unrewarded.”
“The survey assessed things that involved reasons for taking this class, the nature and number of preferred tasks, what should be considered when determining an final grade and the different types of weighting given to those grades, and how the grades should be distributed. Last the survey also included a question asking if students ever were surprised by their final grade and why. Through evaluation, women preferred more assignments over men, students wanted effort included in their final grade, and all students wanted to be graded on a normal curve for a ‘fair’ distribution of grades.”
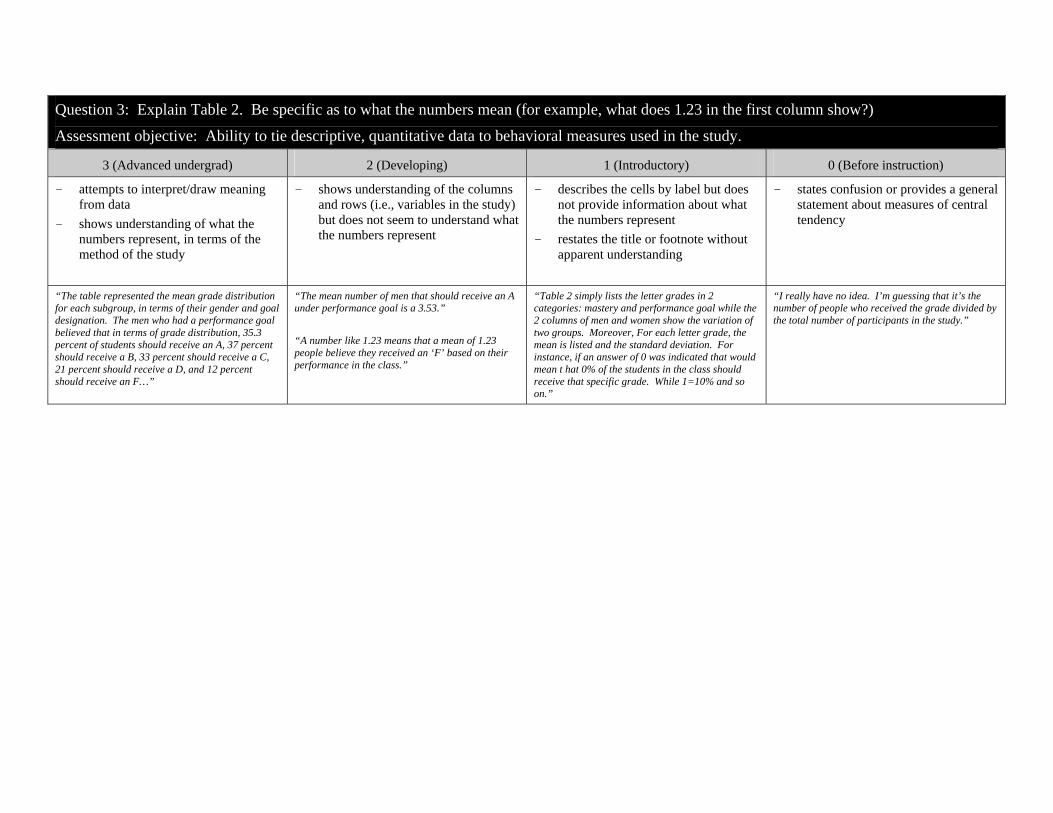
Question 3: Explain Table 2. Be specific as to what the numbers mean (for example, what does 1.23 in the first column show?)
Assessment objective: Ability to tie descriptive, quantitative data to behavioral measures used in the study.
3 (Advanced undergrad) 2 (Developing) 1 (Introductory) 0 (Before instruction)
- attempts to interpret/draw meaning from data
- shows understanding of what the numbers represent, in terms of the method of the study
- shows understanding of the columns and rows (i.e., variables in the study) but does not seem to understand what the numbers represent
- describes the cells by label but does not provide information about what the numbers represent
- restates the title or footnote without apparent understanding
- states confusion or provides a general statement about measures of central tendency
“The table represented the mean grade distribution for each subgroup, in terms of their gender and goal designation. The men who had a performance goal believed that in terms of grade distribution, 35.3 percent of students should receive an A, 37 percent should receive a B, 33 percent should receive a C, 21 percent should receive a D, and 12 percent should receive an F…”
“The mean number of men that should receive an A under performance goal is a 3.53.” “A number like 1.23 means that a mean of 1.23 people believe they received an ‘F’ based on their performance in the class.”
“Table 2 simply lists the letter grades in 2 categories: mastery and performance goal while the 2 columns of men and women show the variation of two groups. Moreover, For each letter grade, the mean is listed and the standard deviation. For instance, if an answer of 0 was indicated that would mean t hat 0% of the students in the class should receive that specific grade. While 1=10% and so on.”
“I really have no idea. I’m guessing that it’s the number of people who received the grade divided by the total number of participants in the study.”

Question 4: One finding is that students don’t think professors can evaluate effort very well. How can you operationalize effort to help alleviate this problem?
Assessment objective: Understanding how to operationalize a variable (i.e., what operationalization means).
3 (Advanced undergrad) 2 (Developing) 1 (Introductory) 0 (Before instruction)
- gives clear measurable behaviors related to effort
- specifies behaviors that themselves need to be operationalized
- States a procedure for collecting data but does not operationalize the construct by specifying measurable behaviors
- does not show understanding of the term operationalize.
- Gives common-sense answer or says the construct cannot be operationalized.
“Effort is turning in all homework assignments, attends class with a record of less than two absences, make an attempt to complete all extra credit, participate in class discussion.” “An example could be: effort is graded on how many questions/answers/thoughts a student gives during each class period. The professor could say, for example, in order to get ‘effort’ points, you must make at least 2 comments each class.”
“I don’t think you could fully operationalize effort. My only idea would be to include extra credit, participation, and attendance as effort.”
“Professors can use their graduate students or TAs to attend their classes and observe their students. They can observe …their effort toward class…”
“It is too hard for instructors to accurately assess individual effort.” “One way a professor can alleviate this problem is by informing the students early in the course regarding course and its grading policies perhaps that would give a more vivid perspective of the professor’s evaluation process.”

Question 5: Given the findings of this study, suggest two possible follow-ups to address unanswered questions raised by this study. For each follow-up study, state your research question, your hypotheses, and the justification for your prediction.
Assessment objectives: Ability to think critically about the contributions of the study; ability to develop a relevant hypothesis and design a study to test it.
3 (Advanced undergrad) 2 (Developing) 1 (Introductory) 0 (Before instruction)
- Moves topic forward conceptually based on one of the findings in the current study
- follow-up study may add qualitative data for depth
- moves topic forward by adding new variable or level of current variable to address a finding in the study; hypothesis is grounded in research
- presents research question that can be answered with new analysis of data from this study
- includes same variables as current study but different population, without regard to addressing questions raised by the findings
- describes study unrelated to research topic
“Does having a class with fun or interesting assignments with emphasis on mastery as a top grading criterion produce higher grades? Justification — the students decided this method of learning and grading is best for them to succeed…it’s worth the shot to study what works for this generation.” “How do students of low, average, and high GPA differ in their grading preferences? ...Students with higher GPAs may appear similar to performance-oriented students, prefer a positively skewed grade distribution, and weight mastery of material and effort equally important…on the flipside, student with higher GPAs may emerge more like the mastery-oriented students, prefer a more normal grade distribution, and view mastery of material as most important.”
“Do students in smaller upper level courses have grade expectations and what are the expectations for appropriate evaluation strategies by the professors? …the previous study informed us that older students are more interested in learning new things and consider effort to be uninvolved with the grades received.”
“Does being older mean less emphasis on effort and more emphasis on mastery as a top criteria for assessing grades?” “First, pertaining to the 58% of students who are surprised by their grade when it is lower than expected: are there gender or age differences related to this?” “How do minority students differ from white students in their views of grading on a truly normal distribution? I think that the views will be different, although I’m not sure how different, because in the study in t he article, 66% were white. So minorities were underrepresented.”
“To further understand the topic at hand, one could ask what students preferred time was in regard to scheduled class. Most students would argue that the morning hours between 10 and 2 are more desirable for class time because there is the option of sleeping in, as well as the option accomplishing the required work earlier in the day.”