assessing the importance of land and marine sources of
TRANSCRIPT

MARINE ECOLOGY PROGRESS SERIESMar Ecol Prog Ser
Vol. 360: 47–62, 2008doi: 10.3354/meps07382
Published May 22
INTRODUCTION
Material exchange among ecosystems is recognizedincreasingly as an important determinant of many eco-logical patterns and processes (Valiela et al. 2001,Roberts et al. 2003). The movement of organic andinorganic materials across boundaries of discreteecosystems is widespread and has been shown to influ-ence population dynamics, community structure, foodweb complexity, and primary and secondary produc-tion (e.g. Polis et al. 1997, Bouchard & Bjorndal 2000,
Bishop et al. 2002). Much of what we know about therole of material exchange in coastal ecosystems origi-nates from studies of estuaries where inputs from theocean mix with those from rivers (e.g. Canuel et al.1995, Deegan & Garritt 1997, Chanton & Lewis 2002).However, estuarine systems differ from open coastalsystems in oceanographic conditions and in exposureto ocean-derived inputs.
Giant kelp Macrocystis spp. forests are among themost productive ecosystems in the world (Mann 2000).They occur on shallow subtidal rock outcrops (a habi-
© Inter-Research 2008 · www.int-res.com*Email: [email protected]
Assessing the importance of land and marinesources of organic matter to kelp forest food webs
Henry M. Page*, Daniel C. Reed, Mark A. Brzezinski, John M. Melack, Jenifer E. Dugan
Marine Science Institute, University of California Santa Barbara, Santa Barbara, California 93106, USA
ABSTRACT: We used stable isotope analysis to investigate the relative importance of marine and ter-restrial sources of organic matter to the food web of 4 nearshore reefs in the Santa Barbara Channel(California, USA) over a 4 yr period that included substantial variability in the availability of marineand terrestrial organic matter. We measured stable C and N isotope values of ocean- and land-derived sources of organic matter and of different types of consumers on reefs that varied in exposureto freshwater runoff and in biomass of giant kelp. δ13C values of suspended particulate organic mat-ter (POM) on reefs tended to decrease following periods of significant rainfall at the reef most influ-enced by freshwater runoff, to increase with phytoplankton standing crop at all reefs, and generallyto decline in both wet and dry years in late fall–early winter at all reefs. Stable isotope values of reefconsumers indicated little direct use of terrestrially-derived POM. However, a pattern of 15N-enrich-ment in 2 common benthic-feeding species, the sea urchin Strongylocentrotus purpuratus and theannelid Diopatra ornata, with increasing influence of runoff indicated that terrestrially-derived nitro-gen may enter the food web indirectly through a trophic intermediate (e.g. microbes, algae). Theimportance of giant kelp to the reef food web varied with consumer feeding mode. In contrast to pre-vious studies, δ13C values suggested little use of kelp-derived material by suspension-feeders, basedon the similarity in isotope values of these consumers among reefs when kelp biomass was low, andthe absence of a directional shift in isotope values that would indicate the use of more 13C-enrichedkelp when kelp biomass was higher at 2 of the reefs. However, isotope values for herbivores weregenerally 13C-enriched relative to suspension-feeders, reflecting the use of local giant kelp or other13C-enriched benthic algal production. Thus, spatial and temporal fluctuations in the biomass of giantkelp would be least likely to impact the food resources of suspension-feeders and have greatest effecton benthic herbivores.
KEY WORDS: Macrocystis pyrifera · Kelp forest · Food web · Rocky reef · Stable isotopes
Resale or republication not permitted without written consent of the publisher
Mar Ecol Prog Ser 360: 47–62, 2008
tat hereafter referred to as ‘reef’) along the open coastsof western North and South America, southern Africa,Australia and most sub-Antarctic islands, includingTasmania and New Zealand (Womersley 1954).Because of their close proximity to shore, physical andbiological processes that occur in the open ocean aswell as on land potentially influence these reef ecosys-tems. Of interest in this regard is the relative impor-tance of land- and ocean-derived sources of organicmatter to reef food webs and the extent to which theseinputs are affected by changes in natural environmen-tal drivers (e.g. freshwater runoff, sea surface temper-ature, currents).
The shallow rocky reefs of the Santa Barbara Chan-nel (southern California, USA) typically support bedsof the giant kelp Macrocystis pyrifera. These kelp bedscan be highly productive; field based estimates of pro-ductivity range from 20 to 30 kg wet weight m–2 yr–1 or460 to 690 g C m–2 yr–1 (Coon 1982). Kelp productioncan enter the reef food web through the consumptionof attached or dislodged plants by benthic grazers, oras detritus (Mann 2000), where microbial activity onolder parts of kelp blades and on kelp POM mayincrease its food value to suspension-feeding benthicconsumers (Duggins & Eckman 1997, Norderhaug etal. 2003). Several studies in different geographical set-tings have suggested that the contribution of kelp-derived POM to the diet of suspension-feeders canapproach that of phytoplankton (Dunton & Schell 1987,Duggins et al. 1989, Kaehler et al. 2000). Phytoplank-ton abundance in the Santa Barbara Channel is gener-ally highest along the mainland and peaks in thespring and summer months (Otero & Siegel 2004).
Riverine and terrestrial organic matter may also beincorporated into coastal food webs, as documented insome estuarine systems (Canuel et al. 1995, Chanton &Lewis 2002). Runoff from about 75 small catchmentsdrains directly or through small estuaries into theSanta Barbara Channel from a coastal mountain range(Santa Ynez Mountains). The climate of southern Cali-fornia is Mediterranean and most of the annual dis-charge of freshwater and associated particulate mater-ial to the coast occurs within a few days to weeks eachwinter (Beighley et al. 2003). Storm runoff transportslarge amounts of suspended POM to the coastal oceanthat could either be used immediately by reef con-sumers, or settle to the bottom and become available toconsumers later through resuspension.
Stable isotope analysis has proven useful in reveal-ing sources of production used by consumers in kelpforest food webs (Dunton & Schell 1987, Duggins et al.1989, Kaehler et al. 2000, Fredriksen 2003). We usedthis technique to explore trophic linkages betweenconsumers on rocky reefs in the Santa Barbara Chan-nel and sources of production originating from beds of
Macrocystis pyrifera, phytoplankton, and neighbour-ing terrestrial (riverine and terrestrially-derived POM)ecosystems. The use of stable isotope analysis in foodweb studies is a well established technique, but thereare potential limitations with its use that need to berecognized (e.g. Fry & Sherr 1984, Stephenson et al.1984, Simenstad et al. 1993).
We hypothesized that land-derived inputs of par-ticulate carbon will be distinguishable from marinesources on nearshore reefs by a pattern of 13C deple-tion in suspended reef POM (Canuel et al. 1995, Fry2002). Consumers incorporating appreciable amountsof land-derived carbon should have more negativeδ13C values in years of highest rainfall and on reefsexperiencing and/or retaining particulate inputs fromland compared with reefs that are less influenced byfreshwater runoff. Suspended POM consisting primar-ily of marine phytoplankton is typically more enrichedin 13C than terrestrially derived carbon (Fry & Sherr1984, Gearing et al. 1984). Carbon isotope values ofreef consumers using primarily kelp or other 13C-enriched benthic macroalgal production might beexpected to have even more positive carbon isotopicsignatures (Dunton & Schell 1987, Duggins et al. 1989,Fredriksen 2003).
In this study, we investigated the relative importanceof marine and terrestrial sources of organic matter tothe food web of nearshore reefs. Specifically, weexplored temporal and spatial variability in the stableC and N isotope values of ocean and land-derivedsources of organic matter over a 4 yr period on 4 reefsthat varied in exposure to freshwater runoff and inkelp biomass. We compared these data to the stable Cand N isotope values of a diverse group of consumerson each of the reefs to determine the extent to whichconsumer diets were influenced by variation in the dif-ferent sources of organic matter.
MATERIALS AND METHODS
Study reefs. We characterized the stable C and Nisotope values of sources of organic matter and of adiverse array of invertebrate consumers on 4 rockysubtidal reefs that we anticipated to vary in exposureto freshwater runoff and in the standing crop of giantkelp (Fig. 1). Carpinteria Reef (CA), located directlyoffshore (0.1 to 0.2 km) of a small salt marsh (93 ha) andcoastal plain developed for intensive agriculture (Pageet al. 1995, Robinson 2006) was expected to be moreinfluenced by freshwater runoff and to possess a lowerstanding crop of giant kelp than the other reefs. Thereefs at Arroyo Quemado (AQ) and Mohawk (MO)were located 0.1 to 0.2 km offshore and had historicallyabundant giant kelp, whereas Naples Reef (NA),
48

Page et al.: Sources of organic matter to subtidal reef communities
located further offshore (1.8 km), was anticipated to beless influenced by freshwater inputs and to have morevariable giant kelp. The reef substrates are composedprimarily of bedrock with relatively low topographicrelief (i.e. <3 m) and overlap in water depth (AQ:5–11 m; NA: 6–13 m; MO: 4–6 m; CA: 2–9 m).
AQ, NA, and CA were sampled monthly as part ofthe Santa Barbara Coastal Long Term EcologicalResearch Project (LTER), a multi-year program toinvestigate the relative importance of land and oceanprocesses in structuring giant kelp forest ecosystems.MO, which was sampled less frequently, was includedin our study to provide additional data on the isotopevalues of consumers from a reef with historically abun-dant giant kelp.
Sampling design. Sources of organic matter: Tem-poral and spatial variability in the isotopic composi-tion of reef suspended POM was investigated in watersamples collected approximately monthly at CA andNA beginning in November 2000, and at AQ begin-ning in March 2001, through April 2005 (water sam-ples were not collected at MO). Water samples werecollected at depths of 1, 5, and 10 m using a Niskinbottle (10 m samples were not collected from CAbecause the bottom depth is <10 m). To obtain stableC and N isotope values of offshore suspended POM,we also collected water samples 8 to 20 km offshore of
the study reefs at depths of 1 and 5 m on 5 occasionsfrom September 2002 to September 2004. These watersamples were taken at different stations within anapproximate 1100 km2 rectangular area defined bylatitudes 34° 10’ to 34° 30’ N and longitudes 119° 50’ to120° 10’ W. Samples were either returned to the labo-ratory in Nalgene polypropylene bottles in a coolerwhere they were filtered (reef samples), or filtered onboard ship (offshore samples, see ‘Sample prepara-tion’ below).
To obtain stable C and N isotope values of land-derived POM, water samples were collected at non-tidal locations in 8 coastal streams during storm eventsfrom November 2001 to March 2005. Stream watersamples were collected manually in clean polyethy-lene bottles just below the water surface during peri-ods of peak runoff and returned on ice to the labora-tory where they were filtered. Values from 6 differentstorm events were averaged to obtain isotope values ofsuspended POM from each stream.
The stable isotopic signatures of the dominant ben-thic macroalgae were determined from tissue samplescollected at the 4 study reefs. Samples of the giant kelpMacrocystis pyrifera were collected approximatelymonthly (less frequently from MO and CA) from thecanopy of adult plants from 2002 through 2005. For thisspecies only, both actively growing (‘new’) and senes-cent (‘old’) blades were collected during each sam-pling period to examine whether the isotopic composi-tion of this macroalga varied with age of the tissue.Entire old blades, present on fronds in which the apicalmeristem had stopped growing, were sampled andprocessed whole. Entire new blades from activelygrowing fronds of the same plant were also sampled atthe same time and processed whole. Tissue samplesfrom 5 of the most common species of understorymacroalgae were also collected annually at each reefin March–April of 2002 through 2005 (Table 1). Fivereplicate samples of each macroalgal species were col-lected from each reef and date.
Kelp forest consumers: Tissue samples from com-mon species of benthic kelp forest invertebrates repre-senting different trophic levels and feeding guilds (e.g.herbivores, suspension feeders, predators and scav-engers) were collected by SCUBA divers at each reefonce per year in March–April of 2002–2005 (Table 1).Five individuals of each invertebrate species werecollected from each reef and date at depths of from 6 to12 m. Samples of all consumers were kept on ice dur-ing transport to the laboratory and then stored frozenat –20°C until processing. We considered March andApril a suitable time to test for the incorporation of ter-restrially-derived POM by reef consumers because92% of the annual rainfall in the Santa Barbara areahas historically occurred from November through April
49
Fig. 1. Study reefs in the Santa Barbara Channel: Arroyo Que-mado (AQ), Naples (NA), Mohawk (MO), and Carpinteria
(CA). Sampled streams are marked
Mar Ecol Prog Ser 360: 47–62, 2008
with most (44%) falling in January and February(Santa Barbara Flood Control, www.countyofsb.org/pwd/water/downloads/hydro/234dailys.pdf).
Rainfall, salinity, chlorophyll a concentration, bio-mass of giant kelp. To explore relationships betweenthe isotope values of suspended POM at the reefs andthe timing and intensity of storm events, we obtainedpublicly available data on daily rainfall measured onthe coastal plain at the Santa Barbara Flood ControlDistrict office, which lies 1 km inland from the coast(see above URL). Data on ocean salinity obtained frommoored conductivity sensors (Seabird SBE 37) at AQ,NA, and CA were used as an indicator of freshwaterrunoff. Conductivity was sampled at a depth of ~4.5 mbelow mean lower low water every 20 min.
The isotopic composition of suspended reef POMdepends not only on the sources of organic matter, butalso on their relative abundances. We assessed theabundance of phytoplankton on the reefs by measur-ing the chlorophyll a (chl a) concentration of the samewater samples that were analyzed for suspendedPOM at the reefs. We examined the biomass of giantkelp at our study reefs from 2001 to 2005 using datacollected by ISP Alginates, a San Diego-based kelpharvesting company that has conducted aerial surveysof Macrocystis biomass in southern California since1958 (see Reed et al. 2006 for a more detailed descrip-tion of these data). We used data for the administra-tive kelp beds defined by the California Departmentof Fish and Game that contained our study reefs: bed
numbers 30 (AQ: 1.01 km2), 28 (NA: 1.54 km2), 24(MO: 0.13 km2), and 20 (CA: 0.62 km2).
Sample preparation. Water samples used for chl aanalysis were filtered under vacuum through 0.45 µm47 mm HAWP Millipore filters. Filters were storedfrozen in glass scintillation vials at –20° C until analy-sis. Chl a concentrations were determined followingmethods of Parsons et al. (1984). For isotopic analysis ofsuspended POM, water samples were filtered undervacuum through pre-combusted (450°C for 5 h) 25 mmGF/F filters. The filters were stored at –20°C in pre-combusted foil pouches. In the laboratory, filters werethawed, transferred to clean scintillation vials, exposedto dilute HCl fumes to remove carbonates, and dried at65°C.
Macroalgal samples were rinsed in deionized water(DI), gently scrubbed to remove adhering material, andsubmerged in 10% HCl until bubbles ceased formingto remove any remaining calcified epiphytes, or (in thecase of the coralline red alga Corallina officinalis) cal-cium impregnated in the thallus. For macroinverte-brates, samples of tissue or entire individuals in thecase of some species (e.g. Corynactis californica, Dio-patra ornata) were analyzed (Table 1). Tissues wereexcised, submerged in 10% HCl until bubbles stoppedforming, rinsed with deionized water, and dried at60°C. Organisms that were analyzed whole were heldin seawater overnight to allow gut evacuation prior toprocessing. Dried samples of macroalgal and animalmaterial were ground to a fine powder with a ceramic
50
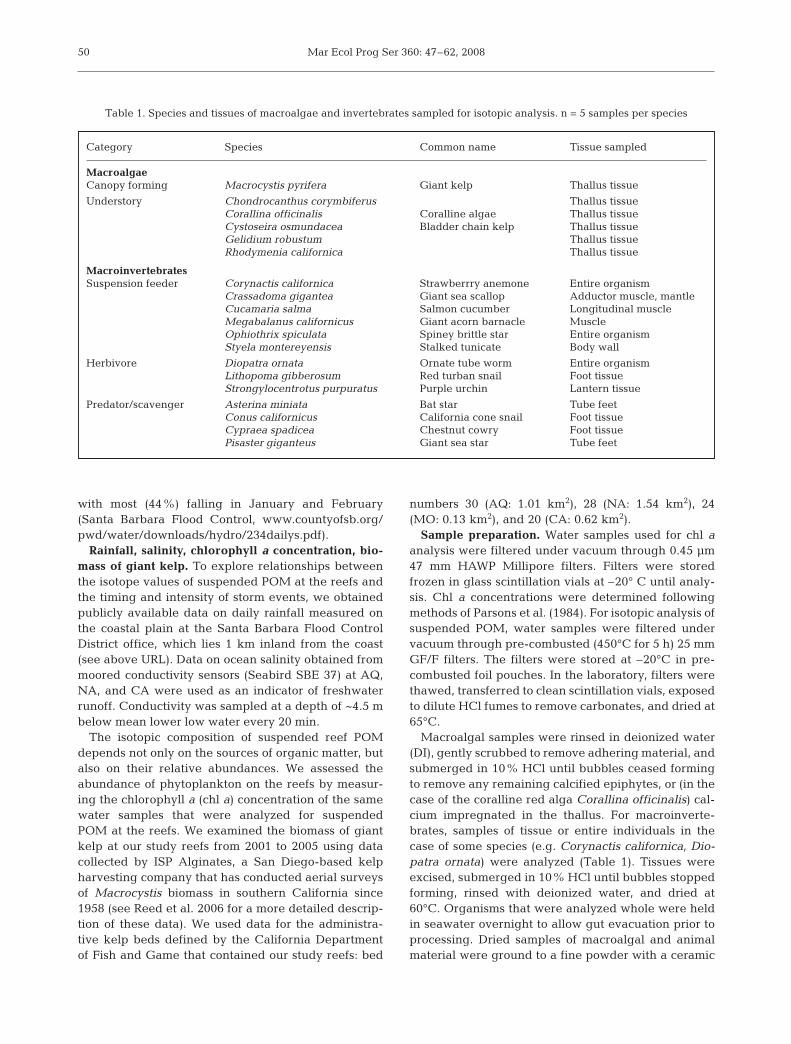
Category Species Common name Tissue sampled
MacroalgaeCanopy forming Macrocystis pyrifera Giant kelp Thallus tissue
Understory Chondrocanthus corymbiferus Thallus tissueCorallina officinalis Coralline algae Thallus tissueCystoseira osmundacea Bladder chain kelp Thallus tissueGelidium robustum Thallus tissueRhodymenia californica Thallus tissue
MacroinvertebratesSuspension feeder Corynactis californica Strawberrry anemone Entire organism
Crassadoma gigantea Giant sea scallop Adductor muscle, mantleCucamaria salma Salmon cucumber Longitudinal muscleMegabalanus californicus Giant acorn barnacle MuscleOphiothrix spiculata Spiney brittle star Entire organismStyela montereyensis Stalked tunicate Body wall
Herbivore Diopatra ornata Ornate tube worm Entire organismLithopoma gibberosum Red turban snail Foot tissueStrongylocentrotus purpuratus Purple urchin Lantern tissue
Predator/scavenger Asterina miniata Bat star Tube feetConus californicus California cone snail Foot tissueCypraea spadicea Chestnut cowry Foot tissuePisaster giganteus Giant sea star Tube feet
Table 1. Species and tissues of macroalgae and invertebrates sampled for isotopic analysis. n = 5 samples per species

Page et al.: Sources of organic matter to subtidal reef communities
mortar and pestle and stored in a desiccator untilanalysis.
Isotopic analysis. δ13C and δ15N values of POM,macroalgae, and invertebrate consumers were deter-mined using a Europa Tracermass isotope mass spec-trometer coupled with a Europa Roboprep elementalanalyzer unit for samples collected in 2001–2002 or aThermo Finnigan Delta-Plus Advantage isotope massspectrometer with a Costech EAS elemental analyzerfor samples collected in 2003–2005. Instrument preci-sion, determined from replicate analyses of the samestandard (NBS 1572, citrus leaf) run on both machineswas ±0.3‰ for C and ±0.5‰ for N for the Europa Trac-ermass and ±0.2‰ for C and N for the Thermo Finni-gan Delta-Plus Advantage. The natural abundances of13C and 15N are expressed in standard δ notation andcalculated as follows for element X:
δXn = 1000 × [(Rsample – Rstandard)/R],
where R = Xn/Xn–1 and expressed per mil (‰) relativeto the PDB standard for carbon and atmospheric N2 fornitrogen. Variation between replicate portions of thesame ground sample was generally less than 0.3‰ forC and 0.5‰ for N.
Data analysis. We used correlation analysis to exam-ine covariation in the stable isotope values of sus-pended POM among reefs over time, and to explore re-lationships between the isotope values of suspendedPOM and the abundance of 2 potential sources of or-ganic matter on the reefs: phytoplankton as chl a con-centration, and giant kelp. Samples of suspended POMand chl a concentration were taken on the same day,whereas estimates of giant kelp biomass were within7 d of collection of the POM samples. We used ANOVAfollowed by post hoc Tukey tests, if necessary, to test fordifferences in the isotopic composition of suspendedPOM and giant kelp among reefs, and of selected reefconsumers among reefs and times (Underwood 1997).Reef was treated as a fixed factor since the study reefswere chosen a priori based on anticipated differencesin exposure to freshwater runoff and in biomass of giantkelp. Time was treated as a fixed factor in the analysisof consumer isotope data since the same time-of-yearwas sampled each of 4 years and we were testing for anisotopic response in consumers to freshwater runoff. Allstatistical analyses were done using Systat 9.0 (SPSS).
A simple 2-source mixing model (Eddins 2001) wasused to estimate the proportion of terrestrial POM inthe reef POM pool on 3 occasions:
FT = (δ13CPOM – δ13CM)/(δ13CT – δ13CM),
where δ13CPOM is the C isotope value of the reef POM,δ13CT is the mean value of the terrestrial end-member,
δ13CM is the value of the marine end-member, and FT isthe proportional contribution of terrestrial particulatesto the reef POM pool.
RESULTS
Rainfall, salinity, biomass of giant kelp, chl aconcentration
Rainfall during the study occurred primarily duringDecember through March, exceeding the historicalannual mean prior to our study of 46 cm (calculatedfrom September through August, n = 129 yr) during2000–2001 (65.6 cm), 2002–2003 (63.4 cm), and2004–2005 (93.8 cm) and falling below the mean in2001–2002 (22.9 cm) and 2003–2004 (27.2 cm)(Fig. 2a). Rainfall during 2004–2005 was exceptionallyhigh and was exceeded in only 5 of the previous 133 yr.
Carpinteria Reef experienced the lowest daily meansalinity values of the study reefs (e.g. 29.2 to 31.1 psu inJanuary and February 2005; Fig. 2b). In general, salin-ity data indicated that the amount of time that reefswere exposed to substantial freshwater was brief evenfollowing major storm events. For example, during the4 yr period from 15 February 2001 through 30 April2005, daily mean salinity values fell below 32 psu foronly 14 d at Carpinteria Reef and only 3 and 2 d atNaples Reef and Arroyo Quemado Reef, respectively(Fig. 2). However, some freshwater influence wasdetectable at all reefs over the longer term during thewinter storms of 2005 when salinity values remainedbelow 33 psu on a scale of weeks at all sites (Fig. 2).
51
Time
Oct Apr Oct Apr Oct Apr Oct Apr Oct Apr
Sal
inity
(psu
)
28.030.031.5
32.0
32.5
33.0
33.5
34.0
Rai
nfal
l (cm
)
02468
101214
2001 2002 2003 2004 20052000
CA
AQNA
a
b
Fig. 2. Pattern of daily rainfall measured in Santa Barbara,California, and salinity measured at the study reefs. Site
abbreviations as in Fig. 1

Mar Ecol Prog Ser 360: 47–62, 2008
The biomass of giant kelp varied among reefs andover time (Fig. 3). Generally, kelp biomass was low atCA throughout the entire study and regionally low in2001 and 2002. Total kelp biomass was highest at NAand AQ in 2003 through 2005. Kelp plants grow yearround with fastest growth in the winter (D.C. Reedunpubl. data). Abrupt decreases in kelp biomass (e.g.Fall 2002, 2003) occurred as a result of disturbancefrom swell that removed entire plants from the reef.
Chl a concentrations were quite variable over time atall reefs, ranging from <0.5 to 20 µg l–1 during bloomevents (Fig. 4).
Isotope values of primary production
Offshore, terrestrial POM and reef macroalgae
The mean δ13C and δ15N values (± 1SD) for offshoresuspended POM computed across sampling dateswere –21.0 ± 1.2‰ and 6.8 ± 0.8‰, respectively(Table 2). Mean δ13C and δ15N values for POM in ter-restrial runoff were –24.6 ± 0.9‰ and 2.9 ± 1.5‰,respectively (n = 8 streams).
Mean values of new and old growth giant kelp com-puted across sampling dates ranged from –13.8 ± 1.9‰to –12.2 ± 1.0‰ (Table 3). There were significanteffects of month (ANOVA: p = 0.020, F11,85 = 2.230) andage of blade (p = 0.045, F1,85 = 4.140), but not reef (p =0.142, F2,85 = 1.996) on the δ13C values. However, thedifference in mean δ13C values among months (≤1.6‰)or between ages (≤0.8‰) was small.
Mean δ15N values of new and old growth kelp com-puted across sampling dates ranged from 8.5 ± 1.1‰ to9.7 ± 2.1‰ (Table 3). There were significant interactioneffects between age of blade and month (ANOVA: p =0.013, F11,85 = 2.384) and age of blade and reef (p =0.027, F2,85 = 3.766) on δ15N values, but again the differ-ences in mean values among months (≤1.7‰), amongreefs (≤0.7‰), and between ages (≤1.2‰) were small.
δ13C values of individual understory species gener-ally ranged between –23 and –18‰ and were 13C-
52
Time
Oct Apr Oct Apr Oct Apr Oct Apr Oct Apr
Bio
mas
s (m
t ke
lp b
ed–1
)
0
200
400
600
800
1000
1200
2000 2001 2002 2003 2004 2005
Bed 20 (CA)
Bed 28 (NA)Bed 30 (AQ)
Bed 24 (MO)
Fig. 3. Macrocystis pyrifera. Total biomass (metric tons, mt)per kelp bed estimated from aerial survey along sectionsof coastline that include AQ, NA, MO, and CA reefs from
2002 to 2005
δ13
CP
OM
(‰)
29
30
31
32
33
34
0
10
20
30
40
XXXXX
XXXXXXX
XXXXXX
X
XXXX XXX
X XXX X
X
X XXXXXX
X
Carpinteria Reef
Naples reef
Salinity (p
su)
29
30
31
32
33
34 Chlorop
hyll a (μg l –1)
0
10
20
30
40
XXXXXXXXXXXXX
XXXXXX
XXXXX
X
XXXXX
X
XXX X
X
X
X XXXXX
X
Arroyo Quemado
Time
–26
–24
–22
–20
–18
–16
–14
–12
–26
–24
–22
–20
–18
–16
–14
–12
–26
–24
–22
–20
–18
–16
–14
–12
29
30
31
32
33
34
0
10
20
30
40
XXXXXXXXXXXX XXXXX
XXXX
X
XX
XX X
X
XX
XX XXXX
2000 2001 2002 2003 2004 2005
δ13CPOMSalinity Chlorophyll aX
Oct Apr Oct Apr Oct Apr Oct Apr AprOct
Oct Apr Oct Apr Oct Apr Oct Apr AprOct
Oct Apr Oct Apr Oct Apr Oct Apr AprOctDate δ13C (‰) δ15N (‰) n
8 Sep 2002 –22.4 ± 1.0 6.2 ± 1.3 612 Oct 2003 –19.6 ± 1.4 7.3 ± 1.1 526 Feb 2004 –20.9 ± 1.1 7.5 ± 0.4 1210 May 2004 –20.0 ± 0.3 5.7 ± 0.4 313 Sep 2004 –21.9 ± 0.4 7.3 ± 0.9 5Mean –21.0 ± 1.2 6.8 ± 0.8
Table 2. Mean stable C and N isotope values (±1 SD) of sus-pended POM sampled in the Santa Barbara Channel 8 to
20 km offshore of the study reefs. n = number of samples
Fig. 4. δ13CPOM values and chl a concentration, from AQ, NA,and CA reefs. Values for δ13CPOM and chl a concentration con-nected by lines collected 1 mo apart. Time series data for
these variables are not available from MO

Page et al.: Sources of organic matter to subtidal reef communities
depleted relative to values of giant kelp (Table 4).There were significant interaction effects among reef,year, and species on δ13C values of understorymacroalgae (ANOVA: p < 0.01). δ13C values of 2 spe-cies (Chondracanthus corymbiferus, Corallina offici-nalis) from CA were noticeably 13C-enriched relativeto understory macroalgae from other reefs and otherspecies from the same reef. δ13C values of the red algaRhodymenia californica were distinctively more 13C-depleted (≤ –30‰) than other understory species orgiant kelp. δ15N values of understory macroalgae, gen-erally 6 to 9‰, overlapped values for giant kelp(Table 4). There were significant interactions amongreef, year, and species on δ15N values of understorymacroalgae (ANOVA: p < 0.01).
Isotope values of reef suspended POM
Monthly δ13C values of reef suspended POM rangedfrom –23.7 to –14.1‰ (Fig. 4). δ13C values of POM atAQ, NA, and CA were significantly correlated with
one another in time (AQ vs. NA: p =0.002, r2 = 0.226, n = 40; AQ vs. CA:p = 0.001, r2 = 0.444, n = 36; NA vs. CA:p = 0.001, r2 = 0.254, n = 41) and themean values (± 1 SD) for each reefaveraged over time (AQ: –19.2 ± 1.7;NA: –19.4 ± 2.4; CA: –18.8 ± 2.0) werenot significantly different from eachother (ANOVA: p = 0.319, F2,128 =1.154).
δ13C values of reef POM tended todecrease following periods of signifi-cant rainfall (as indicated by a drop in
salinity), increase during phytoplankton blooms (asmeasured by chl a concentration), and generallydecline in late fall through early winter at all reefs inthe absence of any obvious drivers (Fig. 4). Abruptdeclines in δ13CPOM (ranging from 2.6 to 8.4‰) follow-ing significant rainfall events were most evident at CA(e.g. 5 February 2001, 7 January 2003, 7 January 2005),which experiences the greatest amount of freshwaterrunoff. However, this pattern did not necessarily occurat the other reefs, which were less influenced by fresh-water runoff. For example, the appreciable change inδ13CPOM values evident at CA in early February 2001was not evident at NA.
If one assumes that abrupt decreases in δ13CPOM val-ues at CA following storm events were due to inputs ofland-derived POM, then a 2-source mixing model canbe used to estimate the proportion of these particulatesin the reef POM pool (Eddins 2001). Using a value of–24.6‰ as the terrestrial end-member (δ13CT) and val-ues of –14.1, –17.6, and –17.2‰ as the marine end-members (δ13CM) prior to the storms of January 2001,December 2002, and December 2004, respectively, we
53
Reef New growth Old growthδ13C (‰) δ15N (‰) δ13C (‰) δ15N (‰)
Arroyo –12.2 ± 1.0 (27) 9.7 ± 1.4 (27) –12.7 ± 1.3 (27) 8.6 ± 1.2 (27)Quemado
Naples –13.0 ± 2.0 (31) 9.5 ± 1.6 (31) –13.8 ± 1.9 (30) 8.5 ± 1.1 (30)
Carpinteria –12.4 ± 1.0 (18) 9.7 ± 0.9 (18) –13.2 ± 1.4 (16) 9.7 ± 2.1 (16)
Table 3. Macrocystis pyrifera. Mean stable C and N isotope values (±1 SD) fornew and old growth blades sampled from December 2000 to January 2005.Mean values calculated over time. Number of samples from each reef in
parentheses
Taxon Arroyo Quemado Naples Mohawk Carpinteria
δδ13CChondracanthus corymbiferus –24.3 ± 2.2 –21.1 ± 3.8 –21.6 ± 3.4 –15.5 (2)Corallina officinalis –22.3 ± 0.3 –18.6 ± 3.0 –19.8 ± 0.9 –15.4 ± 0.8Cystoseira osmundacea –21.8 ± 3.0 –22.1 ± 0.9 –21.2 ± 1.0 –18.6 (2)Gelidium robustum –22.2 (2) –20.2 ± 1.3 –21.0 ± 1.3 –17.4 ± 2.3Rhodymenia californica –31.7 (2) –31.5 (2) –31.0 (2) –30.3 (2)Mean value –22.8 ± 1.3 –20.6 ± 1.8 –20.9 ± 0.9 –16.8 ± 2.4
δδ15NChondracanthus corymbiferus 7.3 ± 1.1 6.9 ± 0.9 7.1 ± 0.8 8.3 ± 1.0Corallina officinalis 8.2 ± 0.6 8.0 ± 0.5 8.2 ± 0.4 9.7 ± 0.7Cystoseira osmundacea 8.2 ± 1.0 6.3 ± 0.5 8.1 ± 1.3 5.9 ± 2.9Gelidium robustum 9.4 (2) 7.3 ± 1.2 4.9 ± 0.1 7.5 ± 1.3Rhodymenia californica 7.8 (2) 7.8 (2) 8.0 (2) 7.9 (2)Mean value 7.9 ± 0.5 7.1 ± 0.9 7.8 ± 0.6 8.0 ± 1.9
Table 4. Mean C and N isotope values (±1 SD) for 5 species of understory algae sampled annually from 2002 to 2005. Meanvalue for all taxa, excluding Rhodymenia californica, averaged across years. Values are averages of 4 yr unless indicated
otherwise in parentheses

Mar Ecol Prog Ser 360: 47–62, 2008
estimated that ~80, 39, and 37% of the suspendedPOM was of terrestrial origin in the samples collectedfollowing these storm events.
We explored the potential importance of temporaland spatial variation in the biomass of giant kelp ininfluencing reef δ13CPOM values (Fig. 5). We expectedthat δ13CPOM values would be more positive on reefsand in years of greater kelp biomass, reflecting kelpdetrital inputs to the POM pool. However, δ13CPOM val-ues were not correlated with the biomass of giant kelpat AQ (p = 0.138, r2 = 0.118, n = 23) or NA (p = 0.110,r2 = 0.117, n = 23); δ13CPOM values were unexpectedlynegatively correlated with kelp biomass at CA (p =0.043, r2 = 0.210, n = 22).
We also examined the potential importance of phyto-plankton abundance in influencing δ13CPOM values.Our expectation here was that reef δ13CPOM valueswould more closely resemble δ13C values of oceanphytoplankton (i.e. become more negative) duringperiods of high chl a concentration. Overall, there wasno correlation between reef δ13CPOM values and chl aconcentration (p > 0.05). However, chl a concentrationswere higher and more variable from January 2003through April 2005 than in the preceding months(Fig. 4). In contrast to expectations, δ13CPOM valueswere positively correlated with chl a concentration atall reefs during this period (AQ: p = 0.018, r2 = 0.237,n = 20; NA: p = 0.001, r2 = 0.563, n = 22; CA: p = 0.020,r2 = 0.267, n = 20).
Monthly δ15NPOM values ranged from 2.7 to 14.5‰across the reefs (Fig. 6). There was a significant corre-lation in values among reefs over time (AQ vs. NA: p =0.005, r2 = 0.192, n = 39; AQ vs. CA: p = 0.001, r2 = 0.291n = 37; NA vs. CA: p = 0.001, r2 = 0.412, n = 42), andmean values for each reef averaged over time (AQ:8.9 ± 2.3‰; NA: 8.3 ± 1.8; CA: 8.7 ± 2.6) were not sig-nificantly different (p = 0.310, F2, 128 = 1.181, ANOVA).δ15NPOM values were variable, but there was a generalpattern of more 15N-enriched values during the latesummer and fall at all reefs (Fig. 6). A consistent pat-tern of change in δ15NPOM values associated with rain-fall events (as indicated by a drop in salinity) wasabsent. There was no correlation between δ15NPOM val-ues and chl a concentration overall or for the periodfrom January 2003 through April 2005 (AQ: p = 0.922;NA: p = 0.371; CA: p = 0.742).
Isotope values of reef consumers
Patterns among taxa and functional groups
δ13C values for reef suspension-feeders tended to be13C-depleted relative to values of benthic herbivoresand predators; however, substantial variability among
54
Kelp biomass (mt bed–1)0 200 400 600 800 1000 1200
δ13
CP
OM
(‰)
–26
–24
–22
–20
–18
–16
–14Arroyo Quemado, r2 = 0.118Naples, r2 = 0.117Carpinteria, r2 = 0.210
Fig. 5. Relationship between the biomass of giant kelp and the δ13C value of suspended POM
2000 2001 2002 2003 2004 2005
Arroyo Quemado Reef
Time
Oct Apr Oct Apr Oct Apr Oct Apr Oct Apr
Oct Apr Oct Apr Oct Apr Oct Apr Oct Apr
Oct Apr Oct Apr Oct Apr Oct Apr Oct Apr
0
10
20
30
40
XXXXXXXXXXXX XXXXXX
XXXX
X
XX
XX X
X
XX
XX XX
XX0
5
10
15
20
0
5
10
15
20
0
5
10
15
20
29
30
31
32
33
34
0
10
20
30
40
XXXXXX
XXXXXXX
XXXXXX
X
XXX XXX
X XXX X
X
X
X XXXXXX
X
29
30
31
32
33
34Carpinteria Reef
Chlorophyll aXδ15 NPOMSalinity
Naples Reef Chlorop
hyll a (µgl –1)
0
10
20
30
40
XXXXXXXXX
XXXX
XXXXXX
XXXXX
X
XXXXX
X
XXX X
X
X
X XXXXX
Xδ15
NP
OM
(‰)
Salinity (p
su)
29
30
31
32
33
34
Fig. 6. δ15NPOM values and chl a concentration, and salinityfrom AQ, NA, and CA. Values for δ15NPOM and chl a concen-
tration connected by lines collected 1 mo apart
Page et al.: Sources of organic matter to subtidal reef communities
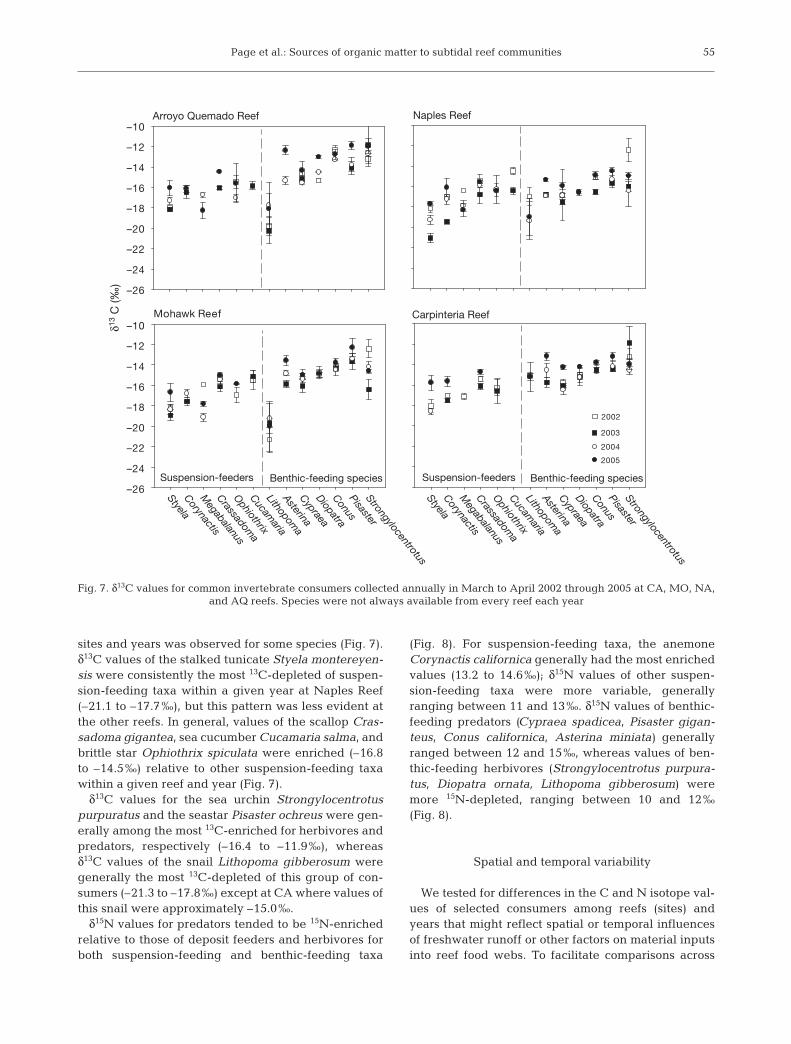
sites and years was observed for some species (Fig. 7).δ13C values of the stalked tunicate Styela montereyen-sis were consistently the most 13C-depleted of suspen-sion-feeding taxa within a given year at Naples Reef(–21.1 to –17.7‰), but this pattern was less evident atthe other reefs. In general, values of the scallop Cras-sadoma gigantea, sea cucumber Cucamaria salma, andbrittle star Ophiothrix spiculata were enriched (–16.8to –14.5‰) relative to other suspension-feeding taxawithin a given reef and year (Fig. 7).
δ13C values for the sea urchin Strongylocentrotuspurpuratus and the seastar Pisaster ochreus were gen-erally among the most 13C-enriched for herbivores andpredators, respectively (–16.4 to –11.9‰), whereasδ13C values of the snail Lithopoma gibberosum weregenerally the most 13C-depleted of this group of con-sumers (–21.3 to –17.8‰) except at CA where values ofthis snail were approximately –15.0‰.
δ15N values for predators tended to be 15N-enrichedrelative to those of deposit feeders and herbivores forboth suspension-feeding and benthic-feeding taxa
(Fig. 8). For suspension-feeding taxa, the anemoneCorynactis californica generally had the most enrichedvalues (13.2 to 14.6‰); δ15N values of other suspen-sion-feeding taxa were more variable, generallyranging between 11 and 13‰. δ15N values of benthic-feeding predators (Cypraea spadicea, Pisaster gigan-teus, Conus californica, Asterina miniata) generallyranged between 12 and 15‰, whereas values of ben-thic-feeding herbivores (Strongylocentrotus purpura-tus, Diopatra ornata, Lithopoma gibberosum) weremore 15N-depleted, ranging between 10 and 12‰(Fig. 8).
Spatial and temporal variability
We tested for differences in the C and N isotope val-ues of selected consumers among reefs (sites) andyears that might reflect spatial or temporal influencesof freshwater runoff or other factors on material inputsinto reef food webs. To facilitate comparisons across
55
2002
2003
2004
2005
Arroyo Quemado Reef
–26
–24
–22
–20
–18
–16
–14
–12
–10
–26
–24
–22
–20
–18
–16
–14
–12
–10Mohawk Reef
StyelaCorynactisM
egabalanus
Crassadoma
OphiothrixCucam
ariaLithopom
aAsterinaCypraeaDiopatraConusPisasterStrongylocentrotusStyelaCorynactisM
egabalanus
Crassadoma
OphiothrixCucam
ariaLithopom
aAsterinaCypraeaDiopatraConusPisasterStrongylocentrotus
Naples Reef
Benthic-feeding speciesSuspension-feeders Benthic-feeding speciesSuspension-feeders
Carpinteria Reef
δ13 C
(‰)
Fig. 7. δ13C values for common invertebrate consumers collected annually in March to April 2002 through 2005 at CA, MO, NA, and AQ reefs. Species were not always available from every reef each year

Mar Ecol Prog Ser 360: 47–62, 2008
reefs and reduce variability associated withtrophic enrichment effects (DeNiro & Epstein1978, 1981, Minagawa & Wada 1984, Peter-son & Fry 1987), this analysis focused on the4 lower trophic level taxa that were sampledon all reefs in at least 2 years (the stalkedtunicate Styela montereyensis, the purple seaurchin Stronglocentrotus purpuratus, theornate tube worm Diopatra ornata, and theturban snail Lithopoma gibberosum).
For δ13C values, there was a significantreef × year interaction for all 4 consumers(ANOVA: p < 0.001). Differences in meanδ13C values among reefs and years were gen-erally small (≤1.5‰) and consistent patternsthat might suggest an influence of reef loca-tion or of ‘wet’ or ‘dry’ year on consumer δ13Cvalues were absent (Fig. 7). Noteworthyexceptions include the consistently 13C-enriched values of Lithopoma gibberosumacross all years at CA (–15.1 ± 0.8) comparedwith the other reefs (–19.9 ± 1.6 to –18.2 ±
56
4
6
8
10
12
14
16
18
4
6
8
10
12
14
16
18
2002
2003
20042005
Arroyo Quemado Reef
Mohawk Reef
Styela
Corynactis
Megabalanus
Crassadoma
Ophiothrix
Cucamaria
Lithopoma
Asterina
Cypraea
Diopatra
Conus
Pisaster
Strongylocentrotus
Styela
Corynactis
Megabalanus
Crassadoma
Ophiothrix
Cucamaria
Lithopoma
Asterina
Cypraea
Diopatra
Conus
Pisaster
Strongylocentrotus
Naples Reef
Benthic-feeding speciesSuspension-feeders Benthic-feeding speciesSuspension-feeders
Carpinteria Reef
δ15 C
(‰)
Fig. 8. δ15N values for common invertebrate consumers for the years 2002 through 2005. Sample sites and collection time as in Fig. 7
Strongylocentrotus purpuratus
δ15
N (‰
)
9
10
11
12
13
14
15 Diopatra ornata
Styela montereyensis
ReefAQ NA MO CA
9
10
11
12
13
14
15 Lithopoma gibberosum
AQ NA MO CA
2002200320042005
Fig. 9. Variation in the δ15N values of selected consumers among reefs.Reefs are arranged from left to right relative to increasing influence of
freshwater runoff as measured by variation in salinity

Page et al.: Sources of organic matter to subtidal reef communities
1.9‰). δ13C values of Strongylocentrous purpuratusand Diopatra ornata were also consistently most 13C-enriched at AQ, whereas values for Styela mon-tereyensis were most 13C-depleted at NA.
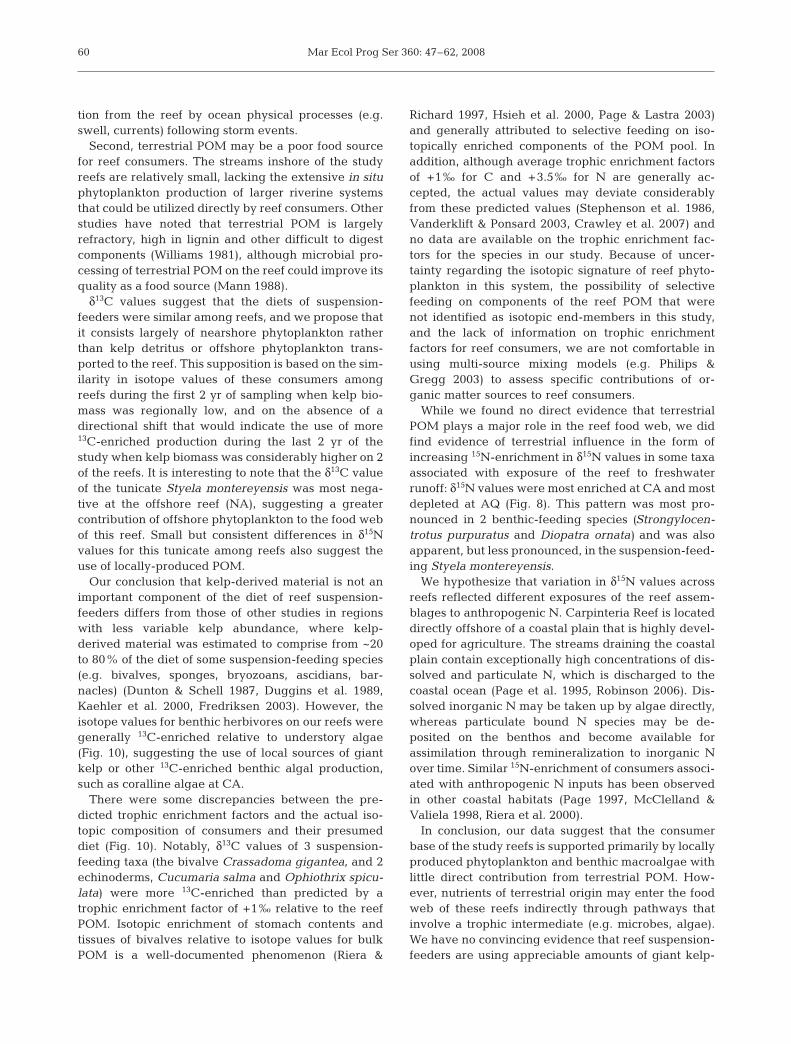
There was a significant reef effect on the δ15N valuesfor 3 of 4 species, Diopatra ornata (ANOVA: p < 0.001,F3,25 = 26.225), Strongylocentrotus purpuratus (p <0.001, F3,60 = 15.098), and Lithopoma gibberosum (p <0.001, F3,54 = 10.719), in the absence of a reef × year in-teraction. Overall, δ15N values for S. purpuratus and D.ornata were significantly 15N-enriched at CA comparedwith the other reefs (Tukey test: p < 0.01) (Fig. 9).
A similar, though less pronounced, pattern wasfound for Styela montereyensis, but the significanteffect of reef was confounded by a reef × year interac-
tion (ANOVA: p = 0.007, F8,57 = 3.026). Although therewere significant effects of reef and year (p < 0.001,F3,54 = 20.897) on the δ15N values of Lithopoma gib-berosum, differences in mean values across reefs andamong years were small (≤1‰) and no patterns wereevident (Fig. 9).
Sources of production used by reef consumers
When averaged across years, plots of δ15N versusδ13C values (Fig. 10) provide a qualitative depiction ofpotential sources of organic matter used by consumersat each reef; however, these plots do not consider inter-annual variability in sources of production that include
57
δ15 N
(‰)
δ13 C (‰)
Naples ReefArroyo Quemado Reef
TerrestrialPOM
TerrestrialPOM
TerrestrialPOM
TerrestrialPOM
Understoryalgae
Understoryalgae
Understoryalgae
Understoryalgae
OffshorePOM
OffshorePOM
OffshorePOM
OffshorePOM
Giantkelp
Giantkelp
Giantkelp
0
2
4
6
8
10
12
14
16
18
0
2
4
6
8
10
12
14
16
18
Mohawk Reef
–30 –28 –26 –24 –22 –20 –18 –16 –14 –12 –10 –30 –28 –26 24 –22 –20 –18 –16 –14 –12 –10
Carpinteria Reef
Giantkelp
98
13
6
121
9
23
47
5
98
6
1
9
23
47
56
3
13
110
115
47 29
12
8
6
3
1
5
47 2
12
2
1
345
68
1310
2
1
345
6
7
11
9
8
14 13
59
1210
8
732
1168
14
559
8
732
6
Reef POM
Reef POMReef POM
ReefPOM
10
Fig. 10. δ15N versus δ13C values averaged across years for common invertebrate consumers from AQ, NA, MO and CA reefstogether with mean values (±1 SD) enclosed by rectangles for the giant kelp Macrocystis pyrifiera, and suspended reef POM,understory macroalgae, offshore POM, and terrestrial POM (values from text and Tables 2 to 4). Giant kelp was not abundant atCarpinteria Reef during this study. Consumer values are from Figs. 7 & 8. Arrow: predicted trophic enrichment in isotope valuesfor C (+1‰) and N (+3.5‰); (re): suspension-feeders, (1) Corynactis californica, (2) Crassadoma gigantea, (3) Cucumaria salma,(4) Megabalanus californicus, (5) Ophiothrix spiculata, and (6) Styela montereyensis; (h): benthic-feeding herbivores, (7)Lithopoma gibberosum, (8) Diopatra ornata, (9) Strongylocentrotus purpuratus; (s): benthic-feeding predators/scavengers, (10)Conus californicus, (11) Cypraea spadicea, (12) Asterina miniata, (13) Pisaster ochraceus. Taxonomic category and common
names are provided in Table 1
Mar Ecol Prog Ser 360: 47–62, 2008
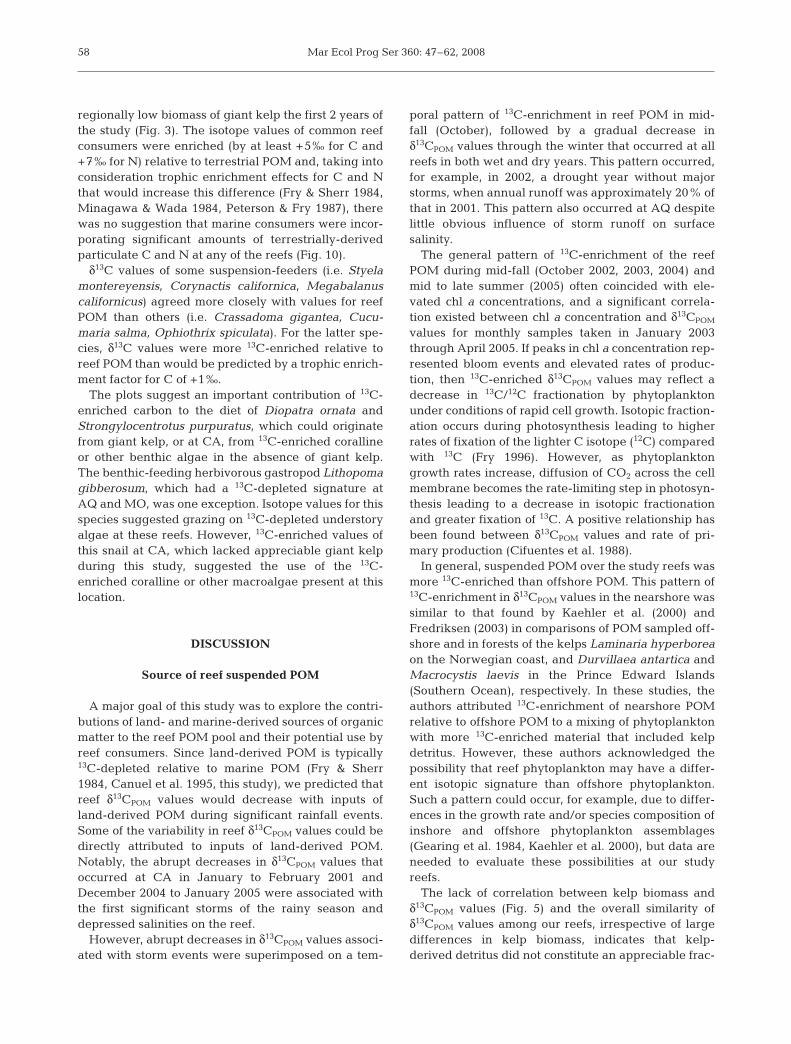
regionally low biomass of giant kelp the first 2 years ofthe study (Fig. 3). The isotope values of common reefconsumers were enriched (by at least +5‰ for C and+7‰ for N) relative to terrestrial POM and, taking intoconsideration trophic enrichment effects for C and Nthat would increase this difference (Fry & Sherr 1984,Minagawa & Wada 1984, Peterson & Fry 1987), therewas no suggestion that marine consumers were incor-porating significant amounts of terrestrially-derivedparticulate C and N at any of the reefs (Fig. 10).
δ13C values of some suspension-feeders (i.e. Styelamontereyensis, Corynactis californica, Megabalanuscalifornicus) agreed more closely with values for reefPOM than others (i.e. Crassadoma gigantea, Cucu-maria salma, Ophiothrix spiculata). For the latter spe-cies, δ13C values were more 13C-enriched relative toreef POM than would be predicted by a trophic enrich-ment factor for C of +1‰.
The plots suggest an important contribution of 13C-enriched carbon to the diet of Diopatra ornata andStrongylocentrotus purpuratus, which could originatefrom giant kelp, or at CA, from 13C-enriched corallineor other benthic algae in the absence of giant kelp.The benthic-feeding herbivorous gastropod Lithopomagibberosum, which had a 13C-depleted signature atAQ and MO, was one exception. Isotope values for thisspecies suggested grazing on 13C-depleted understoryalgae at these reefs. However, 13C-enriched values ofthis snail at CA, which lacked appreciable giant kelpduring this study, suggested the use of the 13C-enriched coralline or other macroalgae present at thislocation.
DISCUSSION
Source of reef suspended POM
A major goal of this study was to explore the contri-butions of land- and marine-derived sources of organicmatter to the reef POM pool and their potential use byreef consumers. Since land-derived POM is typically13C-depleted relative to marine POM (Fry & Sherr1984, Canuel et al. 1995, this study), we predicted thatreef δ13CPOM values would decrease with inputs ofland-derived POM during significant rainfall events.Some of the variability in reef δ13CPOM values could bedirectly attributed to inputs of land-derived POM.Notably, the abrupt decreases in δ13CPOM values thatoccurred at CA in January to February 2001 andDecember 2004 to January 2005 were associated withthe first significant storms of the rainy season anddepressed salinities on the reef.
However, abrupt decreases in δ13CPOM values associ-ated with storm events were superimposed on a tem-
poral pattern of 13C-enrichment in reef POM in mid-fall (October), followed by a gradual decrease inδ13CPOM values through the winter that occurred at allreefs in both wet and dry years. This pattern occurred,for example, in 2002, a drought year without majorstorms, when annual runoff was approximately 20% ofthat in 2001. This pattern also occurred at AQ despitelittle obvious influence of storm runoff on surfacesalinity.
The general pattern of 13C-enrichment of the reefPOM during mid-fall (October 2002, 2003, 2004) andmid to late summer (2005) often coincided with ele-vated chl a concentrations, and a significant correla-tion existed between chl a concentration and δ13CPOM
values for monthly samples taken in January 2003through April 2005. If peaks in chl a concentration rep-resented bloom events and elevated rates of produc-tion, then 13C-enriched δ13CPOM values may reflect adecrease in 13C/12C fractionation by phytoplanktonunder conditions of rapid cell growth. Isotopic fraction-ation occurs during photosynthesis leading to higherrates of fixation of the lighter C isotope (12C) comparedwith 13C (Fry 1996). However, as phytoplanktongrowth rates increase, diffusion of CO2 across the cellmembrane becomes the rate-limiting step in photosyn-thesis leading to a decrease in isotopic fractionationand greater fixation of 13C. A positive relationship hasbeen found between δ13CPOM values and rate of pri-mary production (Cifuentes et al. 1988).
In general, suspended POM over the study reefs wasmore 13C-enriched than offshore POM. This pattern of13C-enrichment in δ13CPOM values in the nearshore wassimilar to that found by Kaehler et al. (2000) andFredriksen (2003) in comparisons of POM sampled off-shore and in forests of the kelps Laminaria hyperboreaon the Norwegian coast, and Durvillaea antartica andMacrocystis laevis in the Prince Edward Islands(Southern Ocean), respectively. In these studies, theauthors attributed 13C-enrichment of nearshore POMrelative to offshore POM to a mixing of phytoplanktonwith more 13C-enriched material that included kelpdetritus. However, these authors acknowledged thepossibility that reef phytoplankton may have a differ-ent isotopic signature than offshore phytoplankton.Such a pattern could occur, for example, due to differ-ences in the growth rate and/or species composition ofinshore and offshore phytoplankton assemblages(Gearing et al. 1984, Kaehler et al. 2000), but data areneeded to evaluate these possibilities at our studyreefs.
The lack of correlation between kelp biomass andδ13CPOM values (Fig. 5) and the overall similarity ofδ13CPOM values among our reefs, irrespective of largedifferences in kelp biomass, indicates that kelp-derived detritus did not constitute an appreciable frac-
58

Page et al.: Sources of organic matter to subtidal reef communities
tion of the reef suspended POM during our study. Thecontribution of kelp-derived detritus to the reef POMpool can not be confidently quantified with a mixingmodel that uses kelp and offshore phytoplankton Cisotope values as end-members if the δ13C value forreef phytoplankton differs from that of offshore phyto-plankton, as suggested by the positive relationshipbetween δ13CPOM values and phytoplankton standingcrop (chl a concentration) in 2003–2005. In this regard,our analyses benefited from the multi-year dataset,which showed the temporal variability in isotopic com-position of reef δ13CPOM and its relationship with chl aconcentration and giant kelp biomass. Our study sug-gests that caution be used in drawing conclusions fromdata with little temporal replication and illustrates theimportance of possessing ancillary data on producerabundance. More detailed studies comparing the pro-ductivity and composition of inshore and offshorephytoplankton assemblages are needed to evaluatesources of variation in the isotope values of thesesources.
Isotopic composition of reef macroalgae
Mean δ13C values of giant kelp were distinctly en-riched (+6 to +8‰) relative to values of suspended reefPOM. This phenomenon, also reported for other geo-graphic locations (Dunton & Schell 1987, Duggins et al.1989, Kaehler et al. 2000, Fredriksen 2003), is gener-ally attributed to CO2 limitation at the blade–waterboundary in rapidly growing kelp plants, whichreduces isotopic discrimination between 12C and 13Cduring carbon fixation (Simenstad et al. 1993). This sit-uation may occur at our study sites since the growthrate of Macrocystis pyrifera is rapid (up to ~3% perday, Coon 1982). An alternative hypothesis, proposedto explain 13C-enrichment in Alaria fistulosa in subarc-tic Alaskan waters, places more emphasis on the roleof high kelp standing crop and its interaction with localhydrodynamic conditions to reduce [CO2]aq, whichleads to CO2 limitation during carbon fixation and sub-sequent 13C-enrichment of kelp plants (Simenstad etal. 1993). This mechanism of interaction between kelpstanding crop and the hydrodynamic environment inaffecting 13C/12C fractionation was proposed to explainsome of the among site variation observed in kelp δ13Cvalues in that study. However, we found little evidencesupporting this hypothesis in our study as we observedlittle variation among reefs in δ13C values of giant kelpdespite large differences in kelp standing crop. Othermechanisms proposed to explain 13C-enrichment ofmacroalgae include the differential storage andtranslocation of biochemical components of differentisotopic composition (Fredriksen 2003) and increased
uptake of HCO3– under conditions of CO2 limitation
(Maberly et al. 1992).In contrast to the 13C-enriched values of giant kelp,
δ13C values of understory macroalgae were within therange of values reported for macroalgae in other stud-ies (e.g. Simenstad & Wissmar 1985, Duggins et al.1989). Of interest, δ13C values of the red alga Rhody-menia californica were quite 13C-depleted relative tovalues for Macrocystis pyrifera and understory brownmacroalgae. 13C-depleted values (< –30‰) of some redalgal taxa have also been noted by others and mayrelate to the inability of these algae to use HCO3
–,which has a more positive δ13C signature than CO2 inseawater, as a photosynthetic carbon source (reviewedin Raven et al. 2002). The standing crop of R. califor-nica was low at our study sites and its contribution tothe reef POM pool would probably be small relative tothe total amount of C produced by phytoplankton,other understory algae, and giant kelp.
Sources of production used by reef consumers
The absence of a consistent directional shift in con-sumer isotope values towards the isotope values of ter-restrial organic matter in ‘wet’ years, or with greaterinfluence of freshwater runoff at CA (Figs. 7, 8 & 9),allows us to conclude that reef consumers were notdirectly incorporating significant amounts of land-derived production in this open coast ecosystem. Todate, reports of the use of terrestrial or freshwater-derived production by consumers in the coastal zonehave largely been restricted to estuarine systems thatreceive significant riverine inputs (Canuel et al. 1995,Riera & Richard 1997, Chanton & Lewis 2002). In thesesystems, consumer δ13C values are most negative inclosest proximity to the river mouth and increase withdistance from the influence of river inputs; a patternthat reflects the use of terrestrial (riverine) organicmatter and/or estuarine production that has assimi-lated terrestrially-derived 13C-depleted dissolved inor-ganic carbon (DIC).
The absence of a pattern indicative of the incorpora-tion of terrestrially-derived POM by reef consumerssuggests 2 possible explanations. First, the exposuretime of reef organisms to terrestrial inputs may not belong enough, relative to carbon turnover time in organ-ism tissues, to detect the incorporation of this carbonsource in δ13C values. Unlike estuarine systems thatreceive and retain more riverine inputs of organic mat-ter, our study reefs experience runoff events that arehighly seasonal and episodic. Reef consumers areprobably exposed to suspended terrestrial inputs onthe order of days to perhaps weeks, depending onrates of deposition, retention, resuspension and advec-
59
Mar Ecol Prog Ser 360: 47–62, 2008
tion from the reef by ocean physical processes (e.g.swell, currents) following storm events.
Second, terrestrial POM may be a poor food sourcefor reef consumers. The streams inshore of the studyreefs are relatively small, lacking the extensive in situphytoplankton production of larger riverine systemsthat could be utilized directly by reef consumers. Otherstudies have noted that terrestrial POM is largelyrefractory, high in lignin and other difficult to digestcomponents (Williams 1981), although microbial pro-cessing of terrestrial POM on the reef could improve itsquality as a food source (Mann 1988).
δ13C values suggest that the diets of suspension-feeders were similar among reefs, and we propose thatit consists largely of nearshore phytoplankton ratherthan kelp detritus or offshore phytoplankton trans-ported to the reef. This supposition is based on the sim-ilarity in isotope values of these consumers amongreefs during the first 2 yr of sampling when kelp bio-mass was regionally low, and on the absence of adirectional shift that would indicate the use of more13C-enriched production during the last 2 yr of thestudy when kelp biomass was considerably higher on 2of the reefs. It is interesting to note that the δ13C valueof the tunicate Styela montereyensis was most nega-tive at the offshore reef (NA), suggesting a greatercontribution of offshore phytoplankton to the food webof this reef. Small but consistent differences in δ15Nvalues for this tunicate among reefs also suggest theuse of locally-produced POM.
Our conclusion that kelp-derived material is not animportant component of the diet of reef suspension-feeders differs from those of other studies in regionswith less variable kelp abundance, where kelp-derived material was estimated to comprise from ~20to 80% of the diet of some suspension-feeding species(e.g. bivalves, sponges, bryozoans, ascidians, bar-nacles) (Dunton & Schell 1987, Duggins et al. 1989,Kaehler et al. 2000, Fredriksen 2003). However, theisotope values for benthic herbivores on our reefs weregenerally 13C-enriched relative to understory algae(Fig. 10), suggesting the use of local sources of giantkelp or other 13C-enriched benthic algal production,such as coralline algae at CA.
There were some discrepancies between the pre-dicted trophic enrichment factors and the actual iso-topic composition of consumers and their presumeddiet (Fig. 10). Notably, δ13C values of 3 suspension-feeding taxa (the bivalve Crassadoma gigantea, and 2echinoderms, Cucumaria salma and Ophiothrix spicu-lata) were more 13C-enriched than predicted by atrophic enrichment factor of +1‰ relative to the reefPOM. Isotopic enrichment of stomach contents andtissues of bivalves relative to isotope values for bulkPOM is a well-documented phenomenon (Riera &
Richard 1997, Hsieh et al. 2000, Page & Lastra 2003)and generally attributed to selective feeding on iso-topically enriched components of the POM pool. Inaddition, although average trophic enrichment factorsof +1‰ for C and +3.5‰ for N are generally ac-cepted, the actual values may deviate considerablyfrom these predicted values (Stephenson et al. 1986,Vanderklift & Ponsard 2003, Crawley et al. 2007) andno data are available on the trophic enrichment fac-tors for the species in our study. Because of uncer-tainty regarding the isotopic signature of reef phyto-plankton in this system, the possibility of selectivefeeding on components of the reef POM that werenot identified as isotopic end-members in this study,and the lack of information on trophic enrichmentfactors for reef consumers, we are not comfortable inusing multi-source mixing models (e.g. Philips &Gregg 2003) to assess specific contributions of or-ganic matter sources to reef consumers.
While we found no direct evidence that terrestrialPOM plays a major role in the reef food web, we didfind evidence of terrestrial influence in the form ofincreasing 15N-enrichment in δ15N values in some taxaassociated with exposure of the reef to freshwaterrunoff: δ15N values were most enriched at CA and mostdepleted at AQ (Fig. 8). This pattern was most pro-nounced in 2 benthic-feeding species (Strongylocen-trotus purpuratus and Diopatra ornata) and was alsoapparent, but less pronounced, in the suspension-feed-ing Styela montereyensis.
We hypothesize that variation in δ15N values acrossreefs reflected different exposures of the reef assem-blages to anthropogenic N. Carpinteria Reef is locateddirectly offshore of a coastal plain that is highly devel-oped for agriculture. The streams draining the coastalplain contain exceptionally high concentrations of dis-solved and particulate N, which is discharged to thecoastal ocean (Page et al. 1995, Robinson 2006). Dis-solved inorganic N may be taken up by algae directly,whereas particulate bound N species may be de-posited on the benthos and become available forassimilation through remineralization to inorganic Nover time. Similar 15N-enrichment of consumers associ-ated with anthropogenic N inputs has been observedin other coastal habitats (Page 1997, McClelland &Valiela 1998, Riera et al. 2000).
In conclusion, our data suggest that the consumerbase of the study reefs is supported primarily by locallyproduced phytoplankton and benthic macroalgae withlittle direct contribution from terrestrial POM. How-ever, nutrients of terrestrial origin may enter the foodweb of these reefs indirectly through pathways thatinvolve a trophic intermediate (e.g. microbes, algae).We have no convincing evidence that reef suspension-feeders are using appreciable amounts of giant kelp-
60
Page et al.: Sources of organic matter to subtidal reef communities
derived POM, but consumption of kelp by benthicherbivores was evident. Thus, spatial and temporalfluctuations in the biomass of giant kelp in this systemwill likely have disproportionately larger effects onconsumers that feed on the bottom compared to thosethat feed on particles suspended in the water column.
Acknowledgements. We thank M. Anghera, B. Evans, J.Hoesterey, B. Mardian, C. Nelson, J. Jones, and S. Harrer forcollecting and processing marine samples, S. Coombs and F.Setaro for collecting and processing stream samples, and R.Petty for conducting the isotope analyses. This research wassupported by the National Science Foundation (Award Nos.OCE-9982105 and OCE-0620276).
LITERATURE CITED
Beighley E, Melack JM, Dunne T (2003) Impacts of Califor-nia’s climatic regimes and coastal development patternson streamflow characteristics. J Am Water Resour Assoc39:1419–1433
Bishop JKB, Davis RE, Sherman JT (2002) Robotic observa-tions of dust storm enhancement of carbon biomass in theNorth Pacific. Science 298:817–821
Bouchard SS, Bjorndal KA (2000) Sea turtles as biologicaltransporters of nutrients and energy from marine to terres-trial ecosystems. Ecology 81:2305–2313
Canuel EA, Cloern JE, Ringelberg DB, Guckert JB, Rau GH(1995) Molecular and isotopic tracers used to examinesources of organic matter and its incorporation into thefood webs of San Francisco Bay. Limnol Oceanogr 40:67–81
Chanton J, Lewis FG (2002) Examination of coupling betweenprimary and secondary production in a river-dominatedestuary. Limnol Oceanogr 47:683–697
Cifuentes LA, Sharp JH, Fogel ML (1988) Stable carbon andnitrogen isotope biogeochemistry in the Delaware estuary.Limnol Oceanogr 33:1102–1115
Coon D (1982) Primary productivity of macroalgae in NorthPacific America. In: Zaborsky OR (ed) CRC handbook ofbiosolar resources. CRC Press, Boca Raton, FL, p 447–454
Crawley KR, Hyndes GA, Vanderlift MA (2007) Variationamong diets in discrimination of δ13C and δ15N in theamphipod Allorchestes compressa. J Exp Mar Biol Ecol349:370–377
Deegan LA, Garritt RH (1997) Evidence for spatial variabilityin estuarine food webs. Mar Ecol Prog Ser 147:31–47
DeNiro MJ, Epstein S (1978) Influence of diet on the distribu-tion of carbon isotopes in animals. Geochim CosmochimActa 42:495–506
DeNiro MJ, Epstein S (1981) Influence of diet on the distribu-tion of nitrogen isotopes in animals. Geochim CosmochimActa 45:341–351
Duggins DO, Eckman JE (1997) Is kelp detritus a good foodfor suspension feeders? Effects of kelp species, age andsecondary metabolites. Mar Biol 128:489–495
Duggins DO, Simenstad CA, Estes JA (1989) Magnification ofsecondary production by kelp detritus in coastal marineecosystems. Science 245:170–173
Dunton KH, Schell DM (1987) Dependence of consumers onmacroalgal (Laminaria solidungula) carbon in an arctickelp community: δ13C evidence. Mar Biol 93:615–625
Eddins SGN (2001) Calculation of terrestrial inputs to particu-
late organic carbon in an anthropogenically impactedestuary in the southeastern United States. Water Air SoilPollut 127:227–241
Fredriksen S (2003) Food web studies in a Norwegian kelpforest based on stable isotope (δ13C and δ15N) analysis.Mar Ecol Prog Ser 260:71–81
Fry B (1996) 13C/12C fractionation by marine diatoms. MarEcol Prog Ser 134:283–294
Fry B (2002) Conservative mixing of stable isotopes acrossestuarine salinity gradients: a conceptual framework formonitoring watershed influences on downstream fisheriesproduction. Estuaries 25:264–271
Fry B, Sherr EB (1984) δ13C measurements as indicators ofcarbon flow in marine and freshwater ecosystems. ContribMar Sci 27:13–47
Gearing JN, Gearing PJ, Rudnick DT, Requjo AG, HuchinsMJ (1984) Isotopic variability of organic carbon in a phyto-plankton-based temperate estuary. Geochim CosmochimActa 48:1089–1098
Hsieh HL, Kao WY, Chen CP, Liu PJ (2000) Detrital flowsthrough the feeding pathway of the oyster (Crassostreagigas) in a tropical shallow lagoon: δ13C signals. Mar Biol136:677–684
Kaehler S, Pakhomov EA, McQuaid CD (2000) Trophic struc-ture of the marine food web at the Prince Edward Islands(Southern Ocean) determined by δ13C and δ15N analysis.Mar Ecol Prog Ser 208:13–20
Maberly SC, Raven JA, Johnston AM (1992) Discriminationbeween 12C and 13C by marine plants. Oecologia 91:481–492
Mann KH (1988) Production and use of detritus in variousfreshwater, estuarine, and coastal marine ecosystems.Limnol Oceanogr 33:910–930
Mann KH (2000) Ecology of coastal waters. Blackwell Sci-ence, Maldin, MA
McClelland JW, Valiela I (1998) Linking nitrogen in estuarineproducers to land-derived sources. Limnol Oceanogr 43:577–585
Minagawa M, Wada E (1984) Stepwise enrichment of 15Nalong food chains: further evidence and the relationbetween δ15N and animal age. Geochim Cosmochim Acta48:1135–1140
Norderhaug KM, Fredriksen S, Nygaard K (2003) Trophicimportance of Laminaria hyperborea to kelp forest con-sumers and the importance of bacterial degradation tofood quality. Mar Ecol Prog Ser 255:135–144
Otero MP, Siegel DA (2004) Spatial and temporal character-istics of sediment plumes and phytoplankton blooms inthe Santa Barbara Channel. Deep-Sea Res II 51:1129–1149
Page HM (1997) Importance of vascular plant and algal pro-duction to macro-invertebrate consumers in a southernCalifornia salt marsh. Estuar Coast Shelf Sci 45:823–834
Page HM, Lastra M (2003) Diet of intertidal bivalves in the Riade Arosa (NW Spain): evidence from stable C and N iso-tope analysis. Mar Biol 143:519–532
Page HM, Petty RL, Meade DE (1995) Influence of watershedrunoff on nutrient dynamics in a southern California saltmarsh. Estuar Coast Shelf Sci 41:163–180
Parsons TR, Maita Y, Lalli CM (1984) A manual of chemicaland biological methods for seawater analysis. PergamonPress, New York
Peterson BJ, Fry B (1987) Stable isotopes in ecosystem stud-ies. Annu Rev Ecol Syst 18:293–320
Phillips DL, Gregg JW (2003) Source partitioning using stableisotopes: coping with too many sources. Oecologia 136:261–269
61

Mar Ecol Prog Ser 360: 47–62, 2008
Polis GA, Anderson WB, Holt RD (1997) Toward an integra-tion of landscape and food web ecology: The dynamics ofspatially subsidized food webs. Annu Rev Ecol Syst 28:289–316
Raven JA, Johnston AM, Kubler, JE, Korb R and others (2002)Mechanistic interpretation of carbon isotope discrimina-tion by marine macroalgae and seagrasses. Funct PlantBiol 29:355–378
Reed DC, Kinlan BP, Raimondi P, Washburn L, Gaylord B,Drake P (2006) A metapopulation perspective on the patchdynamics of giant kelp in southern California. In: KritznerJP, Sale PF (eds) Marine metapopulations, Elsevier Acad-emic Press, San Diego, CA, p 353–386
Riera P, Richard P (1997) Temporal variation of δ13C in partic-ulate organic matter and oyster Crassostrea gigas inMarennes-Oleron Bay (France): effect of freshwaterinflow. Mar Ecol Prog Ser 147:105–115
Riera P, Stal LJ, Nieuwenhuize J (2000) Heavy δ15N in inter-tidal benthic algae and invertebrates in the Scheldt Estu-ary (The Netherlands): effect of river nitrogen inputs.Estuar Coast Shelf Sci 51:365–372
Roberts C, Andelman S, Branch G, Bustamante RH and others(2003) Ecological criteria for evaluating candidate sites formarine reserves. Ecol Appl 13(Suppl):S199–S214
Robinson T (2006) Catchment and subcatchment scale link-ages between land use and nutrient concentrations andfluxes in coastal California streams. PhD dissertation, Uni-versity of California, Santa Barbara, CA
Simenstad CA, Wissmar RC (1985) δ13C evidence of the ori-gins and fates of organic carbon in estuarine and near-shore food webs. Mar Ecol Prog Ser 22:141–152
Simenstad CA, Duggins DO, Quay PD (1993) High turnover ofinorganic carbon in kelp habitats as a cause of δ13C vari-ability in marine food webs. Mar Biol 116:147–160
Stephenson RL, Tan FC, Mann KH (1984) Stable isotope vari-ability in marine macrophytes and its implications for foodweb studies. Mar Biol 81:223–230
Stephenson RL, Tan FC, Mann KH (1986) Use of stable carbonisotope ratios to compare plant material and potential con-sumers in a seagrass bed and a kelp bed in Nova Scotia,Canada. Mar Ecol Prog Ser 30:1–7
Underwood AJ (1997) Experiments in ecology: their logicaldesign and interpretation using analysis of variance. Cam-bridge University Press, Cambridge
Valiela I, Bowen JL, Cole ML, Kroeger KD and others (2001)Following up on a Margalevian concept: interactions andexchanges among adjacent parcels of coastal landscapes.Sci Mar 65:215–229 Suppl
Vanderklift MA, Ponsard S (2003) Sources of variation in con-sumer-diet δ15N enrichment: a meta-analysis. Oecologia136:169–182
Williams P (1981) Detritus utilization by Mytilus edulis. EstuarCoast Shelf Sci 12:739–746
Womersley HBS (1954) The species of Macrocystis with spe-cial reference to those on southern Australia coasts. UnivCalif Publ Bot 27:109–132
62
Editorial responsibility: Otto Kinne,Oldendorf/Luhe, Germany
Submitted: May 10, 2007; Accepted: December 19, 2007Proofs received from author(s): May 12, 2008